

The Role of NCS1 in Immunotherapy and Prognosis of Human Cancer
 and
and 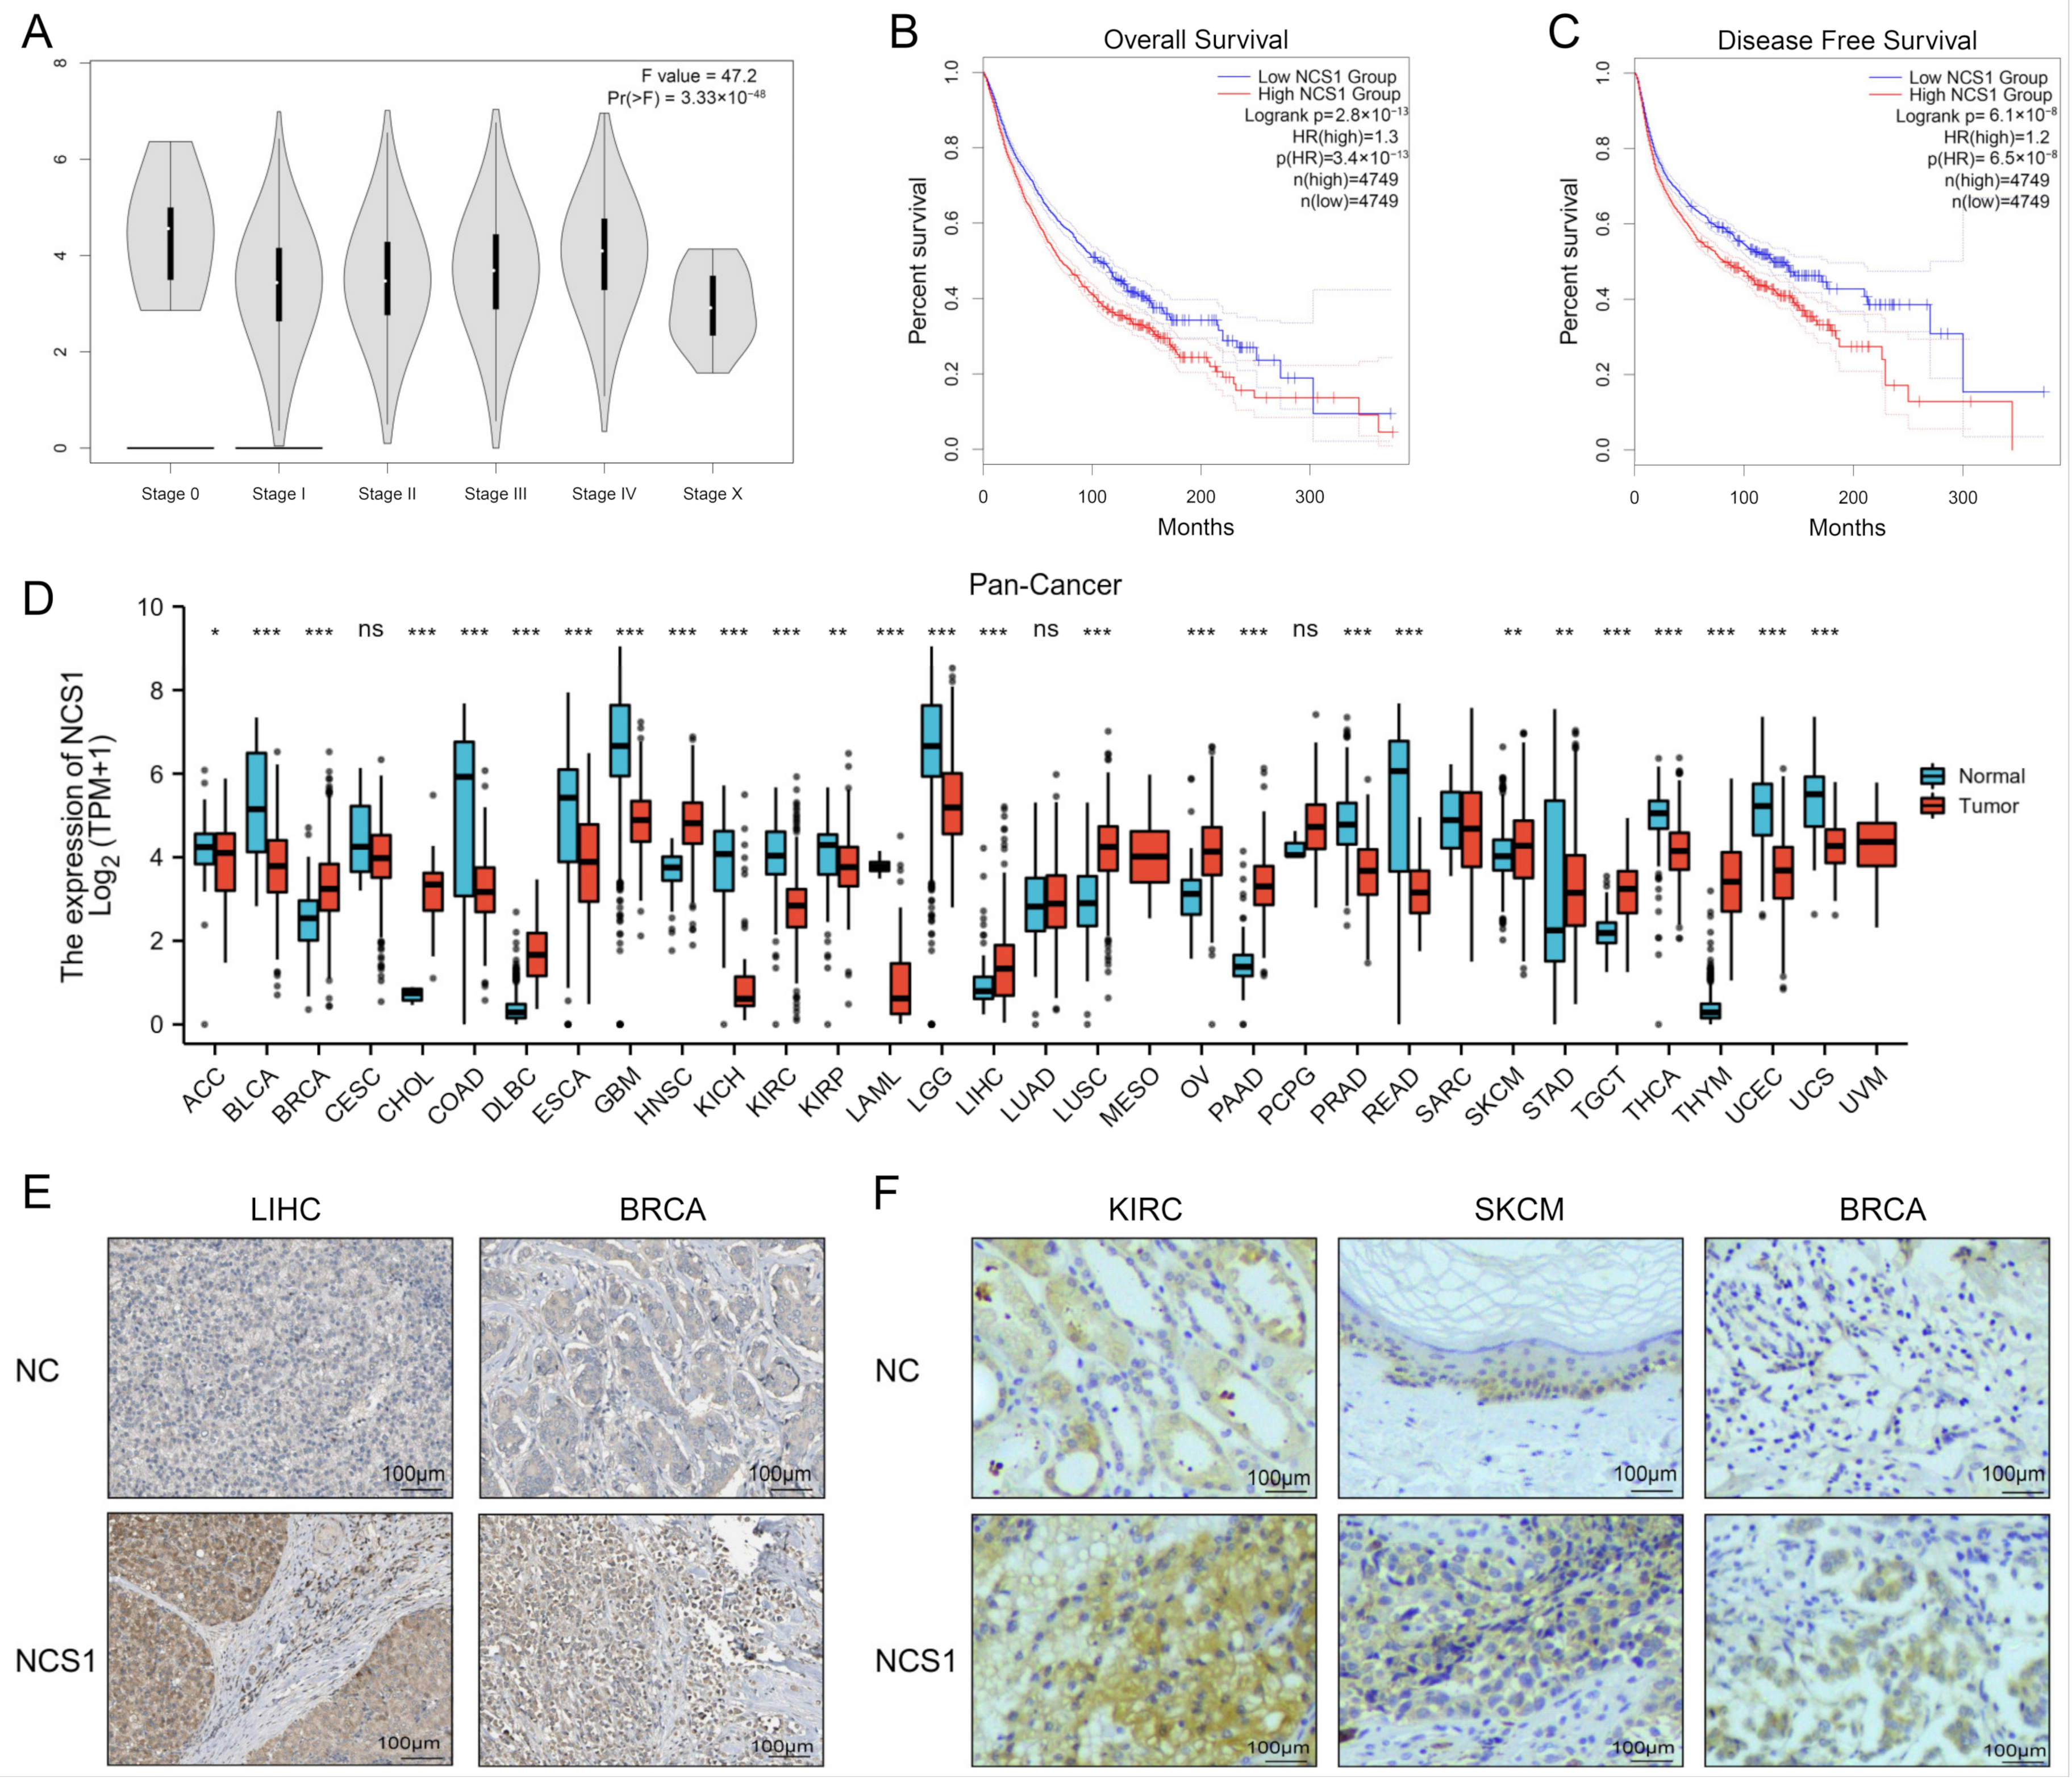
Abstract
:1. Introduction
2. Materials and Methods
2.1. Data Collection
2.2. Evaluate NCS1 Expression Level and the Degree of DNA Methylation
2.3. Evaluate NCS1 and Immune Infiltration
2.4. Association between NCS1 and Immunotherapy
2.5. Relationship between NCS1 and Prognosis of Tumor Patients
2.6. NCS1-Related Gene Enrichment Analysis
2.7. The Structure of NCS1 and Screening of Therapeutic Drugs
2.8. Statistical Analysis
3. Results
3.1. The Landscape of NCS1 Status in Pan-Cancer
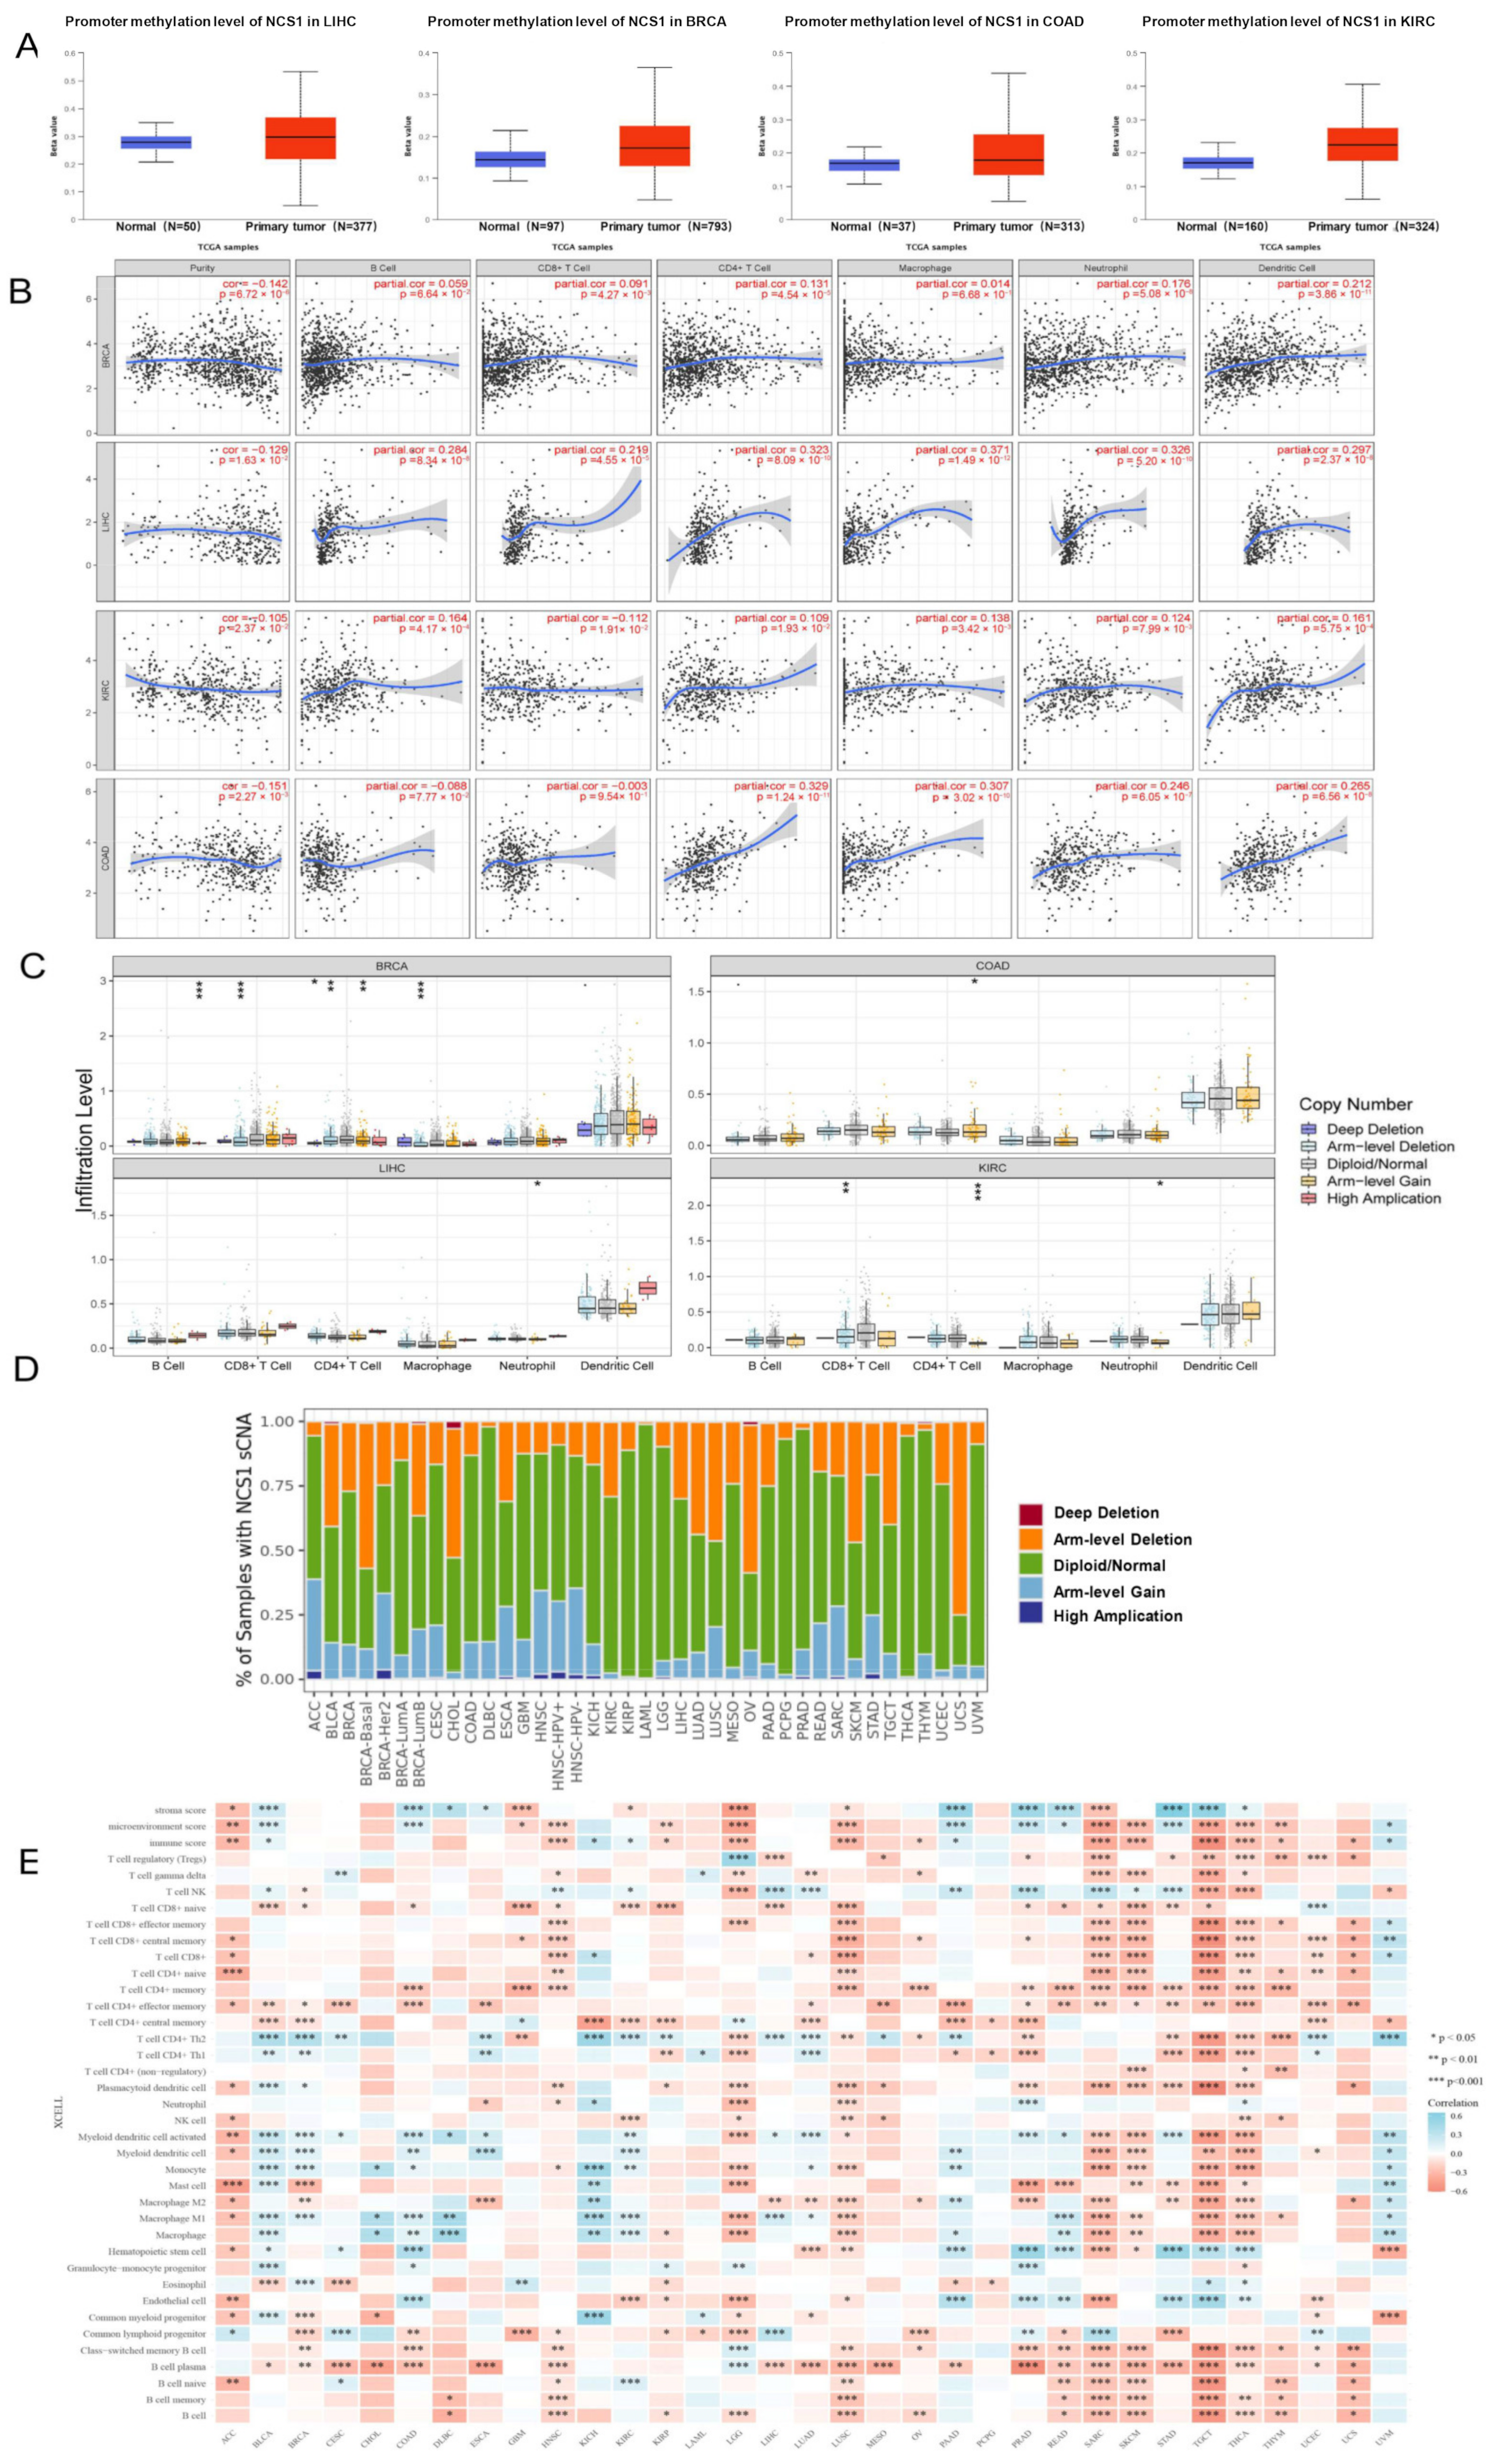
3.2. The Degree of DNA Methylation and Tumor–Immune Interaction of NCS1 in Pan-Cancer
3.3. Correlation between NCS1 and Tumor Immunogenicity in Pan-Cancer
3.4. There was a Significant Correlation between NCS1 Expression and Survival Rate
3.5. GO/KEGG Enrichment Analysis of NCS1 and NCS1 Similar Genes
4. Discussion
Limitations of the Study
5. Conclusions
Supplementary Materials
Author Contributions
Funding
Institutional Review Board Statement
Informed Consent Statement
Data Availability Statement
Acknowledgments
Conflicts of Interest
References
- Rizvi, N.A.; Hellmann, M.D.; Snyder, A.; Kvistborg, P.; Makarov, V.; Havel, J.J.; Lee, W.; Yuan, J.; Wong, P.; Ho, T.S. Cancer immunology. Mutational landscape determines sensitivity to PD-1 blockade in non-small cell lung cancer. Science 2015, 348, 124–128. [Google Scholar] [CrossRef] [PubMed]
- Bresnick, A.R.; Weber, D.J.; Zimmer, D.B. S100 proteins in cancer. Nat. Rev. Cancer 2015, 15, 96–109. [Google Scholar] [CrossRef] [PubMed]
- Heidarsson, P.O.; Otazo, M.R.; Bellucci, L.; Mossa, A.; Imparato, A.; Paci, E.; Corni, S.; Di Felice, R.; Kragelund, B.B.; Cecconi, C. Single-molecule folding mechanism of an EF-Hand Neuronal Calcium Sensor. Structure 2013, 21, 1812–1821. [Google Scholar] [CrossRef] [PubMed]
- Grosshans, H.K.; Fischer, T.T.; Steinle, J.A.; Brill, A.L.; Ehrlich, B.E. Neuronal Calcium Sensor 1 is up-regulated in response to stress to promote cell survival and motility in cancer cells. Mol. Oncol. 2020, 14, 1134–1151. [Google Scholar] [CrossRef] [PubMed]
- Schlecker, C.; Boehmerle, W.; Jeromin, A.; DeGray, B.; Varshney, A.; Sharma, Y.; Szigeti-Buck, K.; Ehrlich, B.E. Neuronal calcium sensor-1 enhancement of InsP3 receptor activity is inhibited by therapeutic levels of lithium. J. Clin. Investig. 2006, 116, 1668–1674. [Google Scholar] [CrossRef]
- Piton, A.; Michaud, J.L.; Peng, M.; Aradhya, S.; Gauthier, J.; Mottron, L.; Champagne, N.; Lafreniere, R.G.; Hamsad, F.F.; S2D Team; et al. Mutations in the calcium-related gene IL1RAPL1 are associated with autism. Hum. Mol. Genet. 2008, 17, 3965–3974. [Google Scholar] [CrossRef]
- Guedan, S.; Chen, X.; Madar, A.; Carpenito, C.; McGettigan, S.E.; Frigault, M.J.; Lee, J.; Posey, A.D.; Scholler, J.; Scholler, N.; et al. ICOS-based chimeric antigen receptors program bipolar TH17/TH1 cells. Blood 2014, 124, 1070–1080. [Google Scholar] [CrossRef] [PubMed]
- Stewart, T.A.; Yapa, K.T.; Monteith, G.R. Altered calcium signaling in cancer cells. Biochim. Biophys. Acta Biomembr. 2015, 1848, 2502–2511. [Google Scholar] [CrossRef]
- Kranc, W.; Brązert, M.; Budna, J.; Celichowski, P.; Bryja, A.; Nawrocki, M.J.; Ożegowska, K.; Jankowski, M.; Chermuła, B.; Dyszkiewicz-Konwińska, M.; et al. Genes responsible for proliferation, differentiation, and junction adhesion are significantly up-regulated in human ovarian granulosa cells during a long-term primary in vitro culture. Histochem. Cell Biol. 2019, 151, 125–143. [Google Scholar] [CrossRef] [PubMed]
- Moore, L.M.; England, A.; Ehrlich, B.E.; Rimm, D.L. Calcium Sensor, NCS-1, Promotes Tumor Aggressiveness and Predicts Patient Survival. Mol. Cancer Res. 2017, 15, 942–952. [Google Scholar] [CrossRef] [PubMed]
- Uchida, A.; Seki, N.; Mizuno, K.; Misono, S.; Yamada, Y.; Kikkawa, N.; Sanada, H.; Kumamoto, T.; Suetsugu, T.; Inoue, H. Involvement of dual-strand of the miR-144 duplex and their targets in the pathogenesis of lung squamous cell carcinoma. Cancer Sci. 2019, 110, 420–432. [Google Scholar] [CrossRef] [PubMed]
- Yukinaga, H.; Shionyu, C.; Hirata, E.; Ui-Tei, K.; Nagashima, T.; Kondo, S.; Okada-Hatakeyama, M.; Naoki, H.; Matsuda, M. Fluctuation of Rac1 activity is associated with the phenotypic and transcriptional heterogeneity of glioma cells. J. Cell Sci. 2014, 127, 1805–1815. [Google Scholar] [CrossRef]
- McAndrew, D.; Grice, D.M.; Peters, A.A.; Davis, F.M.; Stewart, T.; Rice, M.; Smart, C.E.; Brown, M.A.; Kenny, P.A.; Roberts-Thomson, S.J.; et al. ORAI1-mediated calcium influx in lactation and in breast cancer. Mol. Cancer Ther. 2011, 10, 448–460. [Google Scholar] [CrossRef]
- Le, D.T.; Durham, J.N.; Smith, K.N.; Wang, H.; Bartlett, B.R.; Aulakh, L.K.; Lu, S.; Kemberling, H.; Wilt, C.; Luber, B.S.; et al. Mismatch repair deficiency predicts response of solid tumors to PD-1 blockade. Science 2017, 357, 409–413. [Google Scholar] [CrossRef]
- Morad, G.; Helmink, B.A.; Sharma, P.; Wargo, J.A. Hallmarks of response, resistance, and toxicity to immune checkpoint blockade. Cell 2021, 184, 5309–5337. [Google Scholar] [CrossRef] [PubMed]
- Vivian, J.; Rao, A.A.; Nothaft, F.A.; Ketchum, C.; Armstrong, J.; Novak, A.; Pfeil, J.; Narkizian, J.; Deran, A.D.; Musselman-Brown, A.; et al. Toil enables reproducible, open source, big biomedical data analyses. Nat. Biotechnol. 2017, 35, 314–316. [Google Scholar] [CrossRef] [PubMed]
- Zhang, X.; Lv, Q.-L.; Huang, Y.-T.; Zhang, L.-H.; Zhou, H.-H. Akt/FoxM1 signaling pathway-mediated upregulation of MYBL2 promotes progression of human glioma. J. Exp. Clin. Cancer Res. CR 2017, 36, 105. [Google Scholar] [CrossRef] [PubMed]
- Li, C.; Tang, Z.; Zhang, W.; Ye, Z.; Liu, F. GEPIA2021: Integrating multiple deconvolution-based analysis into GEPIA. Nucleic Acids Res. 2021, 49, W242–W246. [Google Scholar] [CrossRef] [PubMed]
- Tang, Z.; Li, C.; Kang, B.; Gao, G.; Li, C.; Zhang, Z. GEPIA: A web server for cancer and normal gene expression profiling and interactive analyses. Nucleic Acids Res. 2017, 45, W98–W102. [Google Scholar] [CrossRef] [PubMed]
- Frid, M.G.; McKeon, B.A.; Thurman, J.M.; Maron, B.A.; Li, M.; Zhang, H.; Kumar, S.; Sullivan, T.; Laskowsky, J.; Fini, M.A.; et al. Immunoglobulin-driven Complement Activation Regulates Proinflammatory Remodeling in Pulmonary Hypertension. Am. J. Respir. Crit. Care Med. 2020, 201, 224–239. [Google Scholar] [CrossRef] [PubMed]
- Colwill, K.; Renewable Protein Binder Working Group; Gräslund, S. A roadmap to generate renewable protein binders to the human proteome. Nat. Methods 2011, 8, 551–558. [Google Scholar] [CrossRef] [PubMed]
- Chandrashekar, D.S.; Bashel, B.; Balasubramanya, S.A.H.; Creighton, C.J.; Ponce-Rodriguez, I.; Chakravarthi, B.V.S.K.; Varambally, S. UALCAN: A portal for facilitating tumor subgroup gene expression and survival analyses. Neoplasia 2017, 19, 649–658. [Google Scholar] [CrossRef] [PubMed]
- Li, T.; Fan, T.; Wang, B.; Traught, W.; Chen, Q.; Liu, J.S.; Li, B.; Liu, X.S. TIMER: A Web Server for Comprehensive Analysis of Tumor-Infiltrating Immune Cells. Cancer Res. 2017, 77, e108–e110. [Google Scholar] [CrossRef] [PubMed]
- Cerami, E.; Gao, J.; Dogrusoz, U.; Gross, B.E.; Sumer, S.O.; Aksoy, B.A.; Jacobsen, A.; Byrne, C.J.; Heuer, M.L.; Larsson, E.; et al. The cBio cancer genomics portal: An open platform for exploring multidimensional cancer genomics data. Cancer Discov. 2012, 2, 401–404. [Google Scholar] [CrossRef]
- Ru, B.; Wong, C.N.; Tong, Y.; Zhong, J.Y.; Zhong, S.S.W.; Wu, W.C.; Chu, K.C.; Wong, C.Y.; Lau, C.Y.; Chen, I.; et al. TISIDB: An integrated repository portal for tumor–immune system interactions. Bioinformatics 2019, 35, 4200–4202. [Google Scholar] [CrossRef] [PubMed]
- Jiang, P.; Gu, S.; Pan, D.; Fu, J.; Sahu, A.; Hu, X.; Li, Z.; Traugh, N.; Bu, X.; Li, B.; et al. Signatures of T cell dysfunction and exclusion predict cancer immunotherapy response. Nat. Med. 2018, 24, 1550–1558. [Google Scholar] [CrossRef] [PubMed]
- Zhou, Y.; Zhou, B.; Pache, L.; Chang, M.; Khodabakhshi, A.H.; Tanaseichuk, O.; Benner, C.; Chanda, S.K. Metascape provides a biologist-oriented resource for the analysis of systems-level datasets. Nat. Commun. 2019, 10, 1523. [Google Scholar] [CrossRef] [PubMed]
- Huang, B.; Han, W.; Sheng, Z.-F.; Shen, G.-L. Identification of immune-related biomarkers associated with tumorigenesis and prognosis in cutaneous melanoma patients. Cancer Cell Int. 2020, 20, 1–15. [Google Scholar] [CrossRef] [PubMed]
- Pan, J.-B.; Hu, S.-C.; Shi, D.; Cai, M.-C.; Li, Y.-B.; Zou, Q.; Ji, Z.-L. PaGenBase: A pattern gene database for the global and dynamic understanding of gene function. PLoS ONE 2013, 8, e80747. [Google Scholar] [CrossRef]
- Pinero, J.; Bravo, A.; Queralt-Rosinach, N.; Gutierrez-Sacristian, A.; Deu-Pons, J.; Centero, D.; Garcia-Garcia, J.; Sanz, F.; Furlong, L.I. DisGeNET: A comprehensive platform integrating information on human disease-associated genes and var-iants. Nucleic Acids Res 2017, 45, D833–D839. [Google Scholar] [CrossRef] [PubMed]
- Song, Y.; Westerhuis, J.A.; Aben, N.; Michaut, M.; Wessels, L.F.A.; Smilde, A.K. Principal component analysis of binary genomics data. Briefings Bioinform. 2019, 20, 317–329. [Google Scholar] [CrossRef] [PubMed]
- Choi, A.; Jang, I.; Han, H.; Kim, M.-S.; Choi, J.; Lee, J.; Cho, S.-Y.; Jun, Y.; Lee, C.; Kim, J.; et al. iCSDB: An integrated database of CRISPR screens. Nucleic Acids Res. 2021, 49, D956–D961. [Google Scholar] [CrossRef]
- Wishart, D.S.; Feunang, Y.D.; Guo, A.C.; Lo, E.J.; Marcu, A.; Grant, J.R.; Sajed, T.; Johnson, D.; Li, C.; Sayeeda, Z.; et al. DrugBank 5.0: A major update to the DrugBank database for 2018. Nucleic Acids Res. 2018, 46, D1074–D1082. [Google Scholar] [CrossRef] [PubMed]
- Huddart, R.; Whirl-Carrillo, M.; Altman, R.B.; Klein, T.E. PharmGKB Tutorial for Pharmacogenomics of Drugs Potentially Used in the Context of COVID-19. Clin. Pharmacol. Ther. 2021, 109, 116–122. [Google Scholar] [CrossRef]
- Mendez, D.; Gaulton, A.; Bento, A.P.; Chambers, J.; de Veij, M.; Félix, E.; Magariños, M.P.; Mosquera, J.F.; Mutowo, P.; Nowotka, M.; et al. ChEMBL: Towards direct deposition of bioassay data. Nucleic Acids Res. 2019, 47, D930–D940. [Google Scholar] [CrossRef] [PubMed]
- Tannock, I.F.; Hickman, J.A. Limits to Personalized Cancer Medicine. N. Engl. J. Med. 2016, 375, 1289–1294. [Google Scholar] [CrossRef]
- Shi, B.; Ding, J.; Qi, J.; Gu, Z. Characteristics and prognostic value of potential dependency genes in clear cell renal cell carcinoma based on a large-scale CRISPR-Cas9 and RNAi screening database DepMap. Int. J. Med Sci. 2021, 18, 2063–2075. [Google Scholar] [CrossRef] [PubMed]
- Zack, T.I.; Schumacher, S.E.; Carter, S.L.; Cherniack, A.D.; Saksena, G.; Tabak, B.; Lawrence, M.S.; Zhang, C.Z.; Wala, J.; Mermel, C.H.; et al. Pan-cancer patterns of somatic copy number alteration. Nat. Genet. 2013, 45, 1134–1140. [Google Scholar] [CrossRef] [PubMed]
- Walther, A.; Johnstone, E.; Swanton, C.; Midgley, R.; Tomlinson, I.; Kerr, D. Genetic prognostic and predictive markers in colorectal cancer. Nat. Rev. Cancer 2009, 9, 489–499. [Google Scholar] [CrossRef]
- Guinney, J.; Dientmann, J.; Wang, X.; de Reyneis, A.; Schlincker, A.; Soneson, G.; Marisa, L.; Roepman, P.; Nyamundanda, G.; Angelino, G.; et al. The consensus molecular subtypes of colorectal cancer. Nat. Med. 2015, 21, 1350–1356. [Google Scholar] [CrossRef]
- Zhang, Q.; Huang, R.; Hu, H.; Yu, L.; Tang, Q.; Tao, Y.; Liu, Z.; Li, J.; Wang, G. Integrative Analysis of Hypoxia-Associated Signature in Pan-Cancer. iScience 2020, 23, 101460. [Google Scholar] [CrossRef]
- Hu, F.-F.; Liu, C.-J.; Liu, L.-L.; Zhang, Q.; Guo, A.-Y. Expression profile of immune checkpoint genes and their roles in predicting immunotherapy response. Briefings Bioinform. 2021, 22, bbaa176. [Google Scholar] [CrossRef] [PubMed]
- Yarchoan, M.; Hopkins, A.; Jaffee, E.M. Tumor Mutational Burden and Response Rate to PD-1 Inhibition. N. Engl. J. Med. 2017, 377, 2500–2501. [Google Scholar] [CrossRef] [PubMed]
- Bonneville, R.; Krook, M.A.; Kautto, E.A.; Miya, J.; Wing, M.R.; Chen, H.-Z.; Reeser, J.W.; Yu, L.; Roychowdhury, S. Landscape of Microsatellite Instability Across 39 Cancer Types. JCO Precis. Oncol. 2019, 2017, 1–15. [Google Scholar] [CrossRef] [PubMed]
- Ju, M.; Bi, J.; Wei, Q.; Jiang, L.; Guan, Q.; Zhang, M.; Song, X.; Chen, T.; Fan, J.; Li, X.; et al. Pan-cancer analysis of NLRP3 inflammasome with potential implications in prognosis and immunotherapy in human cancer. Briefings Bioinform. 2021, 22, bbaa345. [Google Scholar] [CrossRef] [PubMed]
- Szklarczyk, D.; Gable, A.L.; Lyon, D.; Junge, A.; Wyder, S.; Huerta-Cepas, J.; Simonovic, M.; Doncheva, N.T.; Morris, H.J.; Bork, P.; et al. STRING v11: Protein-protein association networks with increased coverage, supporting functional discovery in genome-wide experimental datasets. Nucleic Acids Res 2019, 47, D607–D613. [Google Scholar] [CrossRef]
- Li, T.; Wernersson, R.; Hansen, R.B.; Horn, H.; Mercer, J.; Slodkowicz, G.; Workman, C.T.; Rigina, O.; Rapacki, K.; Stærfeldt, H.H.; et al. A scored human protein–protein interaction network to catalyze genomic interpretation. Nat. Methods 2017, 14, 61–64. [Google Scholar] [CrossRef]
- Subramanian, A.; Tamayo, P.; Mootha, V.K.; Mukherjee, S.; Ebert, B.L.; Gillette, M.A.; Paulovich, A.; Pomeroy, S.L.; Golub, T.R.; Lander, E.S.; et al. Gene set enrichment analysis: A knowledge-based approach for interpreting genome-wide expression profiles. Proc. Natl. Acad. Sci. USA 2005, 102, 15545–15550. [Google Scholar] [CrossRef] [PubMed]
- Liang, W.; Gua, W.; Chen, R.; Wei, W.; Li, J.; Xu, K.; Li, C.; Ai, Q.; Lu, W.; Liang, H.; et al. Cancer patients in SARS-CoV-2 infection: A nationwide analysis in China. Lancet Oncol. 2020, 21, 335–337. [Google Scholar] [CrossRef]
- Roberts-Thomson, S.J.; Chalmers, S.B.; Monteith, G.R. The Calcium-Signaling Toolkit in Cancer: Remodeling and Targeting. Cold Spring Harb. Perspect. Biol. 2019, 11, a035204. [Google Scholar] [CrossRef] [PubMed]
- Marchi, S.; Giorgi, C.; Galluzzi, L.; Pinton, P. Ca2+ Fluxes and Cancer. Mol. Cell 2020, 78, 1055–1069. [Google Scholar] [CrossRef]
- Nakamura, T.Y.; Jeromin, A.; Mikoshiba, K. Neuronal calcium sensor-1 promotes immature heart function and hypertrophy by enhancing Ca2+ signals. Circ. Res. 2011, 109, 512–523. [Google Scholar] [CrossRef]
- Davuluri, R.V.; Suzuki, Y.; Sugano, S.; Plass, C.; Huang, T.H.-M. The functional consequences of alternative promoter use in mammalian genomes. Trends Genet. 2008, 24, 167–177. [Google Scholar] [CrossRef] [PubMed]
- Ferrara, G.; Leone, I.; Wiesner, T.; Lee, W.; Obenauf, C.P.; Ran, L.; Murali, R.; Zhang, Q.F.; Wong, E.W.P.; Hu, W.; et al. Faculty Opinions recommendation of Alternative transcription initiation leads to expression of a novel ALK isoform in cancer. Nature 2015, 526, 453–457. [Google Scholar] [CrossRef]
- Li, S.; Hu, Z.; Zhao, Y.; Huang, S.; He, X. Transcriptome-Wide Analysis Reveals the Landscape of Aberrant Alternative Splicing Events in Liver Cancer. Hepatology 2019, 69, 359–375. [Google Scholar] [CrossRef] [PubMed]
- Sebestyen, E.; Zawisza, M.; Eyras, E. Detection of recurrent alternative splicing switches in tumor samples reveals novel signatures of cancer. Nucleic Acids Res. 2015, 43, 1345–1356. [Google Scholar] [CrossRef] [PubMed]
- Vitting-Seerup, K.; Sandelin, A. The Landscape of Isoform Switches in Human Cancers. Mol. Cancer Res. 2017, 15, 1206–1220. [Google Scholar] [CrossRef] [PubMed]
- Yang, X.; Gao, L.; Zhang, S. Comparative pan-cancer DNA methylation analysis reveals cancer common and specific patterns. Briefings Bioinform. 2017, 18, 761–773. [Google Scholar] [CrossRef]
- Stegh, A.H. Targeting the p53 signaling pathway in cancer therapy—the promises, challenges and perils. Expert Opin. Ther. Targets 2012, 16, 67–83. [Google Scholar] [CrossRef]
- Taube, J.M.; Galon, J.; Sholl, L.M.; Rodig, S.J.; Cottrell, T.R.; Giraldo, N.A.; Baras, A.S.; Patel, S.S.; Anders, R.A.; Rimm, D.L.; et al. Implications of the tumor immune microenvironment for staging and therapeutics. Mod. Pathol. 2018, 31, 214–234. [Google Scholar] [CrossRef]
- Azimi, F.; Scolyer, R.A.; Rumcheva, P.; Moncrieff, M.; Murali, R.; McCarthy, S.W.; Saw, R.P.; Thompson, J.F. Tumor-infiltrating lymphocyte grade is an independent predictor of sentinel lymph node status and survival in patients with cutaneous melanoma. J. Clin. Oncol. Off. J. Am. Soc. Clin. Oncol. 2012, 30, 2678–2683. [Google Scholar] [CrossRef] [PubMed]
- Gajewski, T.F.; Schreiber, H.; Fu, Y.-X. Innate and adaptive immune cells in the tumor microenvironment. Nat. Immunol. 2013, 14, 1014–1022. [Google Scholar] [CrossRef] [PubMed]
- Lobo, J.; Barros-Silva, D.; Henrique, R.; Jerónimo, C. The Emerging Role of Epitranscriptomics in Cancer: Focus on Urological Tumors. Genes 2018, 9, 552. [Google Scholar] [CrossRef]
- Robbins, P.F.; Lu, Y.-C.; El-Gamil, M.; Lim, Y.F.; Gross, C.; Gartner, J.; Lin, J.C.; Teer, J.K.; Cliften, P.; Tycksen, E.; et al. Mining exomic sequencing data to identify mutated antigens recognized by adoptively transferred tu-mor-reactive T cells. Nat. Med. 2013, 19, 747–752. [Google Scholar] [CrossRef] [PubMed]
- Simmons, K.J.; Jackson, S.M.; Brueckner, F.; Patching, S.G.; Beckstein, O.; Ivanova, E.; Geng, T.; Weyand, S.; Drew, D.; Lanigan, J.; et al. Molecular mechanism of ligand recognition by membrane transport protein, Mhp1. EMBO J. 2014, 33, 1831–1844. [Google Scholar] [CrossRef] [PubMed]


Disclaimer/Publisher’s Note: The statements, opinions and data contained in all publications are solely those of the individual author(s) and contributor(s) and not of MDPI and/or the editor(s). MDPI and/or the editor(s) disclaim responsibility for any injury to people or property resulting from any ideas, methods, instructions or products referred to in the content. |
© 2023 by the authors. Licensee MDPI, Basel, Switzerland. This article is an open access article distributed under the terms and conditions of the Creative Commons Attribution (CC BY) license (https://creativecommons.org/licenses/by/4.0/).
Share and Cite
Wang, G.-C.; Gan, X.; Zeng, Y.-Q.; Chen, X.; Kang, H.; Huang, S.-W.; Hu, W.-H. The Role of NCS1 in Immunotherapy and Prognosis of Human Cancer. Biomedicines 2023, 11, 2765. https://doi.org/10.3390/biomedicines11102765
Wang G-C, Gan X, Zeng Y-Q, Chen X, Kang H, Huang S-W, Hu W-H. The Role of NCS1 in Immunotherapy and Prognosis of Human Cancer. Biomedicines. 2023; 11(10):2765. https://doi.org/10.3390/biomedicines11102765
Chicago/Turabian StyleWang, Gen-Chun, Xin Gan, Yun-Qian Zeng, Xin Chen, Hao Kang, Shuai-Wen Huang, and Wei-Hua Hu. 2023. "The Role of NCS1 in Immunotherapy and Prognosis of Human Cancer" Biomedicines 11, no. 10: 2765. https://doi.org/10.3390/biomedicines11102765