
Alveolar Nitric Oxide in Chronic Obstructive Pulmonary Disease—A Two-Year Follow-Up
 , , ,
, , ,
Abstract
:1. Introduction
2. Materials and Method
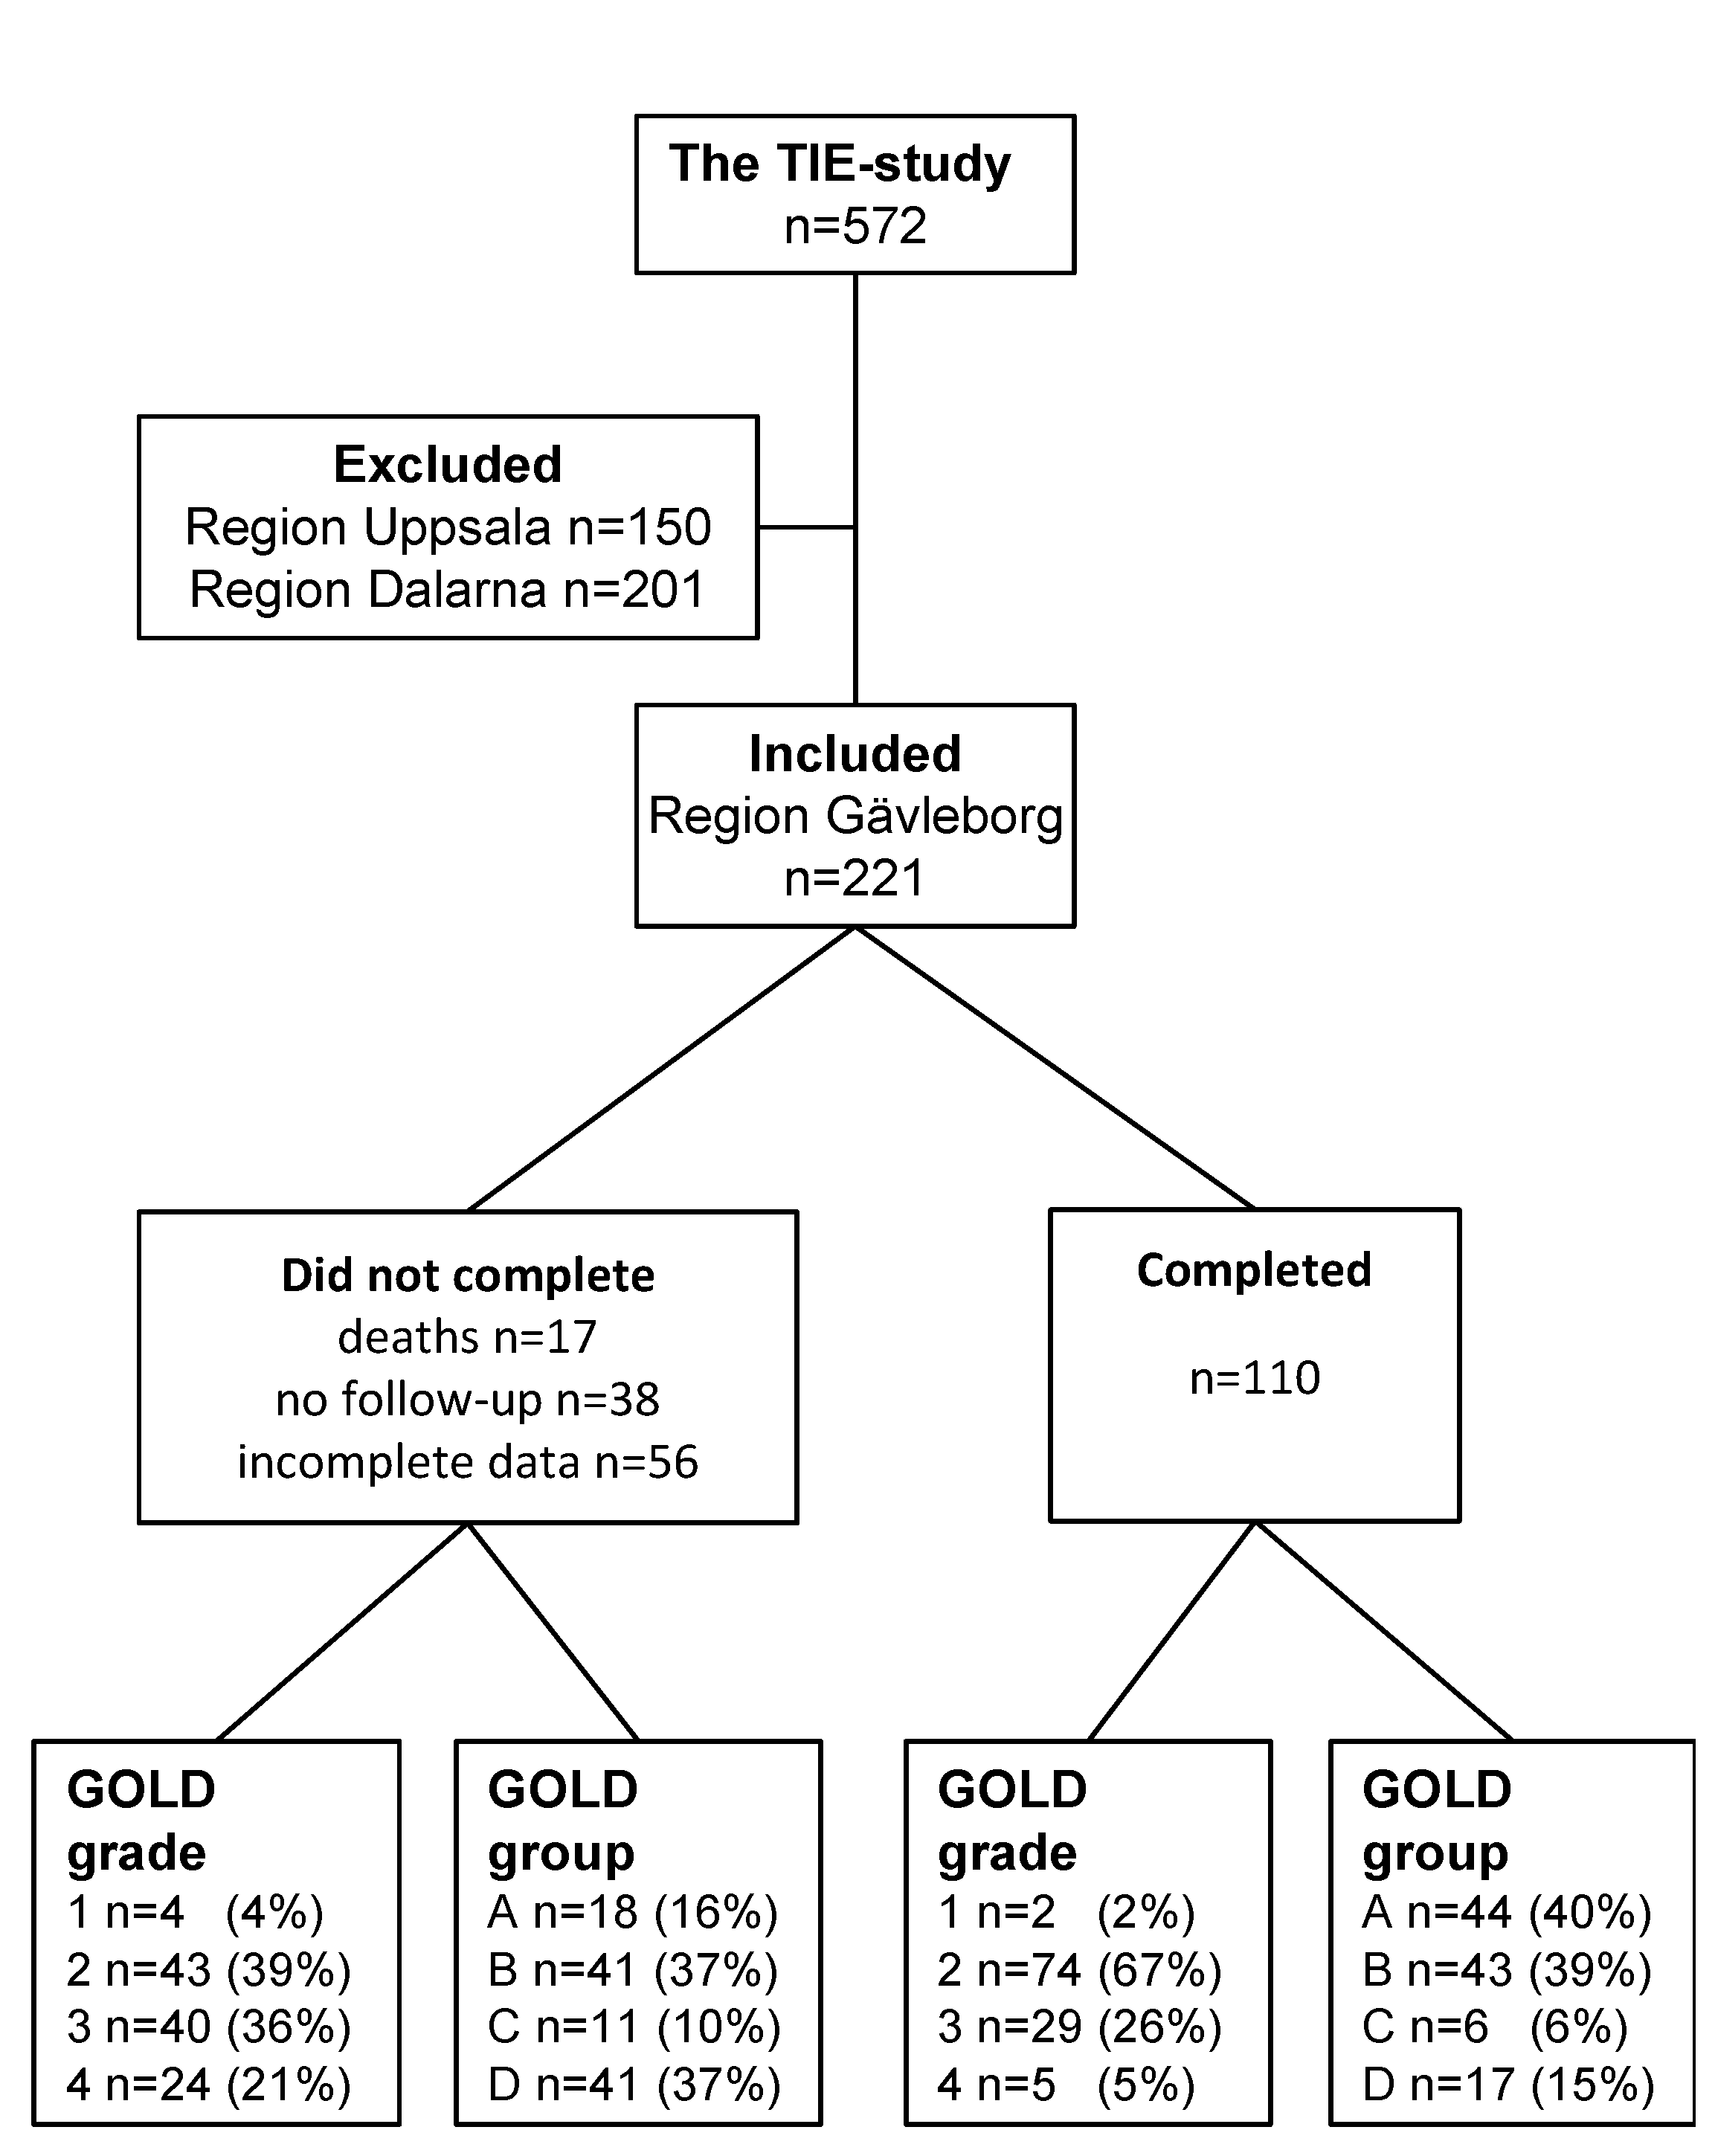
2.1. Study Design and Subjects
2.2. Methods
2.3. Data Analysis
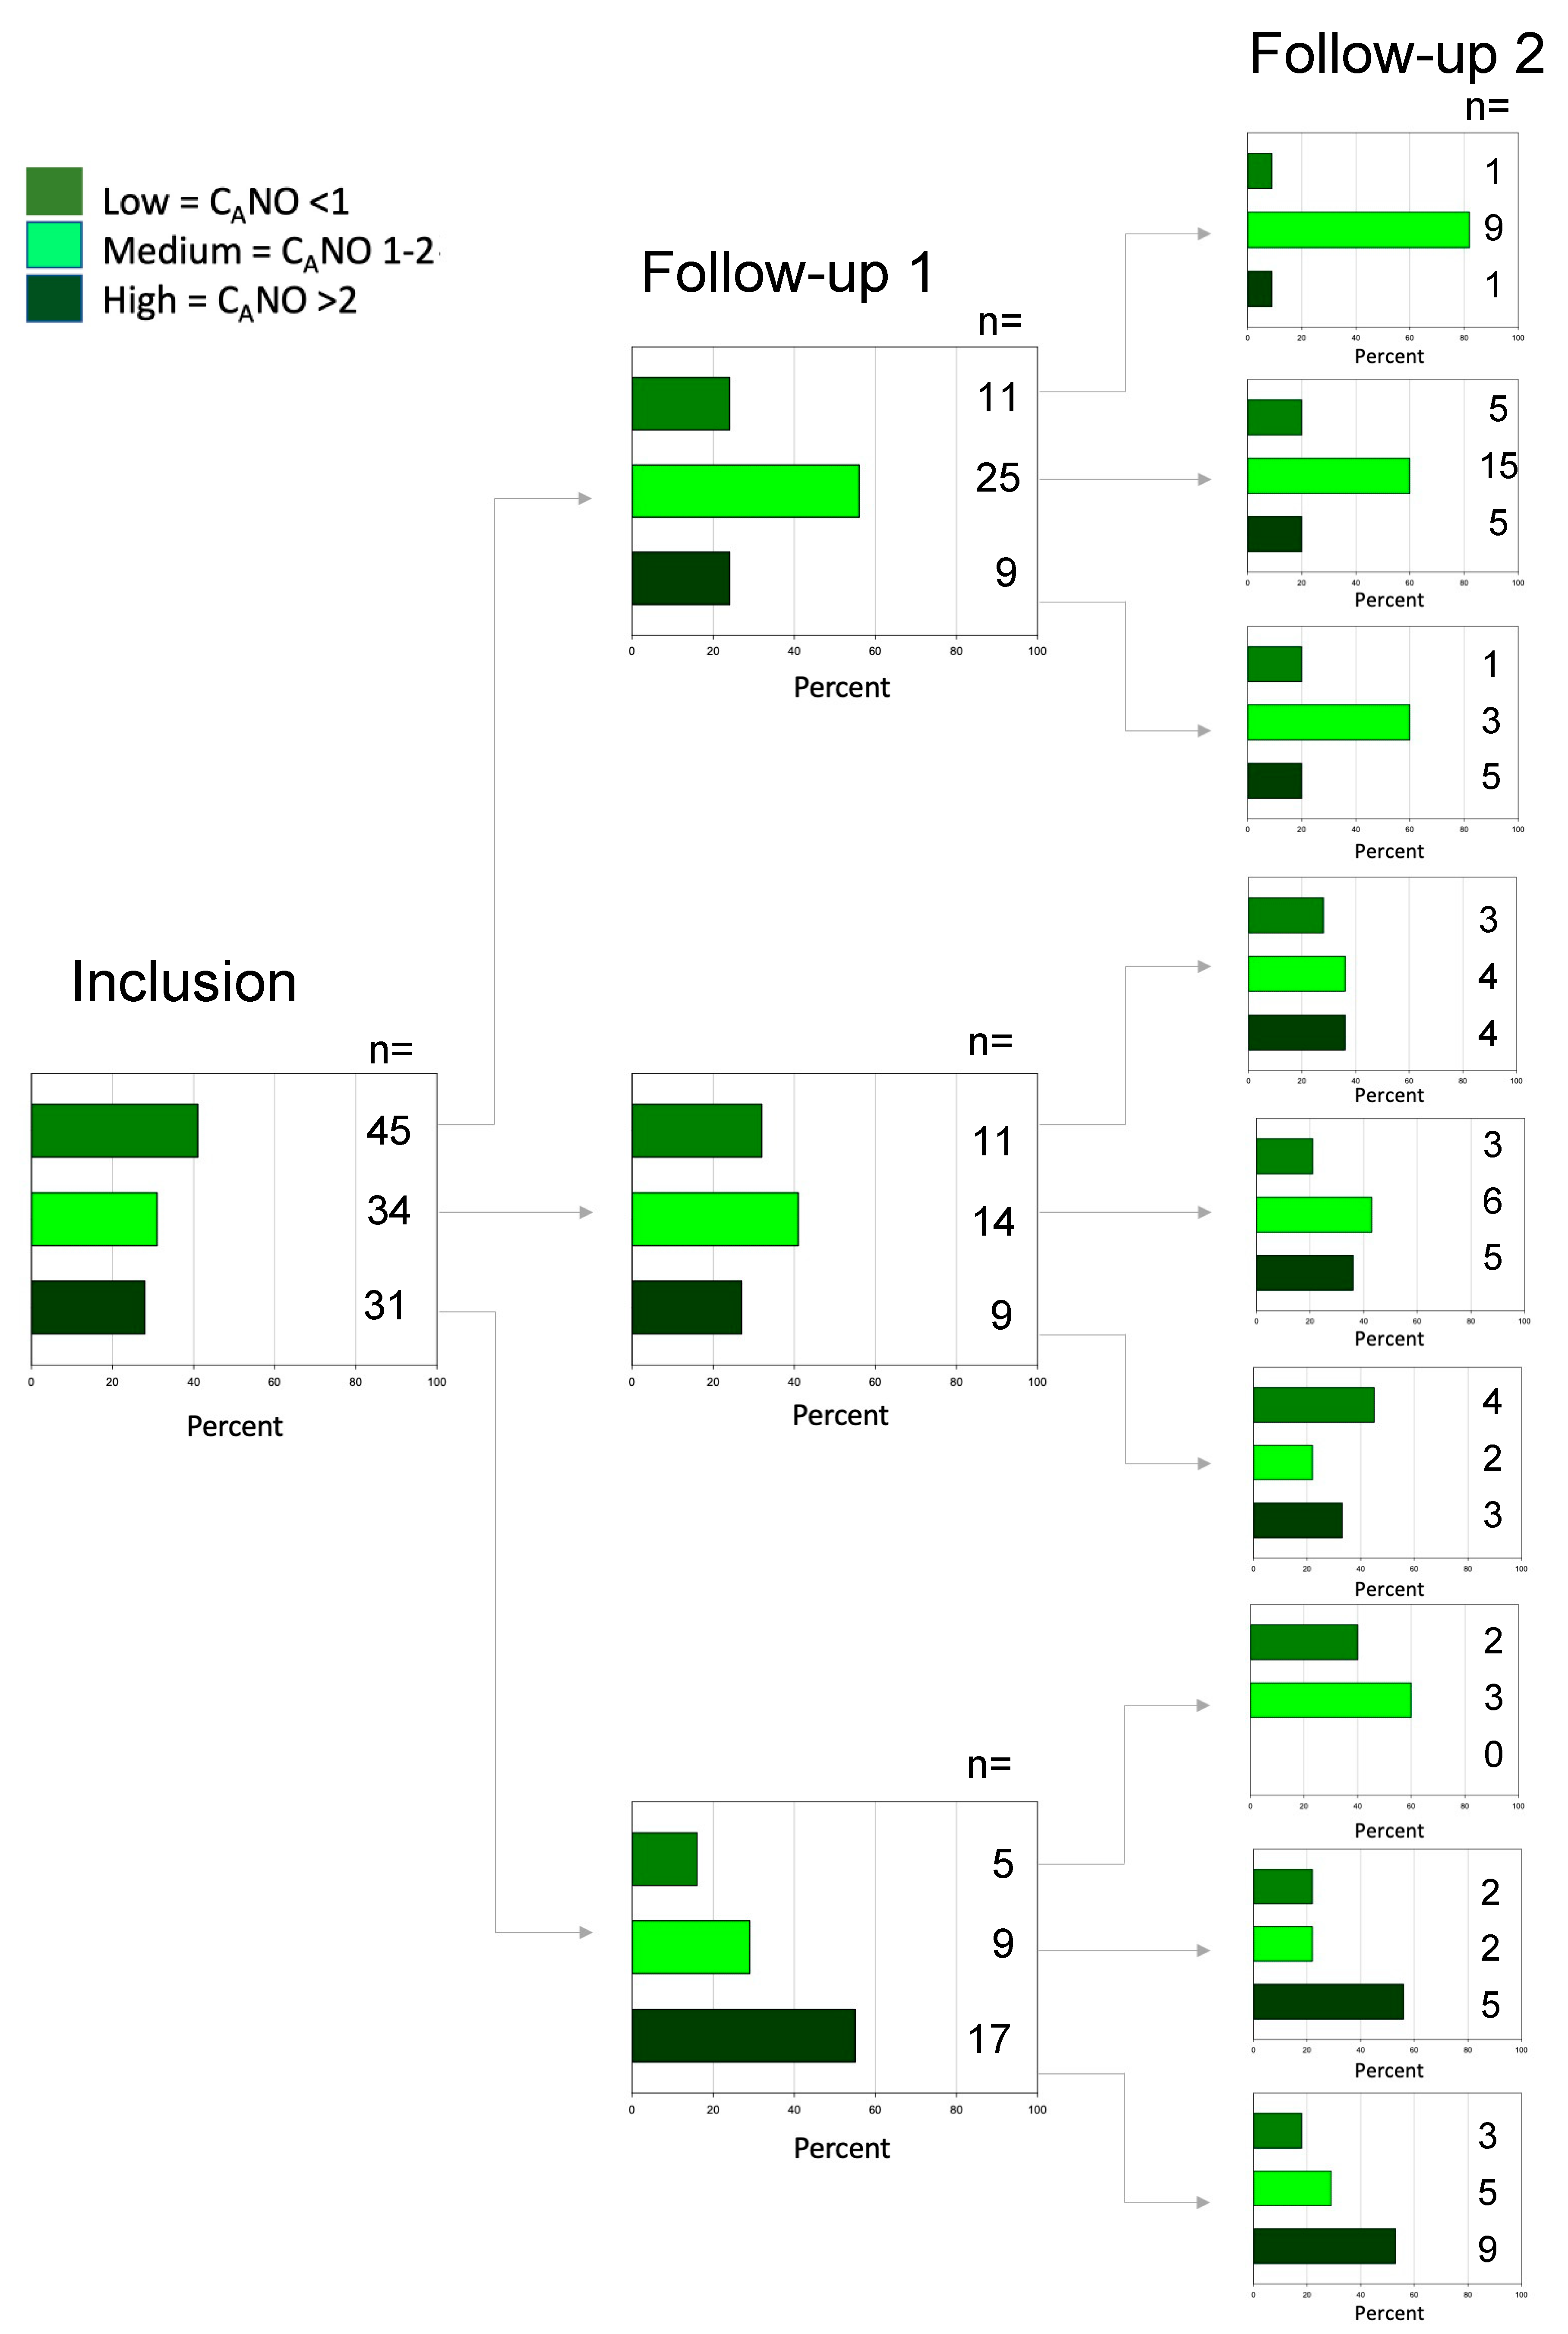
3. Results
4. Discussion
5. Conclusions
Author Contributions
Funding
Institutional Review Board Statement
Informed Consent Statement
Data Availability Statement
Acknowledgments
Conflicts of Interest
Abbreviations
| B-Eos | blood eosinophils |
| B-Neu | blood neutrophils |
| BMI | body mass index |
| CANO | alveolar NO |
| CAT | COPD Assessments Test-scores |
| CawNO | NO content in airway wall |
| COPD | chronic obstructive pulmonary disease |
| DawNO | NO diffusion capacity over airway wall |
| FENO50 | fraction of exhaled NO at 50 mL/s |
| FEV1 | forced expiratory volume in 1 s |
| FVC | forced vital capacity |
| HMA | Högman Meriläinen algorithm |
| mMRC | modified Medical Research Council dyspnoea scale |
| NO | nitric oxide |
References
- Lu, Z.; Huang, W.; Wang, L.; Xu, N.; Ding, Q.; Cao, C. Exhaled nitric oxide in patients with chronic obstructive pulmonary disease: A systematic review and meta-analysis. Int. J. Chronic Obstr. Pulm. Dis. 2018, 13, 2695–2705. [Google Scholar] [CrossRef] [PubMed]
- Rio Ramirez, M.T.; Juretschke Moragues, M.A.; Fernandez Gonzalez, R.; Alvarez Rodriguez, V.; Aznar Andres, E.; Zabaleta Camino, J.P.; Romero Pareja, R.; Esteban de la Torre, A. Value of exhaled nitric oxide (FENO) and eosinophilia during the exacerbations of chronic obstructive pulmonary disease requiring hospital admission. COPD 2018, 15, 369–376. [Google Scholar] [CrossRef]
- Malinovschi, A.; Janson, C.; Holmkvist, T.; Norbäck, D.; Meriläinen, P.; Högman, M. Effect of smoking on exhaled nitric oxide and flow-independent nitric oxide exchange parameters. Eur. Respir. J. 2006, 28, 339–345. [Google Scholar] [CrossRef]
- Mostafavi-Pour-Manshadi, S.M.; Naderi, N.; Barrecheguren, M.; Dehghan, A.; Bourbeau, J. Investigating fractional exhaled nitric oxide in chronic obstructive pulmonary disease (COPD) and asthma-COPD overlap (ACO): A scoping review. COPD 2018, 15, 377–391. [Google Scholar] [CrossRef]
- Brindicci, C.; Ito, K.; Resta, O.; Pride, N.B.; Barnes, P.J.; Kharitonov, S.A. Exhaled nitric oxide from lung periphery is increased in COPD. Eur. Respir. J. 2005, 26, 52–59. [Google Scholar] [CrossRef]
- Williamson, P.A.; Clearie, K.; Menzies, D.; Vaidyanathan, S.; Lipworth, B.J. Assessment of small-airways disease using alveolar nitric oxide and impulse oscillometry in asthma and COPD. Lung 2011, 189, 121–129. [Google Scholar] [CrossRef] [PubMed]
- McCurdy, M.R.; Sharafkhaneh, A.; Abdel-Monem, H.; Rojo, J.; Tittel, F.K. Exhaled nitric oxide parameters and functional capacity in chronic obstructive pulmonary disease. J. Breath Res. 2011, 5, 016003. [Google Scholar] [CrossRef]
- Högman, M.; Holmkvist, T.; Wegener, T.; Emtner, M.; Andersson, M.; Hedenström, H.; Meriläinen, P. Extended NO analysis applied to patients with COPD, allergic asthma and allergic rhinitis. Respir. Med. 2002, 96, 24–30. [Google Scholar] [CrossRef]
- Lehouck, A.; Carremans, C.; De Bent, K.; Decramer, M.; Janssens, W. Alveolar and bronchial exhaled nitric oxide in chronic obstructive pulmonary disease. Respir. Med. 2010, 104, 1020–1026. [Google Scholar] [CrossRef]
- Horvath, I.; Barnes, P.J.; Loukides, S.; Sterk, P.J.; Högman, M.; Olin, A.C.; Amann, A.; Antus, B.; Baraldi, E.; Bikov, A.; et al. A European Respiratory Society technical standard: Exhaled biomarkers in lung disease. Eur. Respir. J. 2017, 49, 1600965. [Google Scholar] [CrossRef] [PubMed] [Green Version]
- Högman, M.; Lehtimäki, L.; Dinh-Xuan, A.T. Utilising exhaled nitric oxide information to enhance diagnosis and therapy of respiratory disease—Current evidence for clinical practice and proposals to improve the methodology. Expert Rev. Respir. Med. 2017, 11, 101–109. [Google Scholar] [CrossRef]
- Högman, M.; Thornadtsson, A.; Hedenstierna, G.; Meriläinen, P. A practical approach to the theoretical models to calculate NO parameters of the respiratory system. J. Breath Res. 2014, 8, 016002. [Google Scholar] [CrossRef]
- Lazar, Z.; Kelemen, A.; Galffy, G.; Losonczy, G.; Horvath, I.; Bikov, A. Central and peripheral airway nitric oxide in patients with stable and exacerbated chronic obstructive pulmonary disease. J. Breath Res. 2018, 12, 036017. [Google Scholar] [CrossRef]
- Fan, X.; Zhao, N.; Yu, Z.; Yu, H.; Yin, B.; Zou, L.; Zhao, Y.; Qian, X.; Sai, X.; Qin, C.; et al. Clinical utility of central and peripheral airway nitric oxide in aging patients with stable and acute exacerbated chronic obstructive pulmonary disease. Int. J. Gen. Med. 2021, 14, 571–580. [Google Scholar] [CrossRef] [PubMed]
- Lehtimäki, L.; Kankaanranta, H.; Saarelainen, S.; Annila, I.; Aine, T.; Nieminen, R.; Moilanen, E. Bronchial nitric oxide is related to symptom relief during fluticasone treatment in COPD. Eur. Respir. J. 2010, 35, 72–78. [Google Scholar] [CrossRef] [PubMed]
- Högman, M.; Sulku, J.; Ställberg, B.; Janson, C.; Bröms, K.; Hedenström, H.; Lisspers, K.; Malinovschi, A. 2017 Global initiative for chronic obstructive lung disease reclassifies half of COPD subjects to lower risk group. Int. J. Chronic Obstr. Pulm. Dis. 2018, 13, 165–173. [Google Scholar] [CrossRef]
- Hedenström, H.; Malmberg, P.; Agarwal, K. Reference values for lung function tests in female. Regression equations with smoking variables. Bull. Eur. Physiopathol. Respir. 1985, 21, 551–557. [Google Scholar]
- Hedenström, H.; Malmberg, P.; Fridriksson, H.V. Reference values for pulmonary function test in men: Regression equations which include tobacco smoking variables. Upsala J. Med. Sci. 1986, 91, 299–310. [Google Scholar] [CrossRef]
- American Thoracic Society; European Respiratory Society. ATS/ERS recommendations for standardized procedures for the online and offline measurement of exhaled lower respiratory nitric oxide and nasal nitric oxide, 2005. Am. J. Respir. Crit. Care Med. 2005, 171, 912–930. [Google Scholar] [CrossRef]
- Bestall, J.C.; Paul, E.A.; Garrod, R.; Garnham, R.; Jones, P.W.; Wedzicha, J.A. Usefulness of the Medical Research Council (MRC) dyspnoea scale as a measure of disability in patients with chronic obstructive pulmonary disease. Thorax 1999, 54, 581–586. [Google Scholar] [CrossRef]
- Kon, S.S.; Canavan, J.L.; Jones, S.E.; Nolan, C.M.; Clark, A.L.; Dickson, M.J.; Haselden, B.M.; Polkey, M.I.; Man, W.D. Minimum clinically important difference for the COPD Assessment Test: A prospective analysis. Lancet Respir. Med. 2014, 2, 195–203. [Google Scholar] [CrossRef] [Green Version]
- Kocks, J.W.; Tuinenga, M.G.; Uil, S.M.; van den Berg, J.W.; Stahl, E.; van der Molen, T. Health status measurement in COPD: The minimal clinically important difference of the clinical COPD questionnaire. Respir. Res. 2006, 7, 62. [Google Scholar] [CrossRef] [PubMed]
- Gelb, A.F.; Flynn, T.C.; Krishnan, A.; Fraser, C.; Shinar, C.M.; Schein, M.J.; Osann, K. Central and peripheral airway sites of nitric oxide gas exchange in COPD. Chest 2010, 137, 575–584. [Google Scholar] [CrossRef]
- Gunnarsson, L.; Tokics, L.; Lundquist, H.; Brismar, B.; Strandberg, A.; Berg, B.; Hedenstierna, G. Chronic obstructive pulmonary disease and anesthesia: Formation of atelectasis and gas exchange impairment. Eur. Respir. J. 1991, 4, 1106–1116. [Google Scholar]
- Rodriguez-Roisin, R.; Drakulovic, M.; Rodriguez, D.A.; Roca, J.; Barbera, J.A.; Wagner, P.D. Ventilation-perfusion imbalance and chronic obstructive pulmonary disease staging severity. J. Appl. Physiol. 2009, 106, 1902–1908. [Google Scholar] [CrossRef] [PubMed]
- Högman, M.; Holmkvist, T.; Wålinder, R.; Meriläinen, P.; Ludviksdottir, D.; Håkansson, L.; Hedenström, H. Increased nitric oxide elimination from the airways after smoking cessation. Clin. Sci. 2002, 103, 15–19. [Google Scholar] [CrossRef] [PubMed]
- Karvonen, T.; Kankaanranta, H.; Saarelainen, S.; Moilanen, E.; Lehtimäki, L. Comparison of feasibility and estimates of central and peripheral nitric oxide parameters by different mathematical models. J. Breath Res. 2017, 11, 047102. [Google Scholar] [CrossRef] [Green Version]


| Did Not Complete n = 111 | Completed n = 110 | p-Value | |
|---|---|---|---|
| Women n (%) | 67 (60%) | 65 (59%) | 0.847 |
| Age years | 69 ± 8 | 68 ± 8 | 0.113 |
| Current daily smokers n (%) | 25 (23%) | 28 (26%) | 0.506 |
| BMI | 26 (23, 30) | 27 (23, 32) | 0.185 |
| Comorbidity | |||
| Asthma | 45% | 33% | 0.060 |
| Chronic bronchitis | 45% | 25% | 0.002 |
| Heart infarction/angina | 11% | 12% | 0.813 |
| Heart failure | 6% | 1% | 0.032 |
| Heart fibrillation | 19% | 6% | 0.005 |
| Hypertension | 47% | 46% | 0.836 |
| Diabetes | 13% | 5% | 0.034 |
| Anxiety/depression | 30% | 21% | 0.132 |
| Lung function | |||
| FEV1.0 L | 1.17 (0.79, 1.51) | 1.53 (1.24, 1.86) | <0.001 |
| FEV1.0 % predicted | 45 (31, 58) | 57 (49, 67) | <0.001 |
| FVC L | 2.38 (1.89, 3.16) | 2.83 (2.47, 3.45) | <0.001 |
| FVC % predicted | 57 (47, 74) | 67 (61, 76) | <0.001 |
| Inflammatory markers | |||
| B-Neu 109/L | 5.4 (4.3, 6.1) | 4.3 (3.5, 4.9) | <0.001 |
| B-Eos 109/L | 0.14 (0.08, 0.23) | 0.18 (0.10, 0.28) | 0.094 |
| Exhaled NO | |||
| FENO50 ppb | 11 (6, 17) 1 | 14 (9, 21) | 0.006 |
| CANO ppb | 1.5 (0.9, 2.7) 2 | 1.3 (0.6, 2.1) | 0.043 |
| CawNO ppb | 35 (16, 95) 2 | 65 (30, 136) | 0.007 |
| DawNO mL/s | 22 (10, 34) 2 | 15 (7, 30) | 0.084 |
| Symptom burden | |||
| CAT | 14 (9, 22) | 11 (6, 16) | <0.001 |
| mMRC ≥ 2 | 65 (59%) | 46 (42%) | 0.013 |
| CCQ | 2.0 (1.1, 3.1) | 1.3 (0.7, 2.1) | <0.001 |
| Exacerbations | |||
| Questionnaire ≥ 1 (%) | 67 (61%) | 48 (44%) | <0.001 |
| Inhaled treatment | |||
| ICS + LABA + LAMA 3 | 73 (66%) | 46 (42%) | <0.001 |
| Inclusion n = 110 | 1-Year n = 110 | 2-Year n = 110 | p-Value | |
|---|---|---|---|---|
| Current daily smokers n (%) | 28 (26%) | 22 (20%) | 27 (24%) | 1.0 |
| BMI | 27 (23, 32) | 27 (23, 31) | 27 (24, 31) | 0.559 |
| Lung function | ||||
| FEV1.0 L | 1.53 (1.24, 1.86) | 1.53 (1.20, 1.94) | 1.49 (1.15, 1.89) | 0.024 |
| FEV1.0 % predicted | 57 (49, 67) | 58 (48, 68) | 56 (46, 66) | 0.429 |
| FVC L | 2.83 (2.47, 3.45) | 2.78 (2.27, 3.18) | 2.68 (2.23, 3.27) | <0.001 |
| FVC % predicted | 67 (61, 76) | 66 (57, 76) | 65 (56, 76) | 0.007 |
| Inflammatory markers | ||||
| B-Neu 109/L | 4.3 (3.5, 4.9) | 4.3 (3.2, 5.3) | 4.2 (3.6, 5.4) | 0.890 |
| B-Eos 109/L | 0.18 (0.10, 0.28) | 0.17 (0.11, 0.29) | 0.16 (0.11, 0.24) | 0.072 |
| Exhaled NO | ||||
| FENO50 ppb | 14 (9, 21) | 14 (9, 23) | 13 (8, 19) | 0.238 |
| CANO ppb | 1.3 (0.6, 2.1) | 1.5 (1.0, 2.2) | 1.7 (1.1, 2.3) | 0.013 |
| CawNO ppb | 65 (30, 136) | 49 (21, 111) | 52 (25, 96) | 0.089 |
| DawNO mL/s | 15 (7, 30) | 18 (9, 36) | 16 (6, 33) | 0.553 |
| Symptom burden | ||||
| CAT | 11 (6, 16) | 10 (6, 15) | 11 (7, 17) | 0.523 |
| mMRC n 0/1/2/3/4 | 17/47/23/14/9 | 16/48/20/14/12 | 11/51/16/15/17 | |
| CCQ | 1.3 (0.7, 2.1) | 1.3 (0.8, 2.1) | 1.3 (0.8, 2.4) | 0.537 |
| Exacerbations ≥ 1/year | 48 (44%) | 25 (23%) | 29 (27%) | 0.002 |
| Treatment | ||||
| No regular treatment n (%) | 21 (19%) | 22 (20%) | 18 (16%) | 0.863 |
| Bronchodilators 1 n (%) | 26 (24%) | 22 (20%) | 27 (25%) | |
| ICS 2 n (%) | 63 (57%) | 63 (57%) | 64 (58%) | |
| SABA last week | 50 (45%) | 48 (44%) | 47 (43%) | 0.584 |
Publisher’s Note: MDPI stays neutral with regard to jurisdictional claims in published maps and institutional affiliations. |
© 2022 by the authors. Licensee MDPI, Basel, Switzerland. This article is an open access article distributed under the terms and conditions of the Creative Commons Attribution (CC BY) license (https://creativecommons.org/licenses/by/4.0/).
Share and Cite
Högman, M.; Palm, A.; Sulku, J.; Ställberg, B.; Lisspers, K.; Bröms, K.; Janson, C.; Malinovschi, A. Alveolar Nitric Oxide in Chronic Obstructive Pulmonary Disease—A Two-Year Follow-Up. Biomedicines 2022, 10, 2212. https://doi.org/10.3390/biomedicines10092212
Högman M, Palm A, Sulku J, Ställberg B, Lisspers K, Bröms K, Janson C, Malinovschi A. Alveolar Nitric Oxide in Chronic Obstructive Pulmonary Disease—A Two-Year Follow-Up. Biomedicines. 2022; 10(9):2212. https://doi.org/10.3390/biomedicines10092212
Chicago/Turabian StyleHögman, Marieann, Andreas Palm, Johanna Sulku, Björn Ställberg, Karin Lisspers, Kristina Bröms, Christer Janson, and Andrei Malinovschi. 2022. "Alveolar Nitric Oxide in Chronic Obstructive Pulmonary Disease—A Two-Year Follow-Up" Biomedicines 10, no. 9: 2212. https://doi.org/10.3390/biomedicines10092212