
Identification of Germinal Neurofibromin Hotspots


 , and
, and 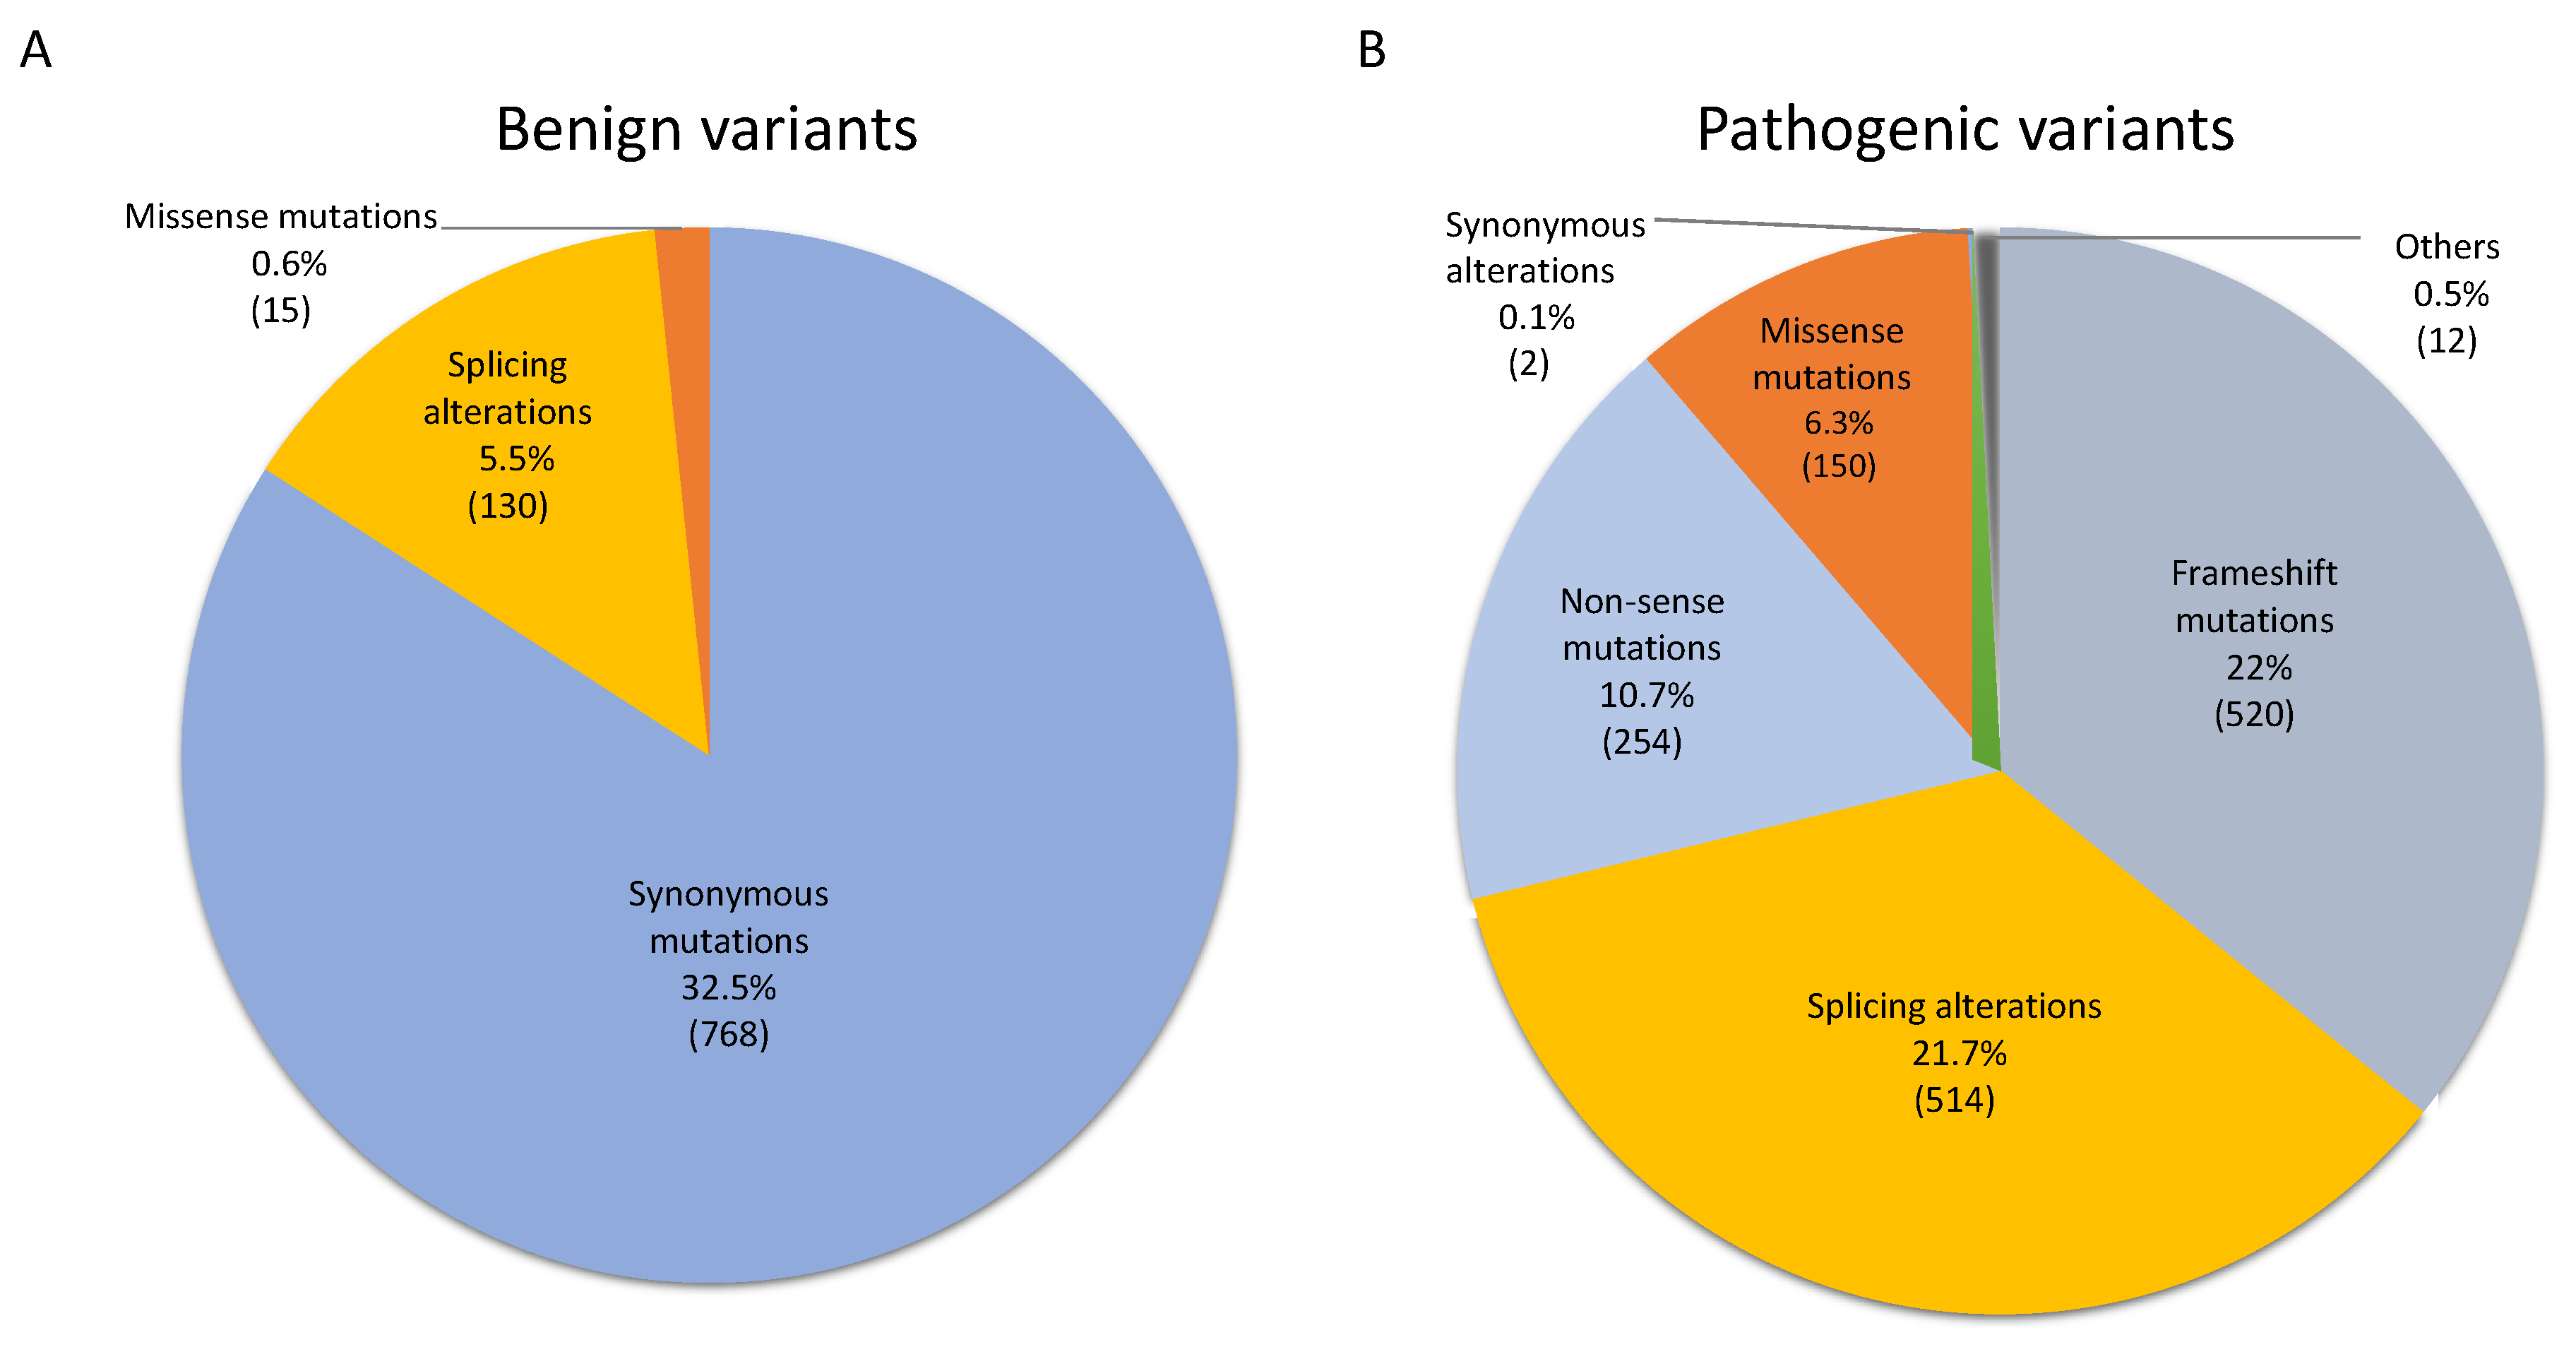
Abstract
:1. Introduction
2. Materials and Methods
2.1. Neurofibromin Residues, Regions, and Domains Defined in This Study
2.2. Analysis of NF1 Variants from Clinvar
2.3. Sliding Windows Test
2.4. Identification of Pathogenic Variant Enriched Regions across Neurofibromin
2.5. Models Performance
3. Results
3.1. NF1 Germinal Mutational Spectrum and Potential Pathogenicity
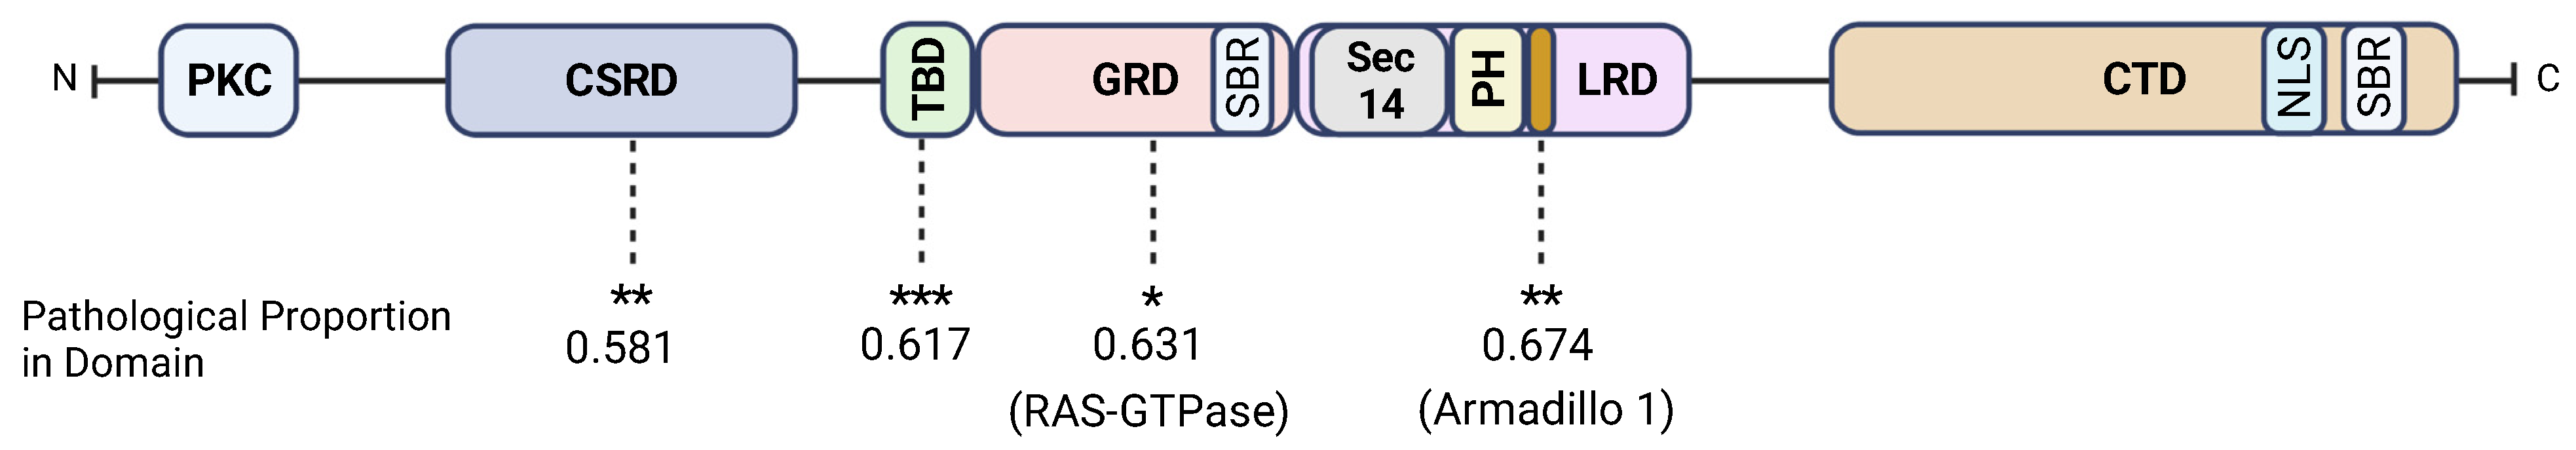
3.2. Neurofibromin CSRD, GRD, Armadillo1, and the TBD Are Hotspots
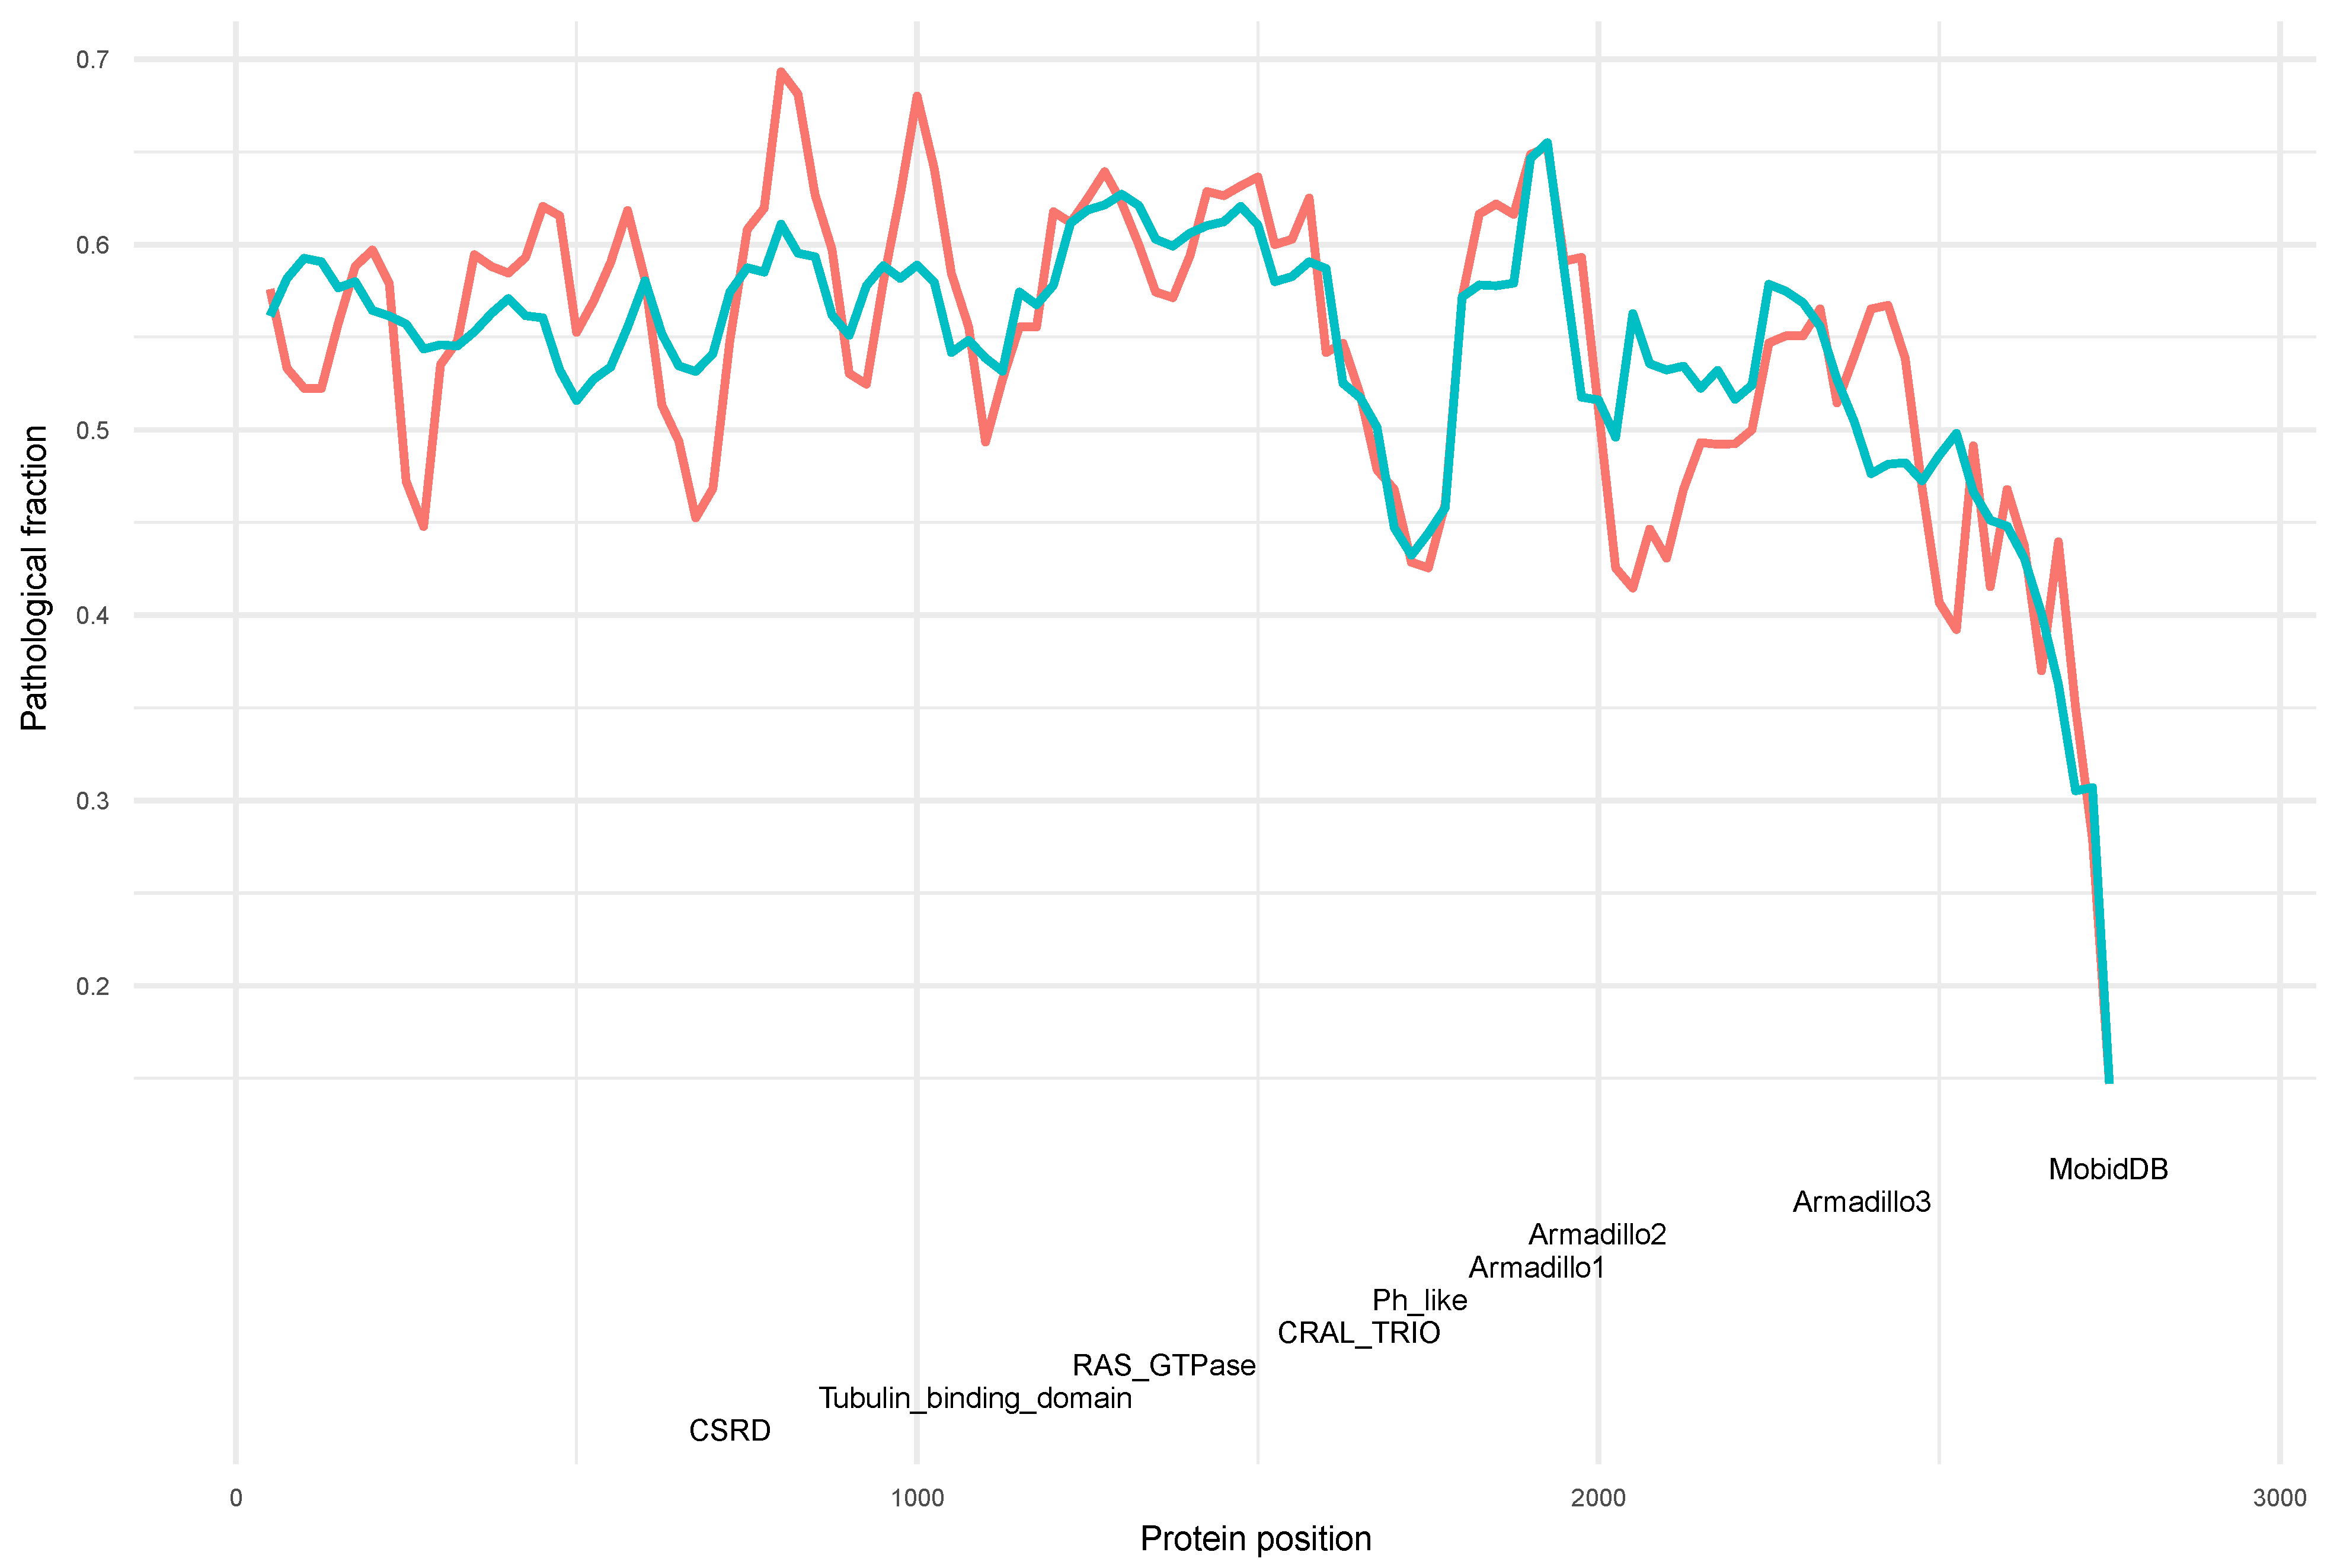
3.3. Neurofibromin CSRD and GRD Domains Are Further Validated as Hotspots Based on the Sliding Window Test
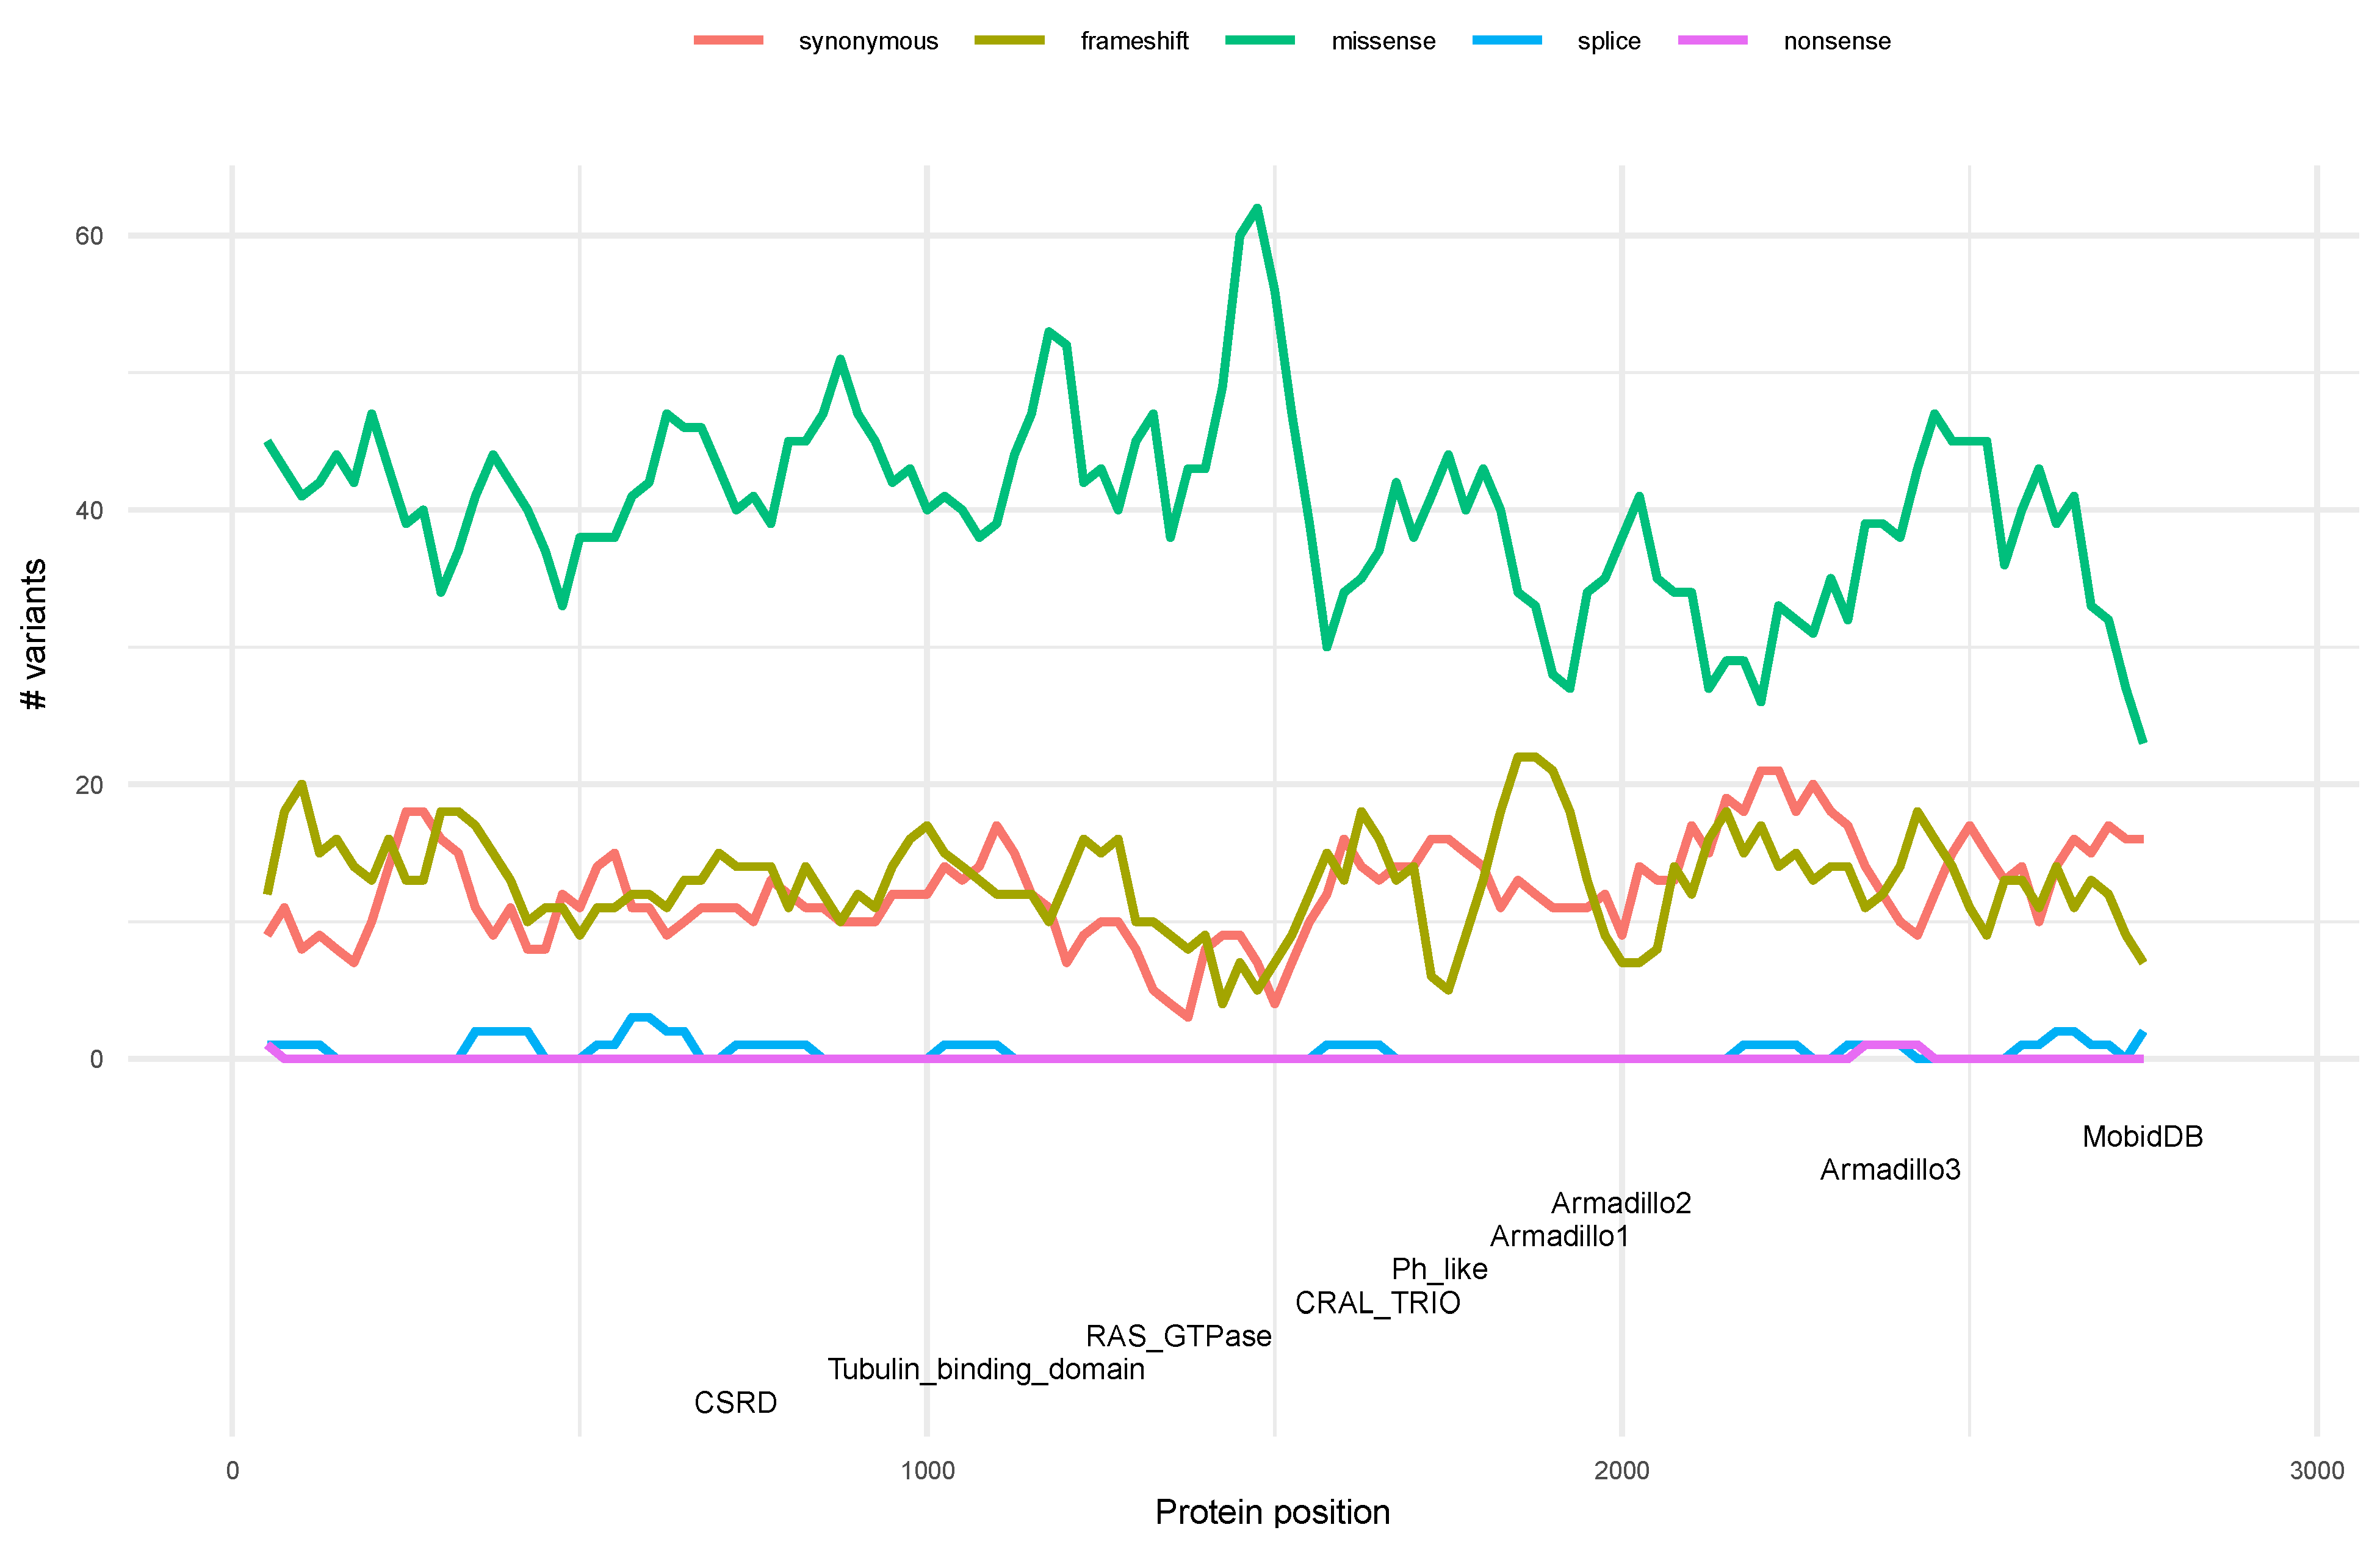
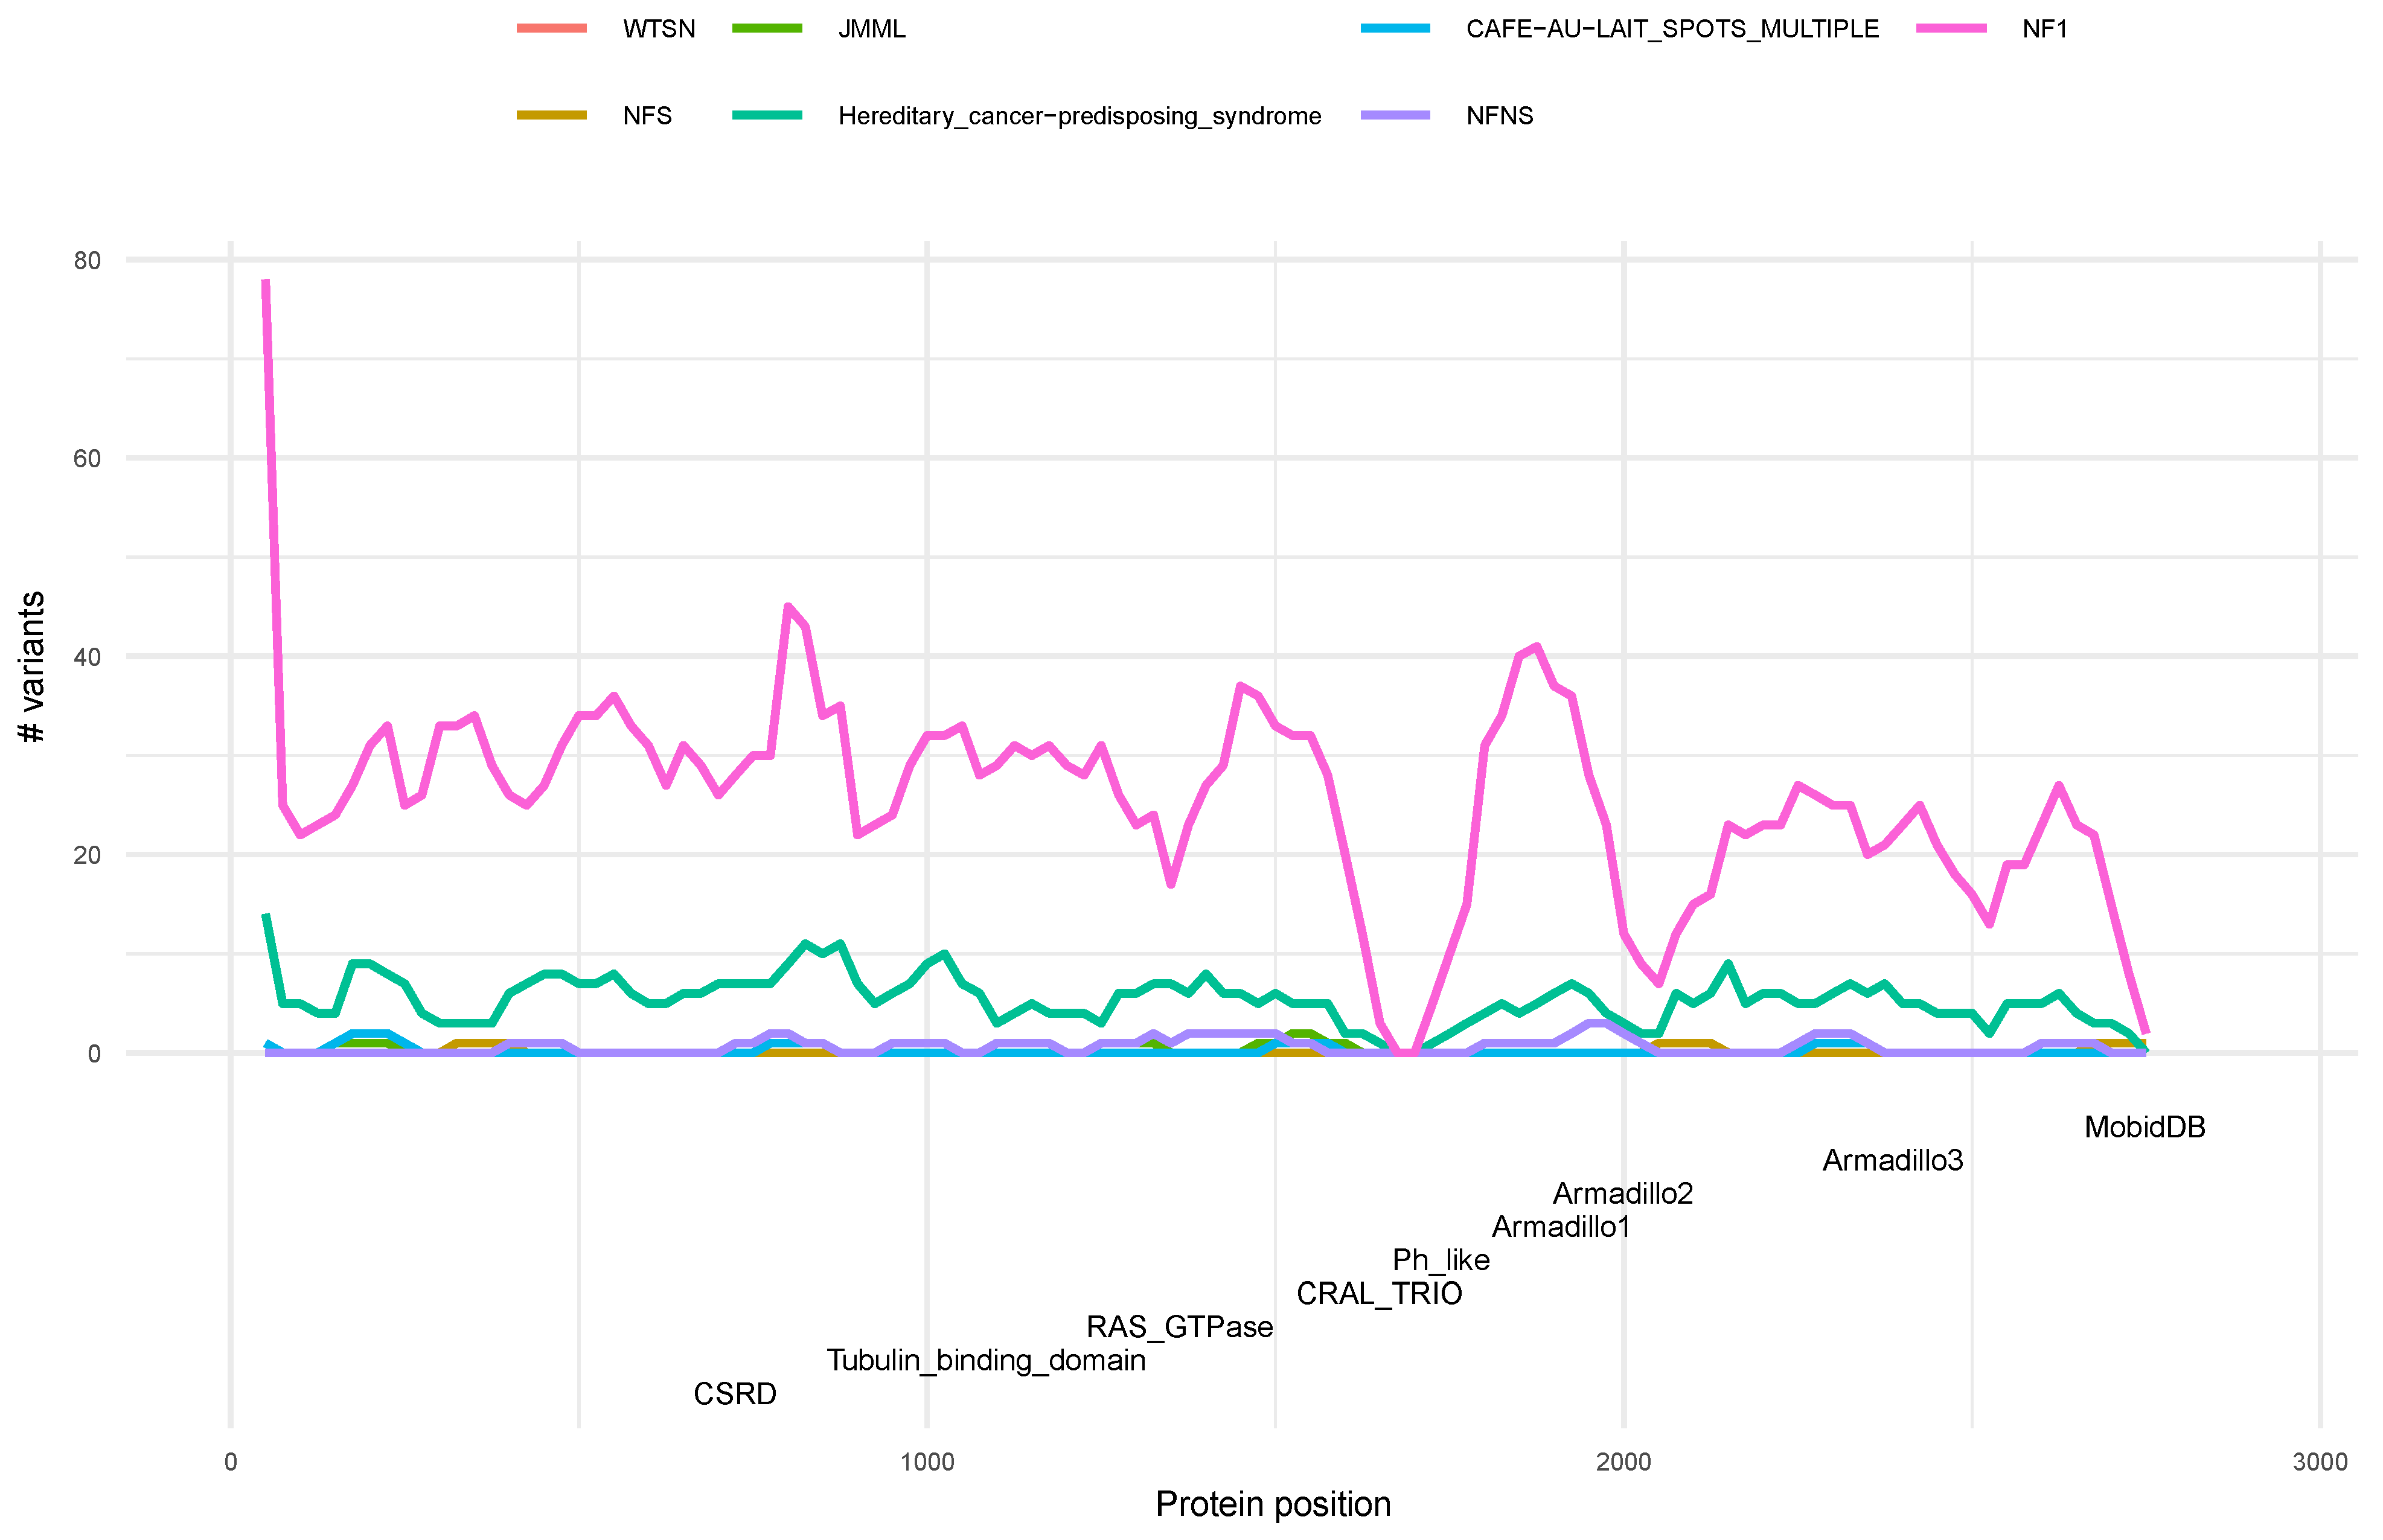
3.4. Distribution of Variants along the Neurofibromin Protein
3.5. Phenotype Distribution of Pathogenic Variants along Neurofibromin
3.6. Neurofibromin Functional and Structural Relationships within a Pathological Context
4. Discussion
Supplementary Materials
Author Contributions
Funding
Institutional Review Board Statement
Informed Consent Statement
Data Availability Statement
Conflicts of Interest
References
- Kallionpää, R.A.; Uusitalo, E.; Leppävirta, J.; Pöyhönen, M.; Peltonen, S.; Peltonen, J. Prevalence of Neurofibromatosis Type 1 in the Finnish Population. Genet. Med. 2018, 20, 1082–1086. [Google Scholar] [CrossRef] [PubMed] [Green Version]
- Rauen, K.A. Defining RASopathy. DMM Dis. Model. Mech. 2022, 15, dmm049344. [Google Scholar] [CrossRef] [PubMed]
- Akl, M.R.; Nagpal, P.; Ayoub, N.M.; Prabhu, S.A.; Gliksman, M.; Tai, B.; Hatipoglu, A.; Goy, A.; Suh, K.S. Molecular and Clinical Profiles of Syndecan-1 in Solid and Hematological Cancer for Prognosis and Precision Medicine. Oncotarget 2015, 6, 28693–28715. [Google Scholar] [CrossRef] [PubMed] [Green Version]
- Anastasaki, C.; Gao, F.; Gutmann, D.H. Commentary: Identification of Mutation Regions on NF1 Responsible for High- And Low-Risk Development of Optic Pathway Glioma in Neurofibromatosis Type I. Front. Genet. 2019, 10, 270. [Google Scholar] [CrossRef] [PubMed] [Green Version]
- Philpott, C.; Tovell, H.; Frayling, I.M.; Cooper, D.N.; Upadhyaya, M. The NF1 Somatic Mutational Landscape in Sporadic Human Cancers. Hum. Genom. 2017, 11, 13. [Google Scholar] [CrossRef] [PubMed] [Green Version]
- Pemov, A.; Sung, H.; Hyland, P.L.; Sloan, J.L.; Ruppert, S.L.; Baldwin, A.M.; Boland, J.F.; Bass, S.E.; Lee, H.J.; Jones, K.M.; et al. Genetic Modifiers of Neurofibromatosis Type 1-Associated Café-Au-Lait Macule Count Identified Using Multi-Platform Analysis. PLoS Genet. 2014, 10, e1004575. [Google Scholar] [CrossRef] [Green Version]
- Mo, J.; Moye, S.L.; McKay, R.M.; Le, L.Q. Neurofibromin and Suppression of Tumorigenesis: Beyond the GAP. Oncogene 2022, 41, 1235–1251. [Google Scholar] [CrossRef]
- Yaeger, R.; Corcoran, R.B. Targeting Alterations in the RAF–MEK Pathway. Cancer Discov. 2019, 9, 329–341. [Google Scholar] [CrossRef] [Green Version]
- Keppler-Noreuil, K.M.; Parker, V.E.R.; Darling, T.N.; Martinez-Agosto, J.A. Somatic Overgrowth Disorders of the PI3K/AKT/MTOR Pathway & Therapeutic Strategies. Am. J. Med. Genet. Part C Semin. Med. Genet. 2016, 172, 402–421. [Google Scholar]
- Soriano, O.; Alcón-Pérez, M.; Vicente-Manzanares, M.; Castellano, E. The Crossroads between Ras and Rho Signaling Pathways in Cellular Transformation, Motility and Contraction. Genes 2021, 12, 819. [Google Scholar] [CrossRef]
- Lin, Y.L.; Lei, Y.T.; Hong, C.J.; Hsueh, Y.P. Syndecan-2 Induces Filopodia and Dendritic Spine Formation via the Neurofibromin-PKA-Ena/VASP Pathway. J. Cell Biol. 2007, 177, 829–841. [Google Scholar] [CrossRef] [Green Version]
- Machado Almeida, P.; Lago Solis, B.; Stickley, L.; Feidler, A.; Nagoshi, E. Neurofibromin 1 in Mushroom Body Neurons Mediates Circadian Wake Drive through Activating CAMP–PKA Signaling. Nat. Commun. 2021, 12, 5758. [Google Scholar] [CrossRef] [PubMed]
- Wallis, D.; Li, K.; Lui, H.; Hu, K.; Chen, M.J.; Li, J.; Kang, J.; Das, S.; Korf, B.R.; Kesterson, R.A. Neurofibromin (NF1) Genetic Variant Structure–Function Analyses Using a Full-Length Mouse CDNA. Hum. Mutat. 2018, 39, 816–821. [Google Scholar] [CrossRef] [PubMed]
- Yap, Y.S.; McPherson, J.R.; Ong, C.K.; Rozen, S.G.; Teh, B.T.; Lee, A.S.G.; Callen, D.F. The NF1 Gene Revisited -from Bench to Bedside. Oncotarget 2014, 5, 5873–5892. [Google Scholar] [CrossRef] [Green Version]
- Phan, V.T.; Ding, V.W.; Li, F.; Chalkley, R.J.; Burlingame, A.; McCormick, F. The RasGAP Proteins Ira2 and Neurofibromin Are Negatively Regulated by Gpb1 in Yeast and ETEA in Humans. Mol. Cell. Biol. 2010, 30, 2264–2279. [Google Scholar] [CrossRef] [PubMed] [Green Version]
- Nadim, W.D.; Chaumont-Dubel, S.; Madouri, F.; Cobret, L.; De Tauzia, M.L.; Zajdel, P.; Bénédetti, H.; Marin, P.; Morisset-Lopez, S. Physical Interaction between Neurofibromin and Serotonin 5-HT6 Receptor Promotes Receptor Constitutive Activity. Proc. Natl. Acad. Sci. USA 2016, 113, 12310–12315. [Google Scholar] [CrossRef] [PubMed] [Green Version]
- Hirata, Y.; Brems, H.; Suzuki, M.; Kanamori, M.; Okada, M.; Morita, R.; Llano-Rivas, I.; Ose, T.; Messiaen, L.; Legius, E.; et al. Interaction between a Domain of the Negative Regulator of the Ras-ERK Pathway, SPRED1 Protein, and the GTPase-Activating Protein-Related Domain of Neurofibromin Is Implicated in Legius Syndrome and Neurofibromatosis Type 1. J. Biol. Chem. 2016, 291, 3124–3134. [Google Scholar] [CrossRef] [Green Version]
- Binarová, P.; Tuszynski, J. Tubulin: Structure, Functions and Roles in Disease. Cells 2019, 8, 1294. [Google Scholar] [CrossRef] [Green Version]
- Liang, Y.J.; Yang, W.X. Kinesins in MAPK Cascade: How Kinesin Motors Are Involved in the MAPK Pathway? Gene 2019, 684, 1–9. [Google Scholar] [CrossRef]
- Scheffzek, K.; Shivalingaiah, G. Ras-Specific Gtpase-Activating Proteins—Structures, Mechanisms, and Interactions. Cold Spring Harb. Perspect. Med. 2019, 9, a031500. [Google Scholar] [CrossRef]
- Michaels, K.; Lu, Y. Protein Kinase C Is Partially Responsible for the Effects of NF1 in Sustaining EPSP Amplitude Increase. Pioneer. Neurosci. 2020, 18, 15–19. [Google Scholar]
- Kamposioras, K.; Tsimplouli, C.; Verbeke, C.; Anthoney, A.; Daoukopoulou, A.; Papandreou, C.N.; Sakellaridis, N.; Vassilopoulos, G.; Potamianos, S.P.; Liakouli, V.; et al. Silencing of Caveolin-1 in Fibroblasts as Opposed to Epithelial Tumor Cells Results in Increased Tumor Growth Rate and Chemoresistance in a Human Pancreatic Cancer Model. Int. J. Oncol. 2019, 54, 537–549. [Google Scholar] [CrossRef] [PubMed] [Green Version]
- Sharma, P.; Alsharif, S.; Fallatah, A.; Chung, B.M. Intermediate Filaments as Effectors of Cancer Development and Metastasis: A Focus on Keratins, Vimentin, and Nestin. Cells 2019, 8, 497. [Google Scholar] [CrossRef] [PubMed] [Green Version]
- Godin, F.; Villette, S.; Vallée, B.; Doudeau, M.; Morisset-Lopez, S.; Ardourel, M.; Hevor, T.; Pichon, C.; Bénédetti, H. A Fraction of Neurofibromin Interacts with PML Bodies in the Nucleus of the CCF Astrocytoma Cell Line. Biochem. Biophys. Res. Commun. 2012, 418, 689–694. [Google Scholar] [CrossRef]
- Wang, H.F.; Shih, Y.T.; Chen, C.Y.; Chao, H.W.; Lee, M.J.; Hsueh, Y.P. Valosin-Containing Protein and Neurofibromin Interact to Regulate Dendritic Spine Density. J. Clin. Investig. 2011, 121, 4820–4837. [Google Scholar] [CrossRef]
- De Schepper, S.; Boucneau, J.M.A.; Westbroek, W.; Mommaas, M.; Onderwater, J.; Messiaen, L.; Naeyaert, J.M.A.D.; Lambert, J.L.W. Neurofibromatosis Type 1 Protein and Amyloid Precursor Protein Interact in Normal Human Melanocytes and Colocalize with Melanosomes. J. Investig. Dermatol. 2006, 126, 653–659. [Google Scholar] [CrossRef] [Green Version]
- Tidyman, W.E.; Rauen, K.A. The RASopathies: Developmental Syndromes of Ras/MAPK Pathway Dysregulation. Curr. Opin. Genet. Dev. 2009, 19, 230–236. [Google Scholar] [CrossRef] [Green Version]
- Kiuru, M.; Busam, K.J. The NF1 Gene in Tumor Syndromes and Melanoma. Lab. Investig. 2017, 97, 146–157. [Google Scholar] [CrossRef] [Green Version]
- Gutmann, D.H.; Ferner, R.E.; Listernick, R.H.; Korf, B.R.; Wolters, P.L.; Johnson, K.J. Neurofibromatosis Type 1. Nat. Rev. Dis. Prim. 2017, 3, 17004. [Google Scholar] [CrossRef]
- Ozarslan, B.; Russo, T.; Argenziano, G.; Santoro, C.; Piccolo, V. Cutaneous Findings in Neurofibromatosis Type 1. Cancers 2021, 13, 463. [Google Scholar] [CrossRef]
- Campen, C.J.; Gutmann, D.H. Optic Pathway Gliomas in Neurofibromatosis Type 1. J. Child Neurol. 2018, 33, 73–81. [Google Scholar] [CrossRef] [PubMed] [Green Version]
- Gambarotti, M. Neurofibromas. In Diagnosis of Musculoskeletal Tumors and Tumor-like Conditions: Clinical, Radiological and Histological Correlations—The Rizzoli Case Archive; StatPearls Publishing: Tampa, FL, USA, 2019; pp. 145–147. ISBN 9783030296766. [Google Scholar]
- Uusitalo, E.; Rantanen, M.; Kallionpää, R.A.; Pöyhönen, M.; Leppävirta, J.; Ylä-Outinen, H.; Riccardi, V.M.; Pukkala, E.; Pitkäniemi, J.; Peltonen, S.; et al. Distinctive Cancer Associations in Patients with Neurofibromatosis Type 1. J. Clin. Oncol. 2016, 34, 1978–1986. [Google Scholar] [CrossRef] [PubMed] [Green Version]
- Evans, D.G.R.; O’Hara, C.; Wilding, A.; Ingham, S.L.; Howard, E.; Dawson, J.; Moran, A.; Scott-Kitching, V.; Holt, F.; Huson, S.M. Mortality in Neurofibromatosis 1: In North West England: An Assessment of Actuarial Survival in a Region of the UK since 1989. Eur. J. Hum. Genet. 2011, 19, 1187–1191. [Google Scholar] [CrossRef] [PubMed]
- Biotteau, M.; Déjean, S.; Lelong, S.; Iannuzzi, S.; Faure-Marie, N.; Castelnau, P.; Rivier, F.; Lauwers-Cancès, V.; Baudou, E.; Chaix, Y. Sporadic and Familial Variants in NF1: An Explanation of the Wide Variability in Neurocognitive Phenotype? Front. Neurol. 2020, 11, 368. [Google Scholar] [CrossRef] [PubMed]
- Mayerhofer, C.; Niemeyer, C.M.; Flotho, C. Current Treatment of Juvenile Myelomonocytic Leukemia. J. Clin. Med. 2021, 10, 3084. [Google Scholar] [CrossRef] [PubMed]
- Broadfoot, B.G.; Kumarapeli, A.R. Pheochromocytoma Multisystem Crisis and Masquerading Disseminated Histoplasmosis in a Neurofibromatosis Type 1 Patient With Bilateral Adrenal Tumors. Acad. Forensic Pathol. 2020, 10, 62–68. [Google Scholar] [CrossRef]
- Henkemeyer, M.; Rossi, D.J.; Holmyard, D.P.; Puri, M.C.; Mbamalu, G.; Harpal, K.; Shih, T.S.; Jacks, T.; Pawson, T. Vascular System Defects and Neuronal Apoptosis in Mice Lacking Ras GTPase-Activating Protein. Nature 1995, 377, 695–701. [Google Scholar] [CrossRef]
- Lobbous, M.; Bernstock, J.D.; Coffee, E.; Friedman, G.K.; Metrock, L.K.; Chagoya, G.; Elsayed, G.; Nakano, I.; Hackney, J.R.; Korf, B.R.; et al. An Update on Neurofibromatosis Type 1-Associated Gliomas. Cancers 2020, 12, 114. [Google Scholar] [CrossRef] [Green Version]
- Qiao, G.; Jia, X.; Zhang, Y.; Chen, B. Neurofibromin 1 Expression Is Negatively Correlated with Malignancy and Prognosis of Epithelial Ovarian Cancer. Int. J. Clin. Exp. Pathol. 2019, 12, 1702–1712. [Google Scholar]
- Tlemsani, C.; Pécuchet, N.; Gruber, A.; Laurendeau, I.; Danel, C.; Riquet, M.; Le Pimpec-Barthes, F.; Fabre, E.; Mansuet-Lupo, A.; Damotte, D.; et al. NF1 Mutations Identify Molecular and Clinical Subtypes of Lung Adenocarcinomas. Cancer Med. 2019, 8, 4330–4337. [Google Scholar] [CrossRef] [Green Version]
- Farshidfar, F.; Zheng, S.; Gingras, M.C.; Newton, Y.; Shih, J.; Robertson, A.G.; Hinoue, T.; Hoadley, K.A.; Gibb, E.A.; Roszik, J.; et al. Integrative Genomic Analysis of Cholangiocarcinoma Identifies Distinct IDH-Mutant Molecular Profiles. Cell Rep. 2017, 18, 2780–2794. [Google Scholar] [CrossRef] [PubMed]
- Suarez-Kelly, L.P.; Yu, L.; Kline, D.; Schneider, E.B.; Agnese, D.M.; Carson, W.E. Increased Breast Cancer Risk in Women with Neurofibromatosis Type 1: A Meta-Analysis and Systematic Review of the Literature. Hered. Cancer Clin. Pract. 2019, 17, 12. [Google Scholar] [CrossRef] [PubMed]
- Landry, J.P.; Schertz, K.L.; Chiang, Y.J.; Bhalla, A.D.; Yi, M.; Keung, E.Z.; Scally, C.P.; Feig, B.W.; Hunt, K.K.; Roland, C.L.; et al. Comparison of Cancer Prevalence in Patients with Neurofibromatosis Type 1 at an Academic Cancer Center vs in the General Population from 1985 to 2020. JAMA Netw. Open 2021, 4, e210945. [Google Scholar] [CrossRef] [PubMed]
- Koczkowska, M.; Chen, Y.; Callens, T.; Gomes, A.; Sharp, A.; Johnson, S.; Hsiao, M.C.; Chen, Z.; Balasubramanian, M.; Barnett, C.P.; et al. Genotype-Phenotype Correlation in NF1: Evidence for a More Severe Phenotype Associated with Missense Mutations Affecting NF1 Codons 844–848. Am. J. Hum. Genet. 2018, 102, 69–87. [Google Scholar] [CrossRef] [Green Version]
- Xu, M.; Xiong, H.; Han, Y.; Li, C.; Mai, S.; Huang, Z.; Ai, X.; Guo, Z.; Zeng, F.; Guo, Q. Identification of Mutation Regions on NF1 Responsible for High- and Low-Risk Development of Optic Pathway Glioma in Neurofibromatosis Type I. Front. Genet. 2018, 9, 270. [Google Scholar] [CrossRef]
- Bateman, A.; Martin, M.J.; Orchard, S.; Magrane, M.; Agivetova, R.; Ahmad, S.; Alpi, E.; Bowler-Barnett, E.H.; Britto, R.; Bursteinas, B.; et al. UniProt: The Universal Protein Knowledgebase in 2021. Nucleic Acids Res. 2021, 49, D480–D489. [Google Scholar] [CrossRef]
- Blum, M.; Chang, H.Y.; Chuguransky, S.; Grego, T.; Kandasaamy, S.; Mitchell, A.; Nuka, G.; Paysan-Lafosse, T.; Qureshi, M.; Raj, S.; et al. The InterPro Protein Families and Domains Database: 20 Years On. Nucleic Acids Res. 2021, 49, D344–D354. [Google Scholar] [CrossRef]
- Sigrist, C.J.A.; Cerutti, L.; Hulo, N.; Gattiker, A.; Falquet, L.; Pagni, M.; Bairoch, A.; Bucher, P. PROSITE: A Documented Database Using Patterns and Profiles as Motif Descriptors. Brief. Bioinform. 2002, 3, 265–274. [Google Scholar] [CrossRef]
- Carnes, R.M.; Mobley, J.A.; Crossman, D.K.; Liu, H.; Korf, B.R.; Kesterson, R.A.; Wallis, D. Multi-Omics Profiling for NF1 Target Discovery in Neurofibromin (NF1) Deficient Cells. Proteomics 2019, 19, 1800334. [Google Scholar] [CrossRef]
- Huttlin, E.L.; Ting, L.; Bruckner, R.J.; Gebreab, F.; Gygi, M.P.; Szpyt, J.; Tam, S.; Zarraga, G.; Colby, G.; Baltier, K.; et al. The BioPlex Network: A Systematic Exploration of the Human Interactome. Cell 2015, 162, 425–440. [Google Scholar] [CrossRef] [Green Version]
- Landrum, M.J.; Lee, J.M.; Benson, M.; Brown, G.R.; Chao, C.; Chitipiralla, S.; Gu, B.; Hart, J.; Hoffman, D.; Jang, W.; et al. ClinVar: Improving Access to Variant Interpretations and Supporting Evidence. Nucleic Acids Res. 2018, 46, D1062–D1067. [Google Scholar] [CrossRef] [PubMed] [Green Version]
- McLaren, W.; Gil, L.; Hunt, S.E.; Riat, H.S.; Ritchie, G.R.S.; Thormann, A.; Flicek, P.; Cunningham, F. The Ensembl Variant Effect Predictor. Genome Biol. 2016, 17, 122. [Google Scholar] [CrossRef] [Green Version]
- Wang, S.; Li, W.; Liu, S.; Xu, J. RaptorX-Property: A Web Server for Protein Structure Property Prediction. Nucleic Acids Res. 2016, 44, W430–W435. [Google Scholar] [CrossRef]
- Davydov, E.V.; Goode, D.L.; Sirota, M.; Cooper, G.M.; Sidow, A.; Batzoglou, S. Identifying a High Fraction of the Human Genome to Be under Selective Constraint Using GERP++. PLoS Comput. Biol. 2010, 6, e1001025. [Google Scholar] [CrossRef] [PubMed] [Green Version]
- Anastasaki, C.; Morris, S.M.; Gao, F.; Gutmann, D.H. Children with 59-End NF1 Gene Mutations Are More Likely to Have Glioma. Neurol. Genet. 2017, 3, e192. [Google Scholar] [CrossRef] [PubMed] [Green Version]
- Stella, A.; Lastella, P.; Loconte, D.C.; Bukvic, N.; Varvara, D.; Patruno, M.; Bagnulo, R.; Lovaglio, R.; Bartolomeo, N.; Serio, G.; et al. Accurate Classification of NF1 Gene Variants in 84 Italian Patients with Neurofibromatosis Type 1. Genes 2018, 9, 216. [Google Scholar] [CrossRef] [Green Version]
- Accetturo, M.; Bartolomeo, N.; Stella, A. In-Silico Analysis of NF1 Missense Variants in Clinvar: Translating Variant Predictions into Variant Interpretation and Classification. Int. J. Mol. Sci. 2020, 21, 721. [Google Scholar] [CrossRef] [Green Version]
- Supek, F.; Miñana, B.; Valcárcel, J.; Gabaldón, T.; Lehner, B. Synonymous Mutations Frequently Act as Driver Mutations in Human Cancers. Cell 2014, 156, 1324–1335. [Google Scholar] [CrossRef] [Green Version]
- Zhang, J.; Tong, H.; Fu, X.; Zhang, Y.; Liu, J.; Cheng, R.; Liang, J.; Peng, J.; Sun, Z.; Liu, H.; et al. Molecular Characterization of NF1 and Neurofibromatosis Type 1 Genotype-Phenotype Correlations in a Chinese Population. Sci. Rep. 2015, 5, 11291. [Google Scholar] [CrossRef] [Green Version]
- Zhu, L.; Zhang, Y.; Tong, H.; Shao, M.; Gu, Y.; Du, X.; Wang, P.; Shi, L.; Zhang, L.; Bi, M.; et al. Clinical and Molecular Characterization of NF1 Patients: Single-Center Experience of 32 Patients from China. Medicine 2016, 95, e3043. [Google Scholar] [CrossRef]
- Kaufmann, D.; Müller, R.; Kenner, O.; Leistner, W.; Hein, C.; Vogel, W.; Bartelt, B. The N-Terminal Splice Product NF1-10a-2 of the NF1 Gene Codes for a Transmembrane Segment. Biochem. Biophys. Res. Commun. 2002, 294, 496–503. [Google Scholar] [CrossRef]
- Koczkowska, M.; Callens, T.; Chen, Y.; Gomes, A.; Hicks, A.D.; Sharp, A.; Johns, E.; Uhas, K.A.; Armstrong, L.; Bosanko, K.A.; et al. Clinical Spectrum of Individuals with Pathogenic NF1 Missense Variants Affecting p.Met1149, p.Arg1276, and p.Lys1423: Genotype–Phenotype Study in Neurofibromatosis Type 1. Hum. Mutat. 2020, 41, 299–315. [Google Scholar] [CrossRef] [PubMed]
- Valero, M.C.; Velasco, E.; Moreno, F.; Heméndez-chico, C. Characterization of Four Mutations in the Neurofibromatosis Type 1 Gene by Denaturing Gradient Gel Electrophoresis (DGGE). Hum. Mol. Genet. 1994, 3, 639–641. [Google Scholar] [CrossRef] [PubMed]
- Böddrich, A.; Robinson, P.N.; Schülke, M.; Buske, A.; Tinschert, S.; Nürnberg, P. New Evidence for a Mutation Hotspot in Exon 37 of the NF1 Gene. Hum. Mutat. 1997, 9, 374–377. [Google Scholar] [CrossRef]
- Ars, E.; Kruyer, H.; Morell, M.; Pros, E.; Serra, E.; Ravella, A.; Estivill, X.; Lázaro, C. Recurrent Mutations in the NF1 Gene Are Common among Neurofibromatosis Type 1 Patients. J. Med. Genet. 2003, 40, e82. [Google Scholar] [CrossRef] [Green Version]
- Mattocks, C.; Baralle, D.; Tarpey, P.; Ffrench-Constant, C.; Bobrow, M.; Whittaker, J. Automated Comparative Sequence Analysis Identifies Mutations in 89% of NF1 Patients and Confirms a Mutation Cluster in Exons 11–17 Distinct from the GAP Related Domain. J. Med. Genet. 2004, 41, e48. [Google Scholar] [CrossRef] [Green Version]


Publisher’s Note: MDPI stays neutral with regard to jurisdictional claims in published maps and institutional affiliations. |
© 2022 by the authors. Licensee MDPI, Basel, Switzerland. This article is an open access article distributed under the terms and conditions of the Creative Commons Attribution (CC BY) license (https://creativecommons.org/licenses/by/4.0/).
Share and Cite
Lois, S.; Báez-Flores, J.; Isidoro-García, M.; Lacal, J.; Triviño, J.C. Identification of Germinal Neurofibromin Hotspots. Biomedicines 2022, 10, 2044. https://doi.org/10.3390/biomedicines10082044
Lois S, Báez-Flores J, Isidoro-García M, Lacal J, Triviño JC. Identification of Germinal Neurofibromin Hotspots. Biomedicines. 2022; 10(8):2044. https://doi.org/10.3390/biomedicines10082044
Chicago/Turabian StyleLois, Sergio, Juan Báez-Flores, María Isidoro-García, Jesus Lacal, and Juan Carlos Triviño. 2022. "Identification of Germinal Neurofibromin Hotspots" Biomedicines 10, no. 8: 2044. https://doi.org/10.3390/biomedicines10082044