
Biological Sensing of Nitric Oxide in Macrophages and Atherosclerosis Using a Ruthenium-Based Sensor

 , , ,
, , ,
Abstract
:
1. Introduction
2. Materials and Methods
2.1. Ruthenium Based NO Sensor (Ru-NO)
2.2. In Vitro Studies
2.2.1. Human Monocytes and Macrophages
2.2.2. Bone Marrow Derived Mouse Macrophages (BMDMs)
2.3. In Vivo Studies in Mice
2.3.1. Peritoneal Macrophages
2.3.2. Murine Model of Atherosclerosis
2.4. Ex Vivo Assessment of Ru-NO Sensor Uptake
2.4.1. Aorta, Spleen, and Liver Cells
2.4.2. Blood
2.5. Clinical Blood Samples
2.6. Statistical Analysis
3. Results
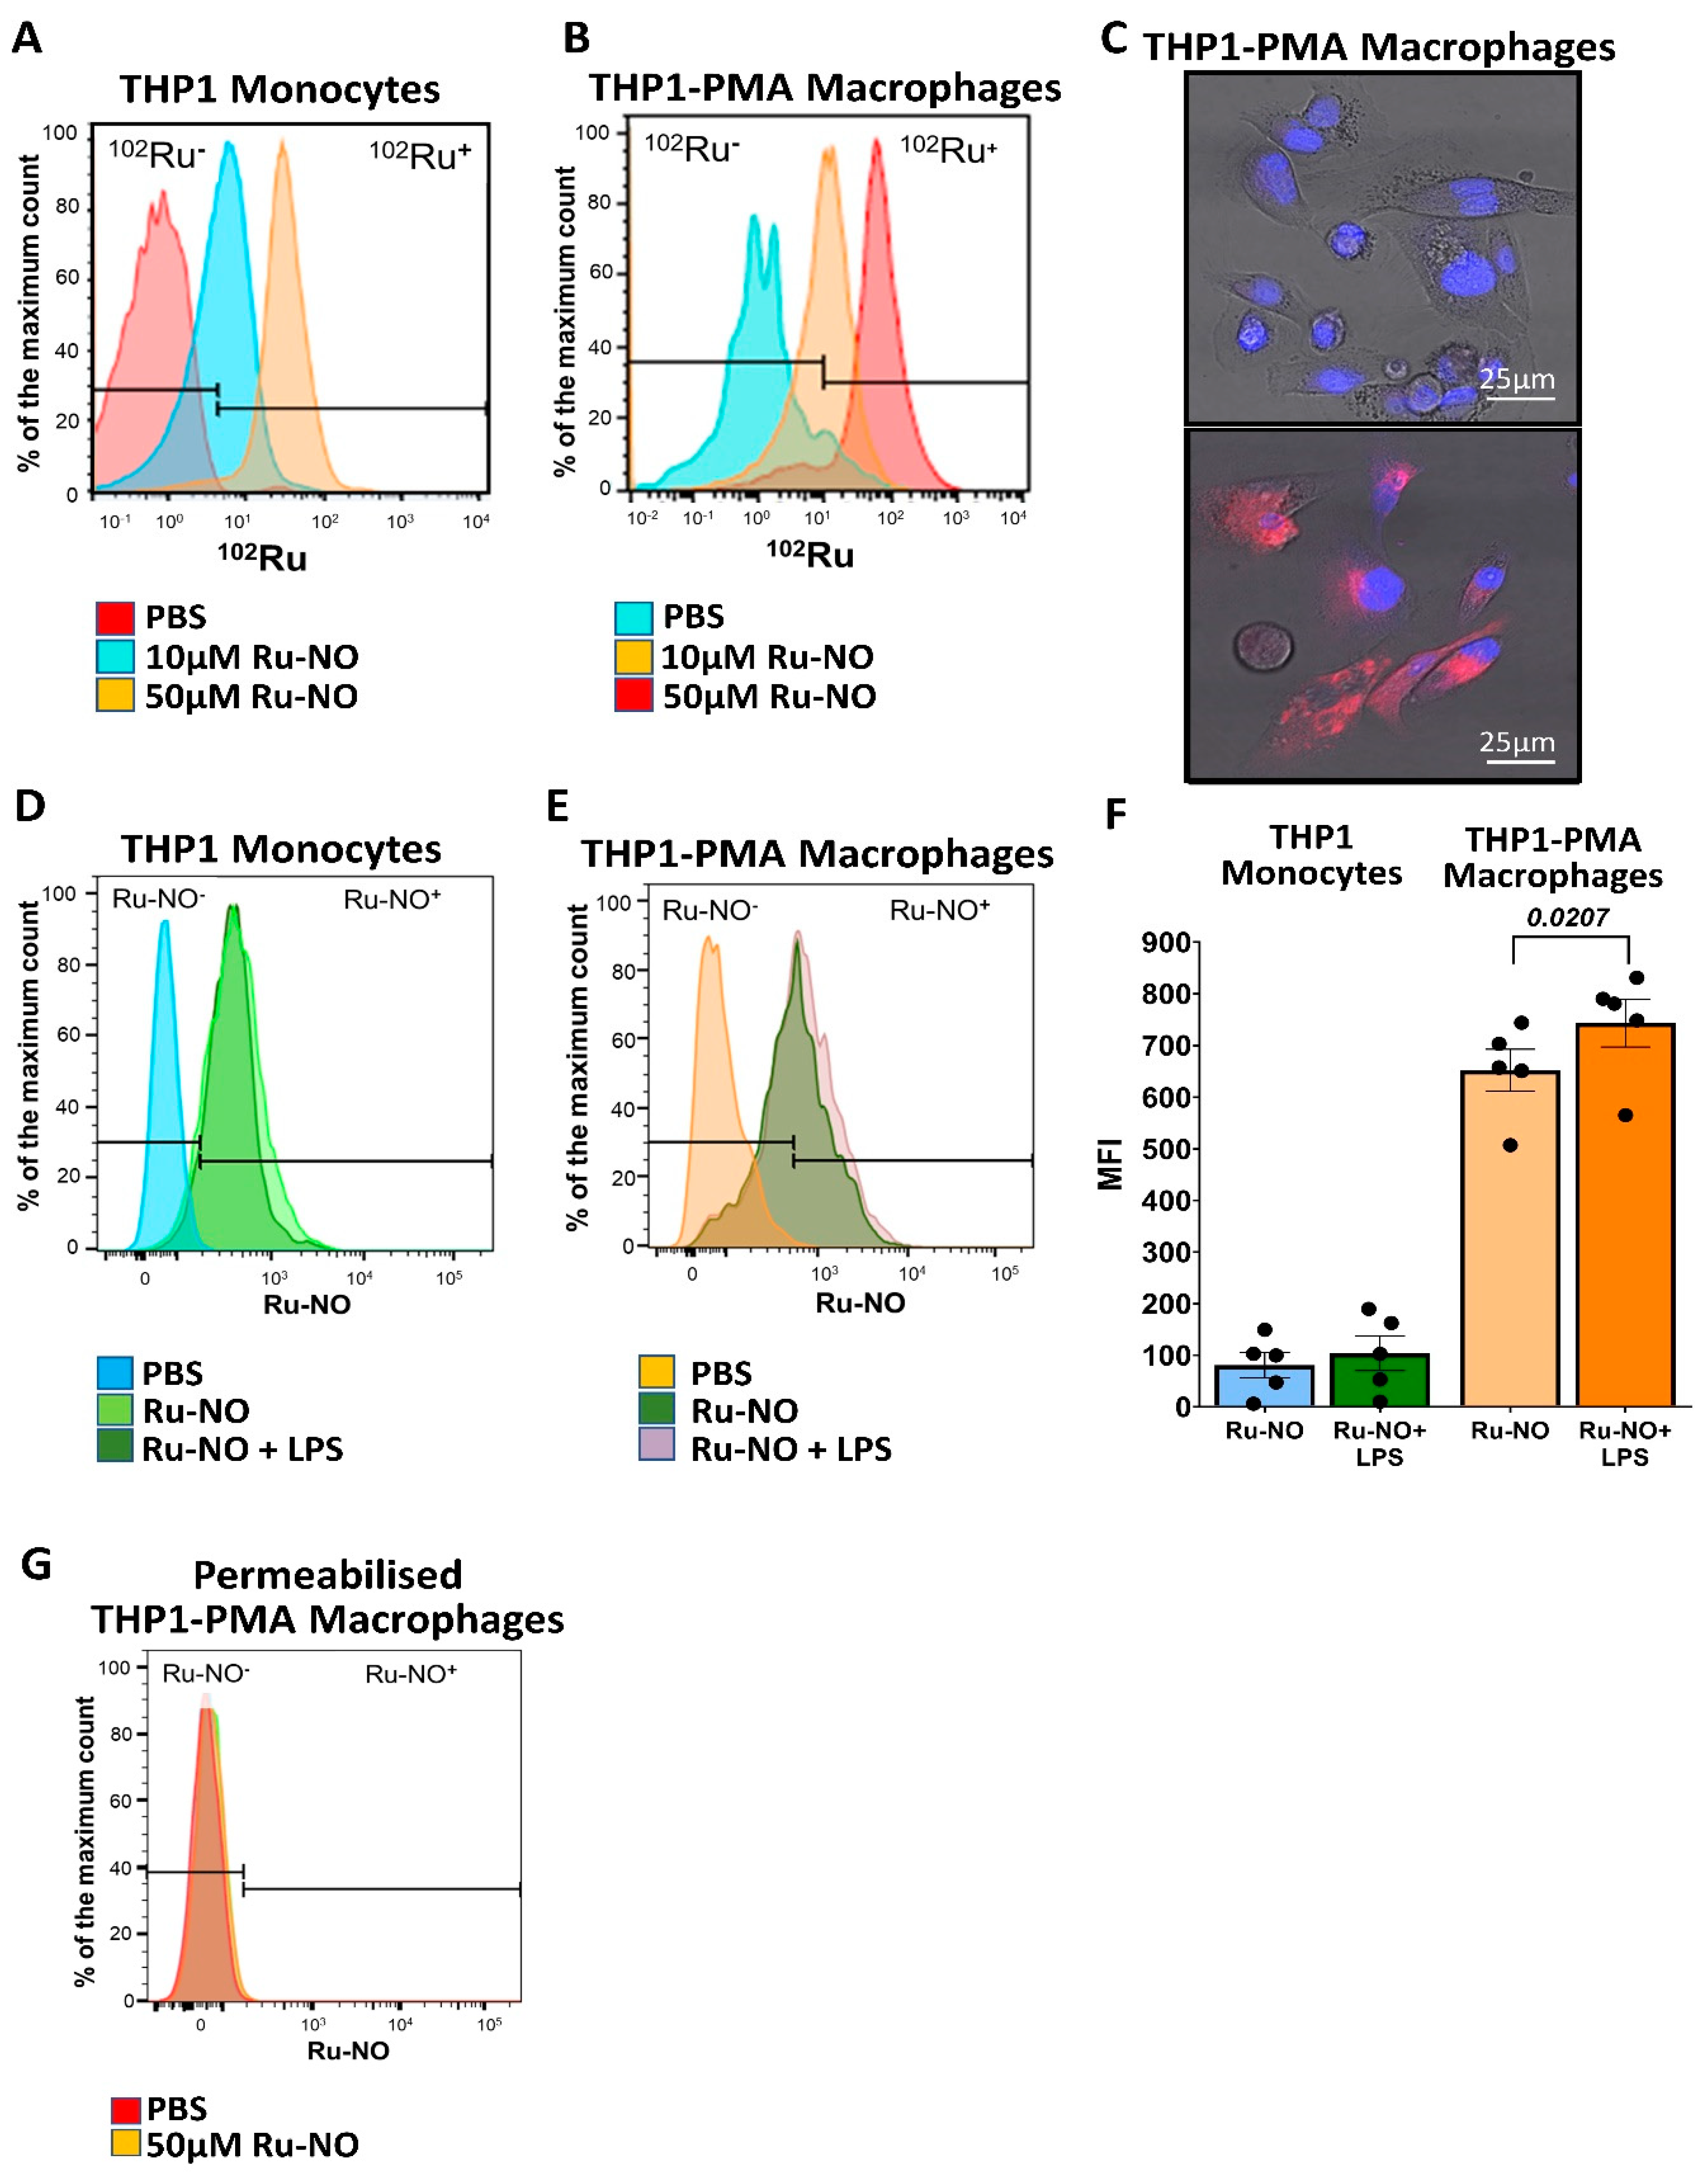
3.1. Ru-NO Is Detectable In Vitro in THP1 Monocytes and Macrophages
3.2. Detection of Ru-NO in Murine Macrophages
3.3. In Vivo Toxicity, and Detection and Distribution of Ru-NO
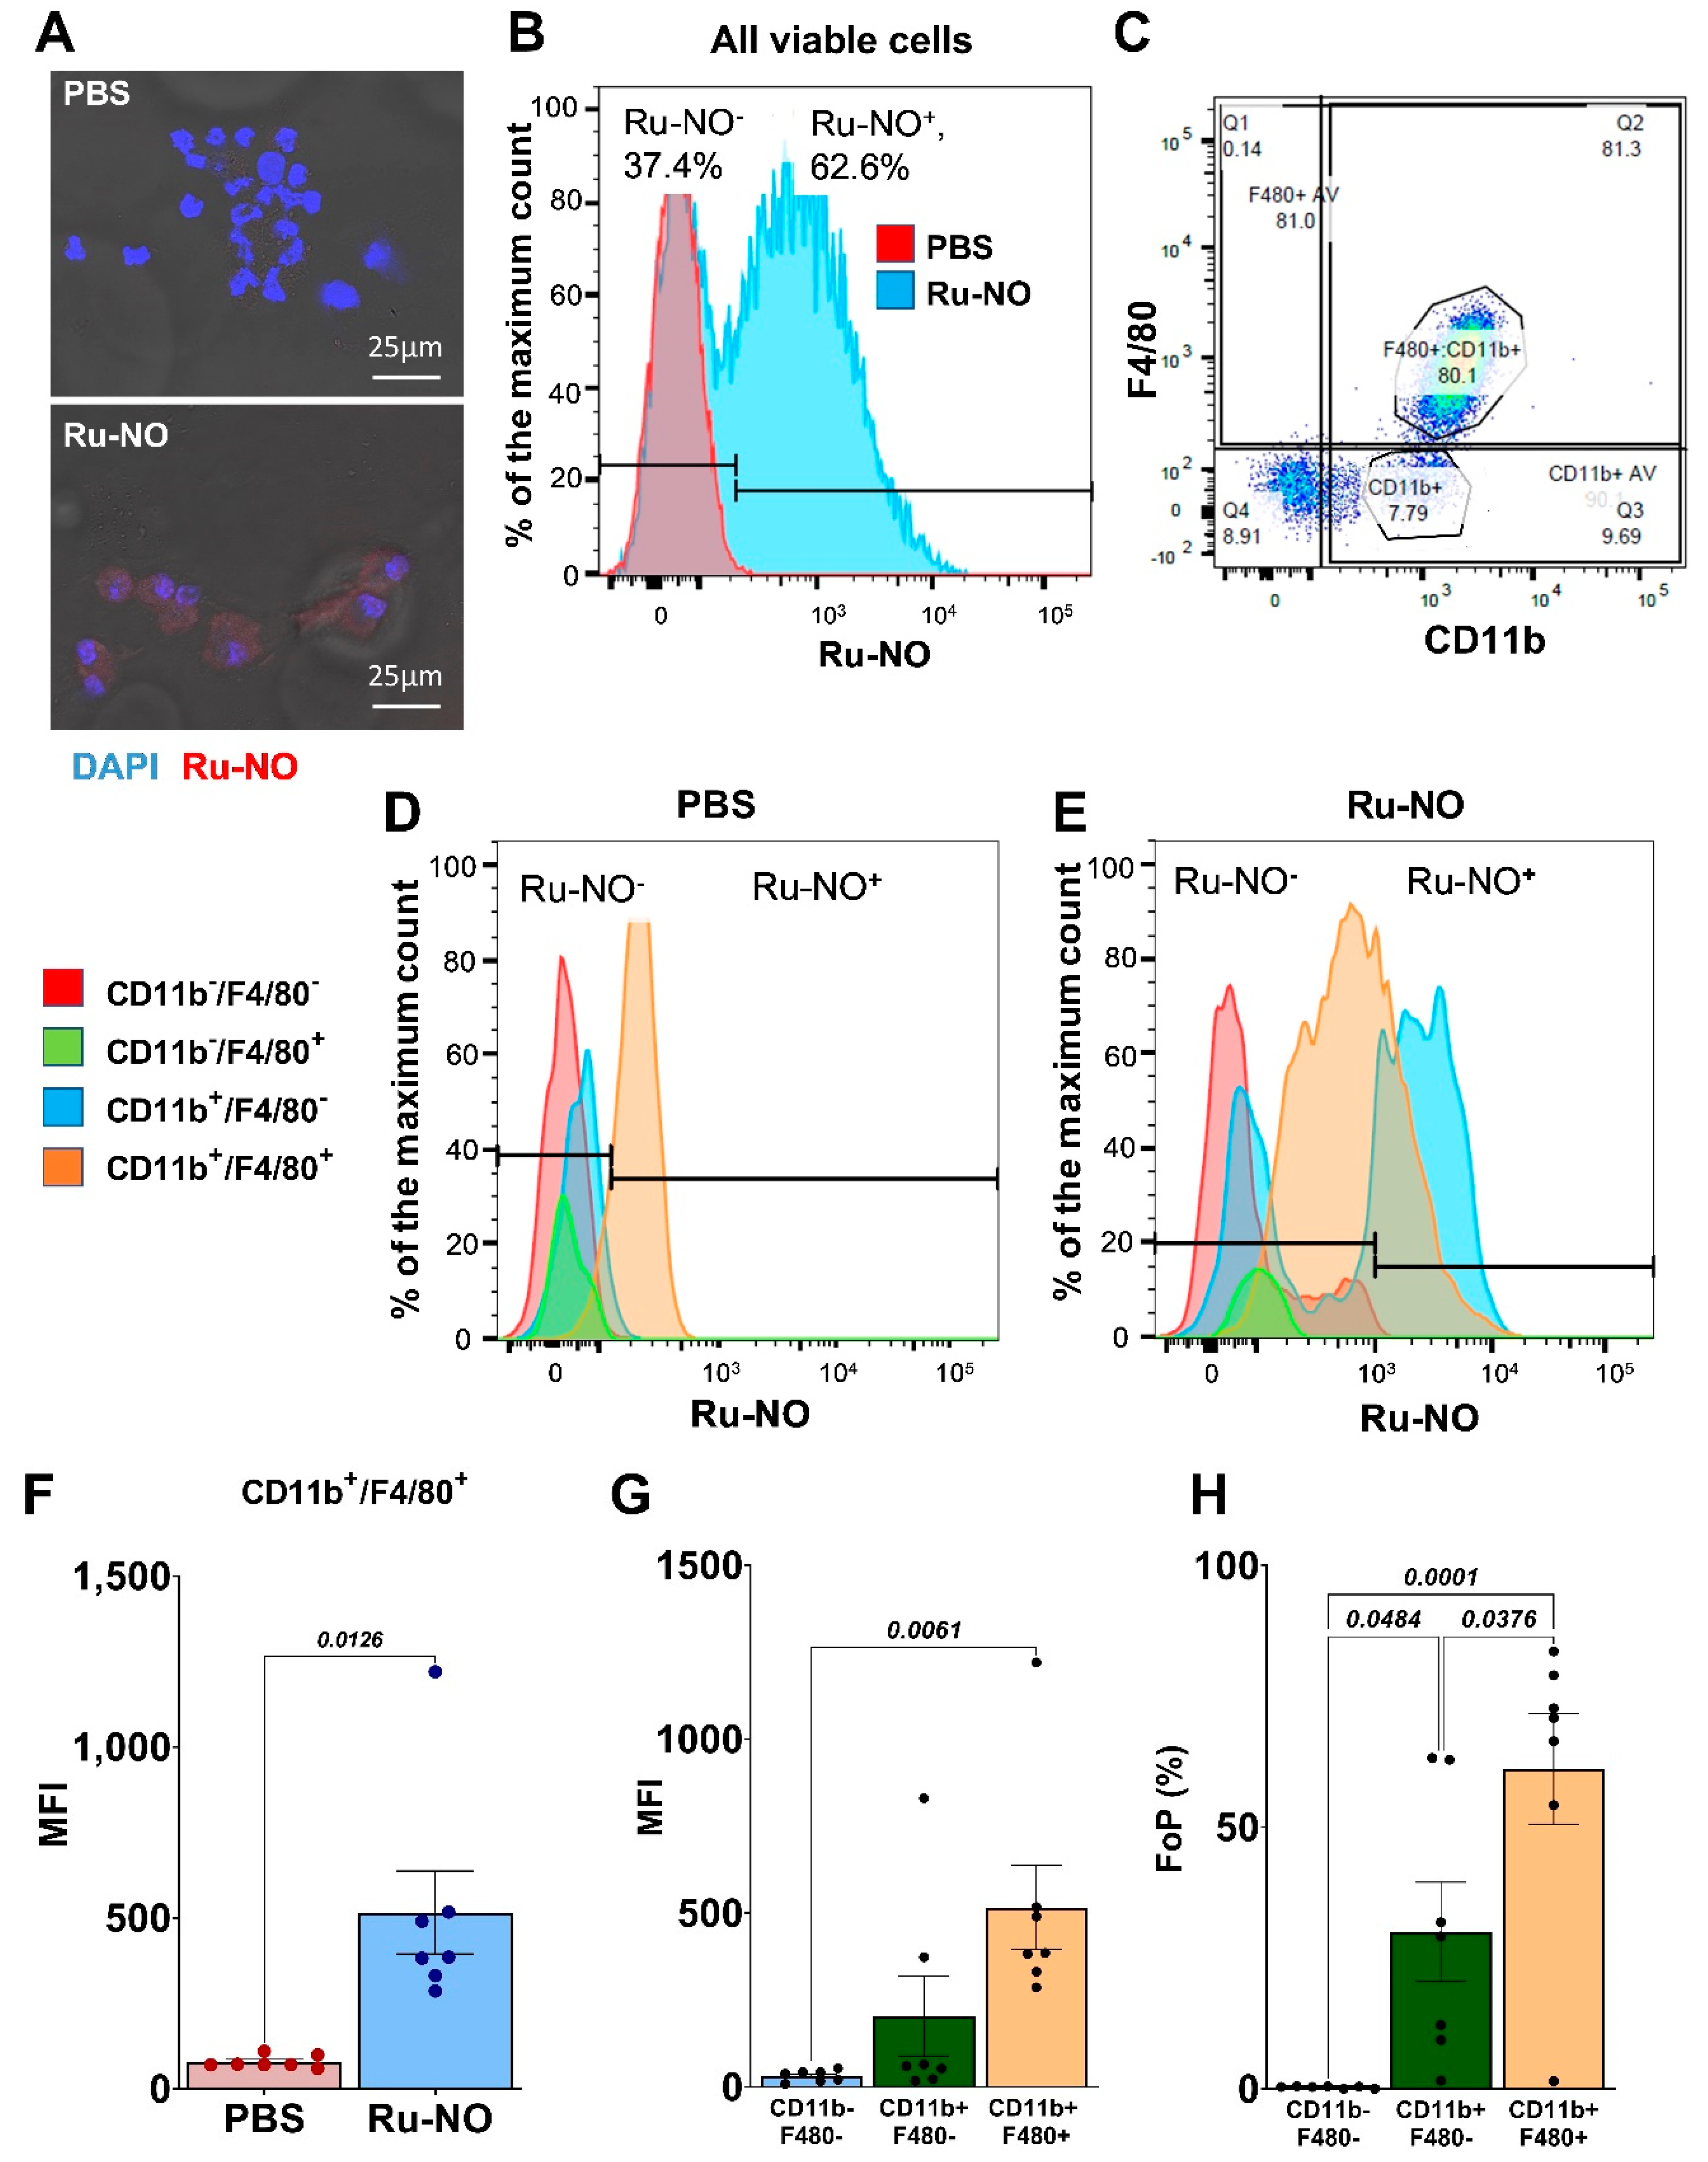
3.4. Detection of Ru-NO in Peritoneal Macrophages
3.5. Ru-NO in In Vivo Atherosclerotic Plaque Macrophages
3.6. Ru-NO in Ex Vivo Cell Suspensions of Atherosclerotic Mice
3.7. Ru-NO in Mouse Blood in Atherosclerosis
3.8. Ru-NO Changes in Clinical Blood Samples
4. Discussion
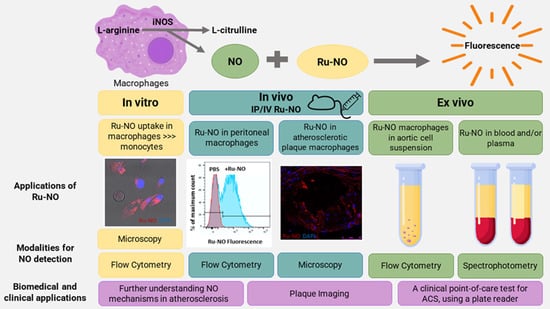
5. Conclusions
Supplementary Materials
Author Contributions
Funding
Institutional Review Board Statement
Informed Consent Statement
Data Availability Statement
Conflicts of Interest
References
- Infante, T.; Costa, D.; Napoli, C. Novel Insights Regarding Nitric Oxide and Cardiovascular Diseases. Angiology 2021, 72, 411–425. [Google Scholar] [CrossRef] [PubMed]
- Farah, C.; Michel, L.Y.M.; Balligand, J.-L. Nitric oxide signalling in cardiovascular health and disease. Nat. Rev. Cardiol. 2018, 15, 292–316. [Google Scholar] [CrossRef] [PubMed]
- Förstermann, U.; Münzel, T. Endothelial nitric oxide synthase in vascular disease: From marvel to menace. Circulation 2006, 113, 1708–1714. [Google Scholar] [CrossRef] [PubMed] [Green Version]
- Luoma, J.S.; Strålin, P.; Marklund, S.L.; Hiltunen, T.P.; Särkioja, T.; Ylä-Herttuala, S. Expression of extracellular SOD and iNOS in macrophages and smooth muscle cells in human and rabbit atherosclerotic lesions: Colocalization with epitopes characteristic of oxidized LDL and peroxynitrite-modified proteins. Arterioscler. Thromb. Vasc. Biol. 1998, 18, 157–167. [Google Scholar] [CrossRef] [Green Version]
- Vico, T.C.; Marchini, T.; Ginart, S.; Lorenzetti, M.A.; Areán, J.S.A.; Calabró, V.; Garcés, M.; Ferrero, M.C.; Mazo, T.; D’Annunzio, V.; et al. Mitochondrial bioenergetics links inflammation and cardiac contractility in endotoxemia. Basic Res. Cardiol. 2019, 114, 38. [Google Scholar] [CrossRef]
- Flynn, M.C.; Pernes, G.; Lee, M.K.S.; Nagareddy, P.R.; Murphy, A.J. Monocytes, Macrophages, and Metabolic Disease in Atherosclerosis. Front. Pharmacol. 2019, 10, 666. [Google Scholar] [CrossRef] [PubMed] [Green Version]
- Ceron, C.S.; do Vale, G.T.; Simplicio, J.A.; Ricci, S.T.; De Martinis, B.S.; de Freitas, A.; Tirapelli, C.R. Chronic ethanol consumption increases vascular oxidative stress and the mortality induced by sub-lethal sepsis: Potential role of iNOS. Eur. J. Pharmacol. 2018, 825, 39–47. [Google Scholar] [CrossRef]
- Hansson, G.K.; Libby, P.; Tabas, I. Inflammation and plaque vulnerability. J. Intern. Med. 2015, 278, 483–493. [Google Scholar] [CrossRef]
- Bäck, M.; Yurdagul, A., Jr.; Tabas, I.; Öörni, K.; Kovanen, P.T. Inflammation and its resolution in atherosclerosis: Mediators and therapeutic opportunities. Nat. Rev. Cardiol. 2019, 16, 389–406. [Google Scholar] [CrossRef]
- Chen, K.; Pittman, R.N.; Popel, A.S. Nitric oxide in the vasculature: Where does it come from and where does it go? A quantitative perspective. Antioxid. Redox Signal. 2008, 10, 1185–1198. [Google Scholar] [CrossRef] [Green Version]
- Vidanapathirana, A.K.; Psaltis, P.J.; Bursill, C.A.; Abell, A.D.; Nicholls, S.J. Cardiovascular bioimaging of nitric oxide: Achievements, challenges, and the future. Med. Res. Rev. 2021, 41, 435–463. [Google Scholar] [CrossRef]
- Bryan, N.S.; Grisham, M.B. Methods to detect nitric oxide and its metabolites in biological samples. Free Radic. Biol. Med. 2007, 43, 645–657. [Google Scholar] [CrossRef] [Green Version]
- Reinhardt, C.J.; Zhou, E.Y.; Jorgensen, M.D.; Partipilo, G.; Chan, J. A Ratiometric Acoustogenic Probe for in Vivo Imaging of Endogenous Nitric Oxide. J. Am. Chem. Soc. 2018, 140, 1011–1018. [Google Scholar] [CrossRef] [PubMed]
- Zhang, R.; Ye, Z.; Wang, G.; Zhang, W.; Yuan, J. Development of a ruthenium(II) complex based luminescent probe for imaging nitric oxide production in living cells. Chem. A Eur. J. 2010, 16, 6884–6891. [Google Scholar] [CrossRef]
- Vidanapathirana, A.K.; Pullen, B.J.; Zhang, R.; Duong, M.; Goyne, J.M.; Zhang, X.; Bonder, C.S.; Abell, A.D.; Bursill, C.A.; Nicholls, S.J.; et al. A Novel Ruthenium-based Molecular Sensor to Detect Endothelial Nitric Oxide. Sci. Rep. 2019, 9, 1720. [Google Scholar] [CrossRef] [PubMed]
- Daigneault, M.; Preston, J.A.; Marriott, H.M.; Whyte, M.K.; Dockrell, D.H. The identification of markers of macrophage differentiation in PMA-stimulated THP-1 cells and monocyte-derived macrophages. PLoS ONE 2010, 5, e8668. [Google Scholar] [CrossRef]
- Shin, J.-S.; Choi, H.-E.; Seo, S.; Choi, J.-H.; Baek, N.-I.; Lee, K.-T. Berberine Decreased Inducible Nitric Oxide Synthase mRNA Stability through Negative Regulation of Human Antigen R in Lipopolysaccharide-Induced Macrophages. J. Pharmacol. Exp. Ther. 2016, 358, 3–13. [Google Scholar] [CrossRef] [PubMed]
- Bailey, J.D.; Shaw, A.; McNeill, E.; Nicol, T.; Diotallevi, M.; Chuaiphichai, S.; Patel, J.; Hale, A.; Channon, K.M.; Crabtree, M.J. Isolation and culture of murine bone marrow-derived macrophages for nitric oxide and redox biology. Nitric Oxide 2020, 100–101, 17–29. [Google Scholar] [CrossRef] [PubMed]
- Ray, A.; Dittel, B.N. Isolation of Mouse Peritoneal Cavity Cells. JoVE 2010, 35, 1488. [Google Scholar] [CrossRef]
- Cáceres, L.; Paz, M.L.; Garcés, M.; Calabró, V.; Magnani, N.D.; Martinefski, M.; Adami, P.V.M.; Caltana, L.; Tasat, D.; Morelli, L.; et al. NADPH oxidase and mitochondria are relevant sources of superoxide anion in the oxinflammatory response of macrophages exposed to airborne particulate matter. Ecotoxicol. Environ. Saf. 2020, 205, 111186. [Google Scholar] [CrossRef] [PubMed]
- Uribe-Querol, E.; Rosales, C. Phagocytosis: Our Current Understanding of a Universal Biological Process. Front. Immunol. 2020, 11, 1066. [Google Scholar] [CrossRef]
- de Gaetano, M.; Crean, D.; Barry, M.; Belton, O. M1- and M2-Type Macrophage Responses Are Predictive of Adverse Outcomes in Human Atherosclerosis. Front. Immunol. 2016, 7, 275. [Google Scholar] [CrossRef] [Green Version]
- Chistiakov, D.A.; Bobryshev, Y.V.; Orekhov, A.N. Changes in transcriptome of macrophages in atherosclerosis. J. Cell. Mol. Med. 2015, 19, 1163–1173. [Google Scholar] [CrossRef] [PubMed]
- Sadek, M.M.; Barzegar Amiri Olia, M.; Nowell, C.J.; Barlow, Ν.; Schiesser, C.H.; Nicholson, S.E.; Norton, R.S. Characterisation of a novel coumarin-based fluorescent probe for monitoring nitric oxide production in macrophages. Bioorg. Med. Chem. 2017, 25, 5743–5748. [Google Scholar] [CrossRef]
- Ramírez-García, G.; Gutiérrez-Granados, S.; Gallegos-Corona, M.A.; Palma-Tirado, L.; d’Orlyé, F.; Varenne, A.; Mignet, N.; Richard, C.; Martínez-Alfaro, M. Long-term toxicological effects of persistent luminescence nanoparticles after intravenous injection in mice. Int. J. Pharm. 2017, 532, 686–695. [Google Scholar] [CrossRef] [PubMed]
- Iverson, N.M.; Barone, P.W.; Shandell, M.; Trudel, L.J.; Sen, S.; Sen, F.; Ivanov, V.; Atolia, E.; Farias, E.; McNicholas, T.P.; et al. In vivo biosensing via tissue-localizable near-infrared-fluorescent single-walled carbon nanotubes. Nat. Nanotechnol. 2013, 8, 873–880. [Google Scholar] [CrossRef] [Green Version]
- Terashima, M.; Ehara, S.; Yang, E.; Kosuge, H.; Tsao, P.S.; Quertermous, T.; Contag, C.H.; McConnell, M.V. In vivo bioluminescence imaging of inducible nitric oxide synthase gene expression in vascular inflammation. Mol. Imaging Biol. MIB Off. Publ. Acad. Mol. Imaging 2011, 13, 1061–1066. [Google Scholar] [CrossRef] [Green Version]
- Giannetto, A.; Esposito, E.; Lanza, M.; Oliva, S.; Riolo, K.; Di Pietro, S.; Abbate, J.M.; Briguglio, G.; Cassata, G.; Cicero, L.; et al. Protein Hydrolysates from Anchovy (Engraulis encrasicolus) waste: In Vitro and in Vivo Biological Activities. Mar. Drugs 2020, 18, 86. [Google Scholar] [CrossRef]
- Abbate, J.M.; Macrì, F.; Arfuso, F.; Iaria, C.; Capparucci, F.; Anfuso, C.; Ieni, A.; Cicero, L.; Briguglio, G.; Lanteri, G. Anti-atherogenic effect of 10% supplementation of Anchovy (Engraulis encrasicolus) Waste Protein Hydrolysates in ApoE-Deficient Mice. Nutrients 2021, 13, 2137. [Google Scholar] [CrossRef] [PubMed]
- Kibbe, M.; Billiar, T.; Tzeng, E. Inducible nitric oxide synthase and vascular injury. Cardiovasc. Res. 1999, 43, 650–657. [Google Scholar] [CrossRef]
- Ally, A.; Powell, I.; Ally, M.M.; Chaitoff, K.; Nauli, S.M. Role of neuronal nitric oxide synthase on cardiovascular functions in physiological and pathophysiological states. Nitric Oxide 2020, 102, 52–73. [Google Scholar] [CrossRef]
- Weitzberg, E.; Lundberg, J.O. Nonenzymatic nitric oxide production in humans. Nitric Oxide 1998, 2, 1–7. [Google Scholar] [CrossRef] [PubMed]
- Bolli, R. Cardioprotective Function of Inducible Nitric Oxide Synthase and Role of Nitric Oxide in Myocardial Ischemia and Preconditioning: An Overview of a Decade of Research. J. Mol. Cell. Cardiol. 2001, 33, 1897–1918. [Google Scholar] [CrossRef] [PubMed] [Green Version]
- Erdmann, J.; Stark, K.; Esslinger, U.B.; Rumpf, P.M.; Koesling, D.; de Wit, C.; Kaiser, F.J.; Braunholz, D.; Medack, A.; Fischer, M.; et al. Dysfunctional nitric oxide signalling increases risk of myocardial infarction. Nature 2013, 504, 432–436. [Google Scholar] [CrossRef]
- Gliozzi, M.; Scicchitano, M.; Bosco, F.; Musolino, V.; Carresi, C.; Scarano, F.; Maiuolo, J.; Nucera, S.; Maretta, A.; Paone, S.; et al. Modulation of Nitric Oxide Synthases by Oxidized LDLs: Role in Vascular Inflammation and Atherosclerosis Development. Int. J. Mol. Sci. 2019, 20, 3294. [Google Scholar] [CrossRef] [PubMed] [Green Version]
- Eccleston, H.B.; Andringa, K.K.; Betancourt, A.M.; King, A.L.; Mantena, S.K.; Swain, T.M.; Tinsley, H.N.; Nolte, R.N.; Nagy, T.R.; Abrams, G.A.; et al. Chronic exposure to a high-fat diet induces hepatic steatosis, impairs nitric oxide bioavailability, and modifies the mitochondrial proteome in mice. Antioxid. Redox Signal. 2011, 15, 447–459. [Google Scholar] [CrossRef] [Green Version]


Publisher’s Note: MDPI stays neutral with regard to jurisdictional claims in published maps and institutional affiliations. |
© 2022 by the authors. Licensee MDPI, Basel, Switzerland. This article is an open access article distributed under the terms and conditions of the Creative Commons Attribution (CC BY) license (https://creativecommons.org/licenses/by/4.0/).
Share and Cite
Vidanapathirana, A.K.; Goyne, J.M.; Williamson, A.E.; Pullen, B.J.; Chhay, P.; Sandeman, L.; Bensalem, J.; Sargeant, T.J.; Grose, R.; Crabtree, M.J.; et al. Biological Sensing of Nitric Oxide in Macrophages and Atherosclerosis Using a Ruthenium-Based Sensor. Biomedicines 2022, 10, 1807. https://doi.org/10.3390/biomedicines10081807
Vidanapathirana AK, Goyne JM, Williamson AE, Pullen BJ, Chhay P, Sandeman L, Bensalem J, Sargeant TJ, Grose R, Crabtree MJ, et al. Biological Sensing of Nitric Oxide in Macrophages and Atherosclerosis Using a Ruthenium-Based Sensor. Biomedicines. 2022; 10(8):1807. https://doi.org/10.3390/biomedicines10081807
Chicago/Turabian StyleVidanapathirana, Achini K., Jarrad M. Goyne, Anna E. Williamson, Benjamin J. Pullen, Pich Chhay, Lauren Sandeman, Julien Bensalem, Timothy J. Sargeant, Randall Grose, Mark J. Crabtree, and et al. 2022. "Biological Sensing of Nitric Oxide in Macrophages and Atherosclerosis Using a Ruthenium-Based Sensor" Biomedicines 10, no. 8: 1807. https://doi.org/10.3390/biomedicines10081807