Article

Baseline Imaging Derived Predictive Factors of Response Following [177Lu]Lu-PSMA-617 Therapy in Salvage Metastatic Castration-Resistant Prostate Cancer: A Lesion- and Patient-Based Analysis

by
Esmée C. A. van der Sar
1,*,
Adinda J. S. Kühr
1,
Sander C. Ebbers
1,
Andrew M. Henderson
2,
Bart de Keizer
1,
Marnix G. E. H. Lam
1 and
Arthur J. A. T. Braat
1
1
Department of Radiology and Nuclear Medicine, University Medical Center Utrecht, 3584 CX Utrecht, The Netherlands
2
Mercy Radiology, Auckland Central, Auckland 1010, New Zealand
*
Author to whom correspondence should be addressed.
Biomedicines 2022, 10(7), 1575; https://doi.org/10.3390/biomedicines10071575
Submission received: 5 June 2022 / Revised: 24 June 2022 / Accepted: 26 June 2022 / Published: 1 July 2022

Abstract

:
Earlier studies have mostly identified pre-therapeutic clinical and laboratory parameters for the prediction of treatment response to [177Lu]Lu-PSMA-617 in metastatic castration resistant prostate cancer patients (mCRPC). The current study investigated whether imaging-derived factors on baseline [68Ga]Ga-PSMA-11 PET/CT can potentially predict the response after two cycles of [177Lu]Lu-PSMA-617 treatment, in a lesion- and patient-based analysis in men with mCRPC. Included patients had histologically proven mCRPC and a [68Ga]Ga-PSMA-11 PET/CT before and after two cycles of [177Lu]Lu-PSMA-617 treatment. The imaging-based response was evaluated on lesion-level (standardized uptake value (SUV) reduction) and patient-level (total lesion PSMA (TL-PSMA) reduction). In the lesion-level analysis, a clear relationship was found between SUVpeak/max and the imaging-based response to [68Ga]Ga-PSMA-11 PET/CT (most avid lesion SUVpeak/max ≥ 30% reduction) (p < 0.001), with no significant difference in cut-off values between different sites of metastases (i.e., lymph node, bone or visceral metastasis). In patient-level analysis, baseline PSA and SUVpeak values of most avid metastasis were significantly associated with imaging-based response (TL-PSMA ≥ 30% reduction) (p = 0.019 and p = 0.015). In pre-treatment with [68Ga]Ga-PSMA-11 PET/CT, a clear accumulation-response relationship in lesion-level was found for SUVpeak/max in men with mCRPC receiving two cycles of [177Lu]Lu-PSMA-617 treatment. The SUVpeak of the most avid lesion was the only image-derived factor predictive of the imaging-based response at the patient-level.

1. Introduction

Worldwide, prostate cancer was the third most common diagnosed malignancy in 2020 [1]. The survival rates of prostate cancer are subject to the degree of metastasis. The five-year survival of localized prostate cancer is 100%, however, it falls rapidly to 31% in patients with distant metastases [2].
In the last decade, new treatment options for patients with metastatic, castration resistant prostate cancer (mCRPC) became available, including novel androgen axis drugs (e.g., abiraterone, enzalutamide) and chemotherapy (i.e., docetaxel and cabazitaxel). More recently radioligand therapy with lutetium-177 prostate specific membrane antigen ([177Lu]Lu-PSMA-617) emerged as a promising treatment for advanced prostate cancer [3]. Several studies have demonstrated the safety and efficacy (extended overall survival and improved quality of life) of [177Lu]Lu-PSMA-617 treatment in mCRPC patients [3,4,5]. Although the majority (68%-75%) of the metastatic prostate cancer patients receiving [177Lu]Lu-PSMA-617 treatment showed some degree of response, some did not benefit [6].
Earlier studies mostly identified pre-therapeutic clinical and laboratory parameters for the prediction of treatment response (defined as prostate specific antigen (PSA) change) [7,8,9]. Only a sparse literature exists on imaging-derived predictors (defined by pre-treatment with [68Ga]Ga-PSMA-11 PET/CT), which has showed that low SUVmax and SUVmean values were negative predictors for treatment response [10,11]. Unfortunately, these studies only evaluated treatment response on the patient-level by evaluating biochemical changes (PSA). The use of PSA reduction is the most commonly used in clinic due to its simplicity, however for response evaluation PSA is still under debate and cannot be used as response criterion in a per-lesion analysis [12]. This study investigated whether imaging-derived factors on baseline [68Ga]Ga-PSMA-11 PET/CT can potentially predict the response to [177Lu]Lu-PSMA-617 treatment, in a lesion- and patient-level analysis, in men with mCRPC.

2. Materials and Methods

2.1. Population

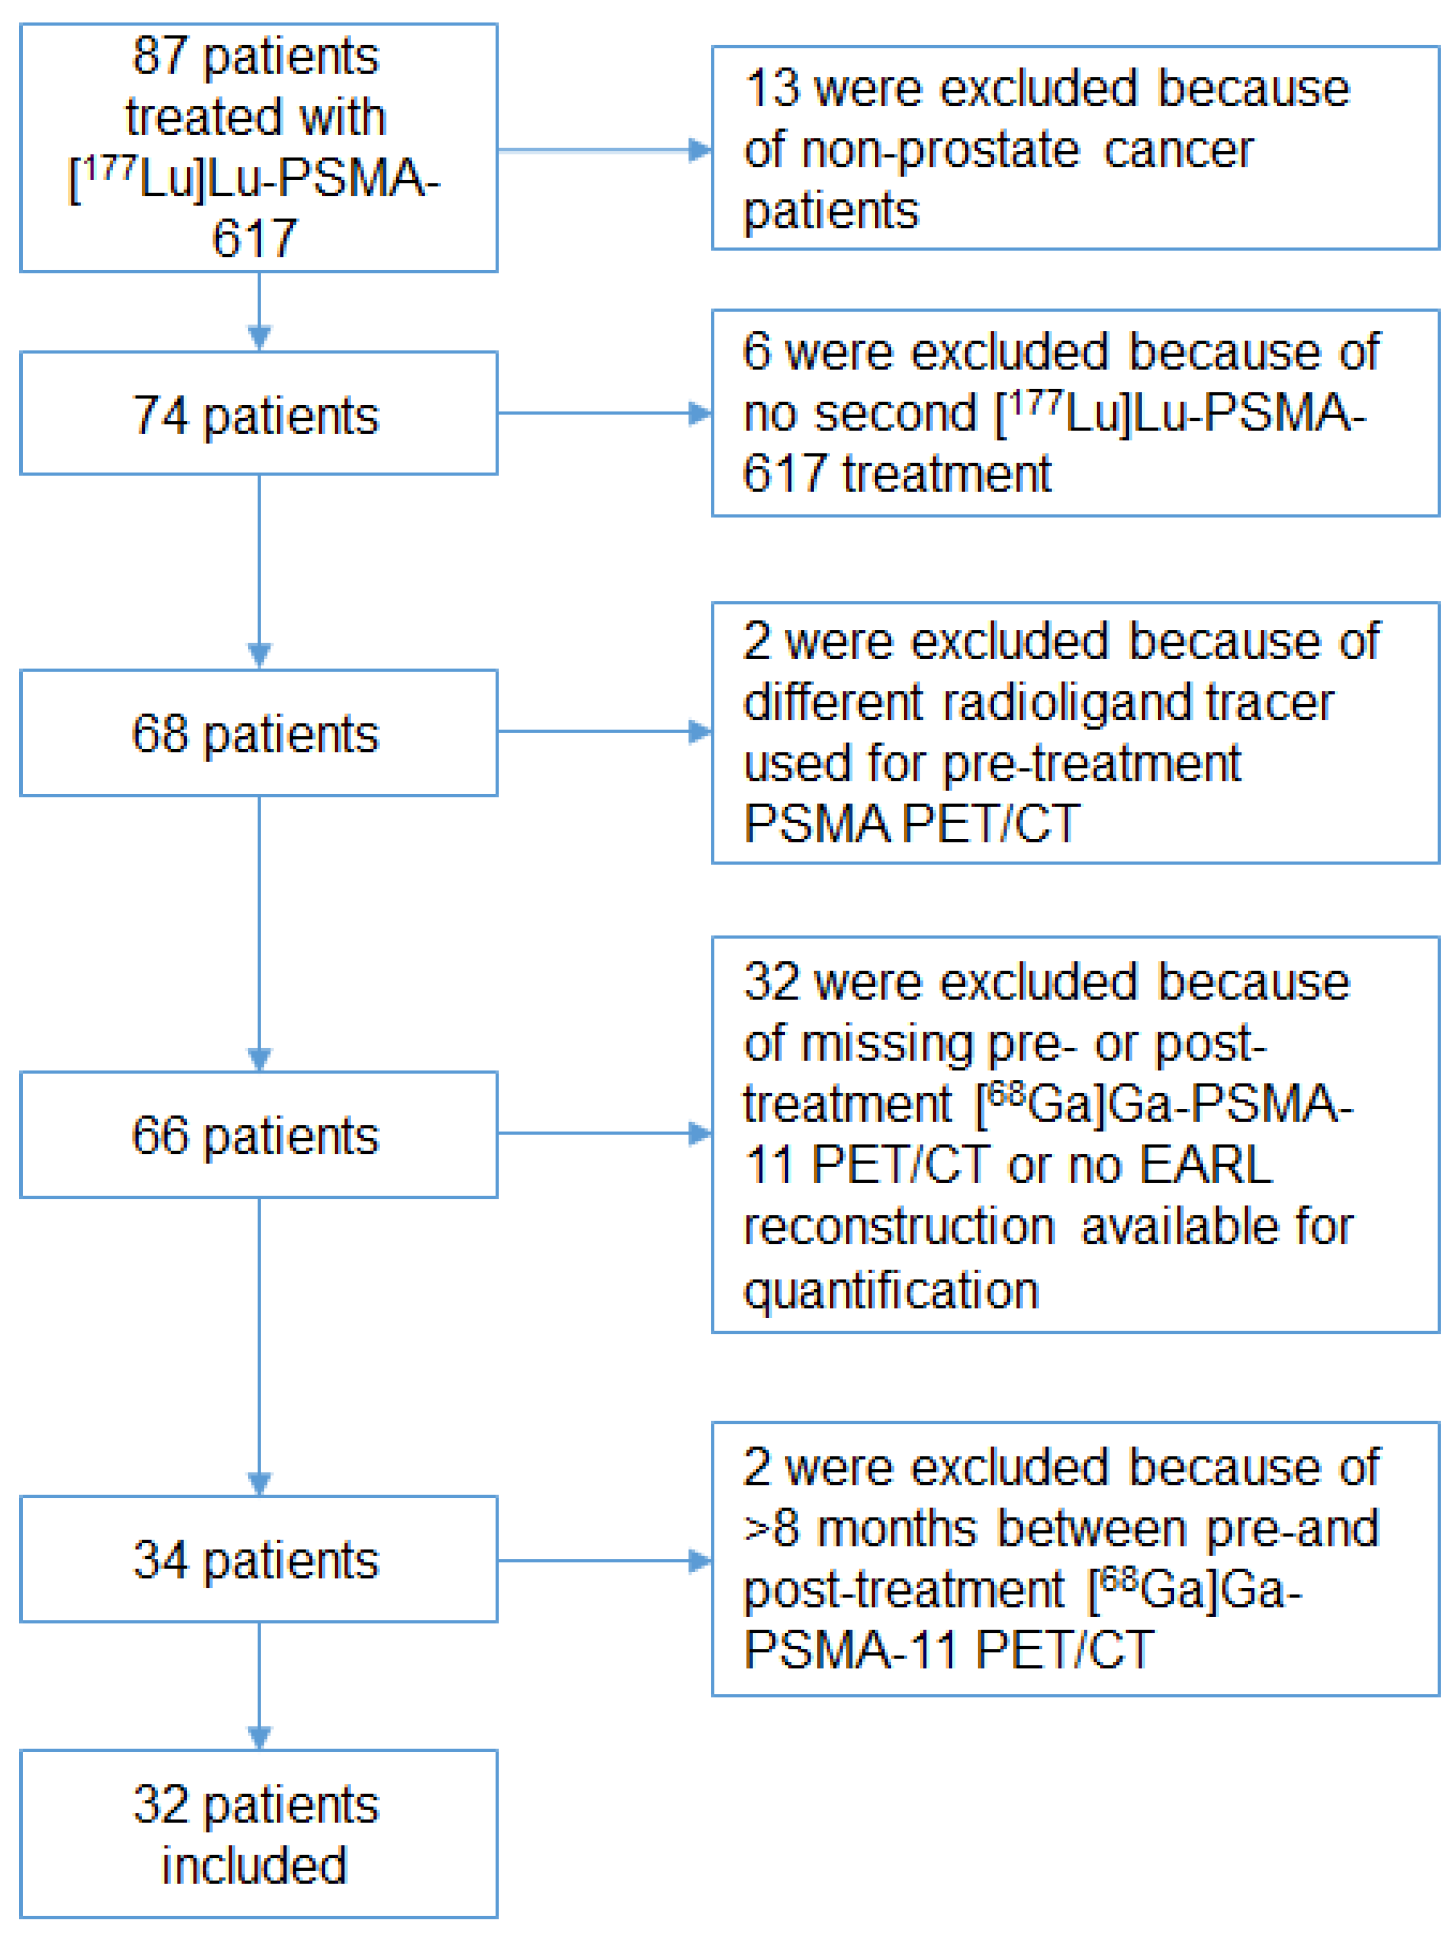
Patients referred for and treated with [177Lu]Lu-PSMA-617 were identified retrospectively from a single center from March 2017 to November 2019. Patients were included if they had histologically proven mCRPC and had a [68Ga]Ga-PSMA-11 PET/CT before and after two cycles of [177Lu]Lu-PSMA-617 treatment. The reason why we choose to analyze after two cycles is based on the findings of Ahmadzadehfar et al., who showed that response (PSA decline ≥ 50%) is only or mostly seen after the second cycle of [177Lu]Lu-PSMA-617 treatment [13].
Patients were excluded if the interval between the baseline and post treatment [68Ga]Ga-PSMA-11 PET/CT was more than eight months. Blood testing was performed at the time of admission. The PSMA-617 ligand was obtained from ABX GmbH, Radeberg, Germany. A total of 6.0 or 7.4 GBq [177Lu]Lu-PSMA-617 per 40 to 250 μg peptide was administered intravenously for each cycle, with a planned interval of six weeks.
The need for informed consent was waived by the institutions medical ethics committee for this retrospective study.

2.2. Image Acquisition and Reconstruction

Sixty minutes after intravenous administration of 1.5–2.0 MBq/kg [68Ga]Ga-PSMA-11 the imaging was performed from the skull vertex to the mid-thigh (Biograph mCT scanner, Siemens, Erlangen, Germany).
The PET reconstruction was obtained following the EANM Research Ltd. (EARL), Vienna, Austria recommendations although its use for [68Ga]Ga-PSMA-11 PET/CT interpretation has not been validated yet [14,15]. The [68Ga]Ga-PSMA-11 accumulation was corrected for lean body mass (in SUVlbm,peak*cm3) [16].

2.3. Imaging Analysis

Syngo.via-software (Siemens version 05.01, Erlangen, Germany) was used to establish quantitative image analysis. Based on PERCIST, relevant volumes of interest were (semi)automatically segmented if the standardized uptake value of peak (SUVpeak) was greater than the threshold set by a 3 cm cylindrical volume of interest (VOI) in the aorta with a threshold of 1.5 × aorta peak + 2 × standard deviation [17]. The activity in the blood pool has been shown to be a well-grounded reference region for [68Ga]Ga-PSMA-11 imaging interpretation [18].
Manual adoption was needed if single tumor lesions and organs were not automatically divided based on the set PERCIST criteria.
Segmentations smaller than 0.3 mL where disregarded.
The Syngo.via software only allowed visual validation of a maximum of 50 lesions on the [68Ga]Ga-PSMA-11 PET/CT. It automatically calculated the total amount of [68Ga]Ga-PSMA-11 accumulation of the remaining lesions (>50).
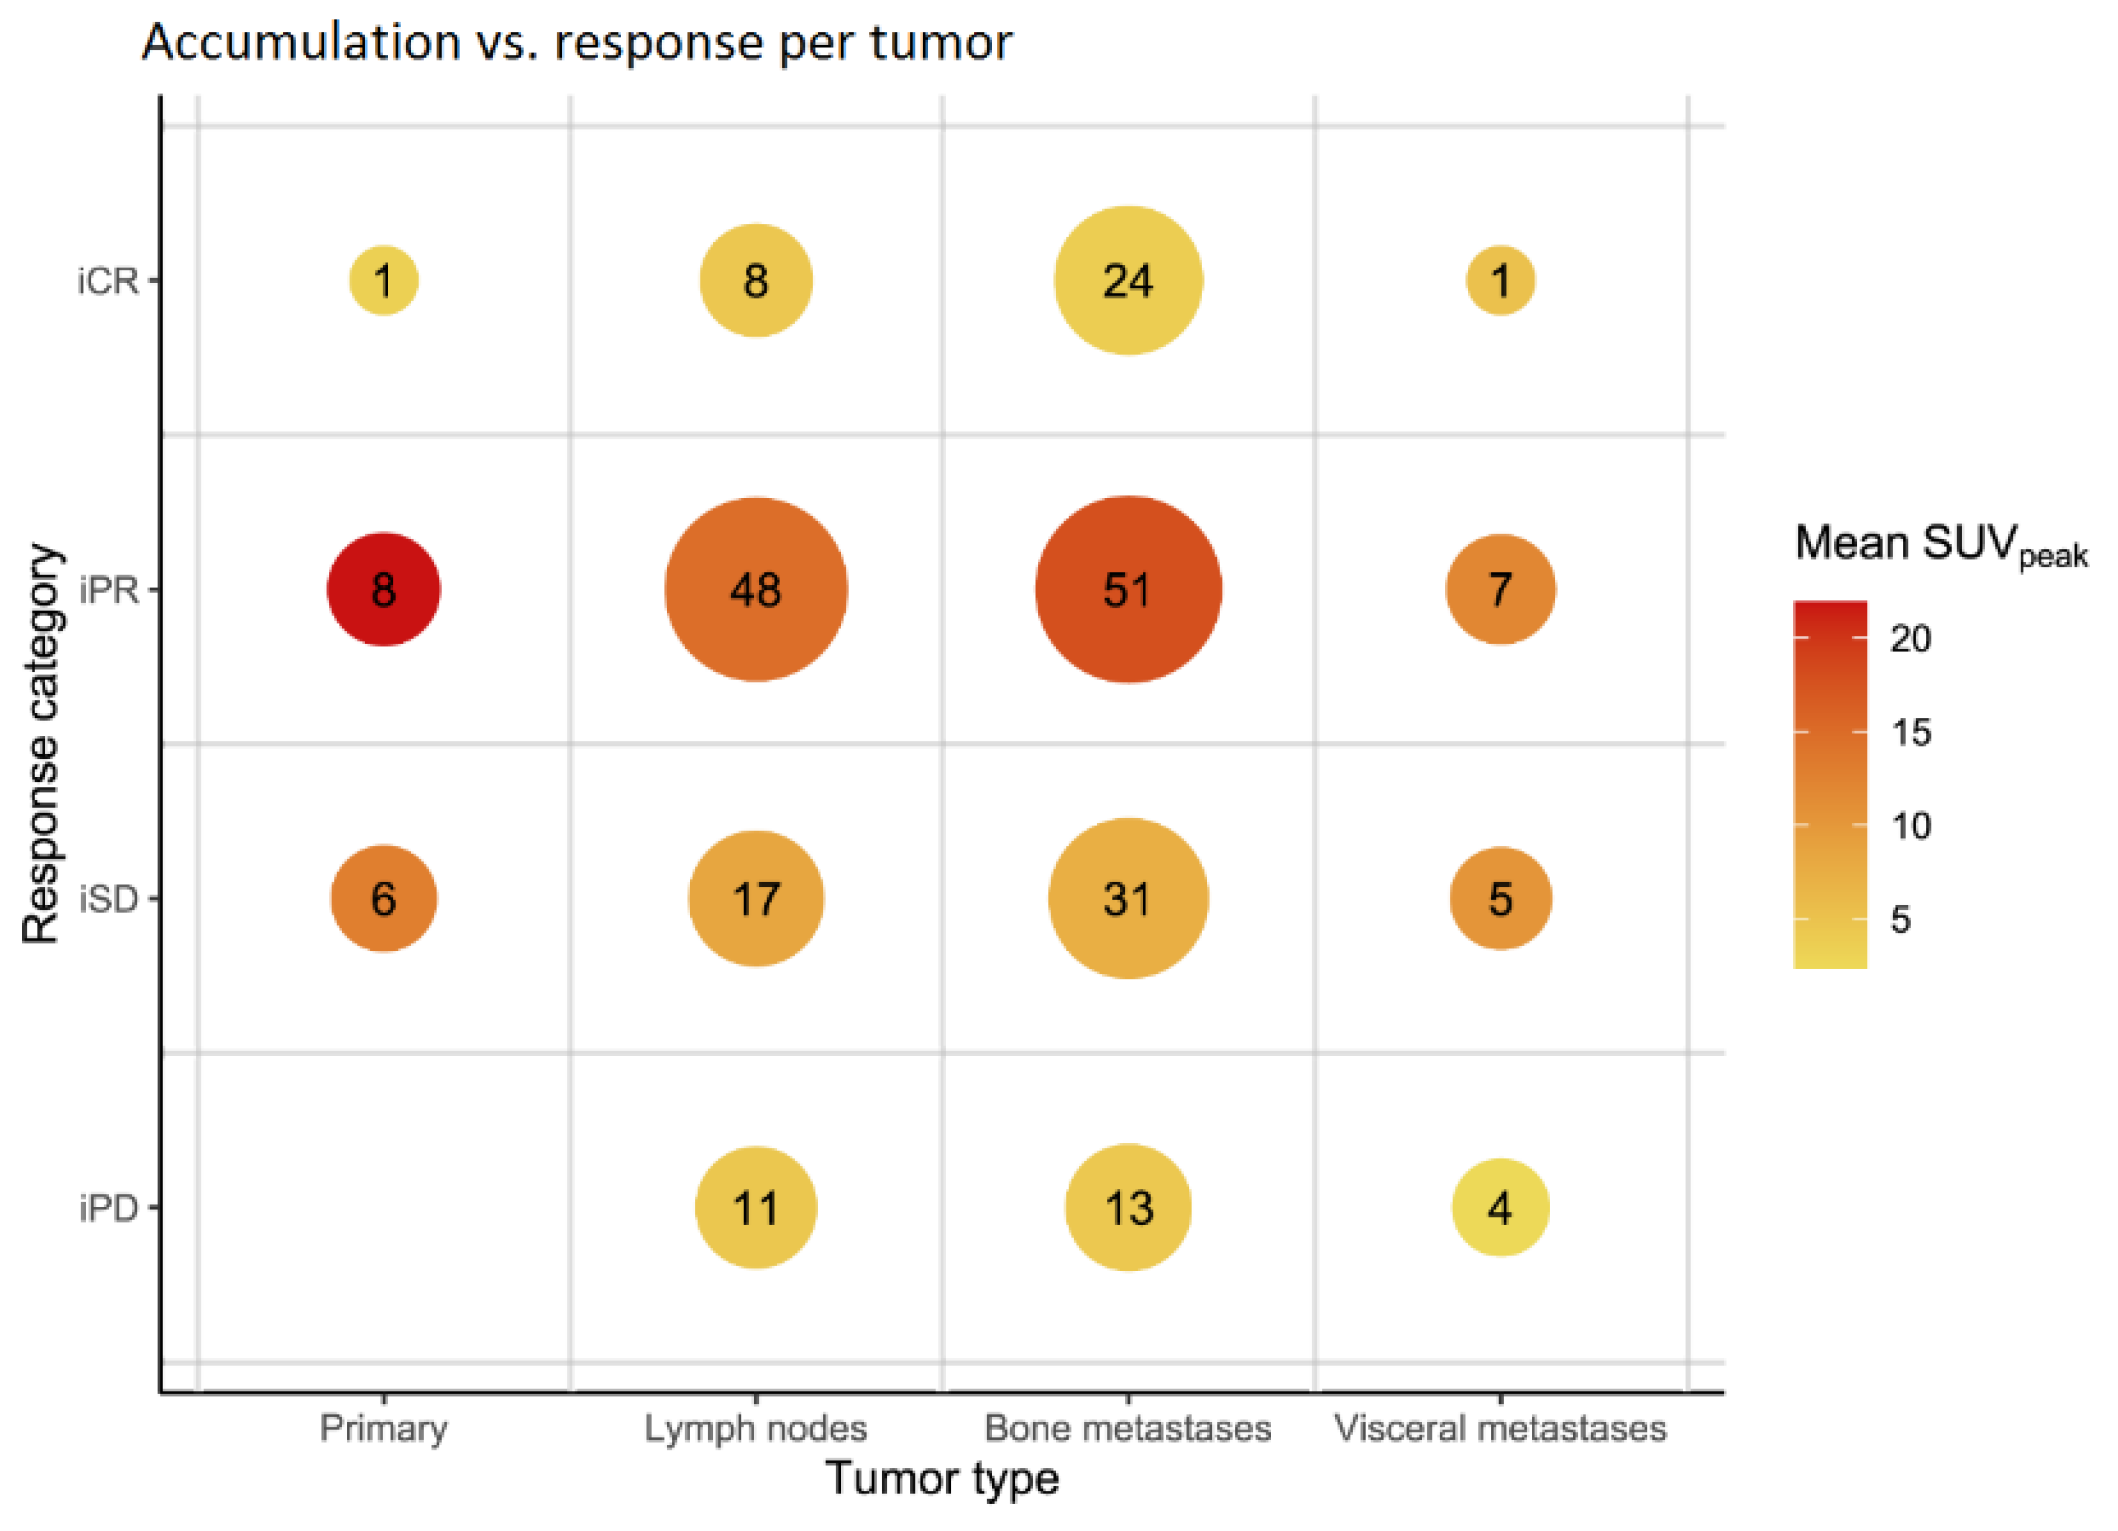
Parameters collected included PSMA tumor volume (PSMA-TV) in mL and TL-PSMA (summation of the entire tumor load within the patient derived from total lesion glycolysis (TLG)). The SUVpeak and SUVmax of the primary prostate tumor (if in situ), and the SUVpeak and SUVmax the two most- and least-avid lesions of three different organ categories (lymph nodes, bone and visceral metastasis) were collected. This approach was chosen in order to collect a wide variety of lesion avidity for the lesion-based analysis.
In accordance with the EARL recommendations, the TL-PSMA was calculated by multiplying the SUVpeak value with the PSMA-TV (SUVlbm,peak*cm3) per patient. Although the EARL recommendations are used for 18F-FDG (FDG), the used method for the total lesion glycolysis (TLG) will best represent the in vivo distribution of [68Ga]Ga-PSMA-11 by calculating the fractional tumor activity [19,20,21].

2.4. Outcomes

The primary outcome of this study was defined as an objective response after two cycles of [
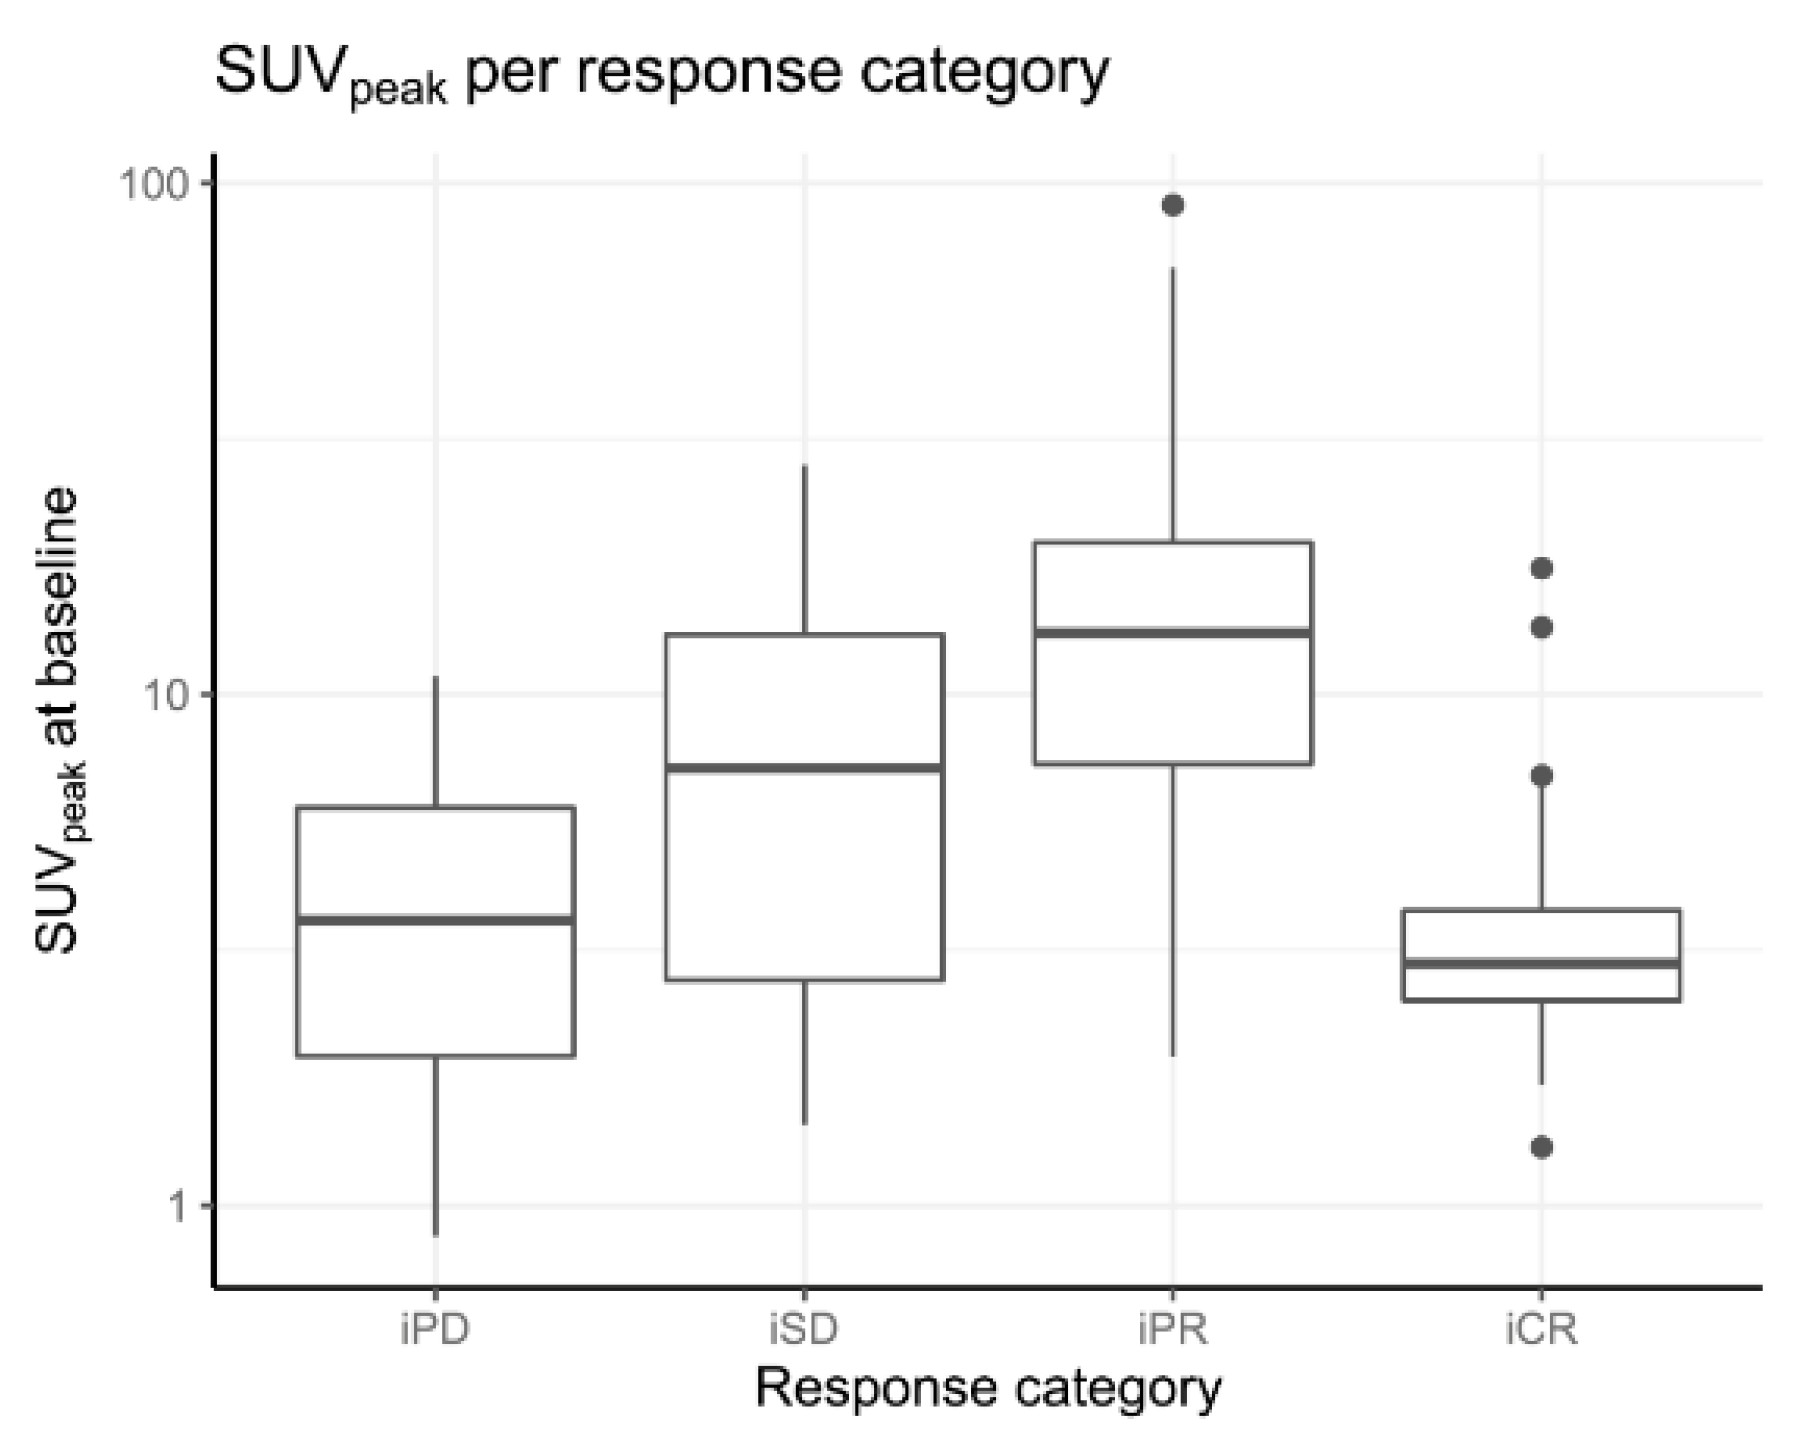
177Lu]Lu-PSMA-617 treatment at the lesion- and patient-level. Response evaluation at the lesion-level was based on PERCIST [17]: imaging complete response (iCR); complete resolution of PSMA-tracer accumulation in all lesions, imaging partial response (iPR); more than or equal to 30% reduction of SUVpeak, imaging progressive disease (iPD); more than or equal to 30% increase in SUVpeak and imaging stable disease (iSD); not qualifying for iCR, iPR, or iPD. The definition of objective response includes iCR + iPR. For the patient-based analysis, the same methodology was used, except the TL-PSMA was used as the distinctive parameter instead of the SUVpeak, thus objective response at the patient-level was determined as a reduction of TL-PSMA ≥30% and progressive disease was defined as more than or equal to 30% increase in the TL-PSMA and/or the appearance of new lesions.
Secondary outcomes included a biochemical response after two cycles of [177Lu]Lu-PSMA-617 treatment at the patient-level, defined according to the prostate cancer clinical trial working group 2 and 3 [22,23]. Response definitions: a partial response (bPR) was more than 50% PSA level reduction; progressive disease (bPD) was more than or equal to 25% increase; and a stable disease (bSD) was less or equal to 50% reduction and less than 25% increase of PSA level.
Additionally, clinical, biochemical, imaging, and hematological parameters (Table 1 and Table 2, and Appendix A Table A1) were gathered to investigate potential predictive factors on a patient-level.
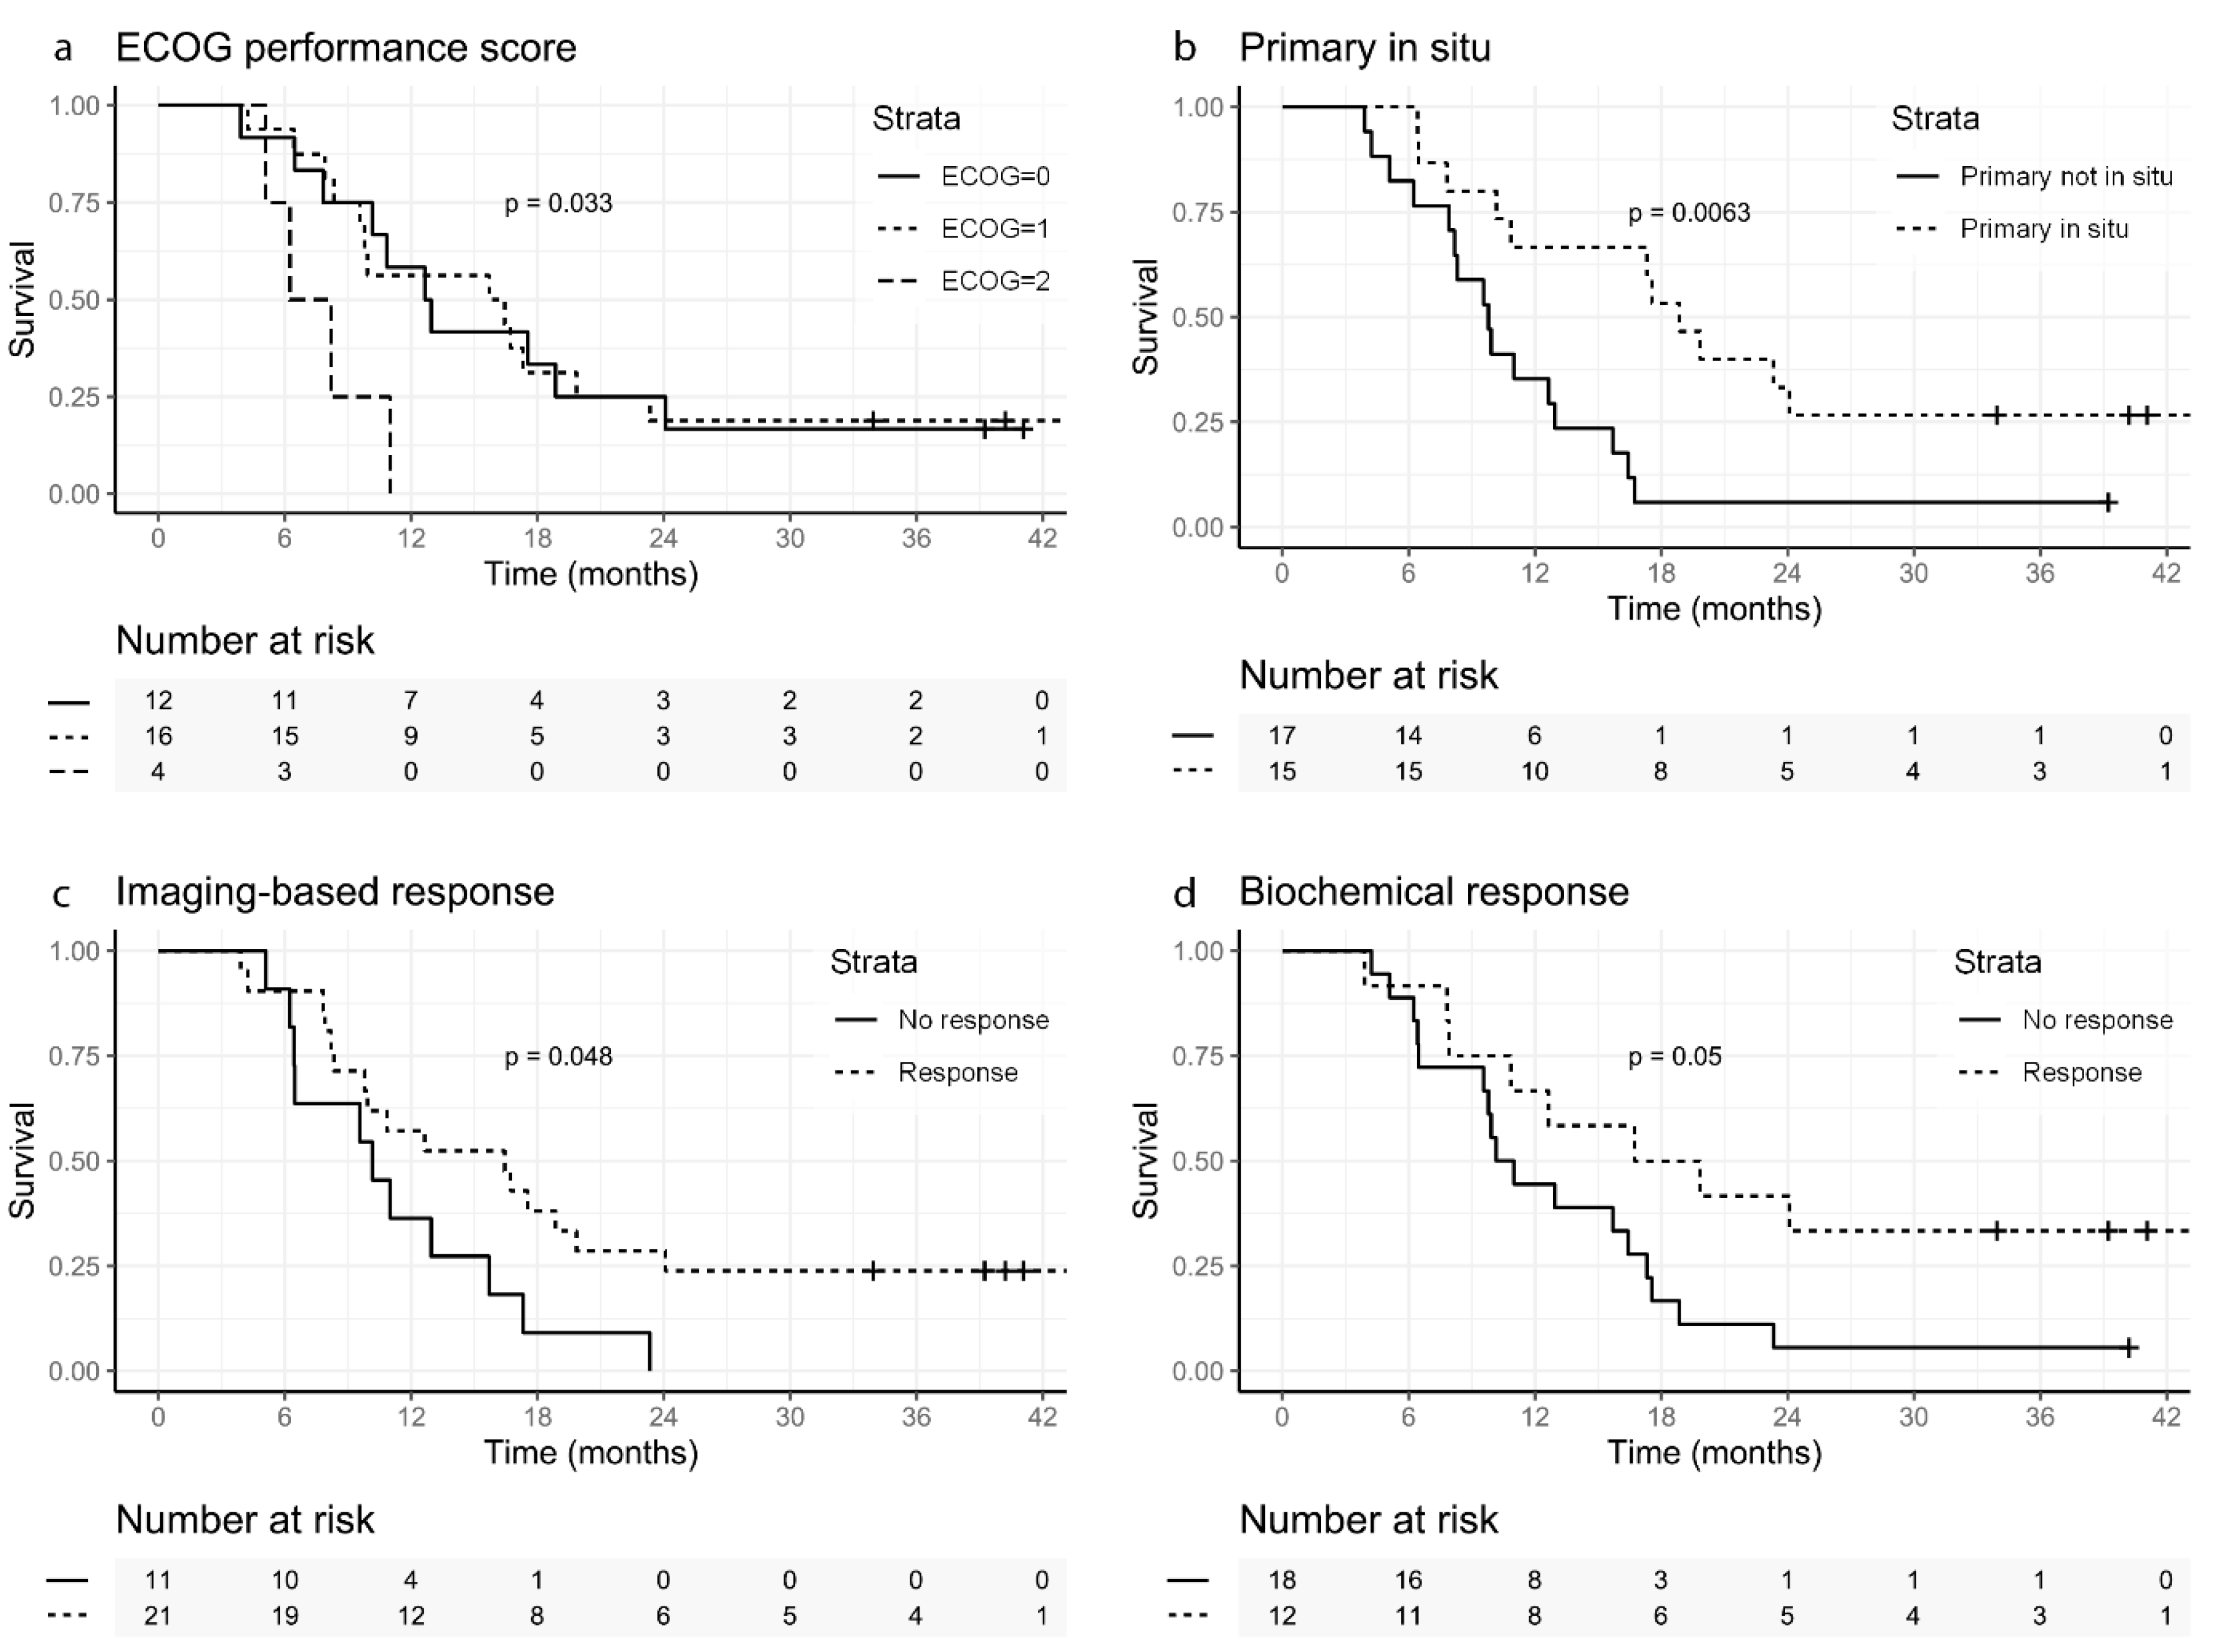
Finally, overall survival (OS), defined as after the first cycle of [177Lu]Lu-PSMA-617 treatment to death from any cause, was analyzed on a patient-level.

2.5. Statistical Analysis

The software IBM SPSS Statistics version 25.0.0.2 for Windows (IBM, Armonk, NY, USA) and R version 4.0.1 (R Core Team 2020) was used for all analyses (for used R codes see Supplementary Materials). As accumulation measurements (i.e., SUVpeak and SUVmax) showed positive skewness, a log-transformation was applied before analyses were executed. Several types of analyses were executed to test different hypotheses. A p-value ≤ 0.05 was considered significant.
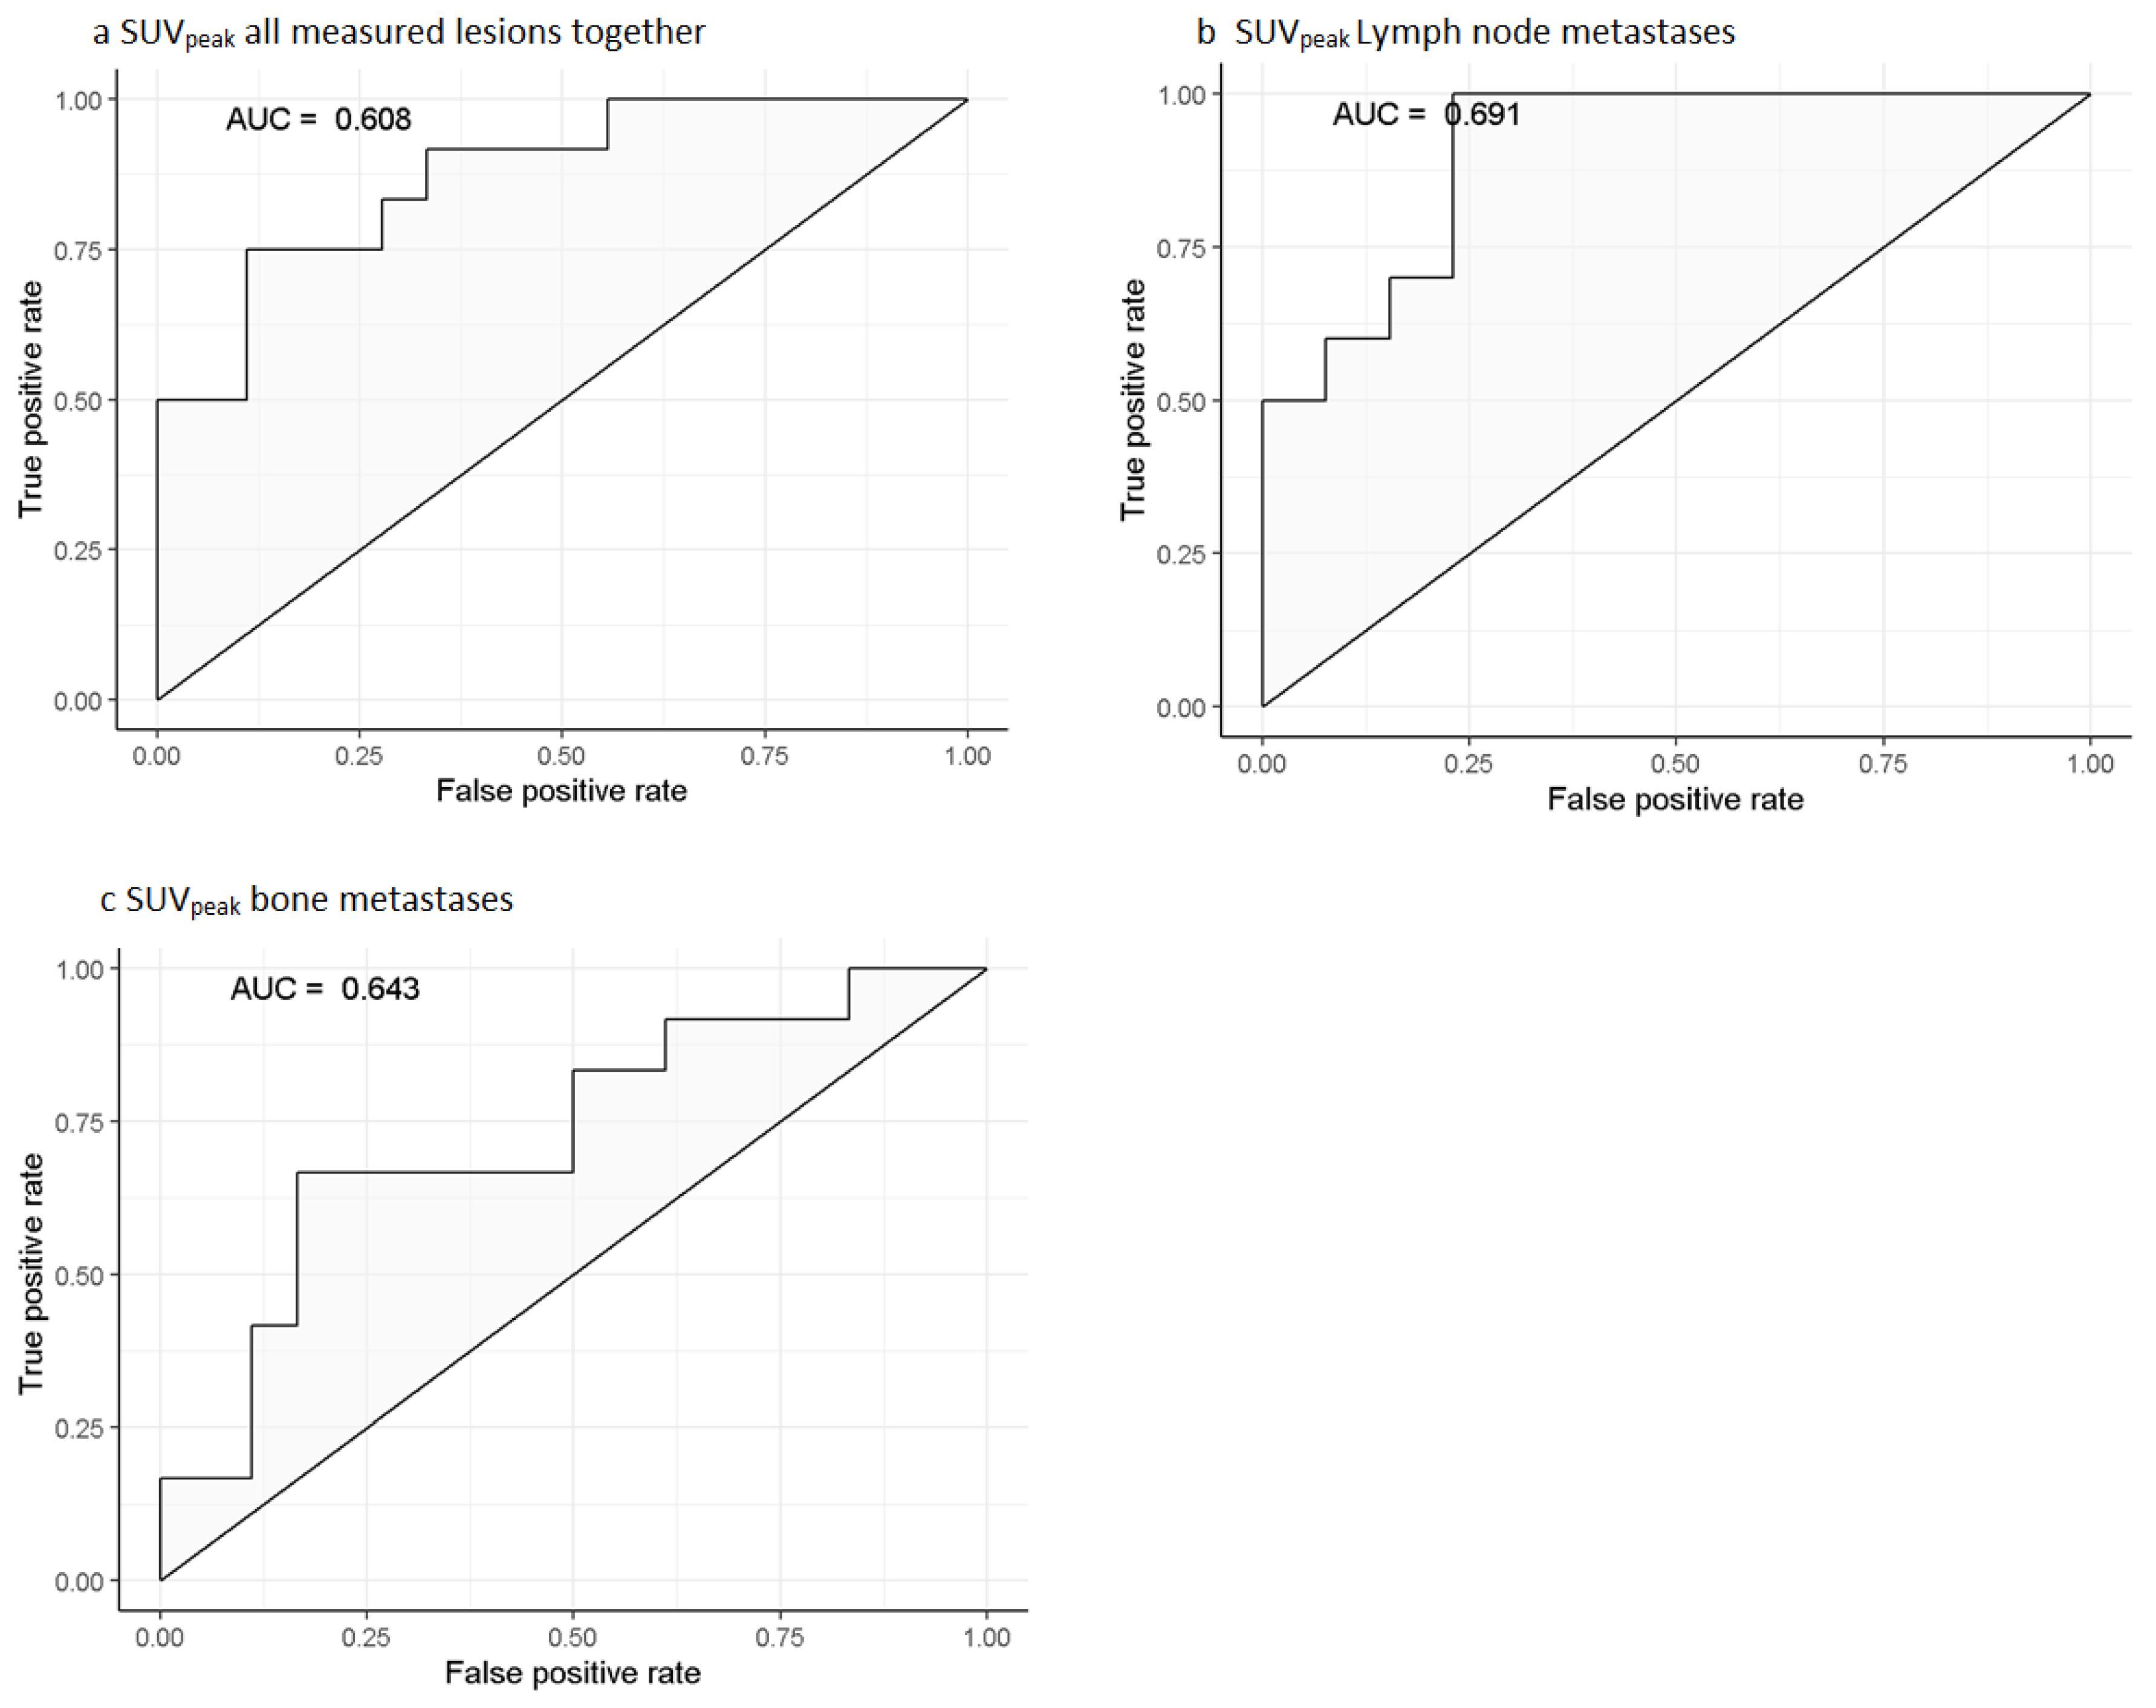
For our primary outcome, the imaging-based response on a lesion-level, Receiver Operating Characteristics (ROC) curve analyses were performed for predicting imaging-based response, including the following variables: SUVpeak/SUVmax all measured lesions together, SUVpeak/SUVmax lymph node metastases and bone metastases. The Youden’s index test and a set minimum specificity of 0.80 were used to determine the optimal cut-off value for binarization of the predictive values.
Mixed-effects models with SUVpeak/SUVmax as the independent variable, imaging-based response (dichotomized or as categorical variable) as the dependent variable, and a random intercept of SUVpeak and SUVmax per patient was used to model the effect of imaging-based response on the SUVpeak and SUVmax values. The random intercept was added to the model to incorporate the anticipated between-patient variation in SUVpeak and SUVmax levels. The remaining dependent relation between the imaging-based response and SUVpeak or SUVmax was then modelled as a fixed effect. PSMA-TV in the patient and metastasis type were added to the model as a confounder. In order to test the hypothesis that type of metastasis (i.e., lymph node, bone and visceral metastases) was of influence on the relationship between the individual pre-treatment accumulation and imaging-based response per lesion, metastasis type was added as an interaction to the model, both as a categorical variable and as a dichotomized variable in separate models.
For the imaging-based response on a patient-level, the maximum SUVpeak and SUVmax values in primary tumor or metastases (lymph node, bone, and visceral metastases) were tested for a relationship with response in logistic regression analysis. This approach was also used for the secondary outcome, biochemical response.
Several variables were tested in logistic regression analysis, univariately, while correcting for tumor load by including baseline PSMA-TV in each model. Each model was tested using likelihood ratio tests, comparing the model including the variable with a model only including baseline PSMA-TV.
Overall survival analysis was done using Cox-proportional hazard models, and Kaplan–Meier survival curves were constructed. The ISUP Gleason score, ECOG performance score, extent of disease, and imaging parameters were included in Cox-proportional hazard regression.

3. Results

A total of 87 patients were treated with [177Lu]Lu-PSMA-617. Of those patients, 32 were eligible for analysis as illustrated in Figure 1.
The baseline patients and imaging parameters are summarized in Table 1 and Table 2. Baseline hematological parameters and radiopharmaceutical characteristics can be found in Appendix A, Table A1 and Table A2. A total of 86 lymph nodes, 119 bone, and 17 visceral metastases were extracted. Table 3 represent the imaging-based response rates on a patient- and lesion-level. Figure 2 illustrates the response rates of two patients after two cycle of [177Lu]Lu-PSMA-617 treatment (one responder and one non-responder).

3.1. Lesion-Level

In ROC analysis (Figure 3), the optimal cut-off value to predict imaging response based on Youden’s index was 14.87 for SUVpeak (sensitivity = 0.36, specificity = 0.90) and 19.08 for SUVmax (sensitivity = 0.40, specificity = 0.89). The cut-off values based on a minimum specificity of 0.80 were 12.07 (for SUVpeak; sensitivity = 0.44) and 15.4 (for SUVmax; sensitivity = 0.49), meaning that of all non-responding tumors, 80% showed accumulation below these cut-off values.
The relationship between baseline PET parameters and imaging-based response in linear mixed effects models were significant for both SUVpeak and SUVmax, when testing for dichotomized imaging response (p < 0.001 and p < 0.001) and categorical imaging response (p < 0.001 and p < 0.001; Table 4). On average, in responding tumors a 1.80 (95% CI [1.42–2.29]) times higher SUVpeak and a 1.84 (95% CI [1.46–2.31]) times higher SUVmax was observed (Table 4 and Table 5).
The type of lesion (i.e., lymph node, bone, visceral metastasis, or primary prostate) did not alter the found relationships. Figure 4 and Figure 5 shows that lesions with a higher accumulation (SUVpeak) at baseline have a better imaging-based response, with the exception of complete response.

3.2. Patient-Level

Results of the response evaluation on the patient-level are shown in Table 6. Baseline PSA (median 210.0 ng/mL) and SUVpeak most avid metastases had a significant relationship with imaging-based response (OR 2.07, p = 0.019 and OR 1.11, p = 0.015). Imaging-based response was highly associated with biochemical response (p < 0.001). Secondary, no factors were identified having a significant relationship with biochemical response.
During follow-up, 28 (87.5%) patients were found to have died with a median overall survival of ten months (Table 2). Log-rank testing showed that patients with an ECOG performance score of zero or one have a significant better survival rate than patients with an ECOG performance score of two (p = 0.033), the same for patients with >50% PSA reduction in comparison to no PSA reduction of >50% (p = 0.05) and for patients with ≥30% TL-PSMA reduction in comparison to no reduction of ≥30% (p = 0.048). Patients who had the primary tumor in situ had a better overall survival (p = 0.006) (Figure 6). The factors ISUP, presence of visceral metastases, bone metastases or lymph node metastases, baseline TL-PSMA, baseline PSMA-TV and most avid lesion SUVpeak, SUVmax did not shown any significance.
In the univariate Cox-regression analyses, patients with an ECOG performance score of two and an unknown Gleason (ISUP) score had a significant hazard ratio (HR) (Table 7), but overall, these variables were not significantly associated with survival (p = 0.104 and p = 0.386). Biochemical response was significantly associated with survival (HR 0.43, p = 0.047; Table 7).

4. Discussion

This study evaluated the potential of imaging-derived factors on [68Ga]Ga-PSMA-11 PET/CT to predict the response in a lesion- and a patient-based analysis, in men with mCRPC receiving two cycles of [177Lu]Lu-PSMA-617 treatment. In the lesion-level analysis, a clear relationship was found between pre-therapeutic accumulation (SUVpeak and SUVmax) and imaging-based response on [68Ga]Ga-PSMA-11 PET/CT with no preference or difference for either, primary tumor, lymph node, bone or visceral metastasis.
Interestingly, in the lesion-level analysis, a contradictory lower SUVpeak at baseline was seen in lesions with iCR. An explanation might be the threshold method based on PERCIST and lesion selection criteria in this study. If, at follow-up imaging, the lesion SUVpeak was under the threshold, it was set to zero (being iCR), even when visually some accumulation might still be present. An additional explanation can be found in the set threshold and making the accumulation of the least avid lesion depended on the blood pool activity. However, to address a large number of lesions with a wide variety of intensities, this approach was deliberately chosen to gain more insight in lesion-based response. A third explanation is the influence of partial volume effect on small lesions, potentially overestimating objective response.
In the clinical setting, a difference was noticed in the objective response between different lesion types (e.g., prostate, lymph node, bone or visceral), however, the results of this study show no difference between lesion type (Figure 4 and Figure 5). Thus, making a distinction between lesion types seems irrelevant for patient selection prior to 177Lu-PSMA-617. To the best knowledge of the authors, this is the first study evaluating the response on individual lesion-level with imaging-derived predictive factors on [68Ga]Ga-PSMA-11 PET/CT, thus no comparison with existing literature can be made.
On the patient-level, the pre-therapeutic imaging-derived predictive factor, SUVpeak of the most avid metastases was significantly associated with the imaging-based response (TL-PSMA ≥ 30% reduction). No other study has evaluated the imaging-based response based on PERCIST. Hofman et al. [5] and Sartor et al. [3], however, used the RECIST criteria, but in comparison to PERCIST (which looks at accumulation reduction); RECIST only uses single dimension size changes and has severe limitations in measuring bone or bone marrow disease [17]. On the other hand, evaluating tumor response with [68Ga]Ga-PSMA-11 PET/CT (via the same mechanism of the treatment itself) can also be debated, as potential non-PSMA avid disease will not be evaluated.
There are studies evaluating imaging-derived predictive factors with biochemical response as outcome, although the results are contradictory. Some did not find any significant imaging-derived predictive factor (e.g., SUVmax and SUVmean, total tumor load, number of metastatic lesions, and sites of disease) for biochemical response [11,24], while some did (e.g., SUVmax < 45 of the most avid lesion, SUVmean) [10,25]. An explanation can be found in the difference in the number of cycles used, population size, the used therapeutic radiopharmaceuticals, and the amount of activity, thereby making their results difficult to compare and to interpret.
In the survival analyses, patients with an ECOG performance score of zero and one had a significant better OS than patients with an ECOG performance score of two, in line with previous findings [7]. Furthermore, patients with a biochemical response (>50% PSA reduction) had a better OS, compared to biochemical non-responders. This is in contrast to the findings of Ahmadzadehfar et al. [7] and Rahbar et al. [9], who did not find a significant difference in 100 and 104 mCRPC patients treated with [177Lu]Lu-PSMA-617 between biochemical responders and non-responders concerning OS. The difference can possibly be explained by differences in sample size, population heterogeneity and selection bias by the range in the number of given [177Lu]Lu-PSMA-617 cycles in both studies: namely two to six in this study versus one to eight cycles.
This study has several limitations: first, the retrospective design and resulting missing data. Second, the small sample size (Figure 1) and population heterogeneity limits the ability to draw definite conclusions on patient-based analyses. But in the lesion-based analysis, the sample size was a total of 237 lesions, however, only the two most avid and two least avid lesions were selected to address many lesions with a wide variety of intensities, introducing a selection bias. Third, no volumes of the individual lesions were measured, introducing bias by partial volume effects. This could have influenced the response rate on the lesion-level analysis, as a lower PSMA-TV with the same SUVpeak is more prone for iCR than a higher PSMA-TV with the same SUVpeak. On the patient-level, however, baseline TL-PSMA and PSMA-TV had no significant influence on the imaging-based response rate. Fourth, PERCIST for the lesion-based response evaluation is not validated for PSMA PET/CT. However, it is already broadly available in clinical practice and easy to apply [15,17].
Other studies used a maximum intensity threshold with SUVmax for tumor segmentation [20,26]. In this study, we chose to use SUVpeak adapted from PERCIST for tumor segmentation as this limits the influence of noise on quantification [27].
In current practice, patients are only eligible for [177Lu]Lu-PSMA-617 treatment if sufficient tracer accumulation is observed on PSMA PET/CT. However, the definition of sufficient tracer accumulation is still a topic of discussion. Currently, it is based on literature on peptide receptor radionuclide therapy (PRRT), as was also used in the VISION trial [28,29,30]: accumulation in tumor sites must at least be higher than physiological accumulation in normal liver tissue, to ensure a certain efficacy. The included patients in this study all met this specific criterion. Still, there were some non-responders (iPD and bPD) in this study (5/32; 16% and 5/30; 17%), in line with the findings in the VISION trial [3], thereby indicating that the decision whether or not an individual patient is eligible for [177Lu]Lu-PSMA-617 based on the visual assessment of accumulation alone compared to healthy liver tissue accumulation remains questionable. The results in this study indicate that tracer accumulation based on SUVpeak (>14.87) or SUVmax (>19.08) in a lesion can be helpful to determine if a certain lesion will or will not respond, based on a broadly available, internationally accredited image reconstruction method (EARL) [14]. In case, when all or the majority of metastases within a patient are below these thresholds, an alternative treatment may be more beneficial, subsequently, improving patient selection for 177Lu-PSMA-617 based on available pre-treatment [68Ga]Ga-PSMA-11 imaging.
The results of this study illustrate the potential of response prediction by pre-treatment [68Ga]Ga-PSMA-11 PET/CT quantification, using widely available image reconstruction parameters (EARL) and software packages enabling (semi-automated) PERCIST assessments. The findings of this study need to be validated in larger cohorts and future prospective studies.

5. Conclusions

On pre-treatment [68Ga]Ga-PSMA-11 PET/CT, a clear accumulation-response relationship in lesion-level analyses has been found for SUVpeak and SUVmax in men with mCRPC receiving two cycles of [177Lu]Lu-PSMA-617 treatment. On a patient-level analysis, SUVpeak of the most avid lesion was the only image-derived factor predictive of imaging-based response.

Supplementary Materials

The following supporting information can be downloaded at: https://www.mdpi.com/article/10.3390/biomedicines10071575/s1, PSMA-PET response—mixed model analysis.

Author Contributions

Conceptualization, A.J.A.T.B. and E.C.A.v.d.S.; methodology, A.J.A.T.B., E.C.A.v.d.S., A.M.H.; validation, S.C.E., E.C.A.v.d.S., A.J.A.T.B.; formal analysis, S.C.E., A.J.S.K.; investigation, A.J.S.K., E.C.A.v.d.S., A.J.A.T.B.; resources, A.J.A.T.B.; data curation, E.C.A.v.d.S.; writing—original draft preparation, E.C.A.v.d.S., A.J.S.K., A.J.A.T.B., S.C.E.; writing—review and editing, E.C.A.v.d.S., A.J.A.T.B., M.G.E.H.L., B.d.K., A.M.H.; visualization, E.C.A.v.d.S., S.C.E.; supervision, A.J.A.T.B.; project administration, A.J.A.T.B.; All authors have read and agreed to the published version of the manuscript.

Funding

This research received no external funding.

Institutional Review Board Statement

Ethical review and approval were waived by the institutional medical ethics committee for this study, due to the retrospective nature of the study.

Informed Consent Statement

The need for informed consent was waived by the institutional medical ethics committee.

Data Availability Statement

The datasets used and/or analyzed during the current study are available from the corresponding author on reasonable request.

Conflicts of Interest

MGEHL has acted as consultant for BTG/Boston Scientific and Terumo/Quirem Medical and receives research support by Novatis/AAA. AJATB has acted as consultant for BTG/Boston Scientific and Terumo/Quirem Medical. All other authors declare that they have no conflict of interest.

Appendix A

Table A1. Blood results before first [177Lu]Lu-PSMA-617 radioligand therapy.
ParameterMedian Value (IQR)
Hematological parameters
-
Hemoglobin (Hb) mmol/L
7.6 (7.0–8.2)
-
Platelets (Plt) * 109/L
271.0 (223.0–319.0)
Biochemical parameters
-
Alkaline phosphatase (ALP) U/L
103.0 (68.0–192.0)
-
Aspartate aminotransferase (AST) U/L
24.5 (20.3–39.8)
-
Albumin (Alb) g/L
40.5 (38.2–41.5)
-
Lactic acid dehydrogenase (LDH) U/L
232.0 (195.5–363.0)
-
Gamma-glutamyltransferase (GGT) U/L
28.5 (20.3–64.5)
-
Prostate specific antigen (PSA) ng/mL
210.0 (70.75–547.50)
Legend: IQR = Inter quartile range.
Table A2. Baseline imaging and pharmaceutical characteristics.
CharacteristicMedian Value (IQR)
Administered [68Ga]Ga-PSMA-11 baseline scan, MBq/kg 1.61 (1.55–2.06)
Administered [68Ga]Ga-PSMA-11 post-treatment scan, MBq/kg 1.55 (1.50–1.59)
Incubation time baseline scan, minutes 62 (57–71)
Incubation time post-treatment scan, minutes 66 (58–75)
Time between baseline and post-treatment scan, days 109 (96–149)
Administered [177Lu]Lu-PSMA-617 first cycle, MBq 6049 (5965–6932)
Administered [177Lu]Lu-PSMA-617 second cycle, MBq 6235 (5968–7108)
Time between pre-treatment [68Ga]Ga-PSMA-11 and first [177Lu]Lu-PSMA-617 cycle, days 30 (17–52)
Time between first and second [177Lu]Lu-PSMA-617 cycle, days 43 (42–50)
Time between second [177Lu]Lu-PSMA-617 cycle and post-treatment [68Ga]Ga-PSMA-11, days 32 (32–34)
Time between pre-treatment [68Ga]Ga-PSMA-11 and post-treatment [68Ga]Ga-PSMA-11, days 109 (96–149)
Time between second [177Lu]Lu-PSMA-617 cycle and post-therapy PSA measurement, days35 (32–38)
Legend: Ga = Gallium, Lu = Lutetium, IQR = Inter quartile range, PSMA = Prostate specific membrane antigen.

References

  1. Sung, H.; Ferlay, J.; Siegel, R.L.; Laversanne, M.; Soerjomataram, I.; Jemal, A.; Bray, F. Global Cancer Statistics 2020: GLOBOCAN Estimates of Incidence and Mortality Worldwide for 36 Cancers in 185 Countries. CA Cancer J. Clin. 2021, 71, 209–249. [Google Scholar] [CrossRef] [PubMed]
  2. Allemani, C.; Matsuda, T.; Di Carlo, V.; Harewood, R.; Matz, M.; Niksic, M.; Bonaventure, A.; Valkov, M.; Johnson, C.J.; Esteve, J.; et al. Global surveillance of trends in cancer survival 2000-14 (CONCORD-3): Analysis of individual records for 37 513 025 patients diagnosed with one of 18 cancers from 322 population-based registries in 71 countries. Lancet 2018, 391, 1023–1075. [Google Scholar] [CrossRef] [Green Version]
  3. Sartor, O.; de Bono, J.; Chi, K.N.; Fizazi, K.; Herrmann, K.; Rahbar, K.; Tagawa, S.T.; Nordquist, L.T.; Vaishampayan, N.; El-Haddad, G.; et al. Lutetium-177-PSMA-617 for Metastatic Castration-Resistant Prostate Cancer. N. Engl. J. Med. 2021, 385, 1091–1103. [Google Scholar] [CrossRef]
  4. van Kalmthout, L.; Braat, A.; Lam, M.; van Leeuwaarde, R.; Krijger, G.; Ververs, T.; Mehra, N.; Bins, A.; Hunting, J.; de Keizer, B. First Experience With 177Lu-PSMA-617 Therapy for Advanced Prostate Cancer in the Netherlands. Clin. Nucl. Med. 2019, 44, 446–451. [Google Scholar] [CrossRef] [PubMed]
  5. Hofman, M.S.; Violet, J.; Hicks, R.J.; Ferdinandus, J.; Thang, S.P.; Akhurst, T.; Iravani, A.; Kong, G.; Ravi Kumar, A.; Murphy, D.G.; et al. [(177)Lu]-PSMA-617 radionuclide treatment in patients with metastatic castration-resistant prostate cancer (LuPSMA trial): A single-centre, single-arm, phase 2 study. Lancet Oncol. 2018, 19, 825–833. [Google Scholar] [CrossRef]
  6. Yadav, M.P.; Ballal, S.; Bal, C.; Sahoo, R.K.; Damle, N.A.; Tripathi, M.; Seth, A. Efficacy and Safety of 177Lu-PSMA-617 Radioligand Therapy in Metastatic Castration-Resistant Prostate Cancer Patients. Clin. Nucl. Med. 2020, 45, 19–31. [Google Scholar] [CrossRef]
  7. Ahmadzadehfar, H.; Schlolaut, S.; Fimmers, R.; Yordanova, A.; Hirzebruch, S.; Schlenkhoff, C.; Gaertner, F.C.; Awang, Z.H.; Hauser, S.; Essler, M. Predictors of overall survival in metastatic castration-resistant prostate cancer patients receiving [(177)Lu]Lu-PSMA-617 radioligand therapy. Oncotarget 2017, 8, 103108–103116. [Google Scholar] [CrossRef] [Green Version]
  8. Rahbar, K.; Ahmadzadehfar, H.; Kratochwil, C.; Haberkorn, U.; Schafers, M.; Essler, M.; Baum, R.P.; Kulkarni, H.R.; Schmidt, M.; Drzezga, A.; et al. German Multicenter Study Investigating 177Lu-PSMA-617 Radioligand Therapy in Advanced Prostate Cancer Patients. J. Nucl. Med. 2017, 58, 85–90. [Google Scholar] [CrossRef] [Green Version]
  9. Rahbar, K.; Boegemann, M.; Yordanova, A.; Eveslage, M.; Schafers, M.; Essler, M.; Ahmadzadehfar, H. PSMA targeted radioligandtherapy in metastatic castration resistant prostate cancer after chemotherapy, abiraterone and/or enzalutamide. A retrospective analysis of overall survival. Eur. J. Nucl. Med. Mol. Imaging 2018, 45, 12–19. [Google Scholar] [CrossRef]
  10. Huang, K.; Schatka, I.; Rogasch, J.M.M.; Lindquist, R.L.; De Santis, M.; Erber, B.; Radojewski, P.; Brenner, W.; Amthauer, H. Explorative analysis of a score predicting the therapy response of patients with metastatic, castration resistant prostate cancer undergoing radioligand therapy with (177)Lu-labeled prostate-specific membrane antigen. Ann. Nucl. Med. 2020, 35, 314–320. [Google Scholar] [CrossRef]
  11. Emmett, L.; Crumbaker, M.; Ho, B.; Willowson, K.; Eu, P.; Ratnayake, L.; Epstein, R.; Blanksby, A.; Horvath, L.; Guminski, A.; et al. Results of a Prospective Phase 2 Pilot Trial of (177)Lu-PSMA-617 Therapy for Metastatic Castration-Resistant Prostate Cancer Including Imaging Predictors of Treatment Response and Patterns of Progression. Clin. Genitourin Cancer 2019, 17, 15–22. [Google Scholar] [CrossRef] [PubMed]
  12. Manafi-Farid, R.; Harsini, S.; Saidi, B.; Ahmadzadehfar, H.; Herrmann, K.; Briganti, A.; Walz, J.; Beheshti, M. Factors predicting biochemical response and survival benefits following radioligand therapy with [(177)Lu]Lu-PSMA in metastatic castrate-resistant prostate cancer: A review. Eur. J. Nucl. Med. Mol. Imaging 2021, 48, 4028–4041. [Google Scholar] [CrossRef] [PubMed]
  13. Ahmadzadehfar, H.; Eppard, E.; Kurpig, S.; Fimmers, R.; Yordanova, A.; Schlenkhoff, C.D.; Gartner, F.; Rogenhofer, S.; Essler, M. Therapeutic response and side effects of repeated radioligand therapy with 177Lu-PSMA-DKFZ-617 of castrate-resistant metastatic prostate cancer. Oncotarget 2016, 7, 12477–12488. [Google Scholar] [CrossRef] [PubMed]
  14. Boellaard, R.; Delgado-Bolton, R.; Oyen, W.J.; Giammarile, F.; Tatsch, K.; Eschner, W.; Verzijlbergen, F.J.; Barrington, S.F.; Pike, L.C.; Weber, W.A.; et al. FDG PET/CT: EANM procedure guidelines for tumour imaging: Version 2.0. Eur. J. Nucl. Med. Mol. Imaging 2015, 42, 328–354. [Google Scholar] [CrossRef]
  15. van der Sar, E.C.A.; de Keizer, B.; Lam, M.; Braat, A. Competition (‘Steal’ Phenomenon) between [(68)Ga]Ga-PSMA-11 Uptake in Prostate Tumor Tissue Versus Healthy Tissue. Pharmaceutics 2021, 13, 699. [Google Scholar] [CrossRef]
  16. Janmahasatian, S.; Duffull, S.B.; Ash, S.; Ward, L.C.; Byrne, N.M.; Green, B. Quantification of lean bodyweight. Clin. Pharmacokinet. 2005, 44, 1051–1065. [Google Scholar] [CrossRef]
  17. Wahl, R.L.; Jacene, H.; Kasamon, Y.; Lodge, M.A. From RECIST to PERCIST: Evolving Considerations for PET response criteria in solid tumors. J. Nucl. Med. 2009, 50 (Suppl. 1), 122S–150S. [Google Scholar] [CrossRef] [Green Version]
  18. Jansen, B.H.E.; Kramer, G.M.; Cysouw, M.C.F.; Yaqub, M.M.; de Keizer, B.; Lavalaye, J.; Booij, J.; Vargas, H.A.; Morris, M.J.; Vis, A.N.; et al. Healthy Tissue Uptake of (68)Ga-Prostate-Specific Membrane Antigen, (18)F-DCFPyL, (18)F-Fluoromethylcholine, and (18)F-Dihydrotestosterone. J. Nucl. Med. 2019, 60, 1111–1117. [Google Scholar] [CrossRef] [Green Version]
  19. Schmidkonz, C.; Cordes, M.; Schmidt, D.; Bauerle, T.; Goetz, T.I.; Beck, M.; Prante, O.; Cavallaro, A.; Uder, M.; Wullich, B.; et al. (68)Ga-PSMA-11 PET/CT-derived metabolic parameters for determination of whole-body tumor burden and treatment response in prostate cancer. Eur. J. Nucl. Med. Mol. Imaging 2018, 45, 1862–1872. [Google Scholar] [CrossRef]
  20. Schmuck, S.; von Klot, C.A.; Henkenberens, C.; Sohns, J.M.; Christiansen, H.; Wester, H.J.; Ross, T.L.; Bengel, F.M.; Derlin, T. Initial Experience with Volumetric (68)Ga-PSMA I&T PET/CT for Assessment of Whole-Body Tumor Burden as a Quantitative Imaging Biomarker in Patients with Prostate Cancer. J. Nucl. Med. 2017, 58, 1962–1968. [Google Scholar] [CrossRef] [Green Version]
  21. Werner, R.A.; Bundschuh, R.A.; Bundschuh, L.; Lapa, C.; Yin, Y.; Javadi, M.S.; Buck, A.K.; Higuchi, T.; Pienta, K.J.; Pomper, M.G.; et al. Semiquantitative Parameters in PSMA-Targeted PET Imaging with [(18)F]DCFPyL: Impact of Tumor Burden on Normal Organ Uptake. Mol. Imaging Biol. 2020, 22, 190–197. [Google Scholar] [CrossRef] [PubMed]
  22. Scher, H.I.; Morris, M.J.; Stadler, W.M.; Higano, C.; Basch, E.; Fizazi, K.; Antonarakis, E.S.; Beer, T.M.; Carducci, M.A.; Chi, K.N.; et al. Trial Design and Objectives for Castration-Resistant Prostate Cancer: Updated Recommendations From the Prostate Cancer Clinical Trials Working Group 3. J. Clin. Oncol. 2016, 34, 1402–1418. [Google Scholar] [CrossRef] [PubMed] [Green Version]
  23. Scher, H.I.; Halabi, S.; Tannock, I.; Morris, M.; Sternberg, C.N.; Carducci, M.A.; Eisenberger, M.A.; Higano, C.; Bubley, G.J.; Dreicer, R.; et al. Design and end points of clinical trials for patients with progressive prostate cancer and castrate levels of testosterone: Recommendations of the Prostate Cancer Clinical Trials Working Group. J. Clin. Oncol. 2008, 26, 1148–1159. [Google Scholar] [CrossRef] [PubMed]
  24. Ferdinandus, J.; Eppard, E.; Gaertner, F.C.; Kurpig, S.; Fimmers, R.; Yordanova, A.; Hauser, S.; Feldmann, G.; Essler, M.; Ahmadzadehfar, H. Predictors of Response to Radioligand Therapy of Metastatic Castrate-Resistant Prostate Cancer with 177Lu-PSMA-617. J. Nucl. Med. 2017, 58, 312–319. [Google Scholar] [CrossRef]
  25. Gafita, A.; Calais, J.; Grogan, T.R.; Hadaschik, B.; Wang, H.; Weber, M.; Sandhu, S.; Kratochwil, C.; Esfandiari, R.; Tauber, R.; et al. Nomograms to predict outcomes after (177)Lu-PSMA therapy in men with metastatic castration-resistant prostate cancer: An international, multicentre, retrospective study. Lancet Oncol. 2021, 22, 1115–1125. [Google Scholar] [CrossRef]
  26. Mihatsch, P.W.; Beissert, M.; Pomper, M.G.; Bley, T.A.; Seitz, A.K.; Kubler, H.; Buck, A.K.; Rowe, S.P.; Serfling, S.E.; Hartrampf, P.E.; et al. Changing Threshold-Based Segmentation Has No Relevant Impact on Semi-Quantification in the Context of Structured Reporting for PSMA-PET/CT. Cancers 2022, 14, 270. [Google Scholar] [CrossRef]
  27. Im, H.J.; Bradshaw, T.; Solaiyappan, M.; Cho, S.Y. Current Methods to Define Metabolic Tumor Volume in Positron Emission Tomography: Which One is Better? Nucl. Med. Mol. Imaging 2018, 52, 5–15. [Google Scholar] [CrossRef]
  28. Kratochwil, C.; Bruchertseifer, F.; Rathke, H.; Bronzel, M.; Apostolidis, C.; Weichert, W.; Haberkorn, U.; Giesel, F.L.; Morgenstern, A. Targeted alpha-Therapy of Metastatic Castration-Resistant Prostate Cancer with (225)Ac-PSMA-617: Dosimetry Estimate and Empiric Dose Finding. J. Nucl. Med. 2017, 58, 1624–1631. [Google Scholar] [CrossRef] [Green Version]
  29. Krenning, E.P.; Valkema, R.; Kooij, P.P.; Breeman, W.A.; Bakker, W.H.; deHerder, W.W.; vanEijck, C.H.; Kwekkeboom, D.J.; deJong, M.; Pauwels, S. Scintigraphy and radionuclide therapy with [indium-111-labelled-diethyl triamine penta-acetic acid-D-Phe1]-octreotide. Ital. J. Gastroenterol. Hepatol. 1999, 31 (Suppl. 2), S219–S223. [Google Scholar]
  30. Kuo, P.H.; Benson, T.; Messmann, R.; Groaning, M. Why We Did What We Did: PSMA-PET/CT Selection Criteria for the VISION Trial. J. Nucl. Med. 2022, 63, 816–818. [Google Scholar] [CrossRef]
Figure 1. Flow-chart of the retrospective included patients.
Biomedicines 10 01575 g001
Figure 2. Example of two patients: responder and non-responder after two cycles of [177Lu]Lu-PSMA-617 treatment. (a): Responder (TL-PSMA reduction 95.01%, PSA-reduction: 99.5%): 78-year-old men with a Gleason score of nine, a ECOG performance score zero and a SUVpeak of the most avid lesion of 17.7. Activity first cycle [177Lu]Lu-PSMA-617: 6.3 GBq, activity second cycle [177Lu]Lu-PSMA-617: 6.3 GBq. TL-PSMA pre-treatment: 1961.02 SUVlbm,peak*cm3, TL-PSMA post-treatment: 97.79 SUVlbm,peak*cm3. (b): Non-responder (TL-PSMA increase: 750.77%, PSA-increase: 566.7%): 69-year-old men with a Gleason score of eight, a ECOG performance score of two and a SUVpeak of the most avid lesion of 9.48. Activity first cycle [177Lu]Lu-PSMA-617: 6.2 GBq, activity second cycle [177Lu]Lu-PSMA-617: 6.2GBq. TL-PSMA pre-treatment: 260.58 SUVlbm,peak*cm3, TL-PSMA post-treatment: 2216.94 SUVlbm,peak*cm3.
Biomedicines 10 01575 g002
Figure 3. Receiver Operating Characteristics-curves for the predicting of imaging-based response including bootstrap-corrected c-statistic of the three separately tested models in logistic regression. (a): SUVpeak all measured lesions together, (b): SUVpeak lymph node metastases, (c): SUVpeak bone metastases. Legend: AUC = Area under the curve, SUV = Standardized uptake value.
Biomedicines 10 01575 g003
Figure 4. SUVpeak values per response category on the tumor-level. Legend: iCR = Imaging complete response, iPD = Imaging progression disease, iPR = Imaging partial response, iSD = Imaging stable disease, SUV = Standardized uptake value.
Biomedicines 10 01575 g004
Figure 5. Relationship between metastasis type, response, and accumulation. Numbers in the plot indicate the number of tumors in the corresponding group. Legend: iCR = Imaging complete response, iPD = Imaging progression disease, iPR = Imaging partial response, iSD = Imaging stable disease, SUV = Standardized uptake value.
Biomedicines 10 01575 g005
Figure 6. Kaplan–Meier curves showing the significant survival probability, expressed as a percentage, following the first cycle of [177Lu]Lu-PSMA-617 treatment. (a): ECOG performance score, (b): Primary prostate in situ yes or no, (c): Imaging-based response (≥30 TL-PSMA reduction) yes or no, (d): Biochemical response (>50% PSA reduction) yes or no. Legend: ECOG = Eastern Cooperative Oncology Group.
Biomedicines 10 01575 g006
Table 1. Baseline patient characteristics.
CharacteristicValue
Patients, number32
Age, years (mean, SD)70 (6.75)
Baseline PSA, ng/mL (median, IQR)210.0 (70.75–547.50) a
Weight, kg (median, IQR)87 (76.25–95.75)
Gleason-score (following ISUP grade group): number of patients (%)
- 12 (6.2)
   - 2/34 (12.5)
- 45 (15.6)
- 514 (43.8)
     - Not reported7 (21.9)
Prior therapy: number of patients (%)
Surgical resection of primary tumor15 (46.9)
Docetaxel and/or cabazitaxel26 (81.3)
Abiraterone and/or enzalutamide31 (96.9)
223Radium13 (40.6)
ECOG performance score: number of patients (%)
- 012 (37.5)
- 116 (50.0)
- 24 (12.5)
Regular need for pain medication, number of patients (%)15 (46.9)
Extension of disease: number of patients (%)
Lymph node metastasis24 (75)
Bone metastasis30 (93.8)
Visceral metastasis7 (21.9)
a of two patients baseline PSA was missing. PSA was not older than 1 month in the remaining patients. Legend: ECOG = Eastern Cooperative Oncology Group, ISUP = International Society of Urological Pathology, IQR = Inter quartile range, PSA = Prostate specific antigen, SD = Standard deviation.
Table 2. Imaging baseline parameters.
CharacteristicBaselineAfter 2 Cycles of [177Lu]Lu-PSMA-617
PSMA-TV, mL (median, IQR)702.17 (340.54–1376.33)386.5 (188.8–973.8)
TL-PSMA, SUVlbm,peak*cm3 (median, IQR)3755.54 (1804.3–9435.3)2112.96 (1102.53–4849.83)
SUVpeak (median, IQR)
-
Primary tumor
13.70 (9.29–20.56)8.80 (6.13–14.09)
-
Lymph node metastases
7.40 (3.94–13.40)4.54 (2.36–8.85)
-
Bone metastases
6.84 (2.92–16.09)4.07 (1.92–8.09)
-
Visceral metastases
7.33 (3.74–13.72)8.15 (2.77–9.28)
SUVmax (median, IQR)
-
Primary tumor
16.99 (13.03–21.77)10.69 (7.12–17.20)
-
Lymph node metastases
10.54 (6.43–19.61)6.38 (3.46–11.67)
-
Bone metastases
9.92 (4.36–21.05)5.49 (2.59–10.16)
-
Visceral metastases
12.80 (5.34–15.20)9.75 (3.39–10.79)
Overall survival, months (median, IQR)10 (7–17)
Death, number of patients (%)28 (87.5)
Legend: IQR = Inter quartile range, PSMA-TV = PSMA tumor volume, PSMA = Prostate specific membrane antigen, SUV = Standardized uptake value, TL-PSMA = Total lesion PSMA.
Table 3. Imaging-based response on the lesion- and patient-level.
ParameteriCR (n) %iPR (n) %iSD (n) % iPD (n) %Total
Patient-level (TL-PSMA)NA21 (66%)6 (19%)5 (16%)32
Lesion-level (SUVpeak)
-
Lymph nodes metastases
8 (9%)49 (57%)18 (21%)11 (13%)86
-
Bone metastases
24 (20%)51 (43%)31 (26%)13 (11%)119
-
Visceral metastases
1 (6%)7 (41%)5 (29%)4 (24%)17
-
Primary tumor
1 (7%)8 (53%)6 (40%)015
-
All lesions a
34 (14%)115 (49%)60 (25%)28 (12%)237
a Al lesions includes: primary tumor, lymph node, bone and visceral metastases. Legend: iCR = Imaging complete response, iPD = Imaging progression disease, iPR = Imaging partial response, iSD = Imaging stable disease, PSMA = Prostate specific membrane antigen, SUV = Standardized uptake value, TL-PSMA = Total lesion PSMA.
Table 4. Mixed model of imaging-based response on the lesion-level.
CoefficientExp(coeff)p-Value
Outcome = log(SUVpeak) <0.001 a
Non-responders ref
Responders0.59 (0.35–0.83)1.80 (1.42–2.29)<0.001
Outcome = log(SUVmax) <0.001 a
Non-respondersref
Responders0.61 (0.38–0.84)1.84 (1.46–2.31)<0.001
Outcome = log(SUVpeak) <0.001 a
iPDref
iSD0.62 (0.28–0.96)1.86 (1.32–2.62)<0.001
iPR1.33 (1.01–1.66)3.79 (2.74–5.25)<0.001
iCR−0.01 (−0.4–0.38)0.99 (0.67–1.46)0.960
Outcome = log(SUVmax) <0.001 a
iPDref
iSD0.54 (0.22–0.87)1.72 (1.24–2.38)0.001
iPR1.28 (0.97–1.59)3.6 (2.64–4.92)<0.001
iCR0.01 (−0.37–0.38)1.01 (0.69–1.47)0.965
Coefficients of the fixed effects in mixed-model analysis, with a random intercept (SUVpeak/SUVmax) per patient. As the outcome data was log-transformed prior to regression, the exponent of the coefficient can be interpreted as the factor of difference in SUVpeak/SUVmax between the corresponding response category and the reference category. a p-values for models calculated by the likelihood ratio test between the model and an empty model. Legend: iCR = Imaging complete response, iPD = Imaging progression disease, iPR = Imaging partial response, iSD = Imaging stable disease, SUV = Standardized uptake value.
Table 5. Geometric means pre-treatment SUVpeak and SUVmax of imaging-based response on the lesion-level.
Response CategorySUVpeak
iPD3.32 (2.44–4.51)
iSD6.19 (5.02–7.63)
iPR12.6 (10.75–14.77)
iCR3.29 (2.5–4.32)
Response CategorySUVmax
iPD4.99 (3.69–6.74)
iSD8.58 (6.96–10.57)
iPR17.96 (15.26–21.15)
iCR5.03 (3.85–6.57)
Legend: iCR = Imaging complete response, iPD = Imaging progression disease, iPR = Imaging partial response, iSD = Imaging stable disease, SUV = Standardized uptake value.
Table 6. Univariate logistic regression analyses of response on the patient-level; significant responses in bold.
ParameterBiochemical Response (PSA Reduction > 50% y/n)Imaging-Based Response (TL-PSMA Reduction ≥ 30% y/n)
OR, 95% CI, p-valueOR, 95% CI, p-value
Baseline PSA (log) (ug/mL)1.74 (0.859–3.54, p = 0.096)2.074 (1.043–4.12, p = 0.019)
Age (years)1.07 (0.951–1.20, p = 0.252)1.06 (0.939–1.196, p = 0.336)
Total activity [177Lu]Lu-PSMA-617 (GBq)0.535 (0.234–1.22, p = 0.092)0.966 (0.534–1.748, p = 0.910)
ECOG performance score ≥ 10.334 (0.069–1.628, p = 0.169)0.577 (0.112–2.979, p = 0.506)
Need of pain medication y/n0.713 (0.144–3.53, p = 0.678)0.315 (0.064–1.557, p = 0.151)
Previous [223Ra]Ra-dichloride y/n2.276 (0.412–12.6, p = 0.338)3.597 (0.596–21.7, p = 0.138)
Lymph node involvement y/n0.545 (0.092–3.25, p = 0.503)0.648 (0.102–4.128, p = 0.641)
Visceral metastases y/n0.201 (0.019–2.172, p = 0.144)0.332 (0.054–2.02, p = 0.232)
Prostate in situ y/n1.358 (0.292–6.31, p = 0.696)0.874 (0.183–4.169, p = 0.866)
Baseline Hb0.718 (0.293–1.76, p = 0.464)0.735 (0.334–1.618, p = 0.435)
Baseline Plt0.999 (0.989–1.01, p = 0.789)1.001 (0.991–1.01, p = 0.858)
Baseline ALP0.997 (0.986–1.01, p = 0.563)1.001 (0.992–1.01, p = 0.810)
Baseline AST0.964 (0.888–1.05, p = 0.353)0.973 (0.916–1.034, p = 0.369)
Baseline Alb1.035 (0.677–1.58, p = 0.874)0.865 (0.617–1.213, p = 0.381)
Baseline LDH0.999 (0.994–1.00, p = 0.786)0.998 (0.994–1.003, p = 0.494)
Baseline GGT0.980 (0.947–1.01, p = 0.177)0.984 (0.960–1.009, p = 0.158)
SUVpeak of primary tumor1.016 (0.932–1.11, p = 0.719)1.005 (0.916–1.102, p = 0.915)
SUVpeak of most avid metastasis1.03 (0.987–1.074, p = 0.152)1.107 (0.977–1.254, p = 0.015)
SUVmax of primary tumor1.00 (0.933–1.08, p = 0.9110.994 (0.921–1.072, p = 0.872)
SUVmax of most avid metastasis1.022 (0.987–1.059, p = 0.210)1.049 (0.985–1.117, p = 0.050)
PSMA-TV (L)0.567 (0.224–1.44, p = 0.113)0.807 (0.501–1.30, p = 0.372)
TL-PSMA (SUVlbm,peak*m3)1.359 (0.827–2.233, p = 0.167)1.309 (0.823–2.081, p = 0.211)
TL-PSMA ≥ 30% y/n23,363.18 (0.00–1.34 × 1028, p < 0.001)NA
PSA > 50% y/nNA16,300 (0.00–9.6 × 1029, p < 0.001)
No comparison could be made for receiving hormone therapy, and the presence of bone metastases as most of the patients received hormone therapy (31/32) and had bone metastases (30/32). Furthermore, no comparison could be made for ISUP score as the individual groups became too small. All variables were tested in a model which included PSMA-TV as a covariate. p-values were calculated using the likelihood ratio test between the model with the variable and the model with only PSMA-TV. Legend: Alb = Albumin, ALP = Alkaline phosphatase, AST = Aspartate aminotransferase, CI = Confidence interval, ECOG = Eastern Cooperative Oncology Group, GGT = Gamma-glutamyltransferase, Hb = Hemoglobin, LDH = Lactic acid dehydrogenase, Lu = Lutetium, NA = Not applicable, Plt = Platelets, PSA = Prostate specific antigen, PSMA = Prostate specific membrane antigen, PSMA-TV = PSMA tumor volume, Ra = Radium, SUV = Standardized uptake value, TL-PSMA = Total lesion PSMA.
Table 7. Univariate Cox-PH regression on the patient-level; significant p-Values in bold.
ParameterHR p-Value
PSMA-TV (per liter)1.250.113
TL-PSMA (per 1000)1.040.316
Highest SUVpeak0.980.121
Highest SUVmax0.990.163
SUVpeak ≥ 14.870.420.115
Gleason (following ISUP grade group) 0.386
1ref
2/30.270.169
40.350.245
50.260.090
Unknown0.150.034
ECOG performance score 0.104
0ref
10.990.971
24.090.026
Lymph node involvement0.890.800
Visceral metastases1.300.565
Biochemical response (PSA reduction > 50%) = yes0.4290.047
Imaging-based response (TL-PSMA reduction ≥ 30%) = yes0.4570.061
Legend: HR = hazard ratio, PSMA-TV = PSMA tumor volume, PSMA = Prostate specific membrane antigen, SUV = Standardized uptake value, TL-PSMA = Total lesion PSMA.
Publisher’s Note: MDPI stays neutral with regard to jurisdictional claims in published maps and institutional affiliations.

