
COVID-19 and the Importance of Being Prepared: A Multidisciplinary Strategy for the Discovery of Antivirals to Combat Pandemics

 , , ,
, , ,
Abstract
:
1. Introduction
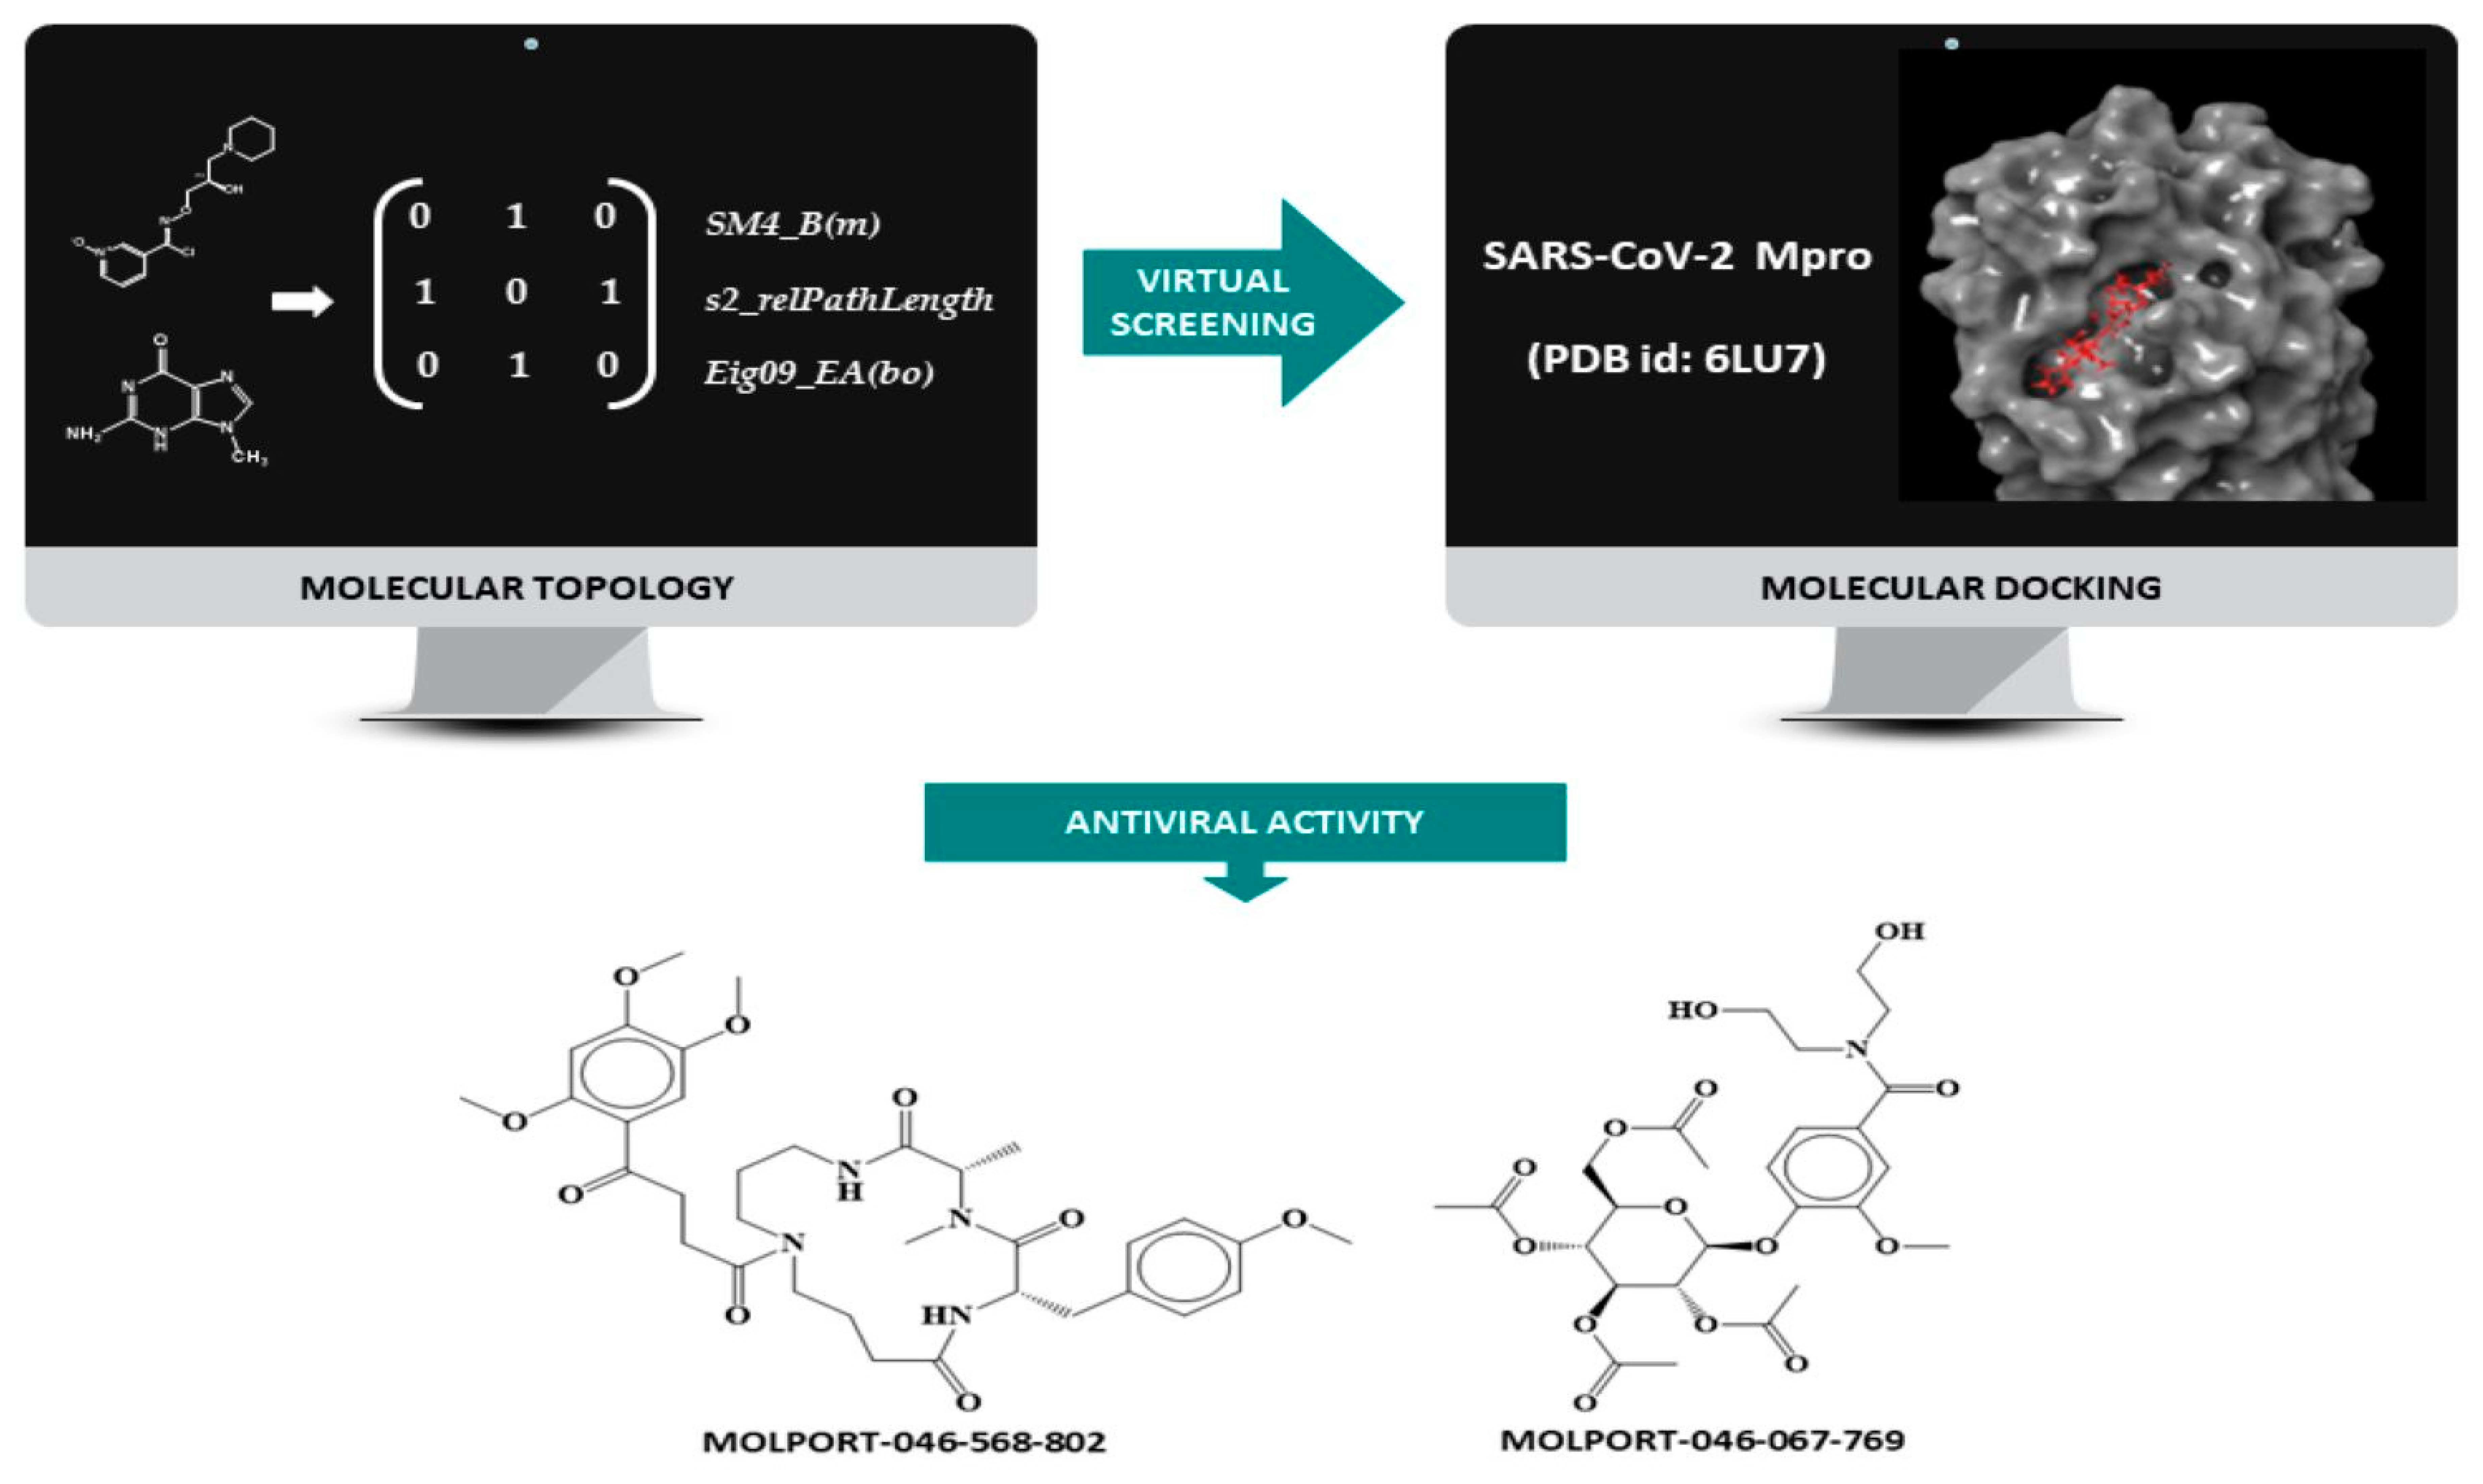
2. Materials and Methods
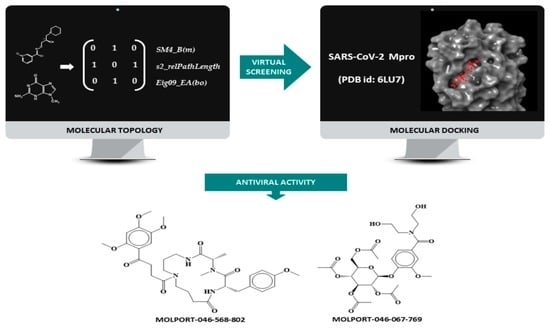
2.1. QSAR Strategy
2.2. Creation of a Data Set of Anti-Protease Compounds: Molecular Docking Studio
2.3. Molecular Docking Simulation
2.4. Topological Descriptors and Statistical Modeling Methods
2.4.1. Linear Discriminant Analysis (LDA)
2.4.2. Multilinear Regression Analysis (MLRA)
2.4.3. Artificial Neural Network Analysis (ANN): Classification and Regression
2.5. QSAR Models and Validation
2.5.1. Classification Matrix and External Validation
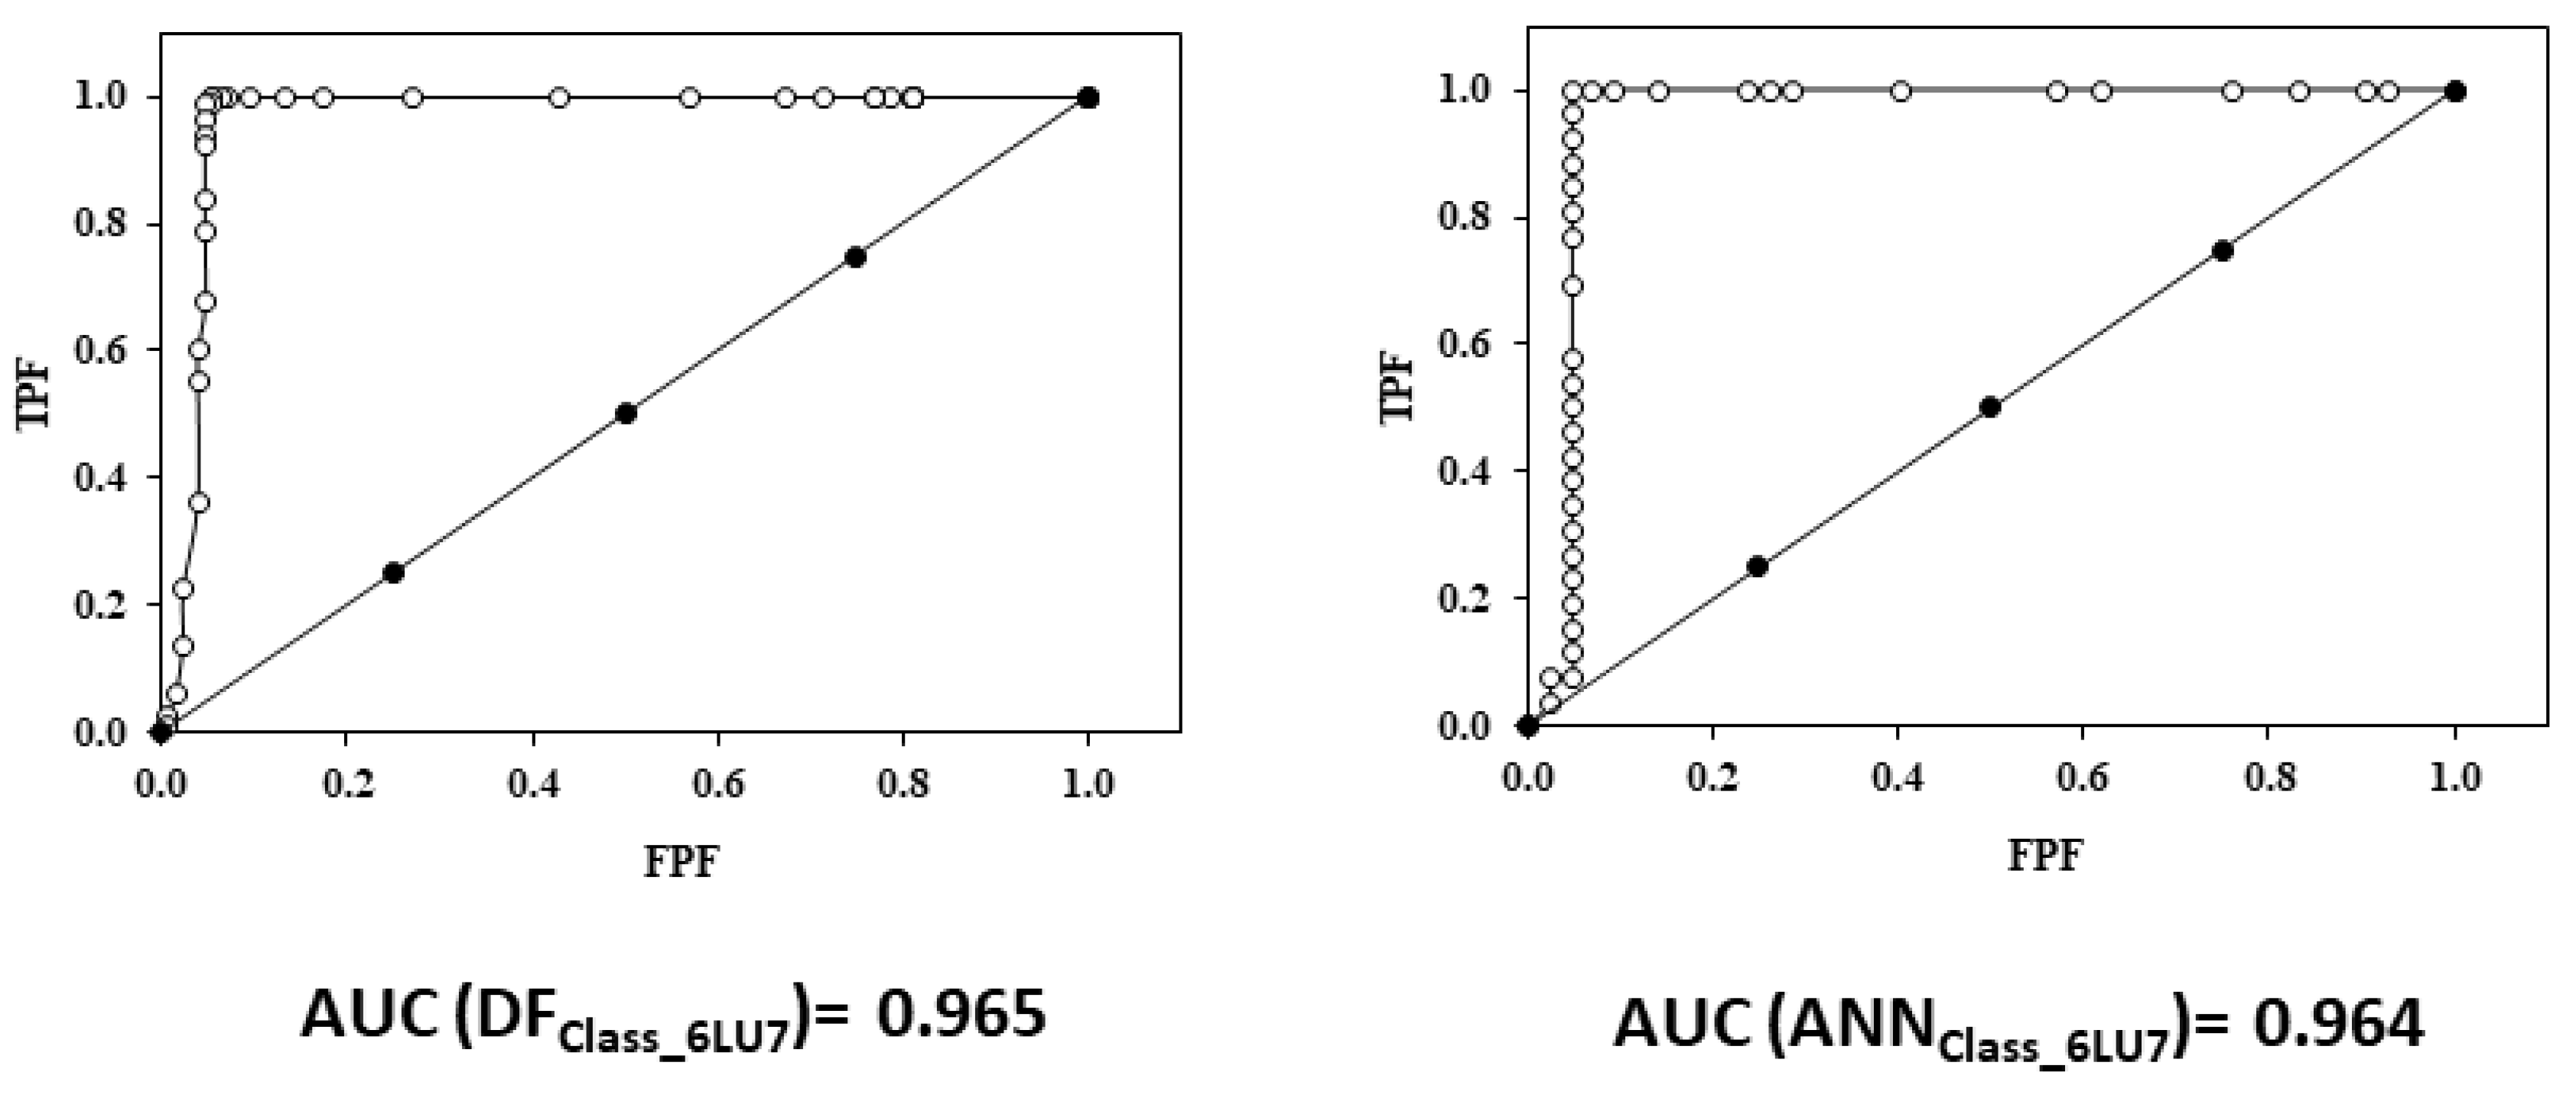
2.5.2. Relative Operating Characteristic Curve (ROC) Curve
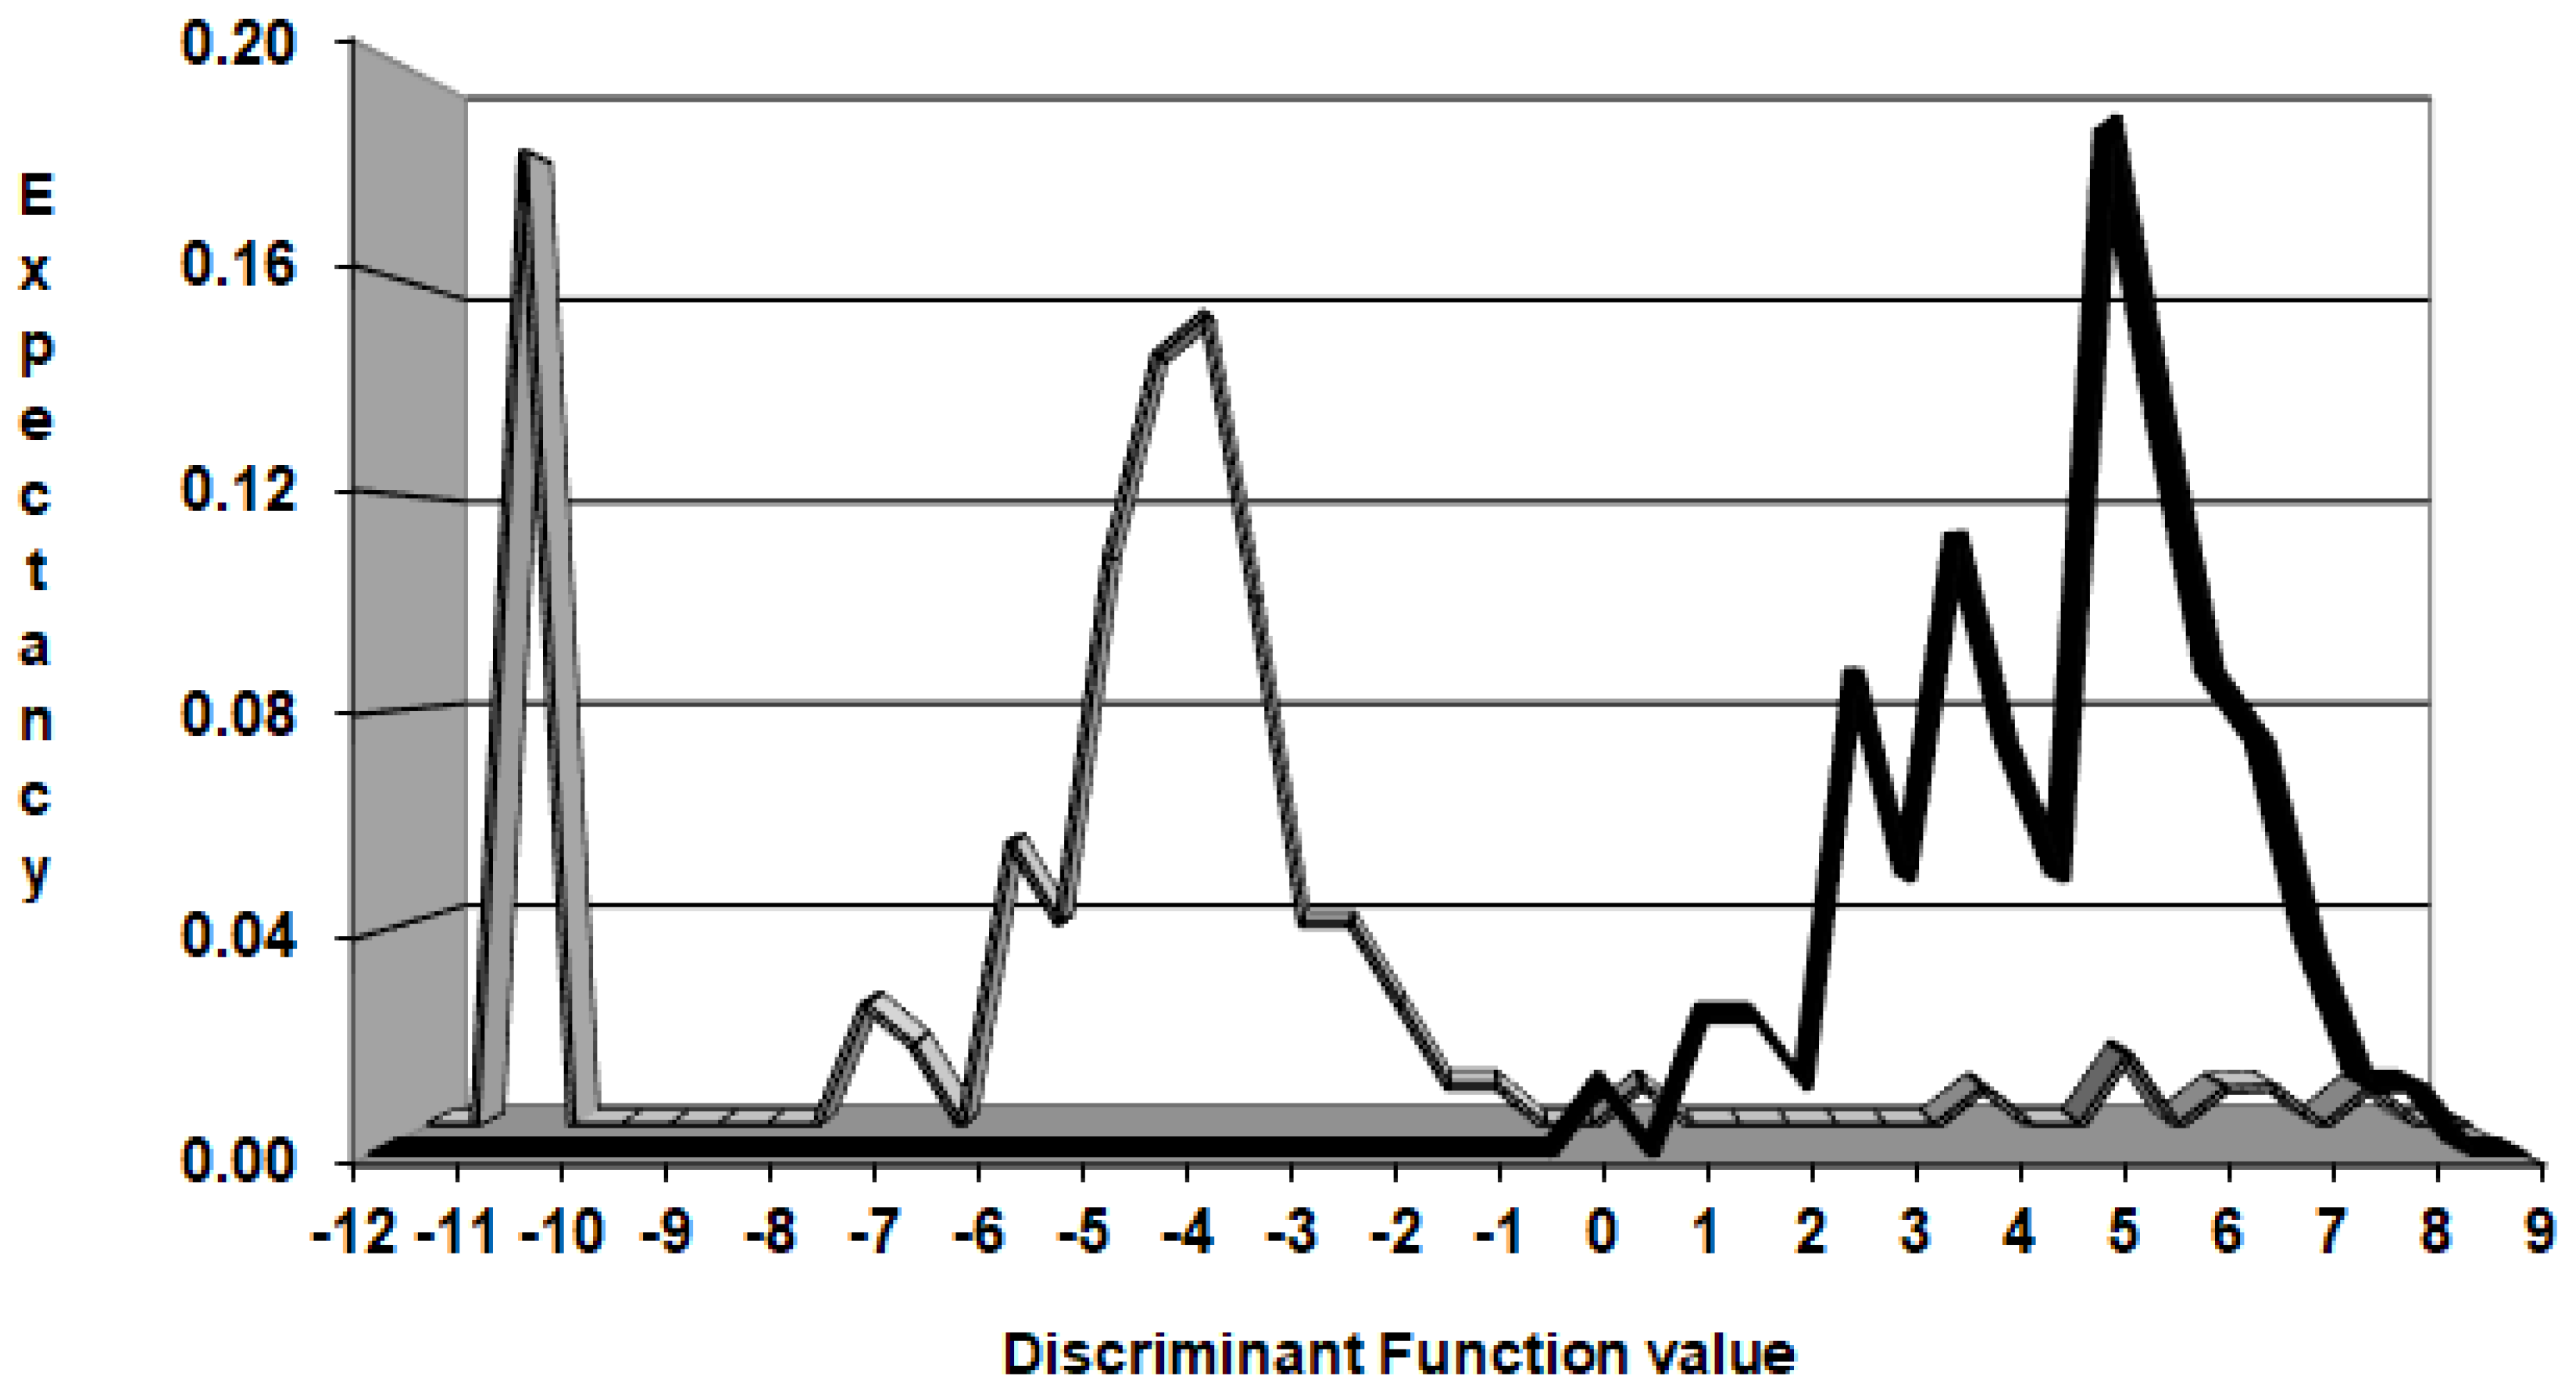
2.6. Pharmacological Distribution Diagrams
2.7. Virtual Screening
2.8. In Vitro Testing
- a.
- Pre-treatment of cells: After discarding its growth medium, the cell monolayers were covered with 100 µL of a solution containing 50 µg/mL of a given compound). Each compound was tested in separate cell monolayers. After incubation at room temperature for 60 min, the monolayers were washed with sterile PBS. Immediately, the washed monolayers were inoculated with serial 10-fold dilutions of 229E (prepared in MEM). The plates were then incubated at 37 °C in a 5% CO2 incubator and examined daily under an inverted microscope for the appearance of virus-induced cytopathic effects (CPE). After 5 days of incubation, 229E titers in pre-treated and untreated monolayers were calculated and compared.
- b.
- Co-treatment of cells with antivirals and virus: Serial 10-fold dilutions of 229E were prepared separately in 1:10 dilutions of each antiviral. From each virus dilution, 100 µL was used to infect MRC-5 monolayers. The titers of 229E prepared in antiviral solutions and 229E prepared in MEM (control) were calculated and compared after 5 days of incubation at 37 °C in a 5% CO2 incubator.
- c.
- Post-infection treatment of cells with antivirals: Cell monolayers were inoculated with serial 10-fold dilutions of the virus followed by incubation at 37 °C for 2 h for viral attachment to the cells. After virus attachment, the monolayers were washed and treated separately with 100 µL of a given antiviral. The titers of 229E were calculated after 5 days of incubation at 37 °C in a 5% CO2 incubator and compared with the control virus titer.
3. Results and Discussion
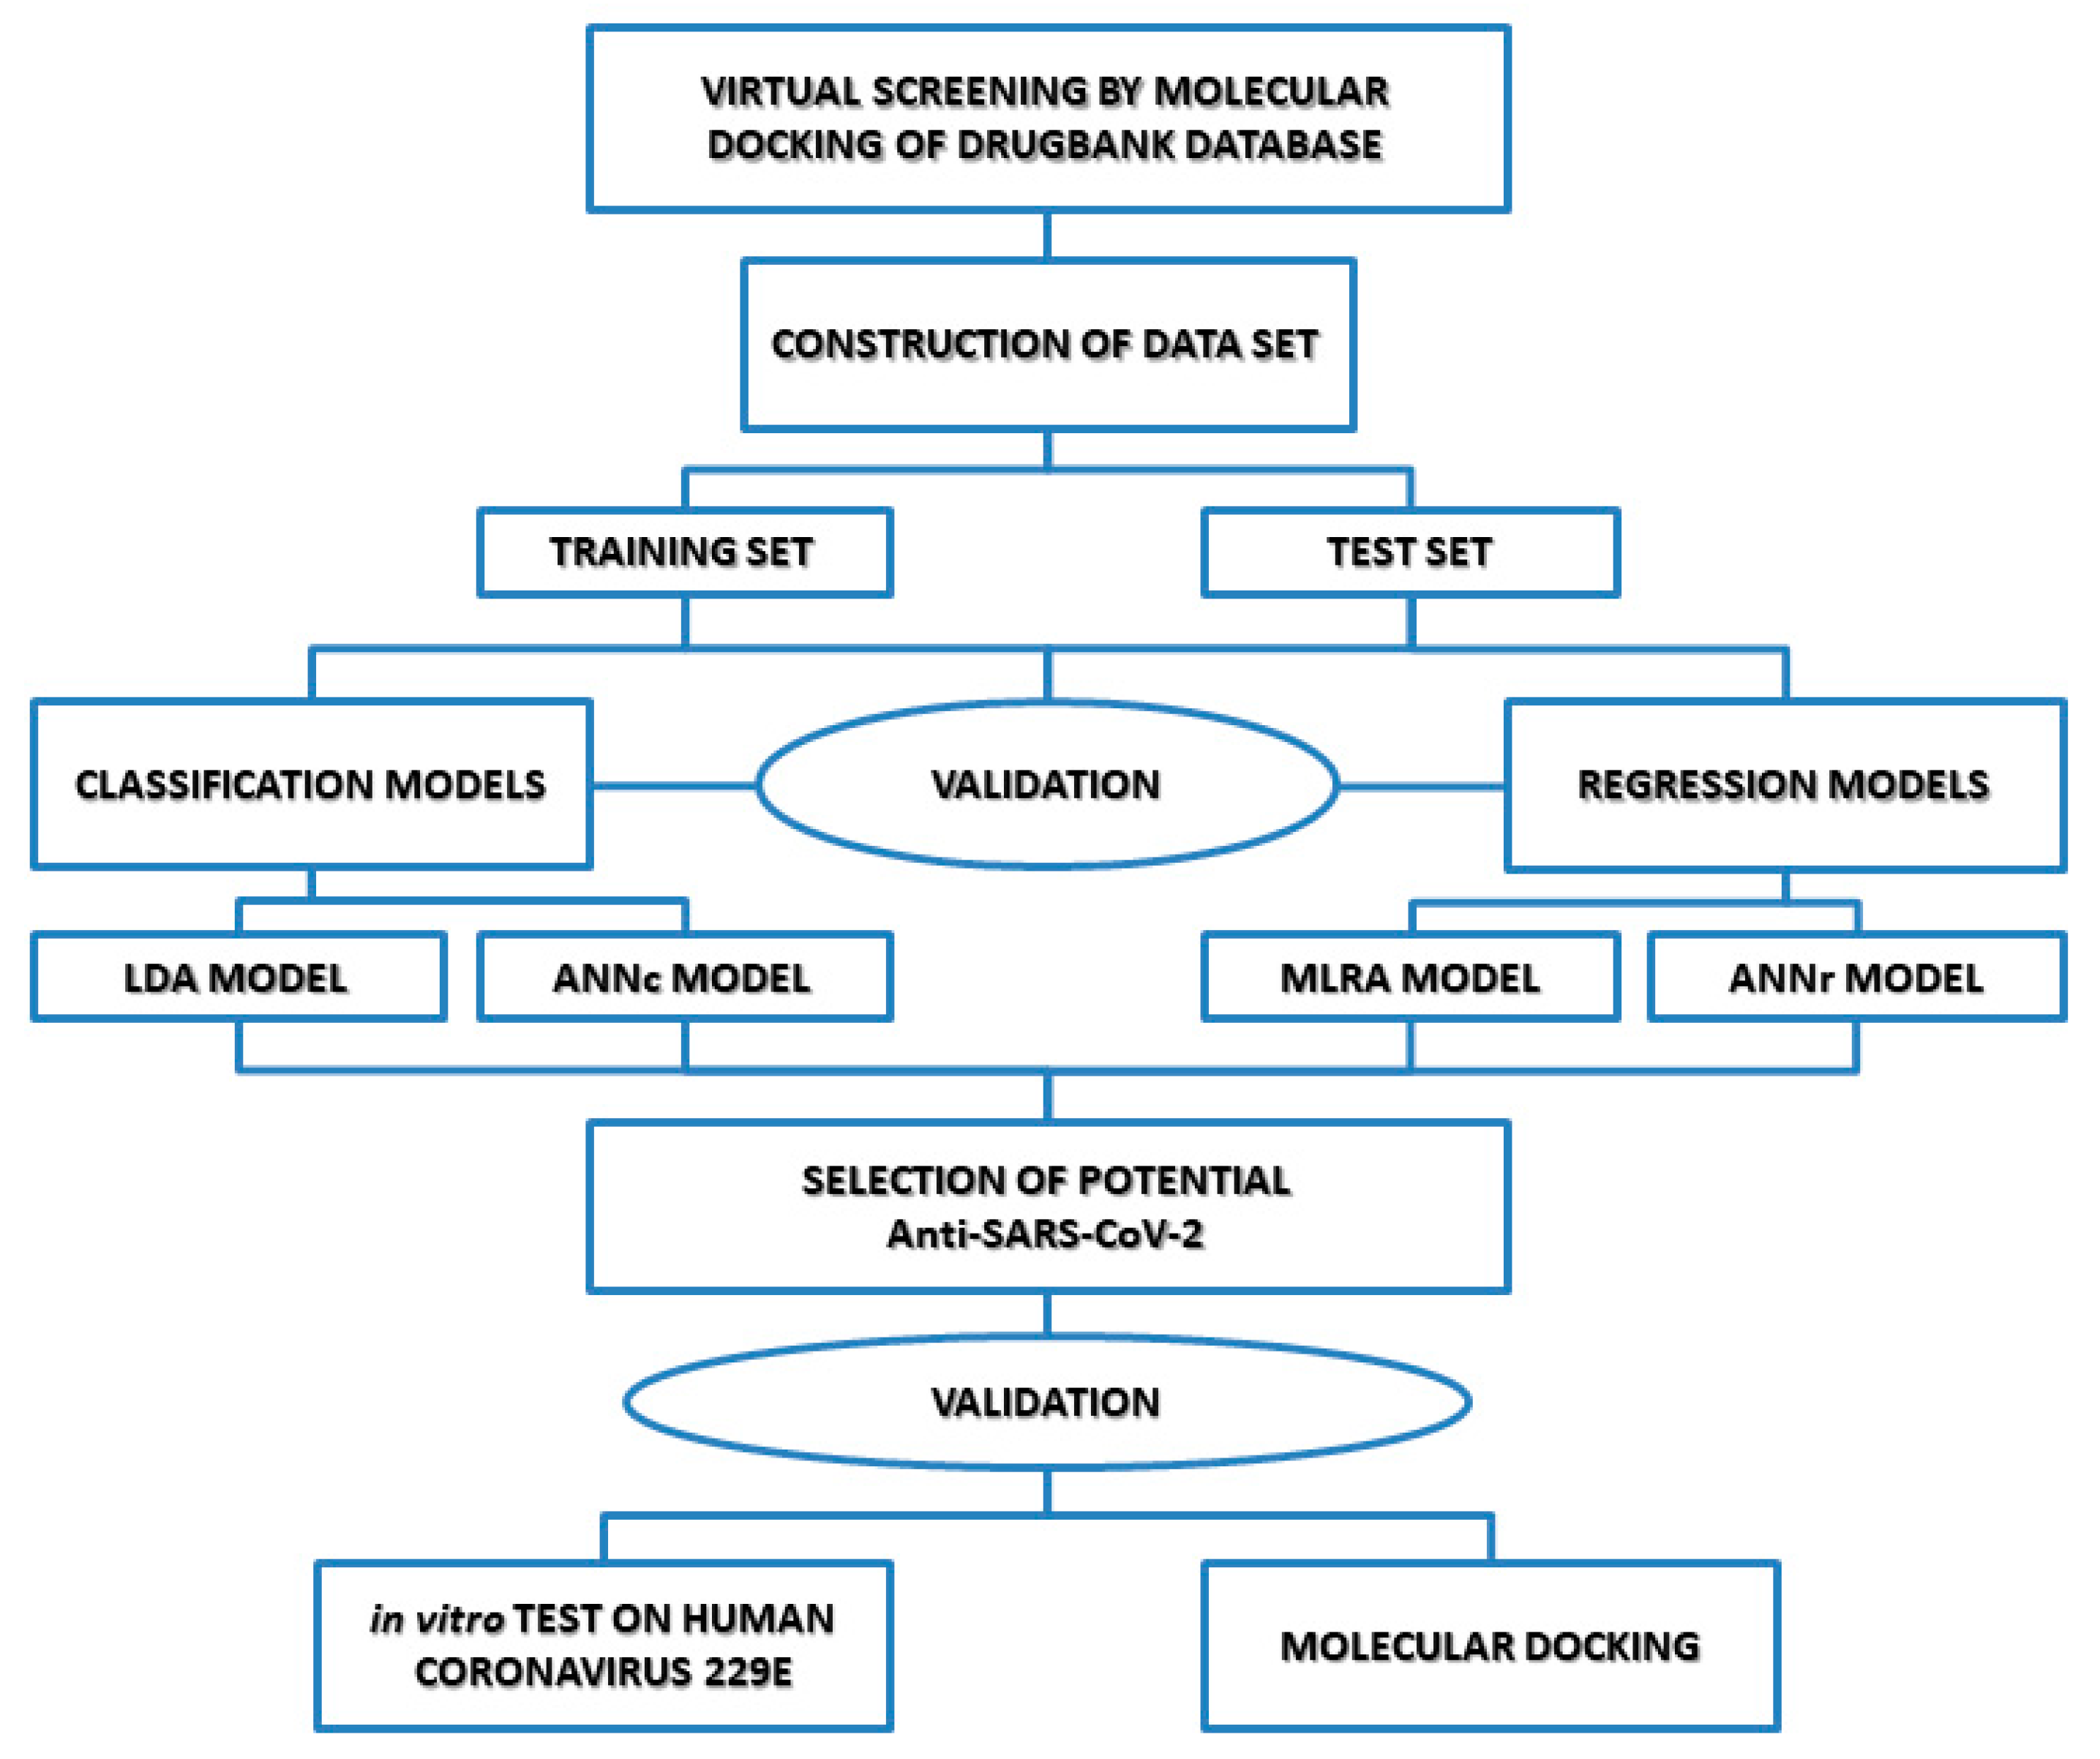
3.1. Molecular Docking Simulation on Mpro
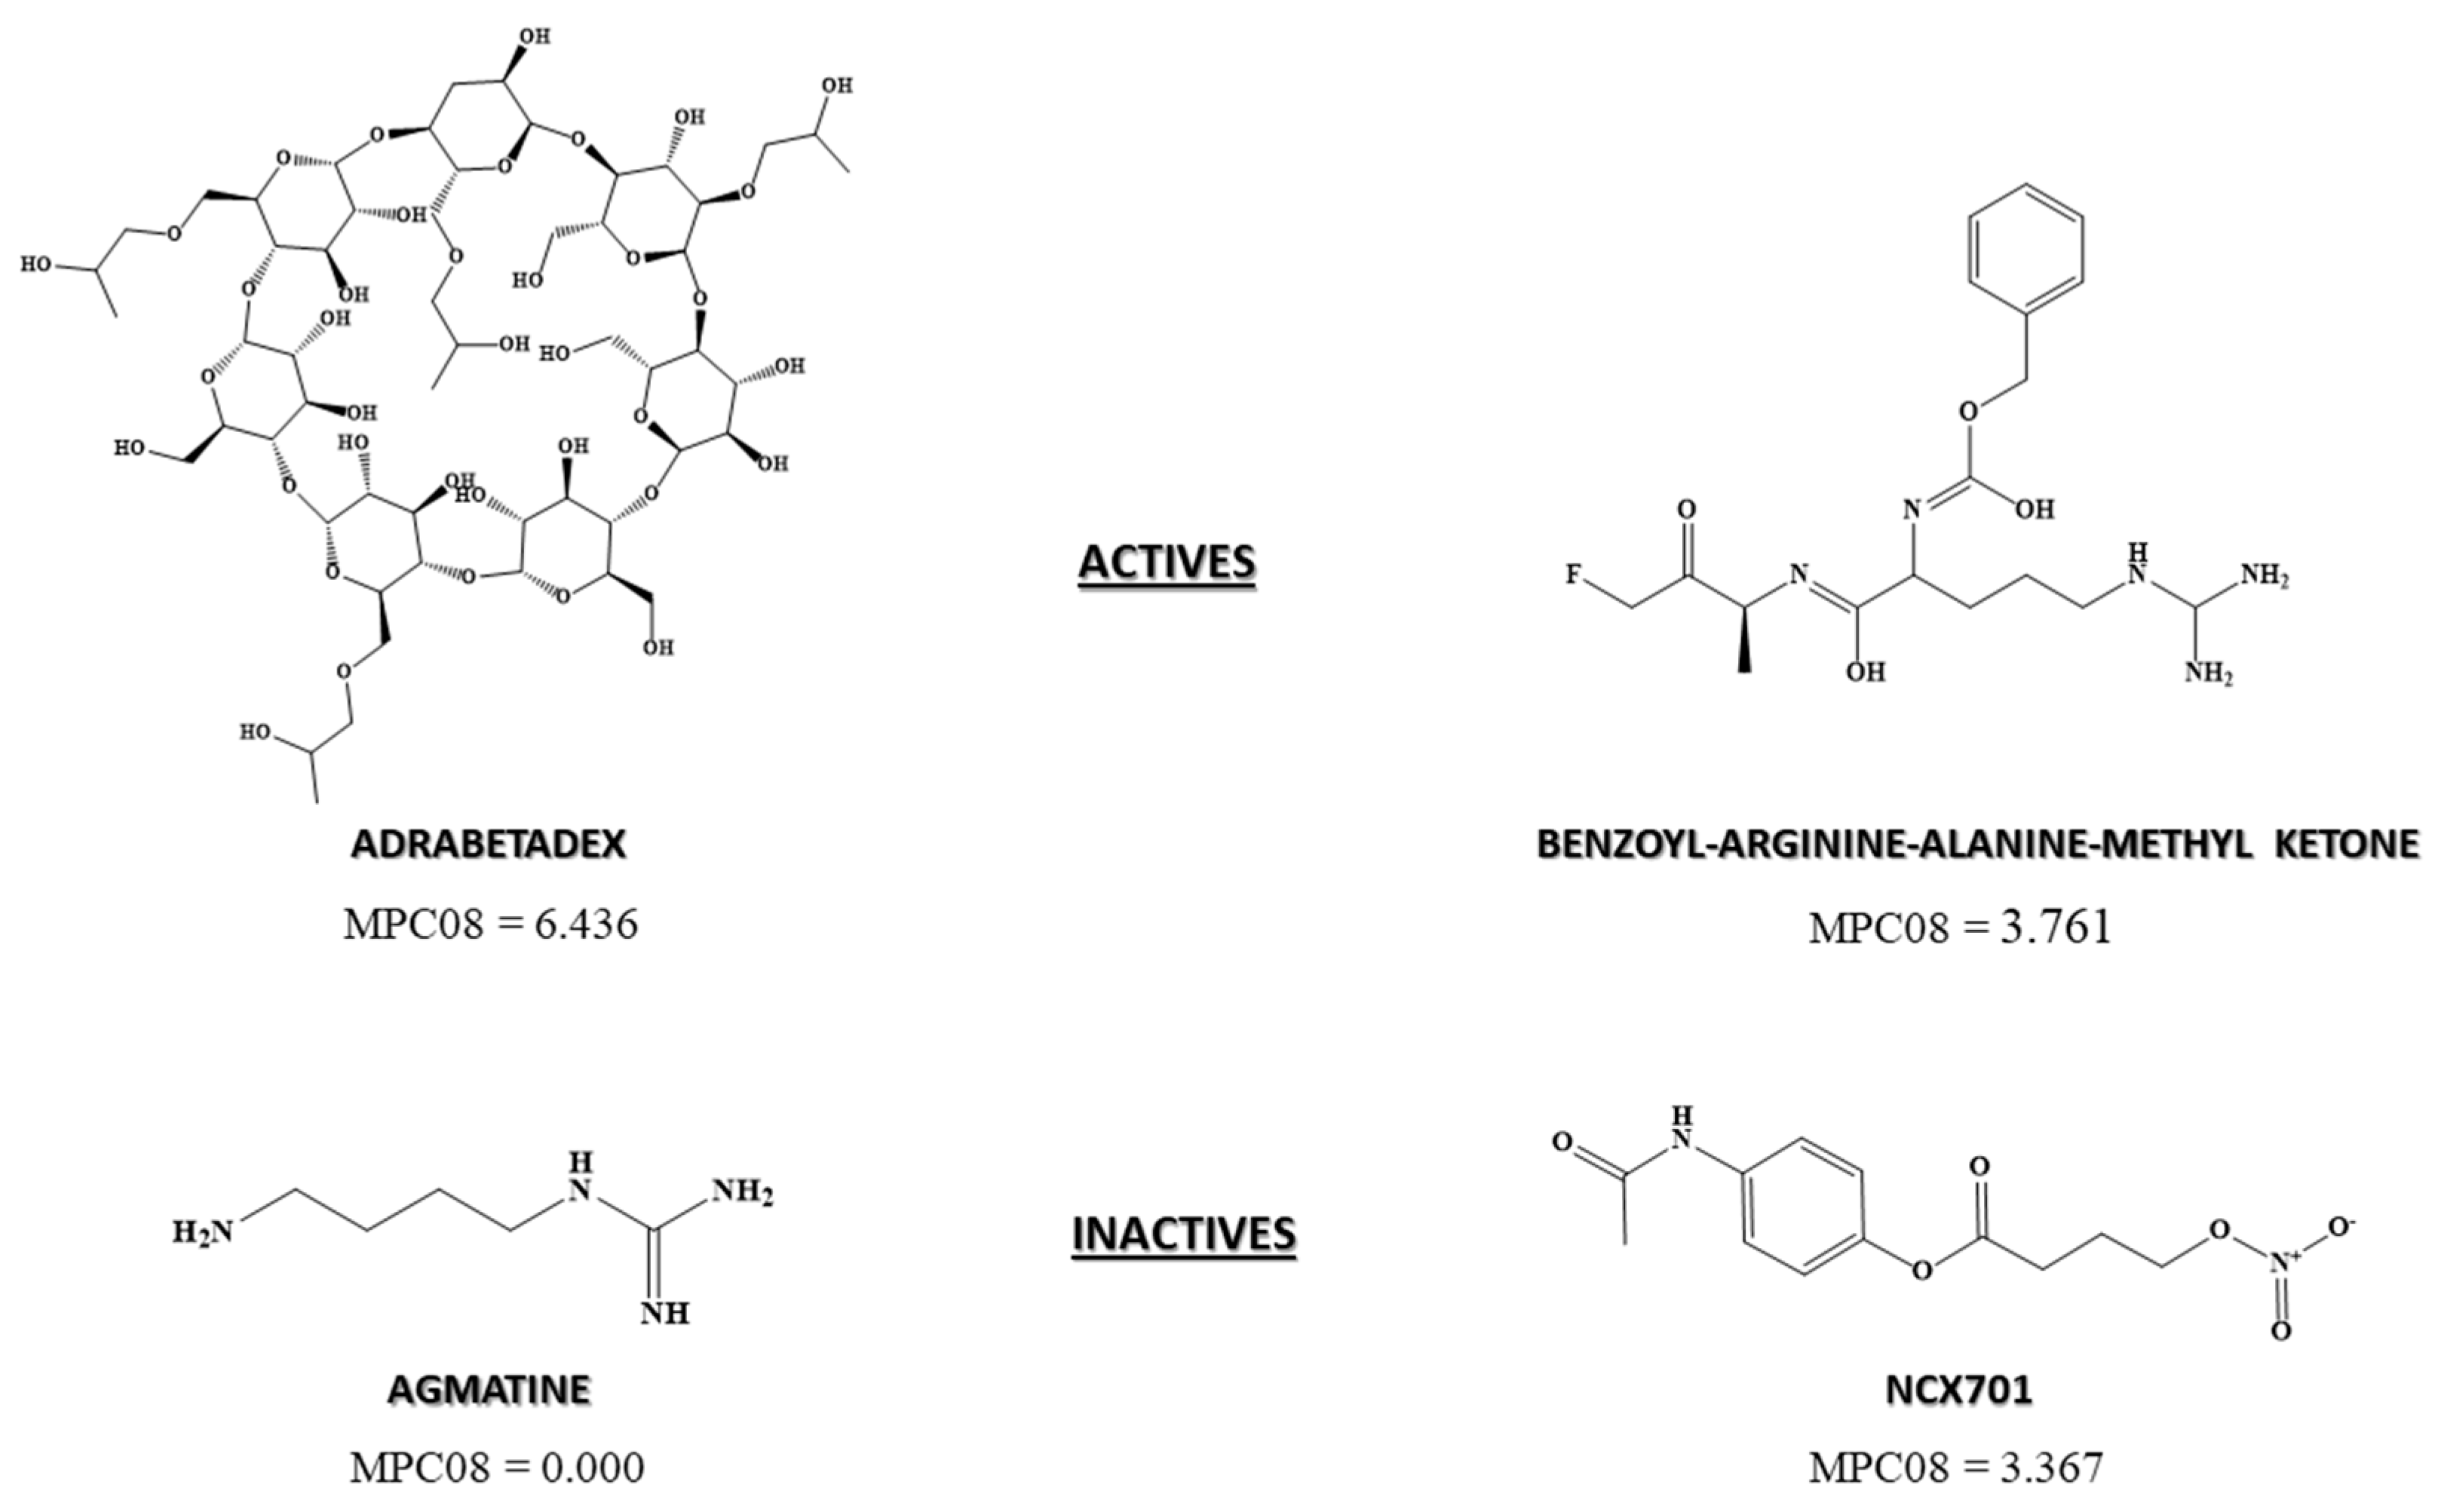
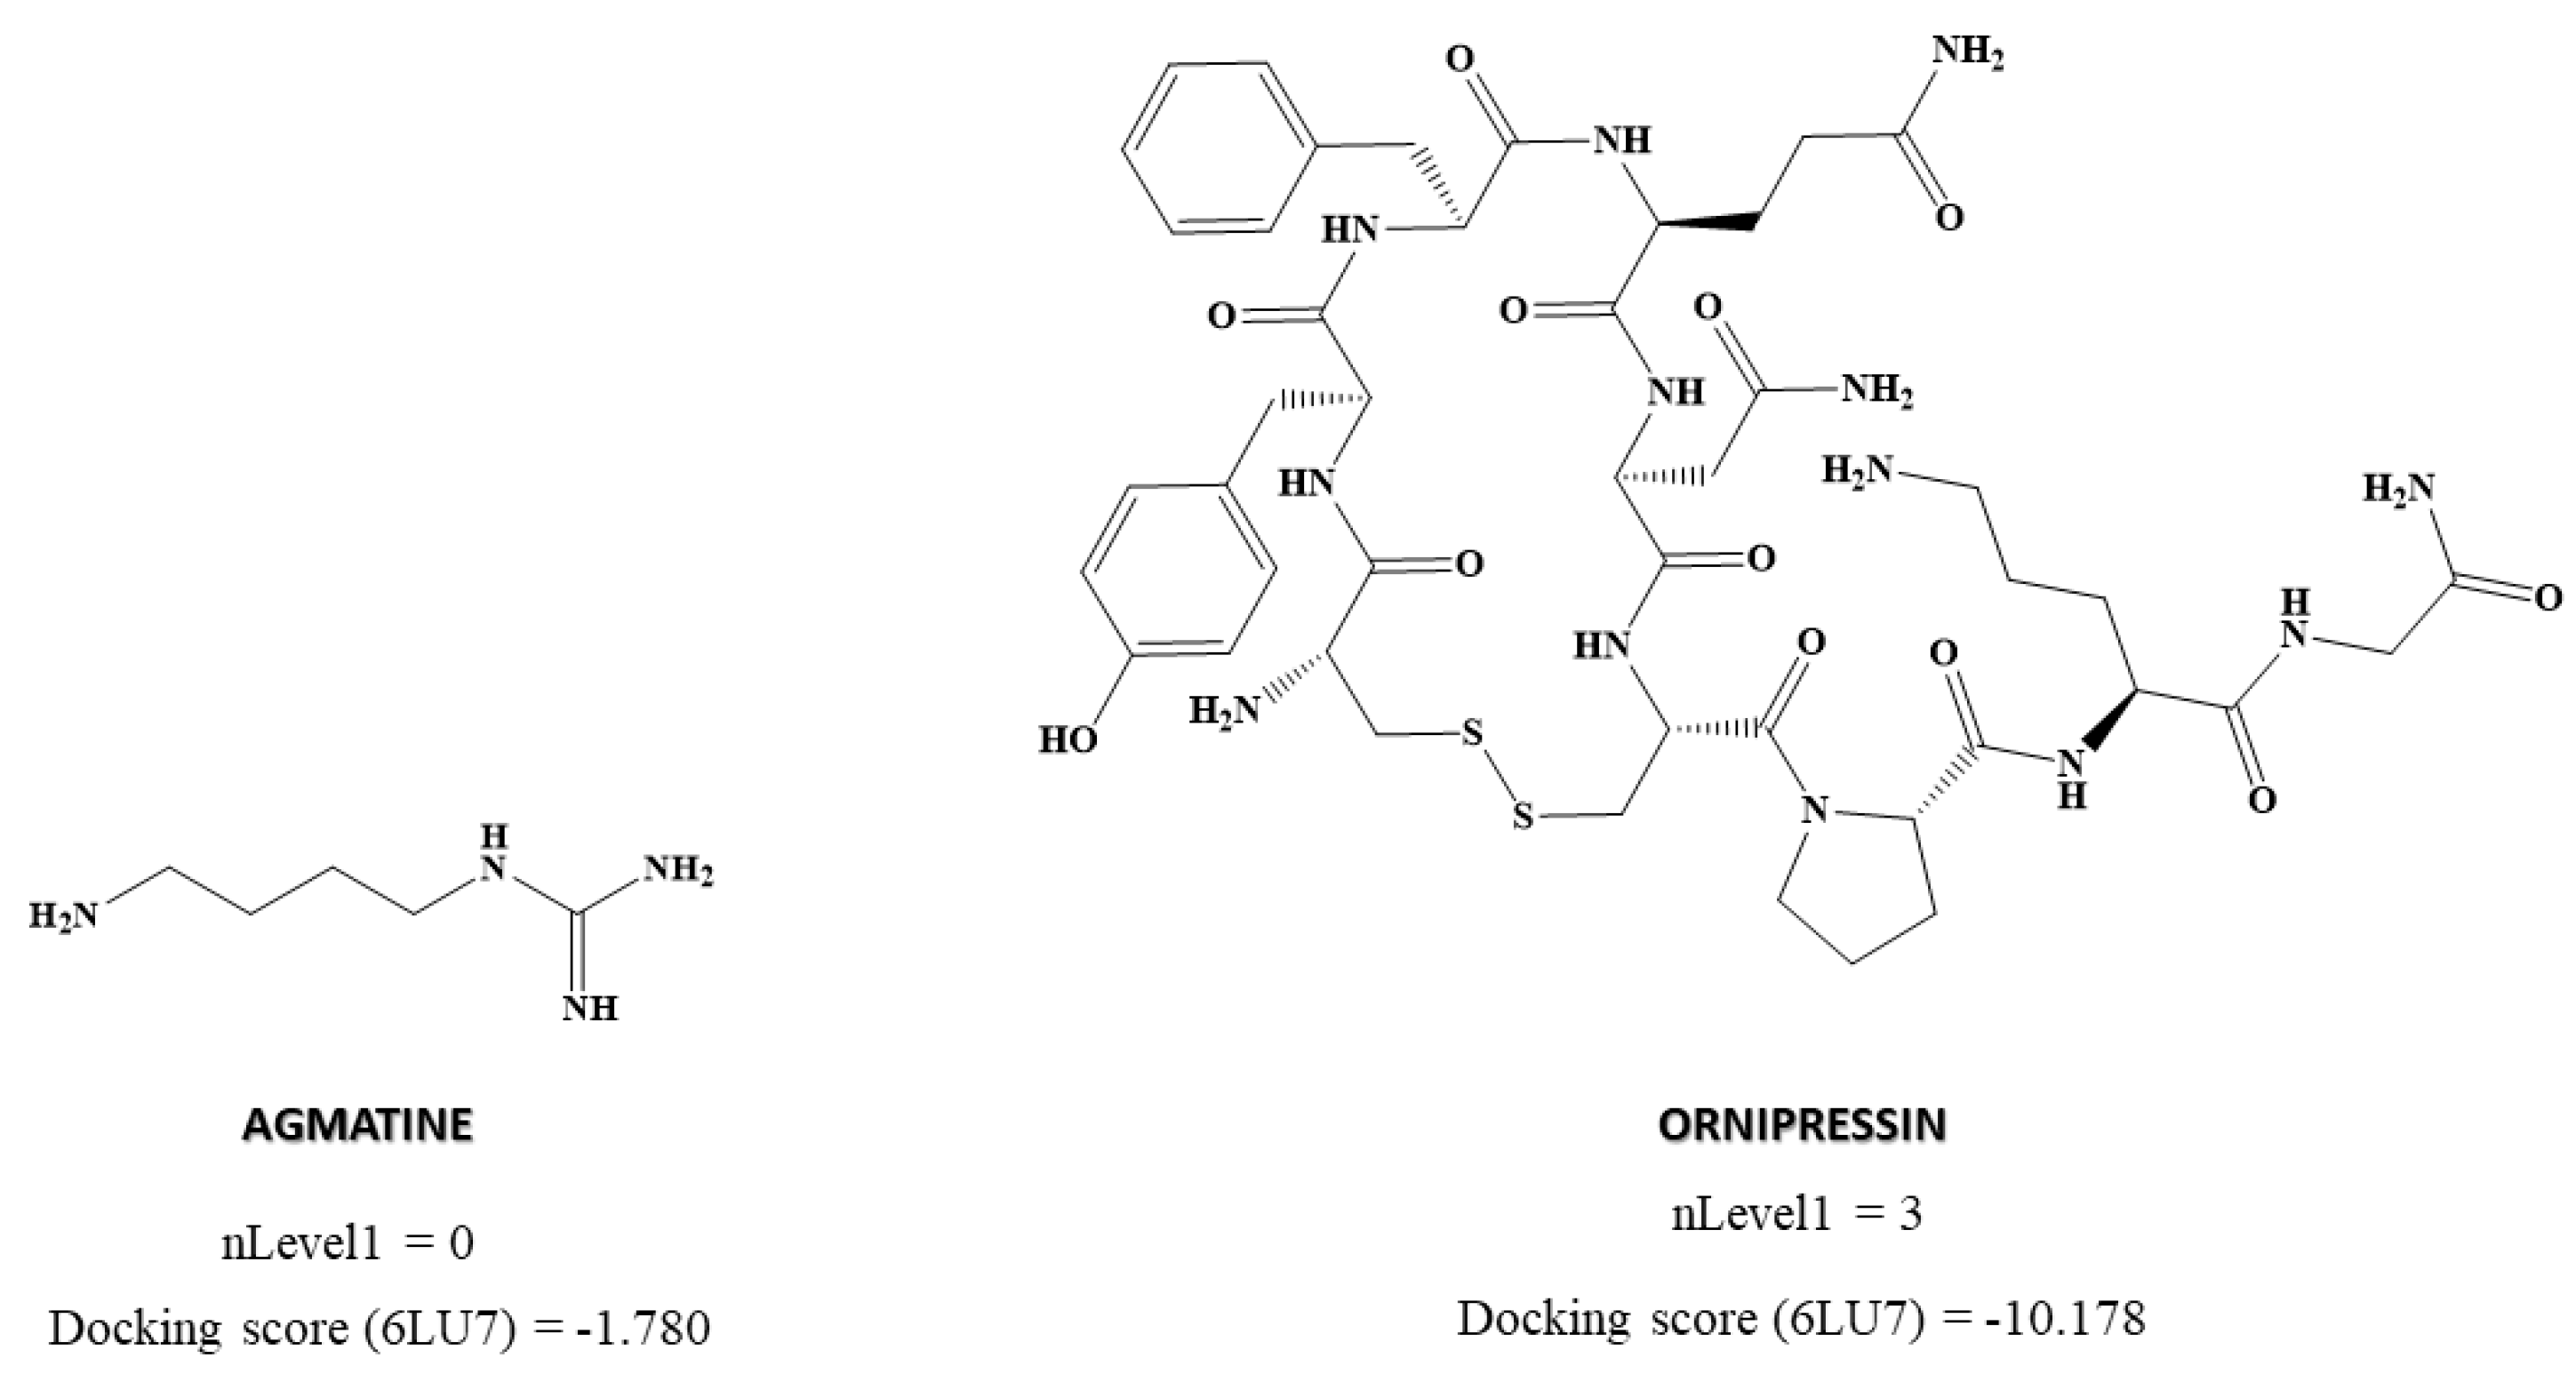
3.2. SARS-CoV-2 Main Protease QSAR Models and Validation
3.2.1. Discriminant Models and Validation
3.2.2. Regression Models and Validation
3.2.3. ROC Curve
3.2.4. Pharmacological Distribution Diagram
3.3. Antiviral Activity of Chemicals against Human Coronavirus 229E
4. Conclusions
Supplementary Materials
Author Contributions
Funding
Institutional Review Board Statement
Informed Consent Statement
Data Availability Statement
Acknowledgments
Conflicts of Interest
References
- Fineberg, H.V. The Toll of COVID-19. JAMA 2020, 324, 1502–1503. [Google Scholar] [CrossRef]
- Ciminelli, G.; Garcia-Mandicó, S. COVID-19 in Italy: An Analysis of Death Registry Data. J. Public Health 2020, 42, 723–730. [Google Scholar] [CrossRef]
- Arango, C. Lessons Learned from the Coronavirus Health Crisis in Madrid, Spain: How COVID-19 has Changed our Lives in the Last 2 Weeks. Biol. Psychiatry 2020, 88, e33. [Google Scholar] [CrossRef]
- Weinberger, D.M.; Cohen, T.; Crawford, F.W.; Mostashari, F.; Olson, D.; Pitzer, V.E.; Reich, N.G.; Russi, M.; Simonsen, L.; Watkins, A. Estimating the Early Death Toll of COVID-19 in the United States. medRxiv 2020. [Google Scholar] [CrossRef]
- Yuki, K.; Fujiogi, M.; Koutsogiannaki, S. COVID-19 Pathophysiology: A Review. Clin. Immunol. 2020, 215, 108427. [Google Scholar] [CrossRef]
- Pushpakom, S.; Iorio, F.; Eyers, P.A.; Escott, K.J.; Hopper, S.; Wells, A.; Doig, A.; Guilliams, T.; Latimer, J.; McNamee, C. Drug Repurposing: Progress, Challenges and Recommendations. Nat. Rev. Drug Discov. 2019, 18, 41–58. [Google Scholar] [CrossRef]
- Mangione, W.; Falls, Z.; Melendy, T.; Chopra, G.; Samudrala, R. Shotgun Drug Repurposing Biotechnology to Tackle Epidemics and Pandemics. Drug Discov. Today 2020, 25, 1126. [Google Scholar] [CrossRef]
- Andrade, B.S.; Rangel, F.d.S.; Santos, N.O.; Freitas, A.d.S.; Soares, W.R.D.A.; Siqueira, S.; Barh, D.; Góes-Neto, A.; Birbrair, A.; Azevedo, V.A.D.C. Repurposing Approved Drugs for Guiding COVID-19 Prophylaxis: A Systematic Review. Frontiers Pharmacol. 2020, 11, 2121. [Google Scholar] [CrossRef]
- Dotolo, S.; Marabotti, A.; Facchiano, A.; Tagliaferri, R. A Review on Drug Repurposing Applicable to COVID-19. Brief. Bioninformat. 2021, 22, 726–741. [Google Scholar] [CrossRef]
- Galvez, J.; Zanni, R.; Galvez-Llompart, M. Drugs Repurposing for Coronavirus Treatment: Computational Study Based on Molecular Topology. Nereis 2020, 15–18. [Google Scholar] [CrossRef]
- Galvez, J.; Zanni, R.; Galvez-Llompart, M.; Benlloch, J.M. Macrolides may Prevent Severe Acute Respiratory Syndrome Coronavirus 2 Entry into Cells: A Quantitative Structure Activity Relationship Study and Experimental Validation. J. Chem. Inf. Model. 2021, 61, 2016–2025. [Google Scholar] [CrossRef] [PubMed]
- Guy, R.K.; DiPaola, R.S.; Romanelli, F.; Dutch, R.E. Rapid Repurposing of Drugs for COVID-19. Science 2020, 368, 829–830. [Google Scholar] [CrossRef] [PubMed]
- Hossen, M.S.; Barek, M.A.; Jahan, N.; Islam, M.S. A Review on Current Repurposing Drugs for the Treatment of COVID-19: Reality and Challenges. SN Compr. Clin. Med. 2020, 2, 1777–1789. [Google Scholar] [CrossRef] [PubMed]
- Kandeel, M.; Al-Nazawi, M. Virtual Screening and Repurposing of FDA Approved Drugs Against COVID-19 Main Protease. Life Sci. 2020, 251, 117627. [Google Scholar] [CrossRef]
- Sultana, J.; Crisafulli, S.; Gabbay, F.; Lynn, E.; Shakir, S.; Trifirò, G. Challenges for Drug Repurposing in the COVID-19 Pandemic Era. Front. Pharmacol. 2020, 11, 1657. [Google Scholar] [CrossRef]
- WHO Solidarity Trial Consortium. Repurposed Antiviral Drugs for COVID-19—Interim WHO SOLIDARITY Trial Results. N. Engl. J. Med. 2021, 384, 497–511. [Google Scholar] [CrossRef]
- Zanni, R.; Galvez-Llompart, M.; Garcia-Domenech, R.; Galvez, J. What Place does Molecular Topology have in Today’s Drug Discovery? Expert Opin. Drug Discov. 2020, 15, 1133–1144. [Google Scholar] [CrossRef]
- Galvez, J.; Zanni, R.; Galvez-Llompart, M.; García-Domenech, R. The Past within the Future. Graph Eigenvalues as Powerful Discriminant Variables in Drug Design. MATCH Commun. Math. Comput. Chem. 2017, 78, 5–16. [Google Scholar]
- García-Domenech, R.; Gálvez, J.; de Julián-Ortiz, J.V.; Pogliani, L. Some New Trends in Chemical Graph Theory. Chem. Rev. 2008, 108, 1127–1169. [Google Scholar] [CrossRef]
- Basak, S.C.; Vracko, M.; Bhattacharjee, A.K. Big Data and New Drug Discovery: Tackling “Big Data” for Virtual Screening of Large Compound Databases. Curr. Comput. Aided Drug Des. 2015, 11, 197–201. [Google Scholar] [CrossRef]
- Basak, S.C. Mathematical descriptors in the prediction of property, bioactivity, and toxicity of chemicals from their structure: A chemical-cum-biochemical Approach, Curr. Comput. Aided Drug Des. 2013, 9, 449–462. [Google Scholar] [CrossRef] [PubMed]
- Basak, S.C.; Vracko, M. (Eds.) Big Data Analytics in Chemoinformatics and Bioinformatics (with Applications to Computer-Aided Drug Design, Cancer Biology, Emerging Pathogens and Computational Toxicology); Elsevier: Amsterdam, The Netherlands, 2022; in press. [Google Scholar]
- Gonzalez, A.; Aboubakr, H.A.; Brockgreitens, J.; Hao, W.; Wang, Y.; Goyal, S.M.; Abbas, A. Durable Nanocomposite Face Masks with High Particulate Filtration and Rapid Inactivation of Coronaviruses. Sci. Rep. 2021, 11, 24318. [Google Scholar] [CrossRef] [PubMed]
- Rut, W.; Groborz, K.; Zhang, L.; Sun, X.; Zmudzinski, M.; Hilgenfeld, R.; Drag, M. Substrate Specificity Profiling of SARS-CoV-2 Mpro Protease Provides Basis for Anti-COVID-19 Drug Design. BioRxiv 2020. [Google Scholar] [CrossRef]
- Xue, X.; Yu, H.; Yang, H.; Xue, F.; Wu, Z.; Shen, W.; Li, J.; Zhou, Z.; Ding, Y.; Zhao, Q. Structures of Two Coronavirus Main Proteases: Implications for Substrate Binding and Antiviral Drug Design. J. Virol. 2008, 82, 2515–2527. [Google Scholar] [CrossRef] [PubMed] [Green Version]
- Liang, P. Characterization and Inhibition of SARS-Coronavirus Main Protease. Curr. Top. Med. Chem. 2006, 6, 361–376. [Google Scholar] [CrossRef] [PubMed]
- Liu, X.; Zhang, B.; Jin, Z.; Yang, H.; Rao, Z. The Crystal Structure of COVID-19 Main Protease in Complex with an Inhibitor N3. Protein DataBank 2020, 10. [Google Scholar] [CrossRef]
- Berman, H.M.; Battistuz, T.; Bhat, T.N.; Bluhm, W.F.; Bourne, P.E.; Burkhardt, K.; Feng, Z.; Gilliland, G.L.; Iype, L.; Jain, S. The Protein Data Bank. Acta Crystallogr. Sect. D. Biol. Crystallogr. 2002, 58, 899–907. [Google Scholar] [CrossRef] [PubMed]
- Wishart, D.S.; Feunang, Y.D.; Guo, A.C.; Lo, E.J.; Marcu, A.; Grant, J.R.; Sajed, T.; Johnson, D.; Li, C.; Sayeeda, Z. DrugBank 5.0: A Major Update to the DrugBank Database for 2018. Nucleic Acids Res. 2018, 46, D1074–D1082. [Google Scholar] [CrossRef]
- Schrödinger Release 2021-4: Maestro; Schrödinger, LLC: New York, NY, USA, 2021.
- Zanni, R.; Galvez-Llompart, M.; Garcia-Domenech, R.; Galvez, J. Latest advances in molecular topology applications for drug discovery. Expert Opin. Drug Discov. 2015, 10, 945–957. [Google Scholar] [CrossRef]
- Gálvez, J.; Gálvez-Llompart, M.; García-Domenech, R. Basic concepts and applications of molecular topology to drug design. In Advances in Mathematical Chemistry and Applications; Bentham Science Publishers: Sharjah, United Arab Emirates, 2015; pp. 161–195. [Google Scholar]
- Amigó, J.M.; Gálvez, J.; Villar, V.M. A review on molecular topology: Applying graph theory to drug discovery and design. Naturwissenschaften 2009, 96, 749–761. [Google Scholar] [CrossRef]
- Basak, S.C.; Dey, T.; Nandy, A. Cluster Analysis of Coronavirus Sequences using Computational Sequence Descriptors: With Applications to SARS, MERS and SARS-CoV-2 (CoVID-19). Curr. Comput.-Aided Drug Des. 2021, 17, 936–945. [Google Scholar]
- Roy, K. Topological Descriptors in Drug Design and Modeling Studies. Mol. Divers. 2004, 8, 321–323. [Google Scholar] [CrossRef] [PubMed]
- Gozalbes, R.; Doucet, J.P.; Derouin, F. Application of Topological Descriptors in QSAR and Drug Design: History and New Trends. Curr. Drug Targets Infect. Disor. 2002, 2, 93–102. [Google Scholar] [CrossRef] [PubMed]
- Galvez, J.; Garcia, R.; Salabert, M.T.; Soler, R. Charge Indexes. New Topological Descriptors. J. Chem. Inf. Comput. Sci. 1994, 34, 520–525. [Google Scholar] [CrossRef]
- Carbó-Dorca, R. Determination of unknown molecular properties in molecular spaces. J. Math. Chem. 2022, 60, 353–359. [Google Scholar] [CrossRef]
- Repasky, M.P.; Shelley, M.; Friesner, R.A. Flexible Ligand Docking with Glide. Current Prot, Bioinf. 2007, 18, 8.12. 1–8.12. 36. [Google Scholar]
- Mauri, A. alvaDesc: A tool to calculate and analyze molecular descriptors and fingerprints. In Ecotoxicological QSARs; Springer: Berlin/Heidelberg, Germany, 2020; pp. 801–820. [Google Scholar]
- Gramatica, P. On the development and validation of QSAR models. In Computational Toxicology; Springer: Berlin/Heidelberg, Germany, 2013; pp. 499–526. [Google Scholar]
- Weiß, C.H. AStA Advances in Statistical Analysis; Statsoft, Inc.; Statistica: Tulsa, OK, USA, 2007; Version 8. [Google Scholar]
- Mark, H. Data analysis: Multilinear regression and principal component analysis. In Handbook of Near-Infrared Analysis; CRC Press: Boca Raton, FL, USA, 2007; pp. 169–206. [Google Scholar]
- Pogliani, L.; de Julián-Ortiz, J.V. Testing Selected Optimal Descriptors with Artificial Neural Networks. RSC Adv. 2013, 3, 14710–14721. [Google Scholar] [CrossRef]
- Caballero, J.; Zampini, F.M.; Collina, S.; Fernández, M. Quantitative Structure–Activity Relationship Modeling of Growth Hormone Secretagogues Agonist Activity of some Tetrahydroisoquinoline 1-Carboxamides. Chem. Biol. Drug Des. 2007, 69, 48–55. [Google Scholar] [CrossRef]
- Demler, O.V.; Pencina, M.J.; D’Agostino, R.B., Sr. Equivalence of Improvement in Area Under ROC Curve and Linear Discriminant Analysis Coefficient Under Assumption of Normality. Stat. Med. 2011, 30, 1410–1418. [Google Scholar] [CrossRef]
- Gálvez, J.; García-Domenech, R.; de Gregorio Alapont, C.; de Julián-Ortiz, J.V.; Popa, L. Pharmacological Distribution Diagrams: A Tool for De Novo Drug Design. J. Mol. Graph. 1996, 14, 272–276. [Google Scholar] [CrossRef]
- Kärber, G. Beitrag zur kollektiven Behandlung pharmakologischer Reihenversuche. Naunyn-Schmiedebergs Arch. Für Exp. Pathol. Und Pharmakol. 1931, 162, 480–483. [Google Scholar] [CrossRef]
- Jin, Z.; Du, X.; Xu, Y.; Deng, Y.; Liu, M.; Zhao, Y.; Zhang, B.; Li, X.; Zhang, L.; Peng, C. Structure of M Pro from SARS-CoV-2 and Discovery of its Inhibitors. Nature 2020, 582, 289–293. [Google Scholar] [CrossRef] [PubMed] [Green Version]
- Daré, J.K.; Freitas, M.P.J. Is conformation relevant for QSAR purposes? 2D Chemical representation in a 3D-QSAR perspective. J. Comput. Chem. 2022, 43, 917–922. [Google Scholar] [CrossRef] [PubMed]
- Dong, W.; Farooqui, A.; Leon, A.J.; Kelvin, D.J. Inhibition of Influenza A Virus Infection by Ginsenosides. PLoS ONE 2017, 12, e0171936/1. [Google Scholar] [CrossRef] [PubMed]
- Kim, S.; Jang, J.Y.; Kim, E.; Cho, E.K.; Ahn, D.; Kim, C.; Park, H.S.; Jeong, S.W.; Lee, S.H.; Kim, S.G.; et al. Ginsenoside Rg3 Restores Hepatitis C Virus-Induced Aberrant Mitochondrial Dynamics and Inhibits Virus Propagation. Hepatology 2017, 66, 758–771. [Google Scholar] [CrossRef] [PubMed]
- Song, J.; Choi, H.; Song, H.; Hong, E.; Lee, B.; Oh, S.; Choi, K.; Yeo, S.; Lee, Y.; Cho, S.; et al. Antiviral Activity of Ginsenosides Against Coxsackievirus B3, Enterovirus 71, and Human Rhinovirus 3. J. Ginseng Res. 2014, 38, 173–179. [Google Scholar] [CrossRef] [Green Version]
- Park, H.H.; Kim, H.; Lee, H.S.; Seo, E.U.; Kim, J.; Lee, J.; Mun, Y.; Yoo, S.; An, J.; Yun, M.; et al. PEGylated Nanoparticle Albumin-Bound Steroidal Ginsenoside Derivatives Ameliorate SARS-CoV-2-Mediated Hyper-Inflammatory Responses. Biomaterials 2021, 273, 120827. [Google Scholar] [CrossRef]
- Verdejo, C.; Vergara-Merino, L.; Meza, N.; Pérez-Bracchiglione, J.; Carvajal-Juliá, N.; Madrid, E.; Rada, G.; Rojas Reyes, M.X. Macrolides for the Treatment of COVID-19: A Living, Systematic Review. Medwave 2020, 20, e8074. [Google Scholar] [CrossRef]
- Sterenczak, K.A.; Barrantes, I.; Stahnke, T.; Stachs, O.; Fuellen, G.; Undre, N. Co-Infections: Testing Macrolides for Added Benefit in Patients with COVID-19. Lancet Microbe 2020, 1, e313. [Google Scholar] [CrossRef]
- Fehrentz, J.A.; Chomier, B.; Bignon, E.; Venaud, S.; Chermann, J.C.; Nisato, D. Statine Based Tripeptides as Potent Inhibitors of HIV-1 Replication. Biochem. Biophys. Res. Commun. 1992, 188, 873. [Google Scholar] [CrossRef]
- Luftig, R.B.; Bu, M.; Ikuta, K. Morphogenesis of Retroviruses in the Presence and Absence of Protease Inhibitors. In Proteases of Retroviruses; Walter de Gruyter &Co.: Berlin, Germany, 1989; p. 11. [Google Scholar]
- Matarrese, P.; Nencioni, L.; Checconi, P.; Ciarlo, L.; Gambardella, L.; Ascione, B.; Sgarbanti, R.; Garaci, E.; Malorni, W.; Palamara, A.T. Pepstatin A Alters Host Cell Autophagic Machinery and Leads to a Decrease in Influenza A Virus Production. J. Cell. Physiol. 2011, 226, 3368–3377. [Google Scholar] [CrossRef] [PubMed]
- Silva, J.R.A.; Kruger, H.G.; Molfetta, F.A. Drug Repurposing and Computational Modeling for Discovery of Inhibitors of the Main Protease (Mpro) of SARS-CoV-2. RSC Adv. 2021, 11, 23450–23458. [Google Scholar] [CrossRef] [PubMed]
- Mittal, L.; Kumari, A.; Srivastava, M.; Singh, M.; Asthana, S. Identification of Potential Molecules Against COVID-19 Main Protease through Structure-Guided Virtual Screening Approach. J. Biomol. Struct. Dyn. 2021, 39, 3662–3680. [Google Scholar] [CrossRef]
- Ghosh, K.; Amin, S.A.; Gayen, S.; Jha, T. Chemical-Informatics Approach to COVID-19 Drug Discovery: Exploration of Important Fragments and Data Mining Based Prediction of some Hits from Natural Origins as Main Protease (Mpro) Inhibitors. J. Mol. Struct. 2021, 1224, 129026. [Google Scholar] [CrossRef] [PubMed]


| Statistical Method | Model | Model Parameters |
|---|---|---|
| LDA | N = 206 λ = 0.305 F = 417.37 p < 0.00001 | |
| ANN |  ANNClass_6LU7 MLP 1 *-2-2 | Training algorithm: BFGS 8 Error function: Entropy Hidden activation function: Tanh Output activation function: Softmax |
| Model | External Validation | ||||||
|---|---|---|---|---|---|---|---|
| % of Correct Classification | Active | Inactive | % of Correct Classification | Active | Inactive | ||
| Active | 100.0 | 80 | 0 | 100.0 | 26 | 0 | |
| DFClass_6LU7 | Inactive | 94.4 | 7 | 119 | 95.2 | 2 | 40 |
| Average | 97.2 | 97.6 | |||||
| Active | 100.0 | 80 | 0 | 100.0 | 26 | 0 | |
| ANNClass_6LU7 | Inactive | 94.4 | 7 | 119 | 95.2 | 2 | 40 |
| Average | 97.2 | 97.6 | |||||
| Statistical Method | Model | Model Parameters |
|---|---|---|
| MLR | N = 206 r2 = 0.884 F = 255.927 p < 0.00001 SEE = 1.415 q2 = 0.741 | |
| ANN |  ANNreg_6LU7 MLP 4 *-2-1 | N = 206 r2 = 0.887 q2 = 0.764 Training algorithm: BFGS 73 Error function: SOS Hidden activation function: Tanh Output activation function: Logistic |
| Descriptor Type | Descriptor Name | Descriptor Definition |
|---|---|---|
| 2D matrix-based descriptors | SM4_B(m) | Spectral moment of order 4 from Burden matrix weighted by mass |
| Atom-centered fragments | N-068 | Al3-N |
| Chirality descriptors | nLevel1 | Number of neighboring atoms of the chiral center (level 1) |
| Chirality descriptors | s2_relPathLength | Maximum path length of the substituent 2 normed by the heavy atoms |
| Edge adjacency indices | Eig09_EA(bo) | Eigenvalue nº 9 from edge adjacency matrix weighted by bond order |
| Edge adjacency indices | SpDiam_EA(bo) | Spectral diameter from edge adjacency matrix weighted by bond order |
| Functional group counts | nRNR2 | Number of tertiary amines (aliphatic) |
| Pharmacophore descriptors | CATS2D_05_LL | CATS2D Lipophilic-Lipophilic at lag 05 |
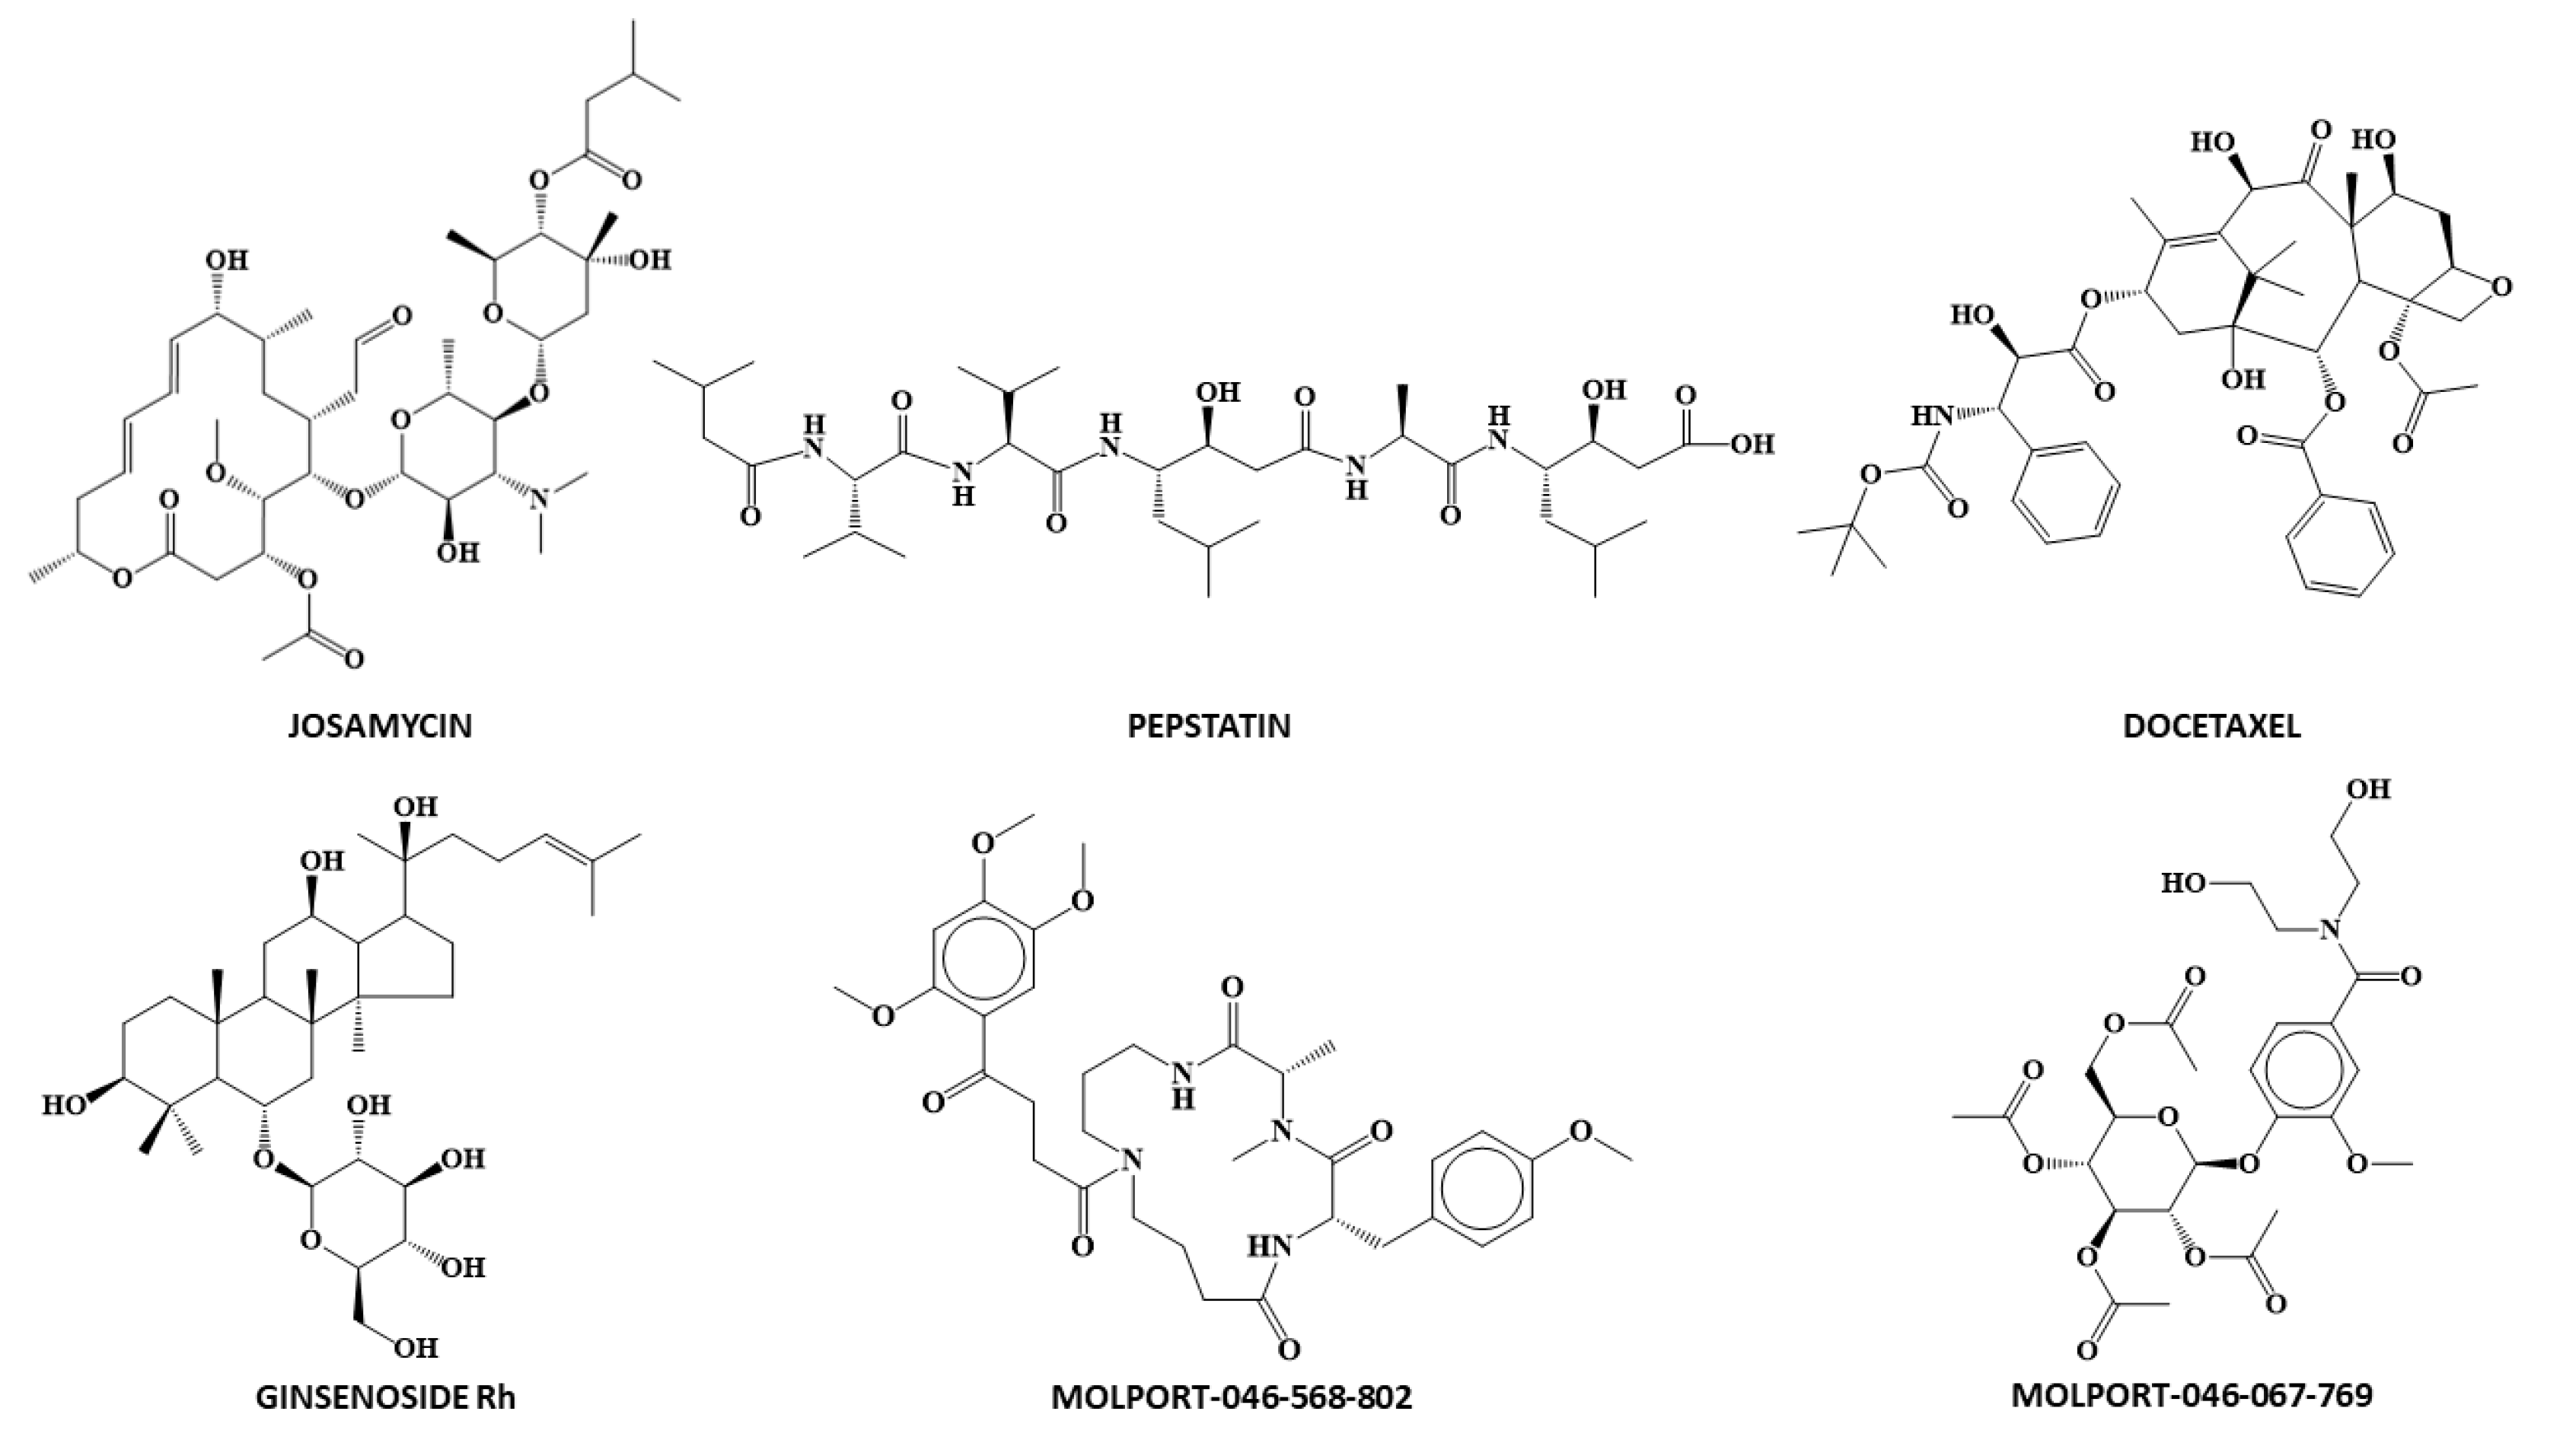
| Drug | DFClass_6LU7 | P.A. | ANNClass_6LU7 | Conf. Levels | Docking ScoreMLRreg_6LU7 | Docking ScoreANNreg_6LU7 |
|---|---|---|---|---|---|---|
| Docetaxel | 7.630 | 1.000 | 1 | 0.873 | −7.853 | −6.813 |
| Ginsenoside | 8.379 | 1.000 | 1 | 0.873 | −5.319 | −4.300 |
| Josamycin | 5.473 | 0.996 | 1 | 0.873 | −6.158 | −6.718 |
| Molport-046-067-769 | 4.598 | 0.990 | 1 | 0.872 | −8.628 | −8.842 |
| Molport-046-568-802 | 3.557 | 0.972 | 1 | 0.871 | −8.213 | −8.584 |
| Pepstatin A | 1.758 | 0.853 | 1 | 0.854 | −6.163 | −5.975 |
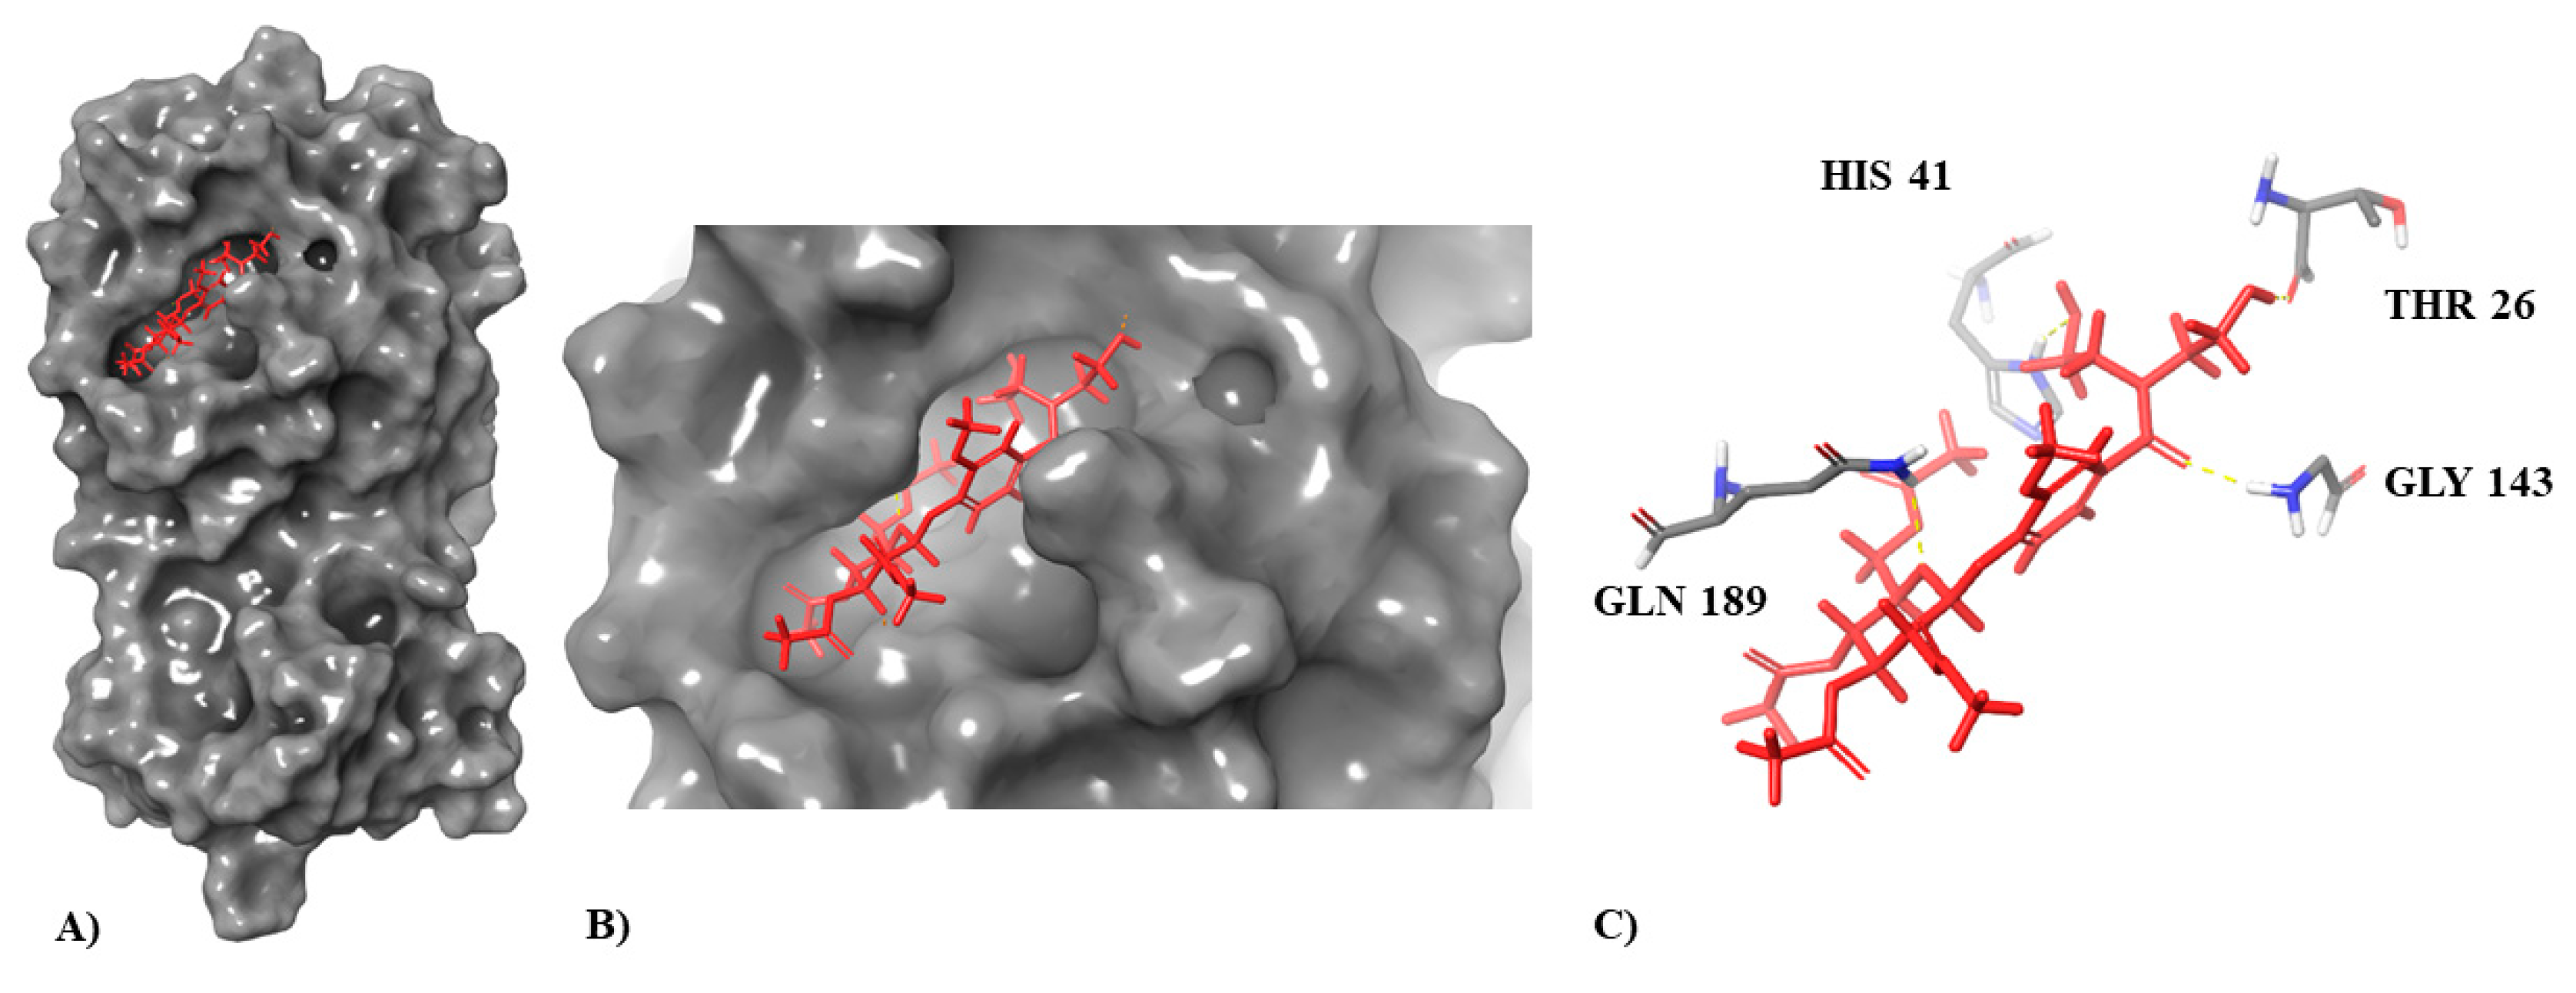
| Compound | Docking Score | Interaction with Indicated Amino Acids |
|---|---|---|
| Inhibitor N3 (co-crystallized ligand) | −8.019 | Glu166 (3× H, salt bridge) Gly143 (H) Thr26 (H) Asn142(2× H) Gln189 (H) |
| Molport-046-067-769 | −7.514 | Glu166 (2× H, salt bridge) Gly143 (H) Thr26 (H) Gln189 (H) His41 (H) |
| Pepstatin A | −7.155, | Glu166 (2× H, salt bridge) Gln189 (H) His164 (H) Ala191(H) |
| Docetaxel | −6.916 | Glu166 (4× H, salt bridge) Gln189 (H) |
| Molport-046-568-802 | −6.361 | Glu166 (H) Asn142 (H) Thr26 (H) Gln189 (H) |
| Ginsenoside | −5.319 | Gln189 (H) Glu166 (2× H) Gly170(H) |
| Josamycin | −3.995 | Glu166 (2× H, salt bridge) |
| Compound | Virus Titers Shown as Log10 TCID50/100 µL (Per Cent Virus Inactivation) | |||
|---|---|---|---|---|
| Stock Virus | Pre-Treatment | Co-Treatment | Post-Treatment | |
| Josamycin | 5.7 | 2.83 (99.87) | 3.1 (99.75) | 4.0 (98.00) |
| Pepstatin | 5.7 | 3.5 (99.37) | 3.6 (99.20) | 4.5 (93.69) |
| Docetaxel | 5.5 | 3.0 (99.68) | 3.5 (99.00) | 4.5 (90.00) |
| Molport-046-067-769 | 5.5 | 2.83 (99.78) | 2.60 (99.87) | 3.83 (97.86) |
| Molport-046-568-802 | 5.5 | 2.66 (99.85) | 3.16 (99.54) | 4.1 (96.01) |
| Ginsenocide Rh1 | 5.5 | 2.83 (99.78) | 2.05 (99.96) | 3.5 (99.00) |
Publisher’s Note: MDPI stays neutral with regard to jurisdictional claims in published maps and institutional affiliations. |
© 2022 by the authors. Licensee MDPI, Basel, Switzerland. This article is an open access article distributed under the terms and conditions of the Creative Commons Attribution (CC BY) license (https://creativecommons.org/licenses/by/4.0/).
Share and Cite
Galvez-Llompart, M.; Zanni, R.; Galvez, J.; Basak, S.C.; Goyal, S.M. COVID-19 and the Importance of Being Prepared: A Multidisciplinary Strategy for the Discovery of Antivirals to Combat Pandemics. Biomedicines 2022, 10, 1342. https://doi.org/10.3390/biomedicines10061342
Galvez-Llompart M, Zanni R, Galvez J, Basak SC, Goyal SM. COVID-19 and the Importance of Being Prepared: A Multidisciplinary Strategy for the Discovery of Antivirals to Combat Pandemics. Biomedicines. 2022; 10(6):1342. https://doi.org/10.3390/biomedicines10061342
Chicago/Turabian StyleGalvez-Llompart, Maria, Riccardo Zanni, Jorge Galvez, Subhash C. Basak, and Sagar M. Goyal. 2022. "COVID-19 and the Importance of Being Prepared: A Multidisciplinary Strategy for the Discovery of Antivirals to Combat Pandemics" Biomedicines 10, no. 6: 1342. https://doi.org/10.3390/biomedicines10061342