
Amyloid Beta Oligomers-Induced Ca2+ Entry Pathways: Role of Neuronal Networks, NMDA Receptors and Amyloid Channel Formation

 , , and
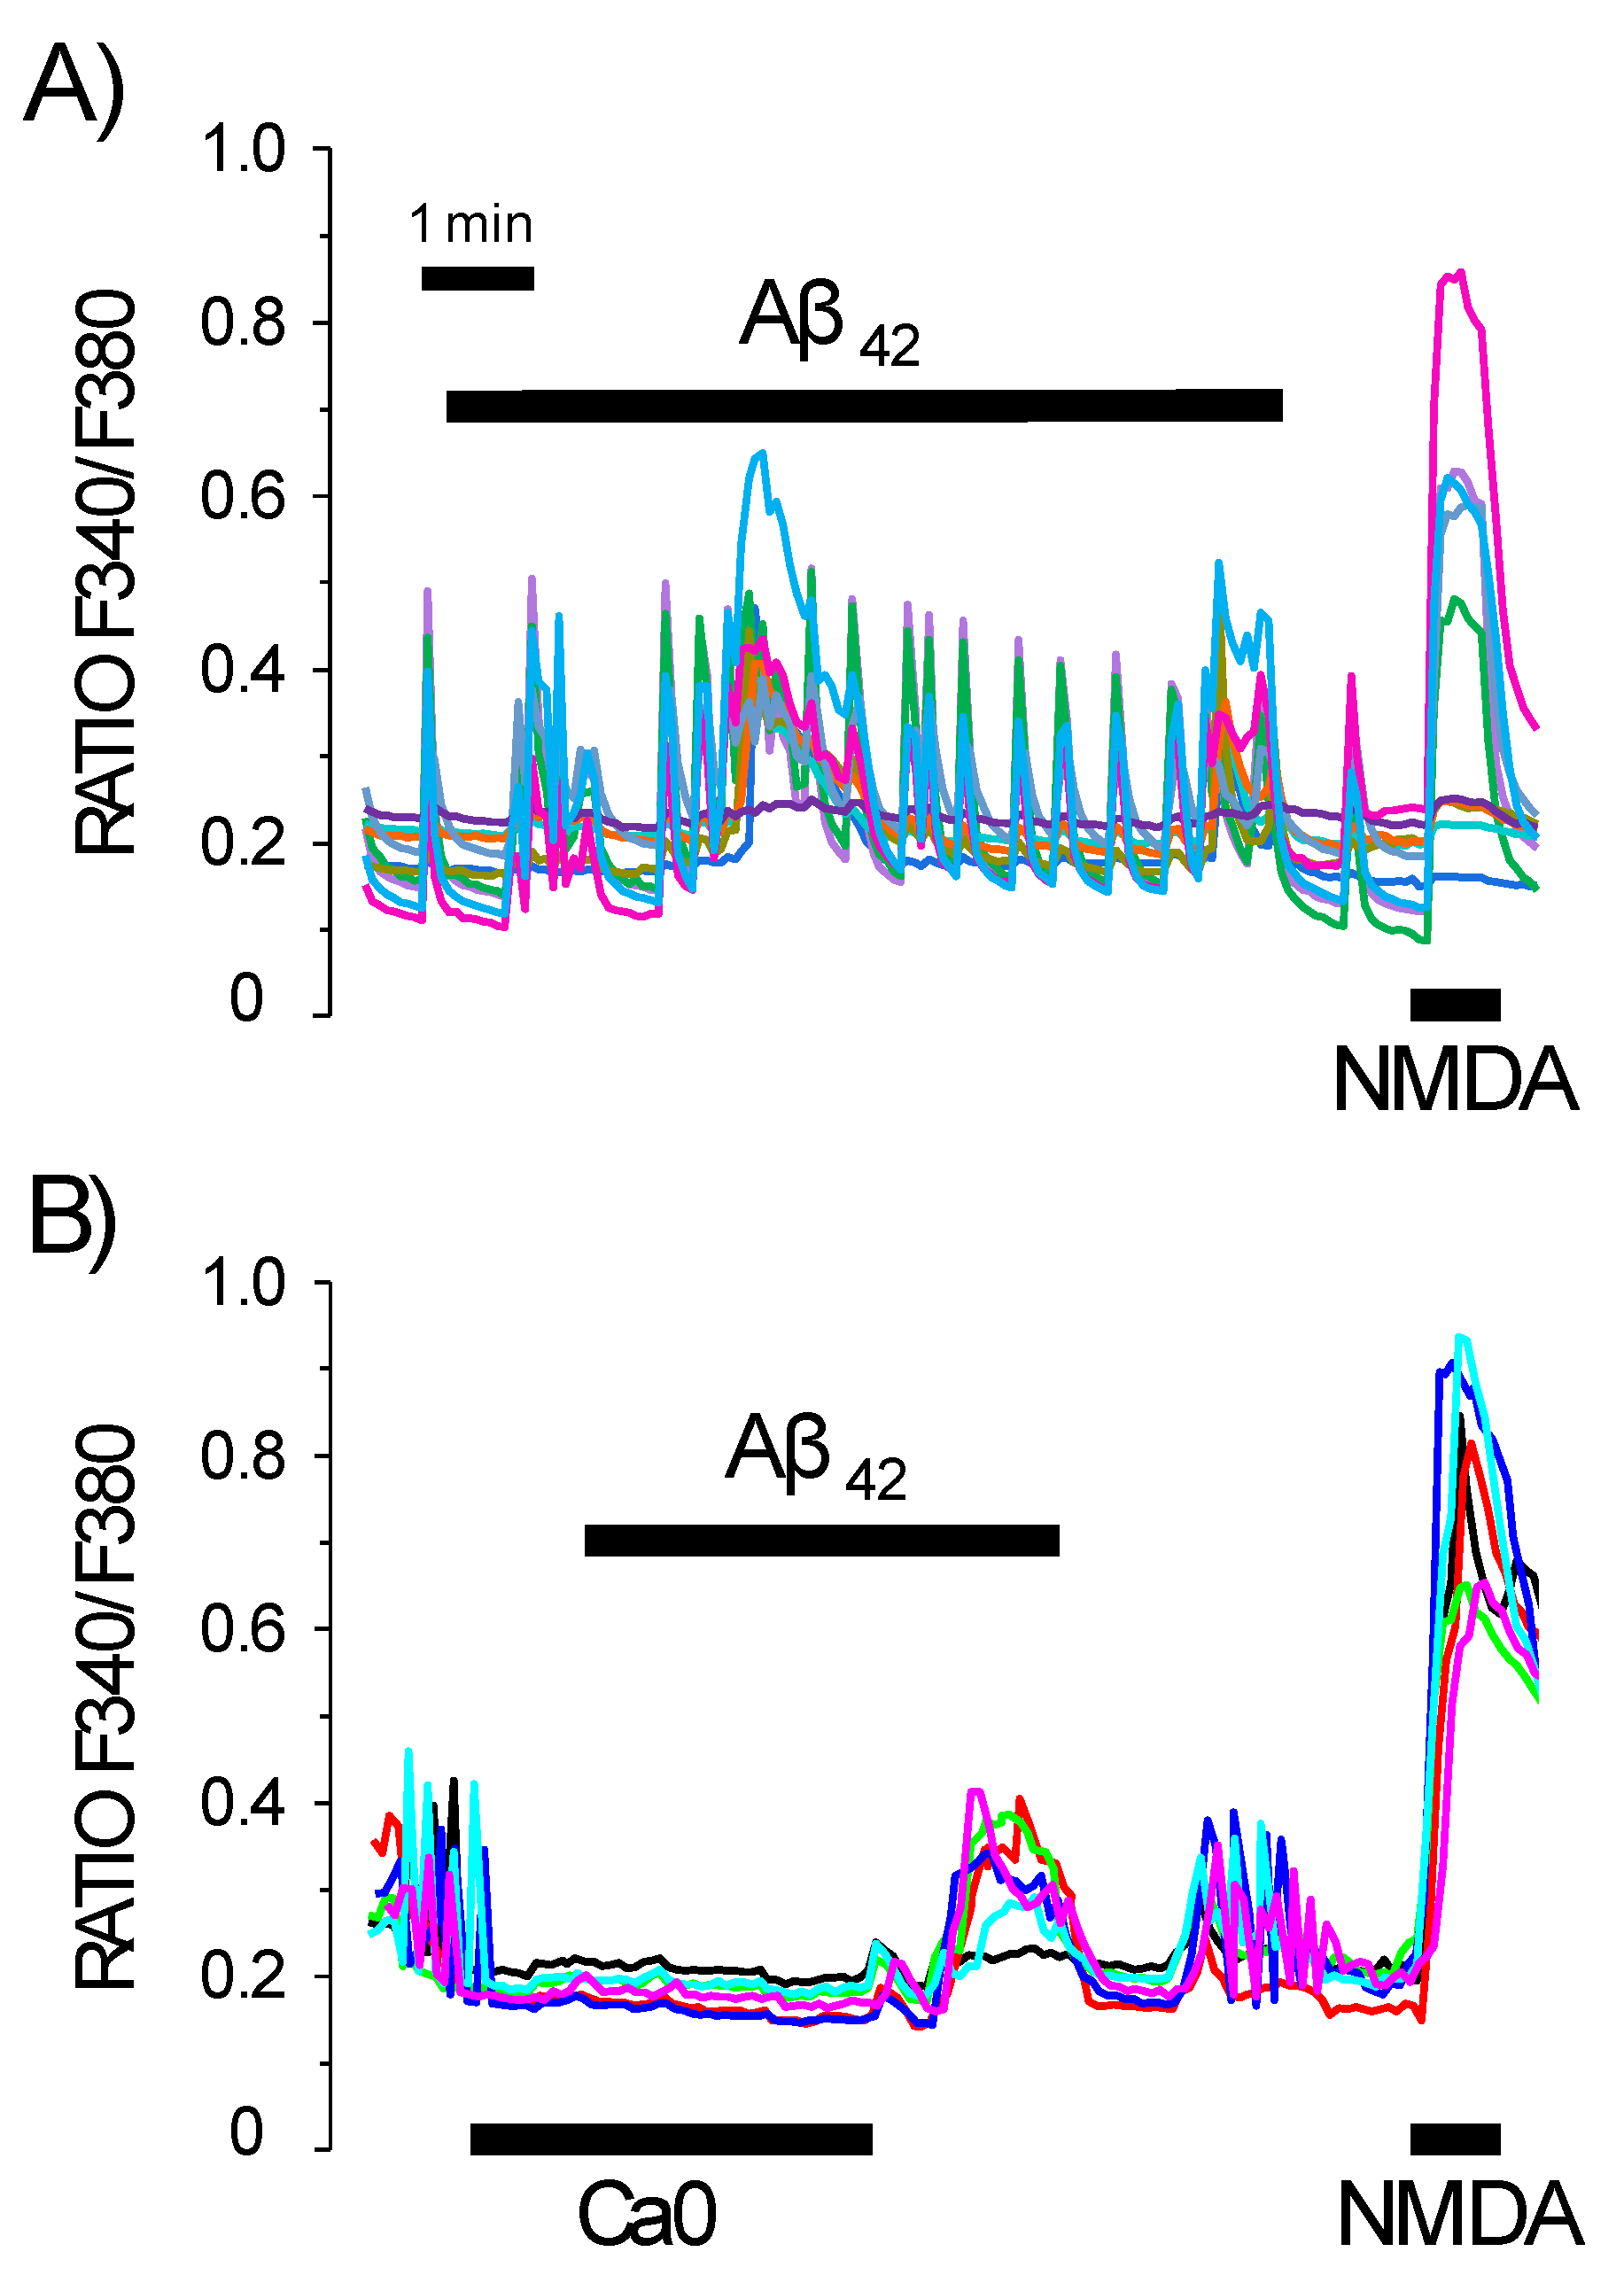
Abstract
:1. Introduction
2. Materials and Methods
2.1. Animals and Reagents
2.2. Cell Lines
2.3. Mouse Anterior Pituitary Cells
2.4. Primary Rat Cerebellar or Hippocampal Neuron Cultures
2.5. Preparation of Amyloid β Peptide1–42 Oligomers
2.6. Fluorescence Imaging of Cytosolic Ca2+ Concentration
2.7. Statistics
3. Results
3.1. Ca2+ Entry Pathways Activated by Amyloid β Oligomers in Rat Neurons
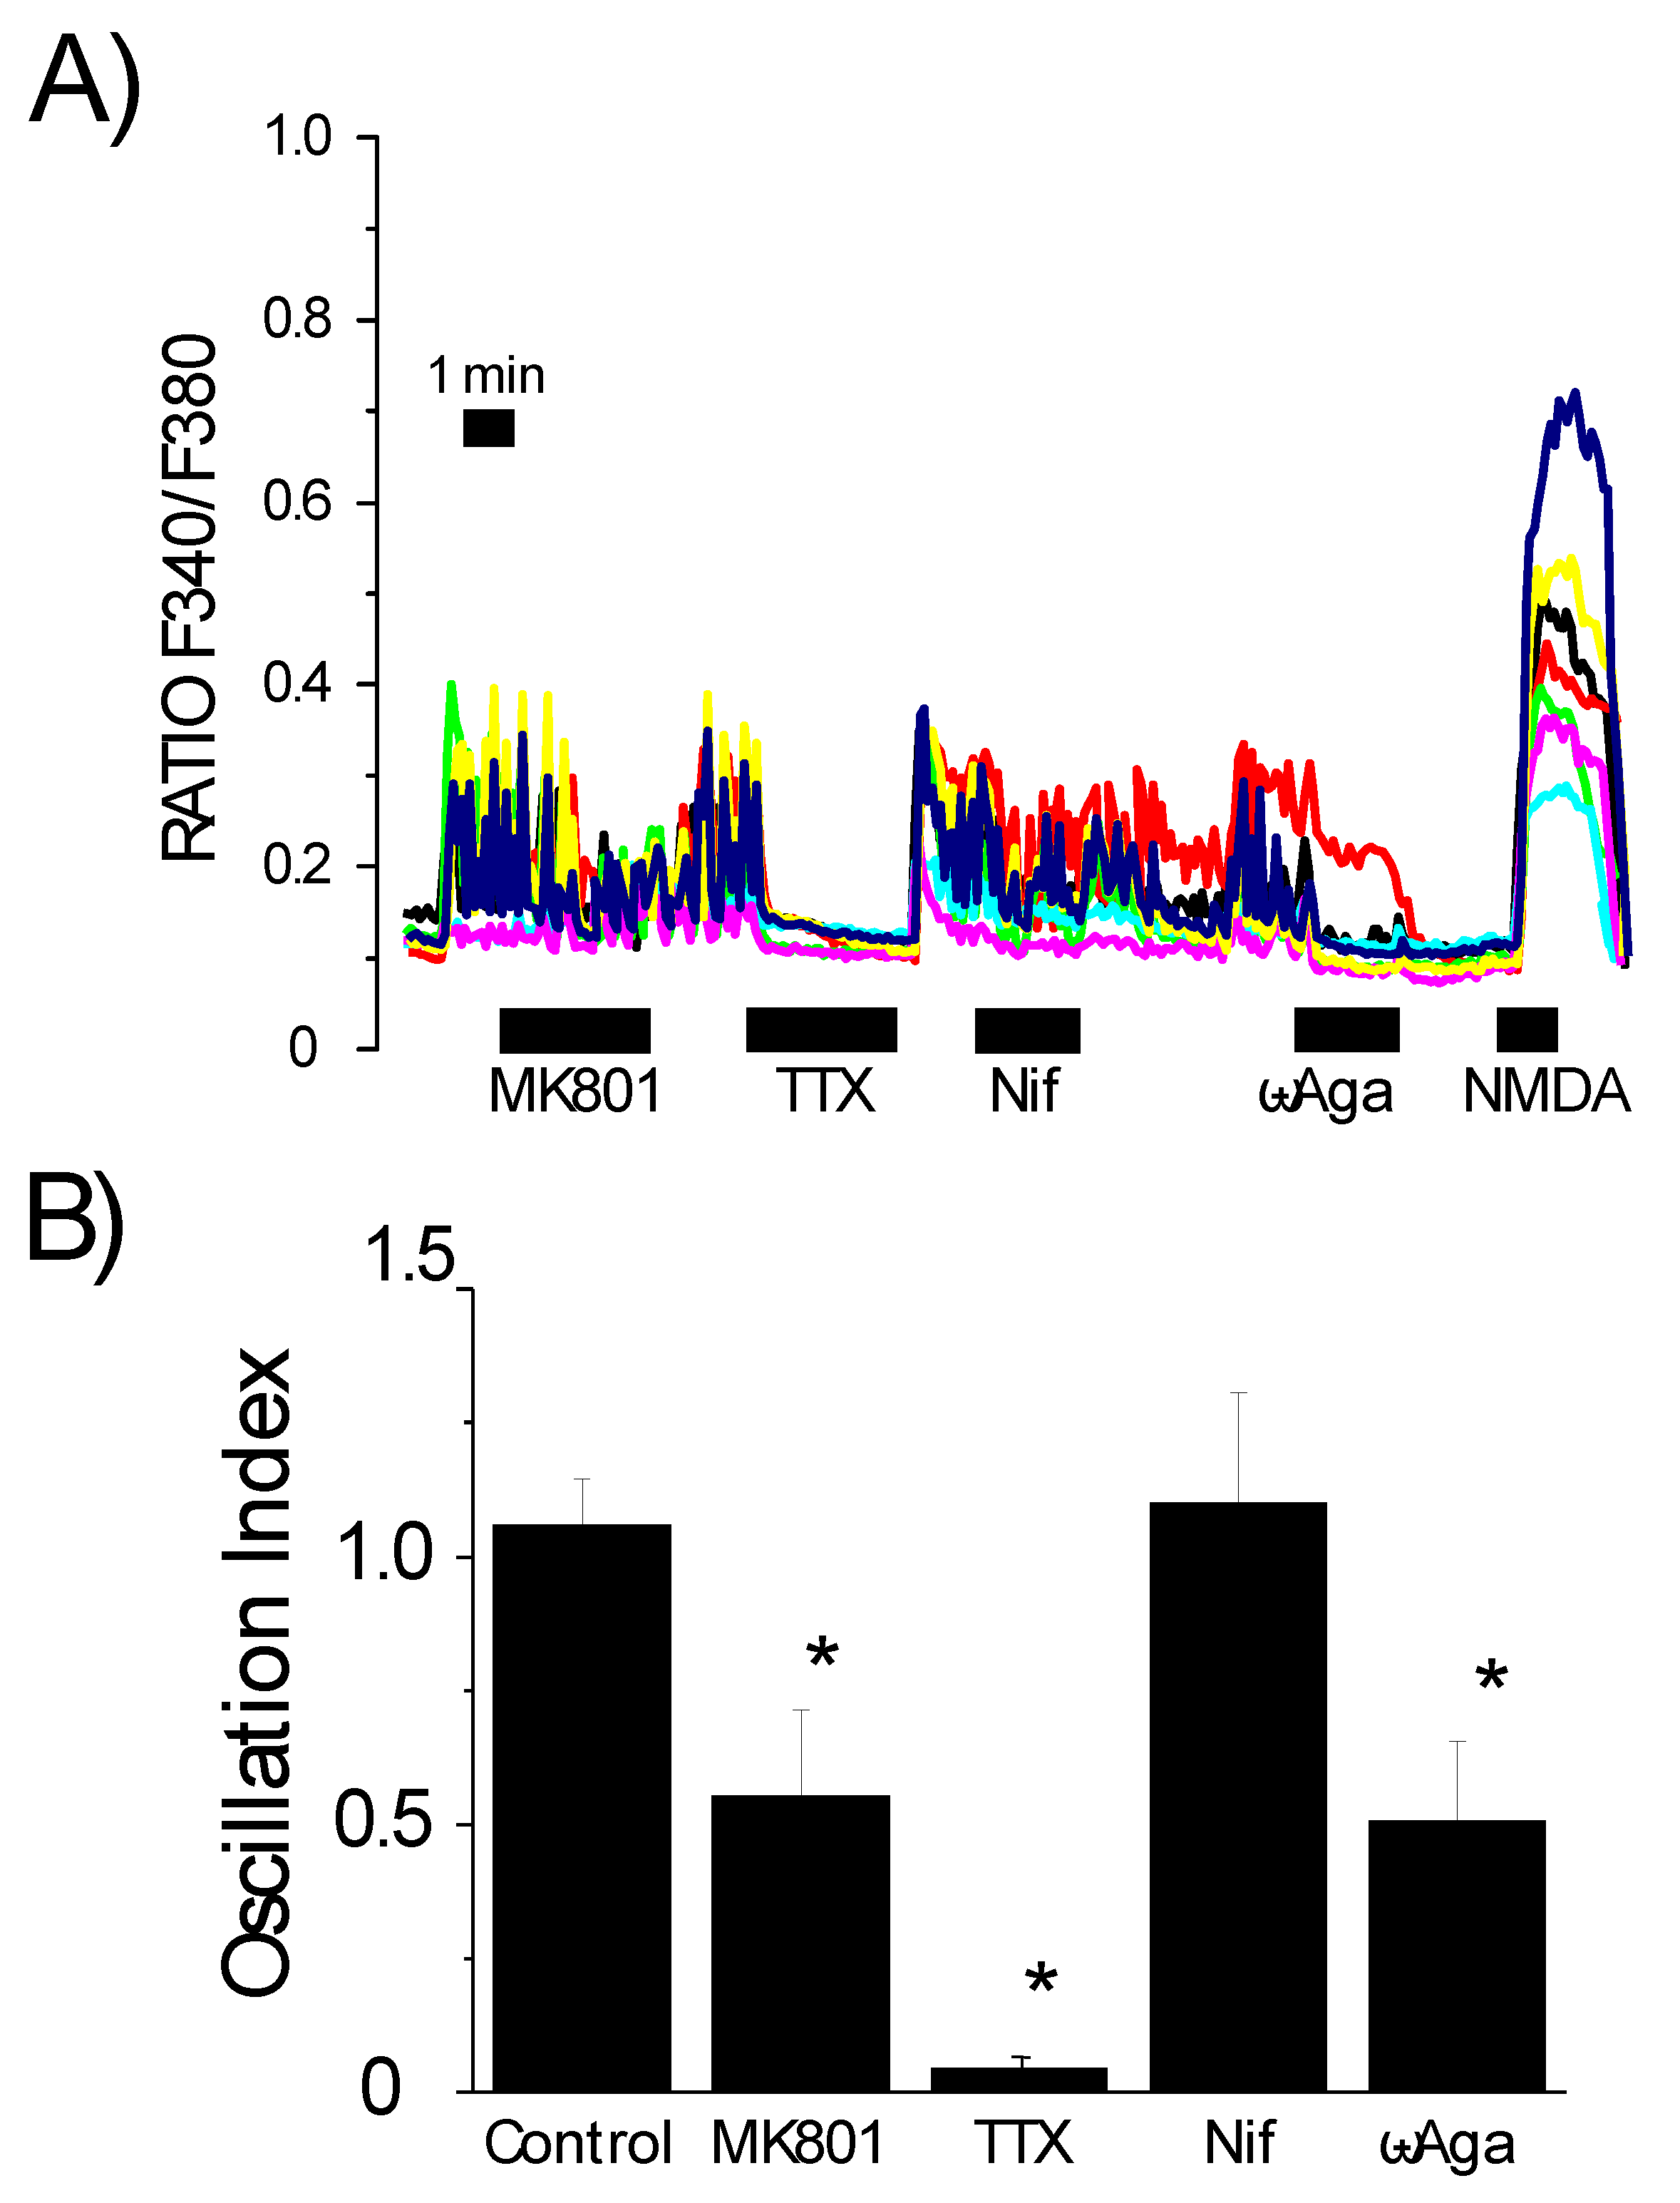
3.2. Cultured Neurons Develop Neural Networks as Shown by Synchronous Oscillations of Cytosolic Ca2+ Concentration That Are Susceptible to Activation by Aβ1–42 Oligomers
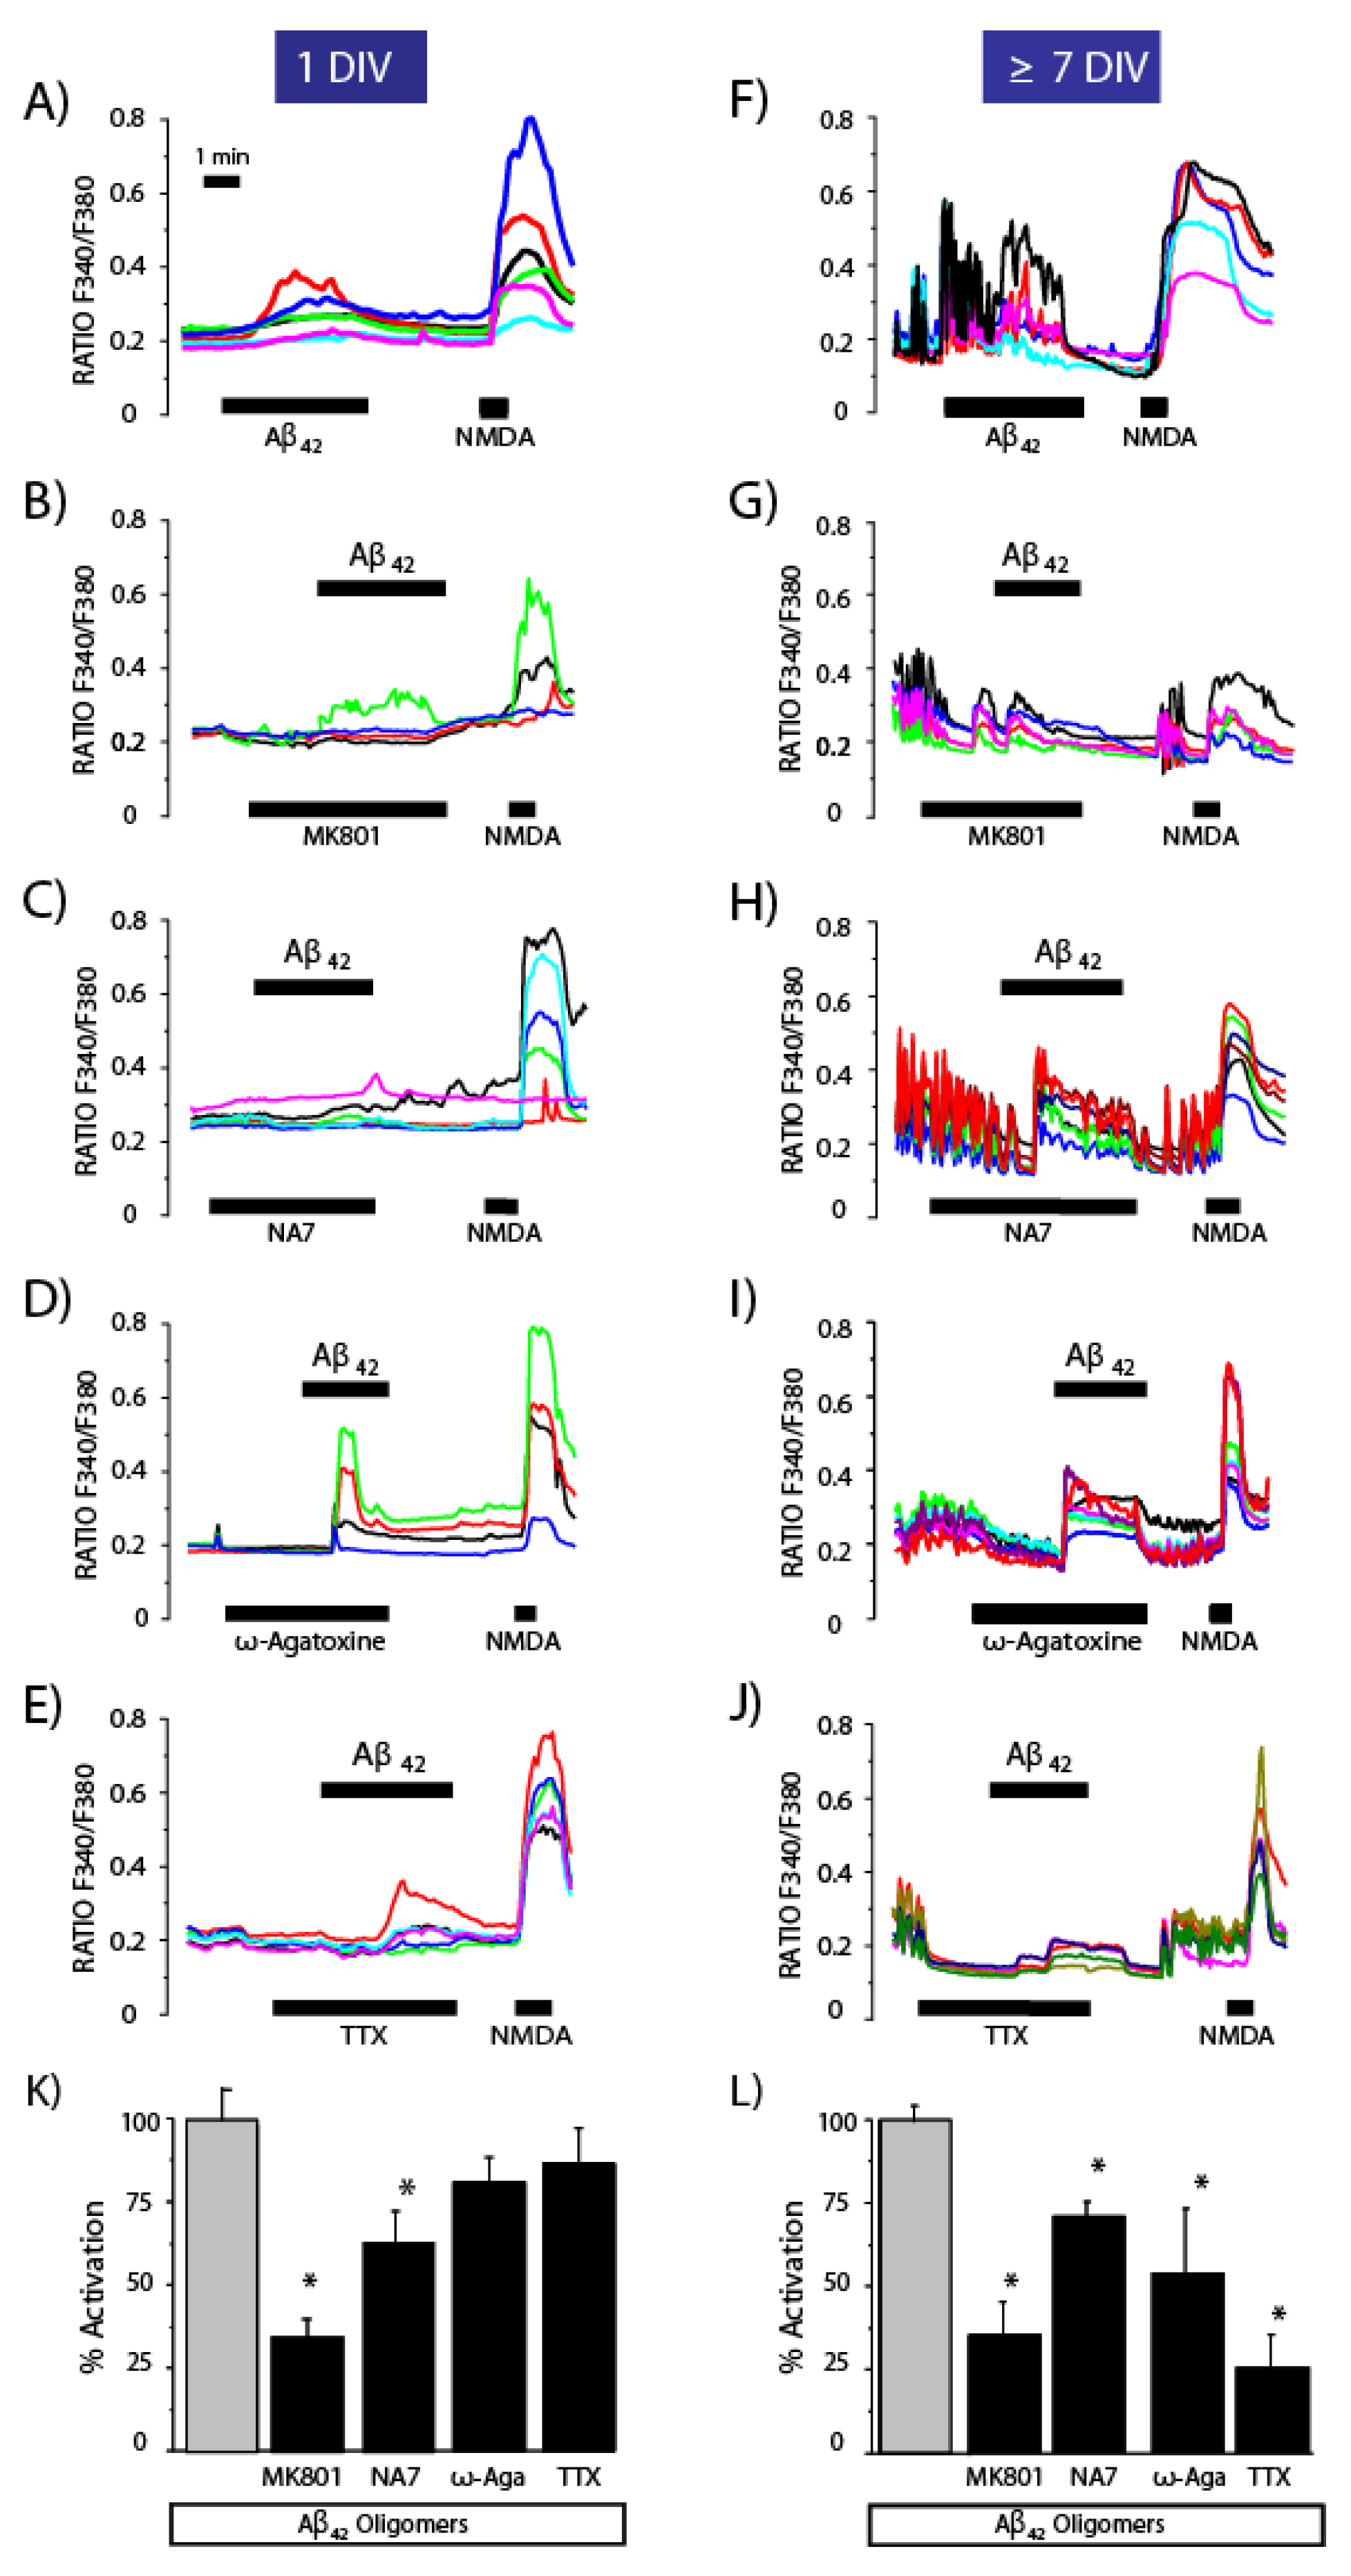
3.3. Contribution of the Neuronal Networking Activity to Ca2+ Responses Induced by Aβ1–42 Oligomers
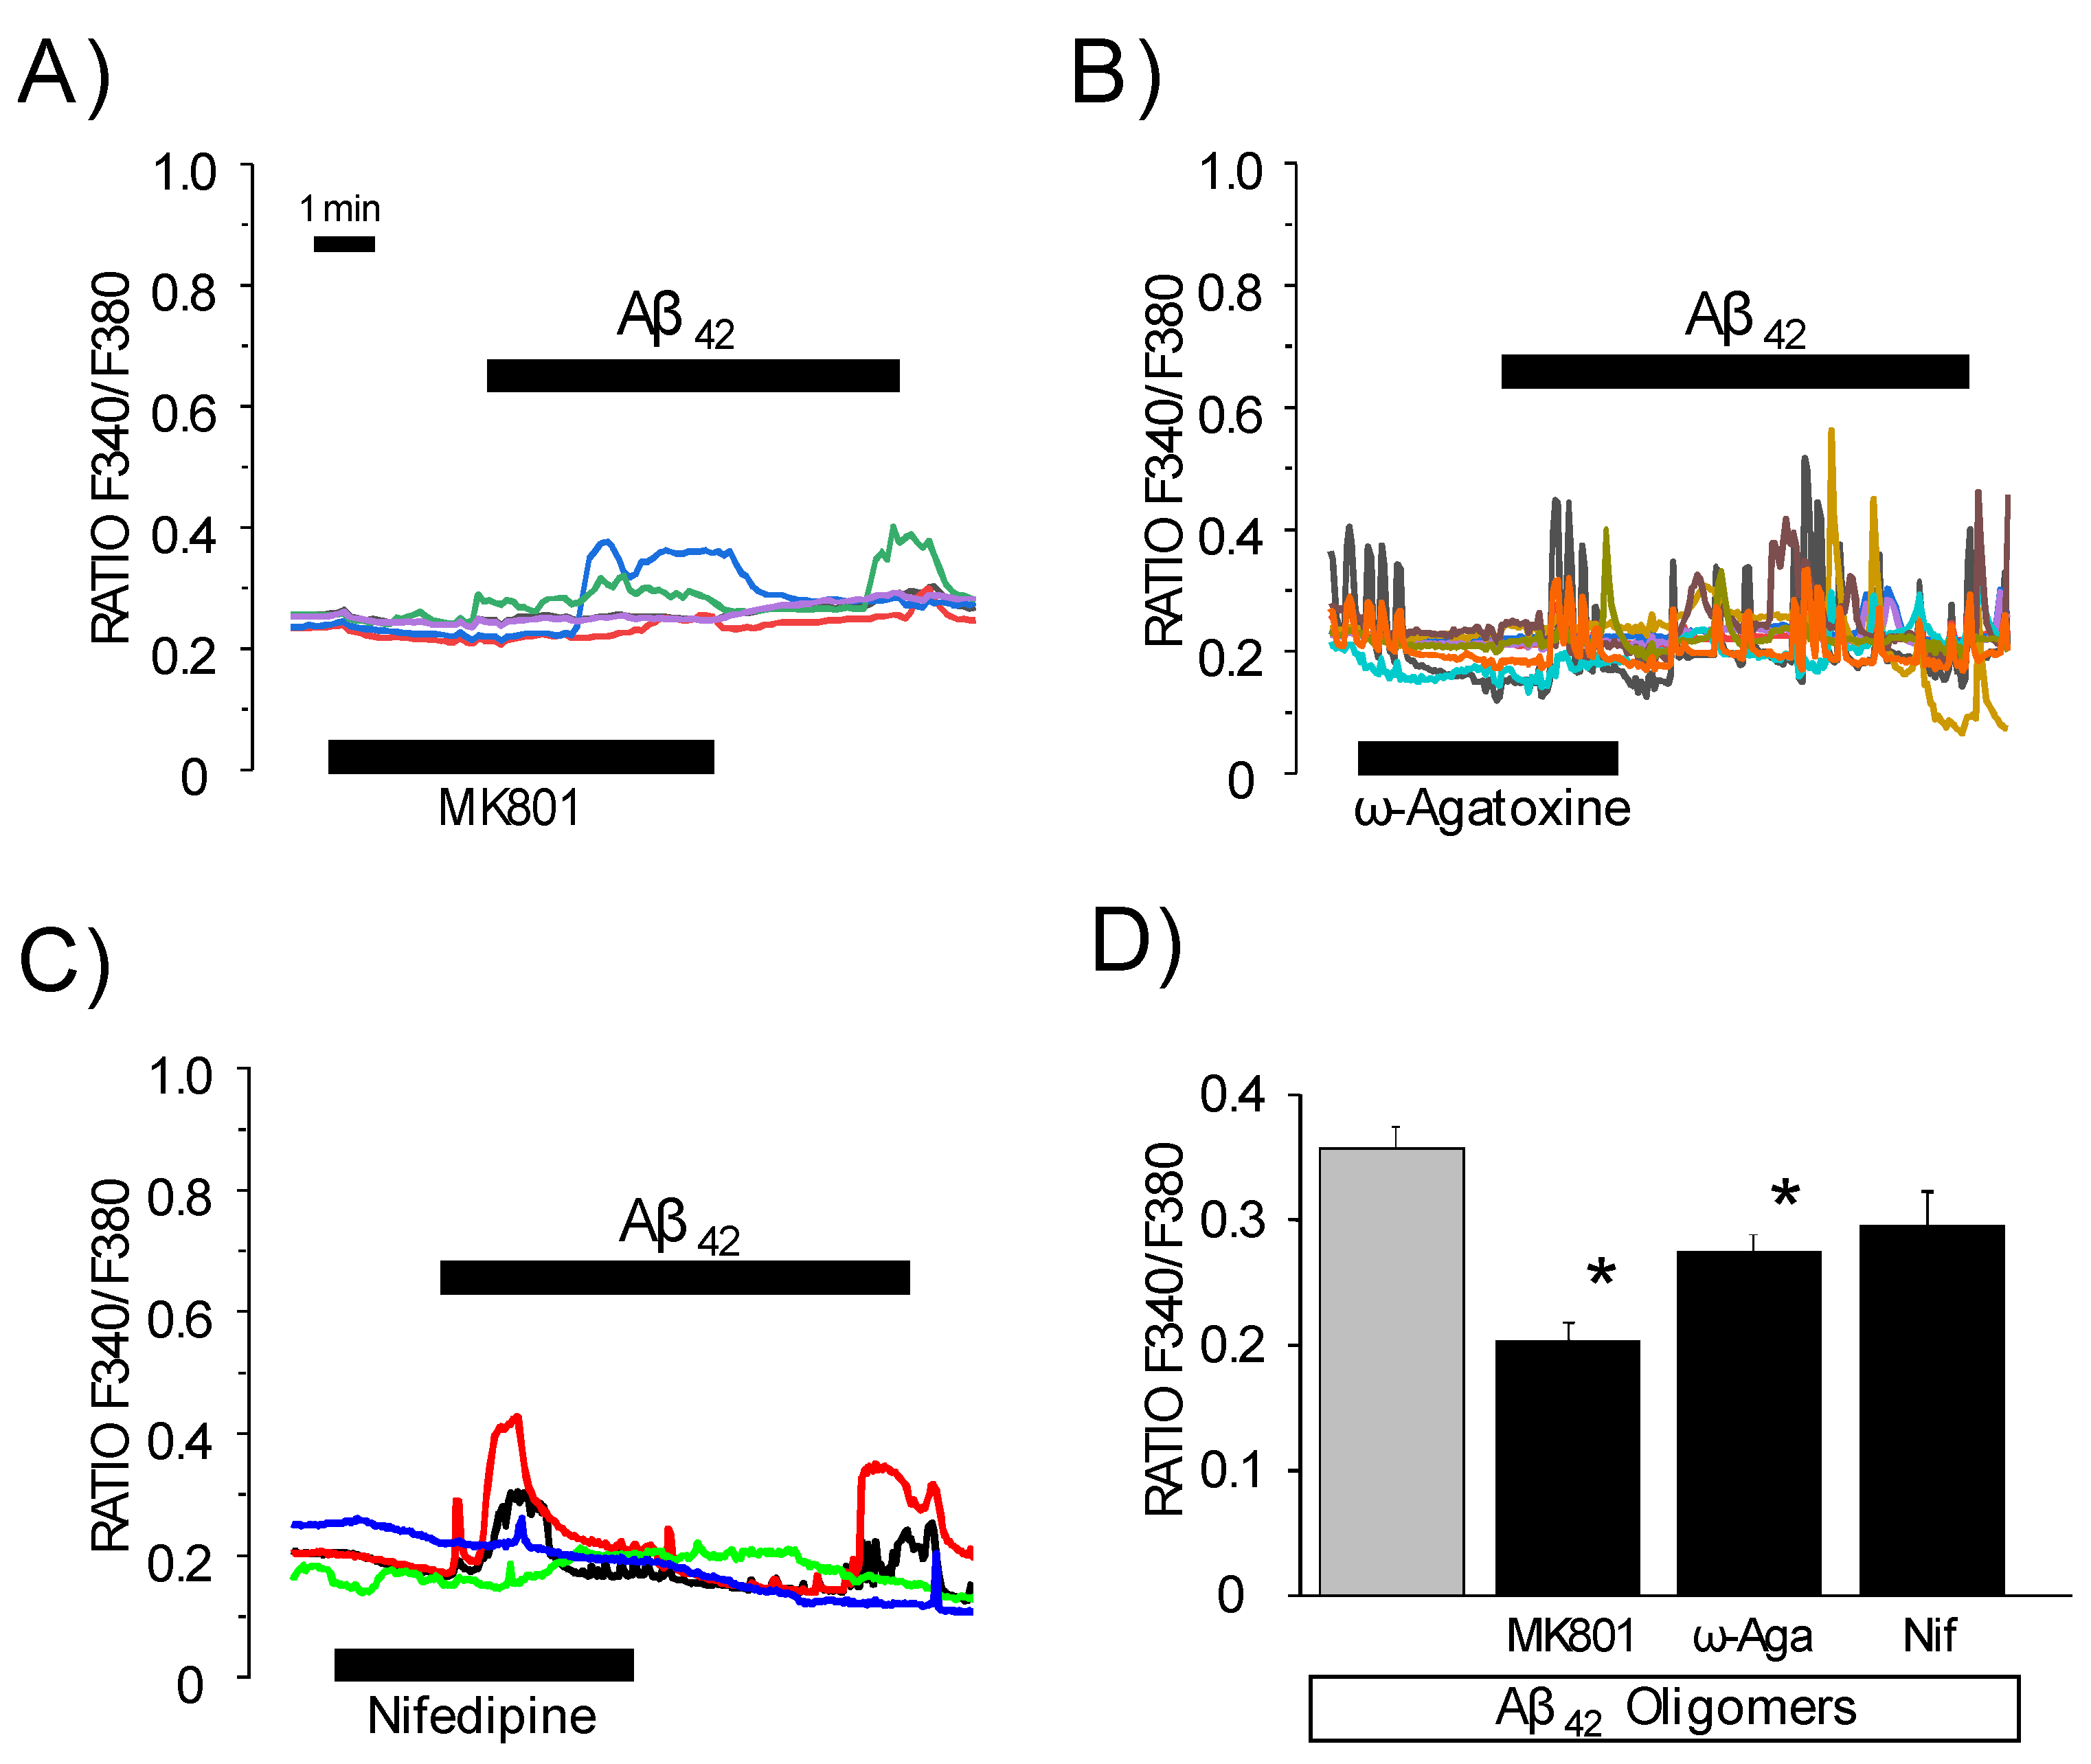
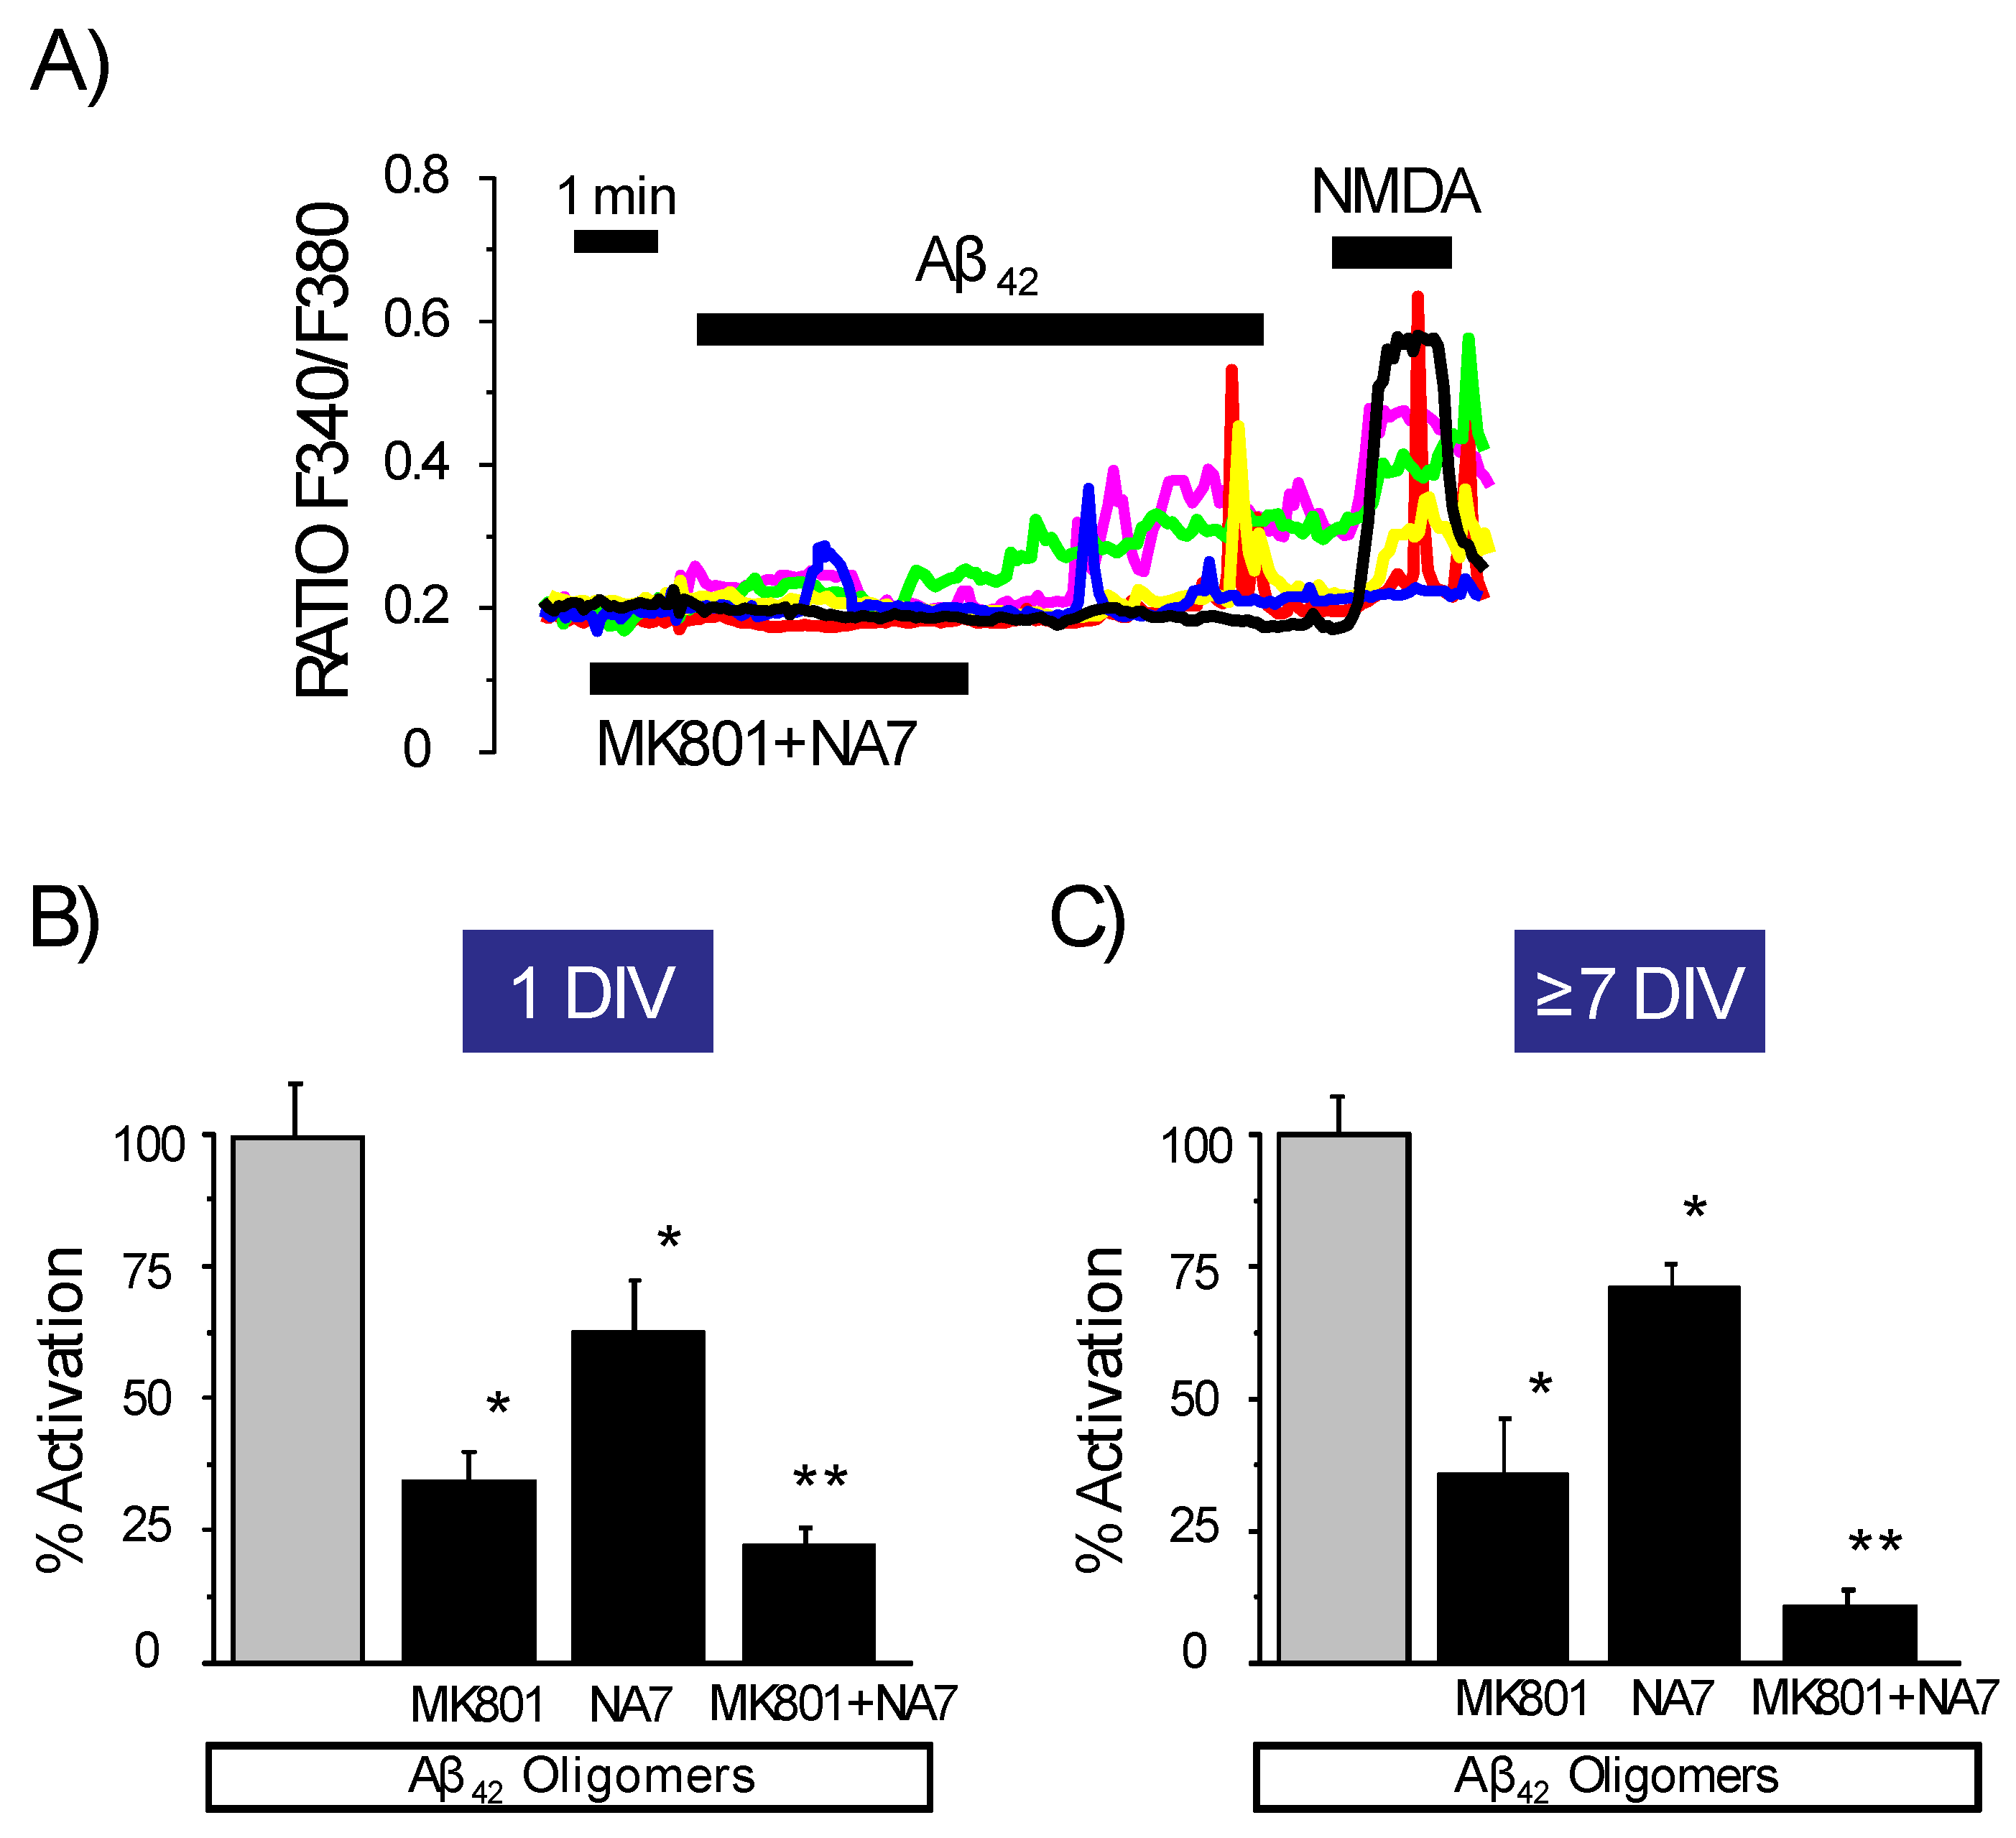
3.4. Effects of Channel Antagonists on Ca2+ Responses Induced by Aβ1–42 Oligomers with or without Networking Activity
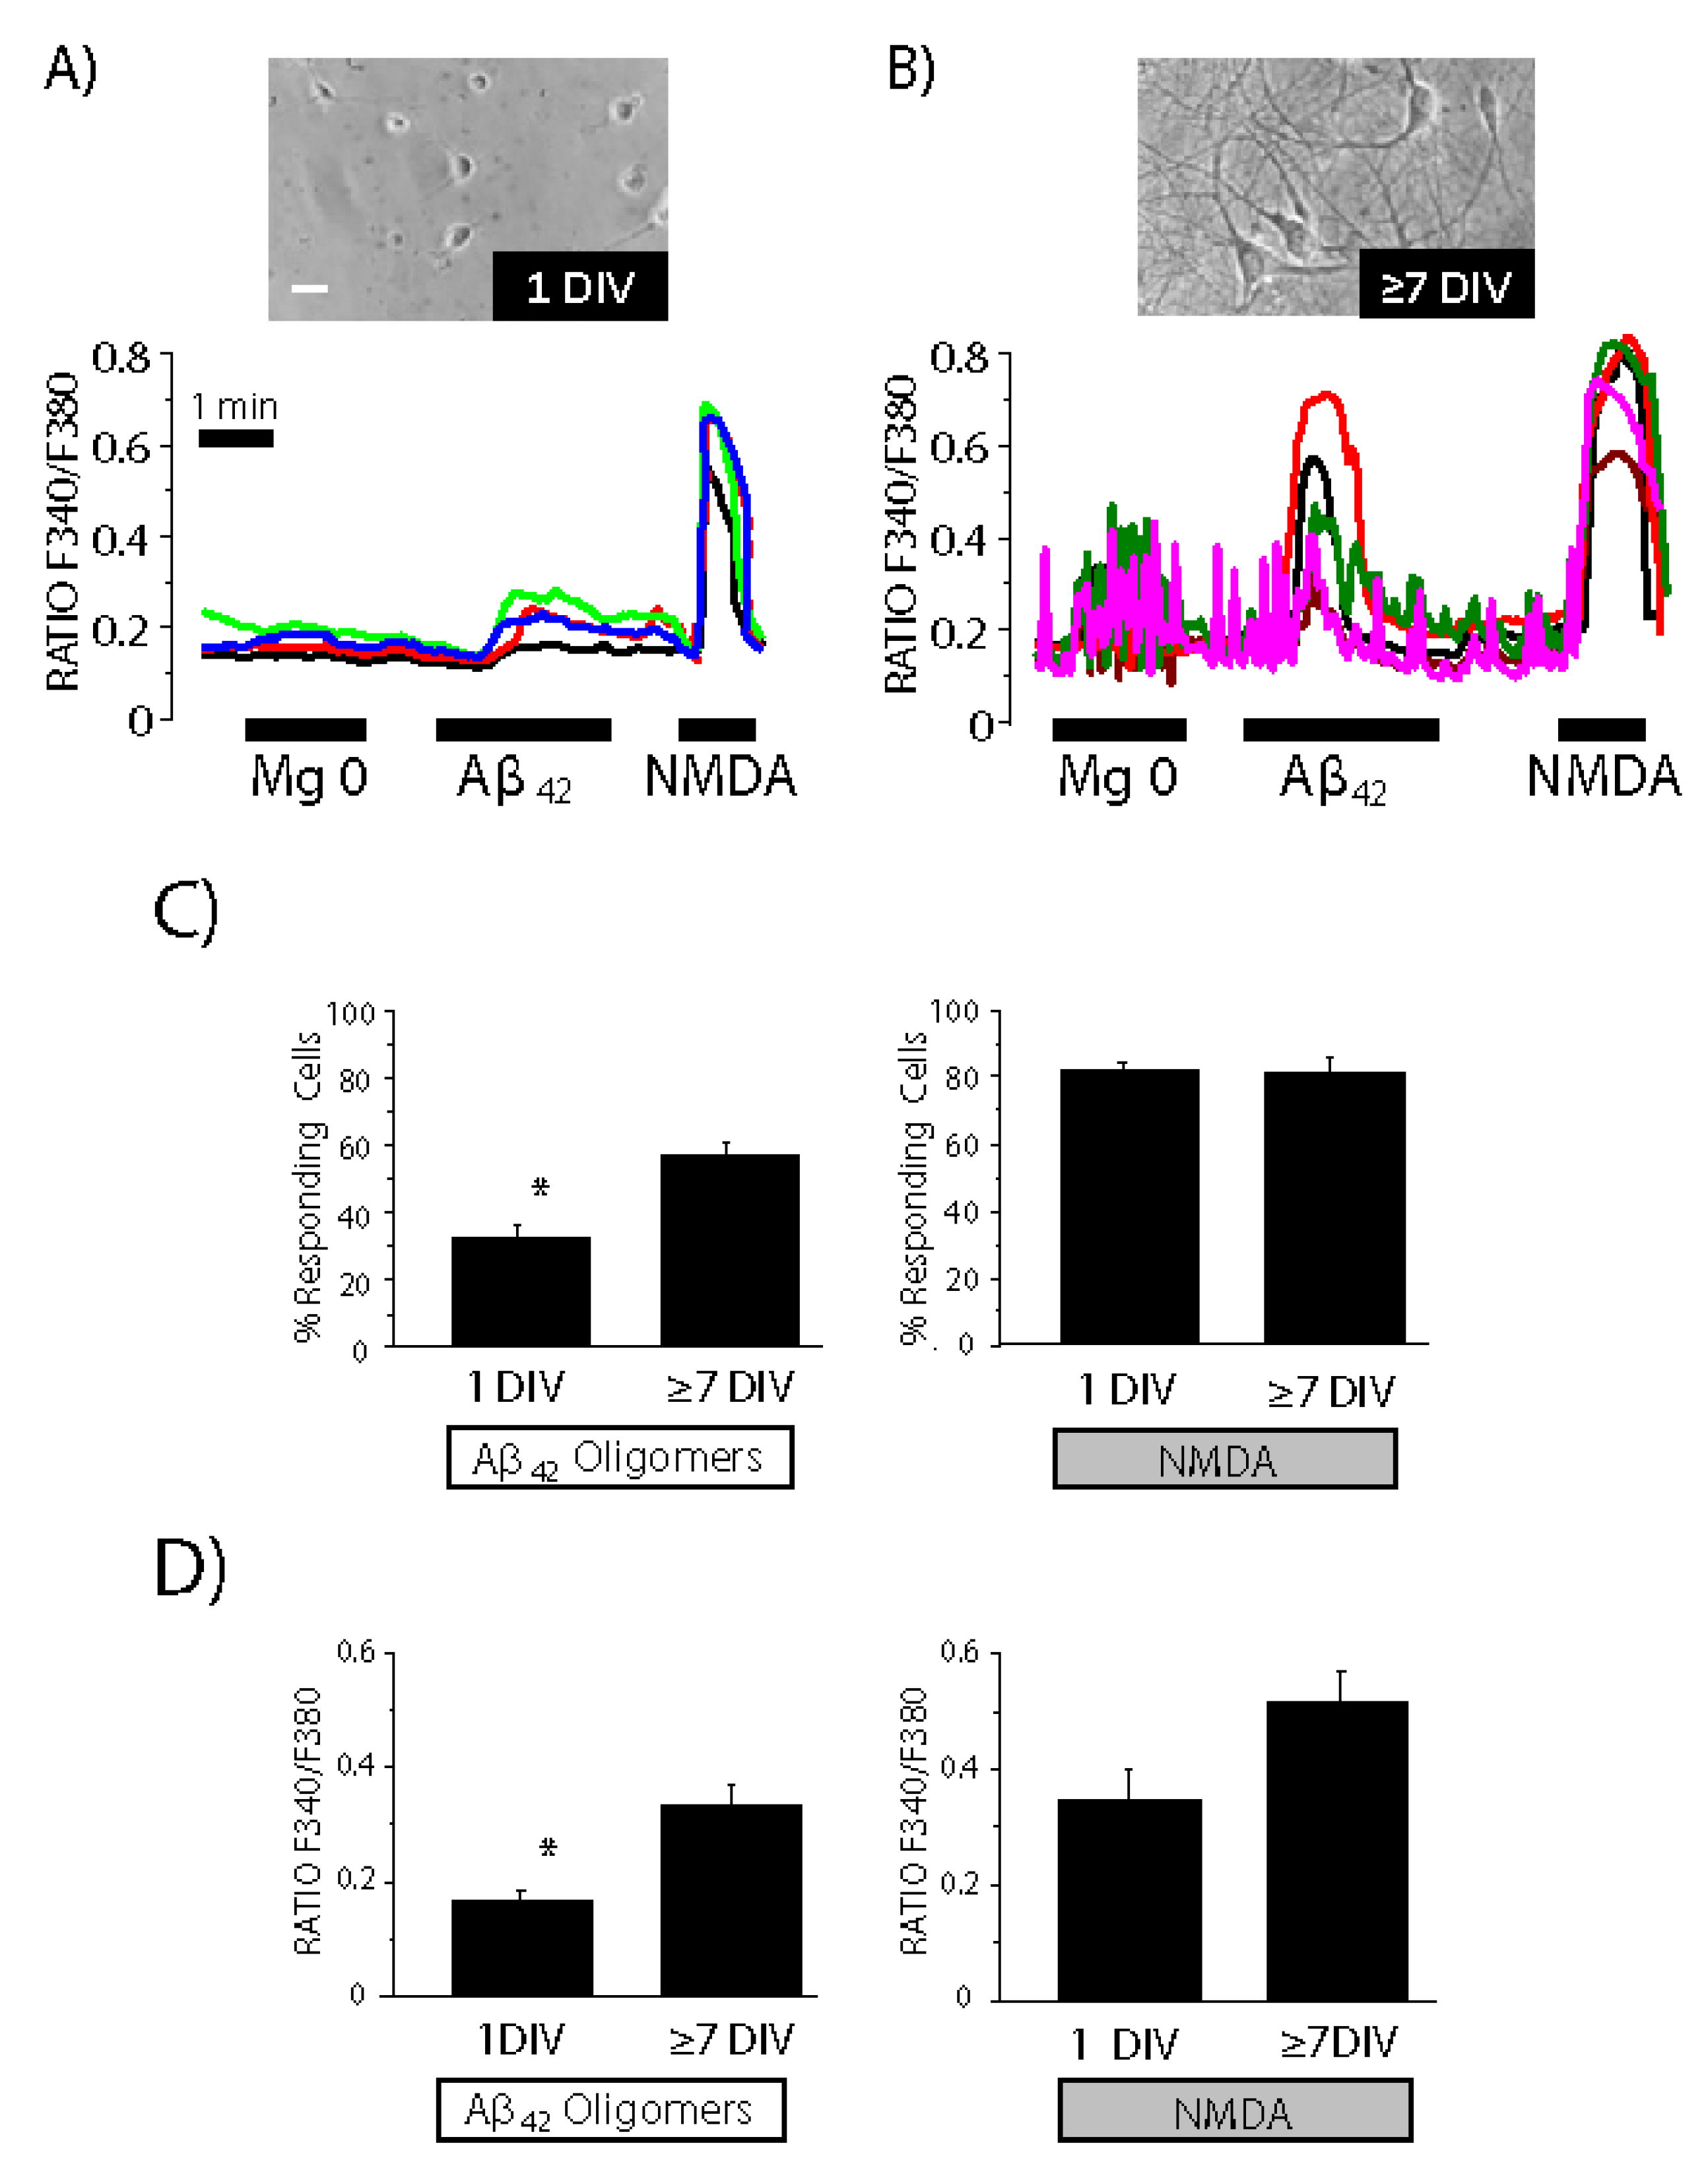
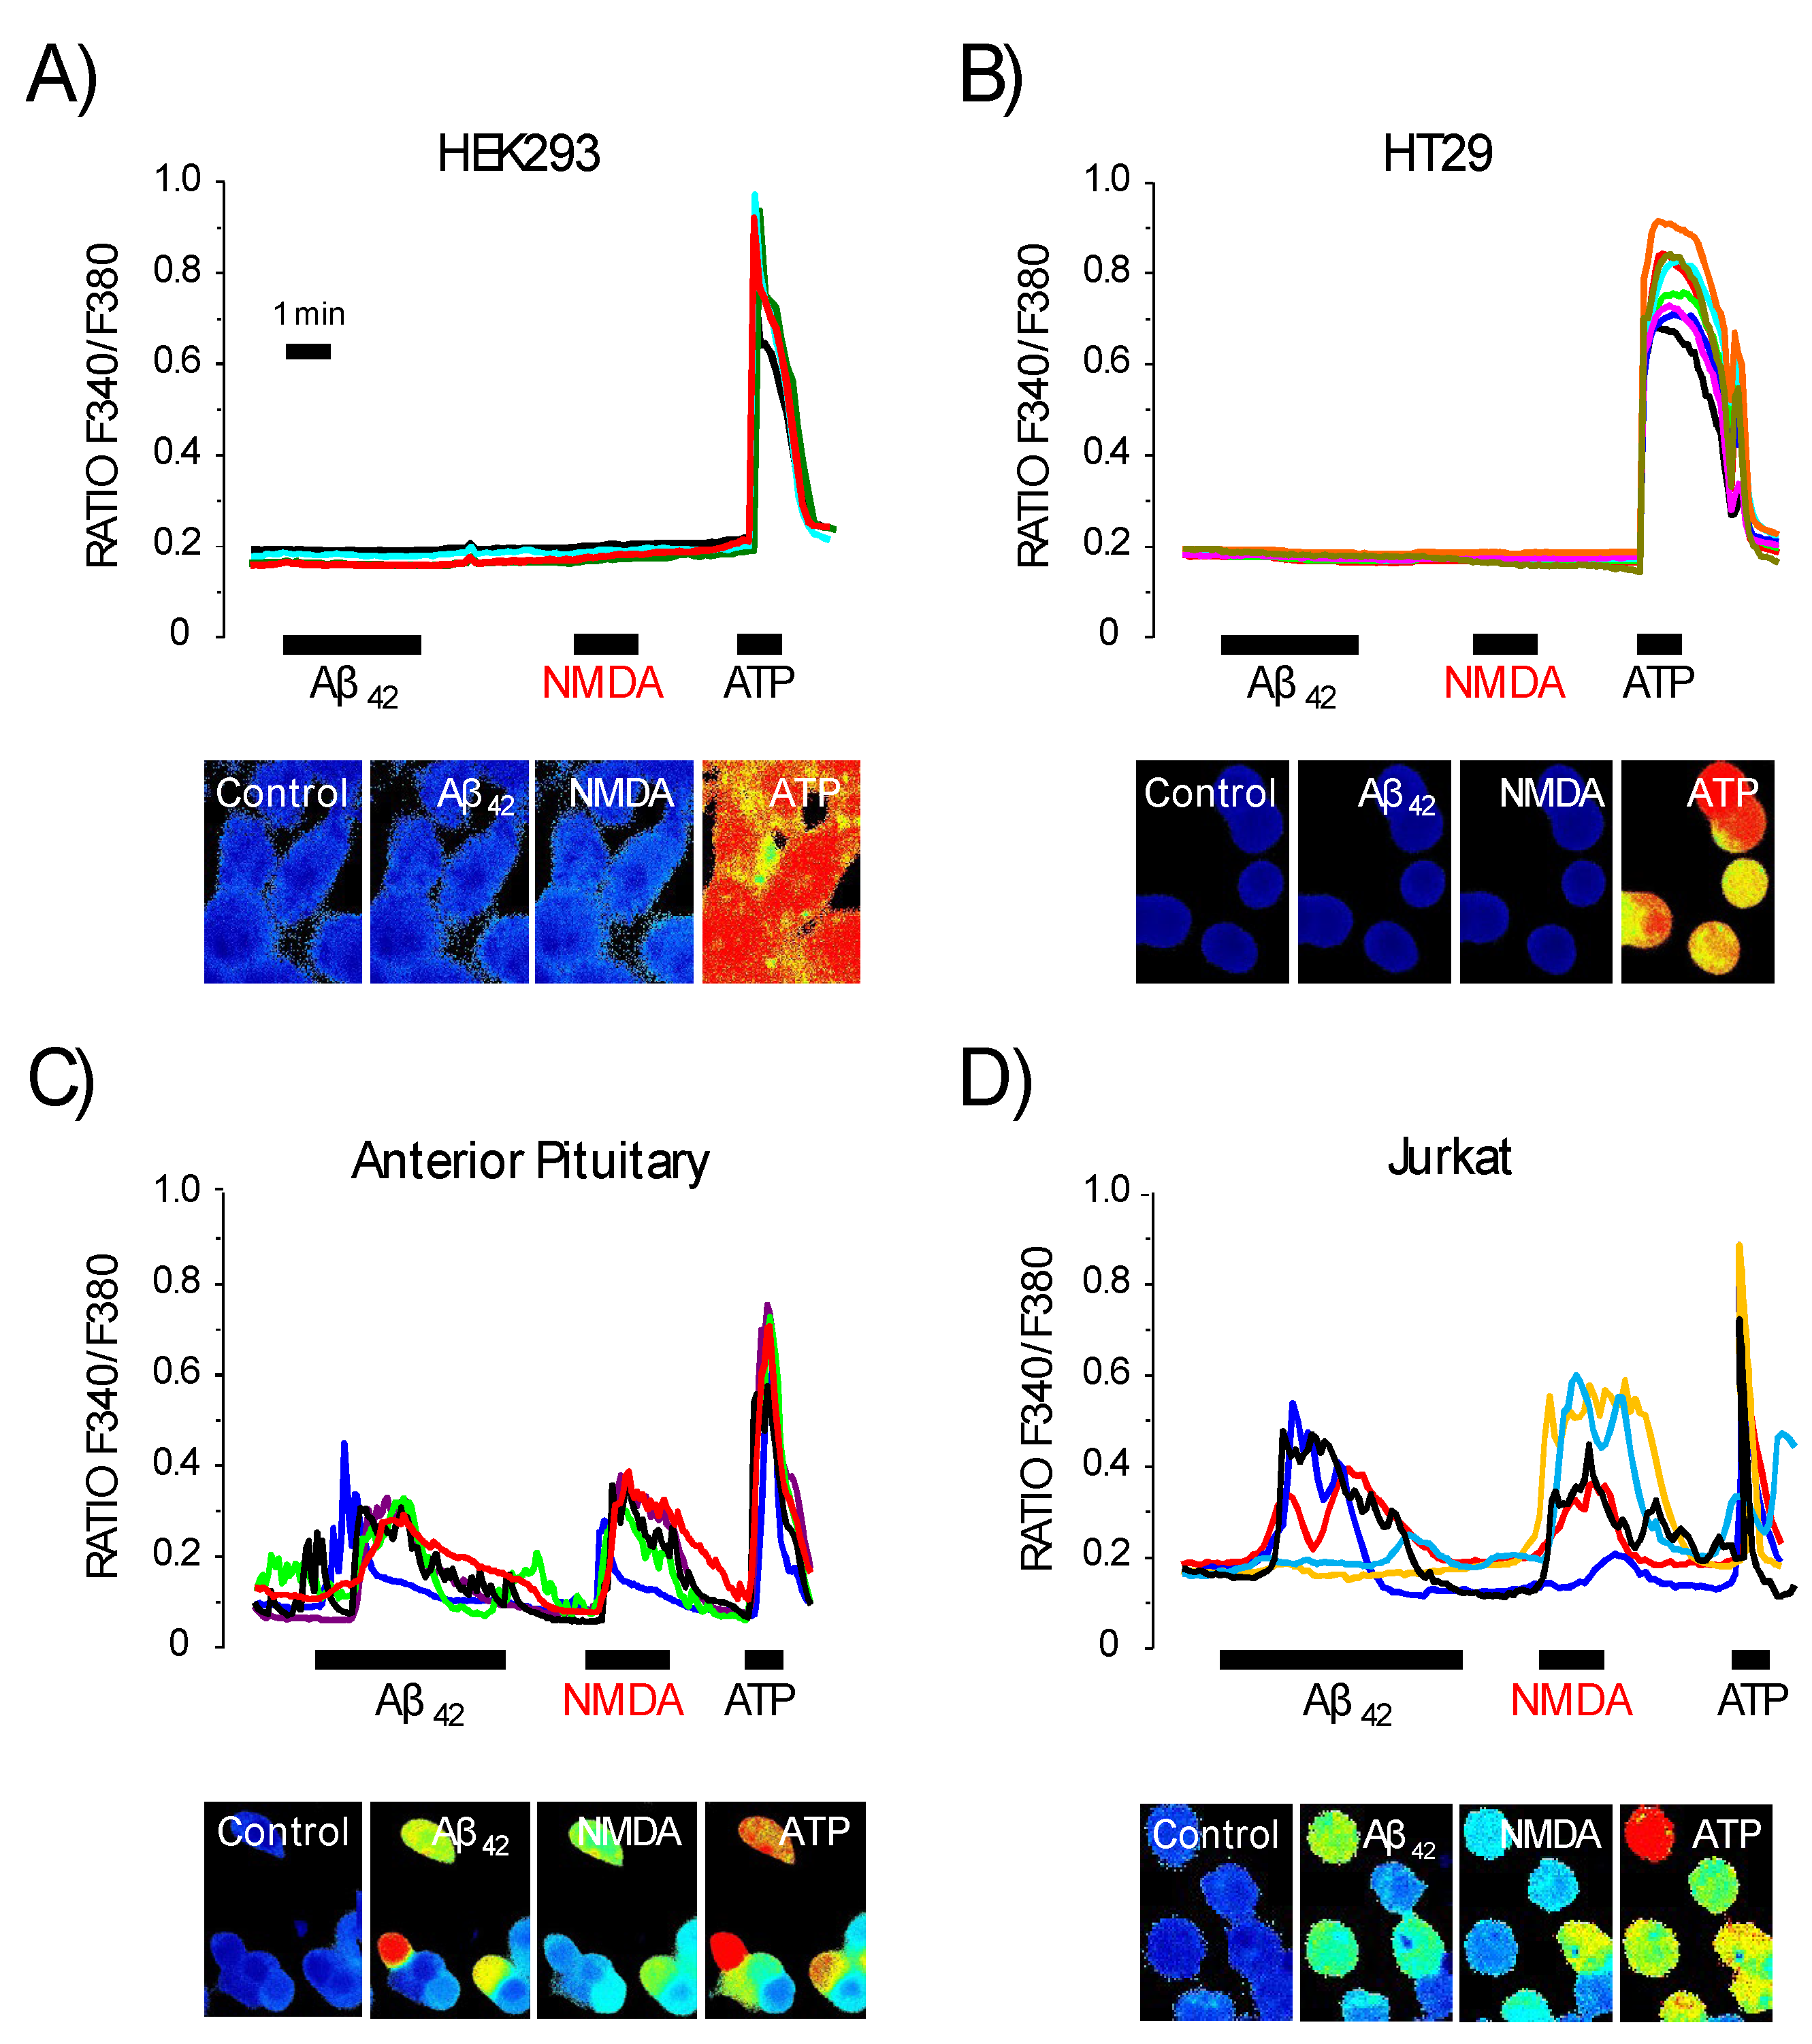
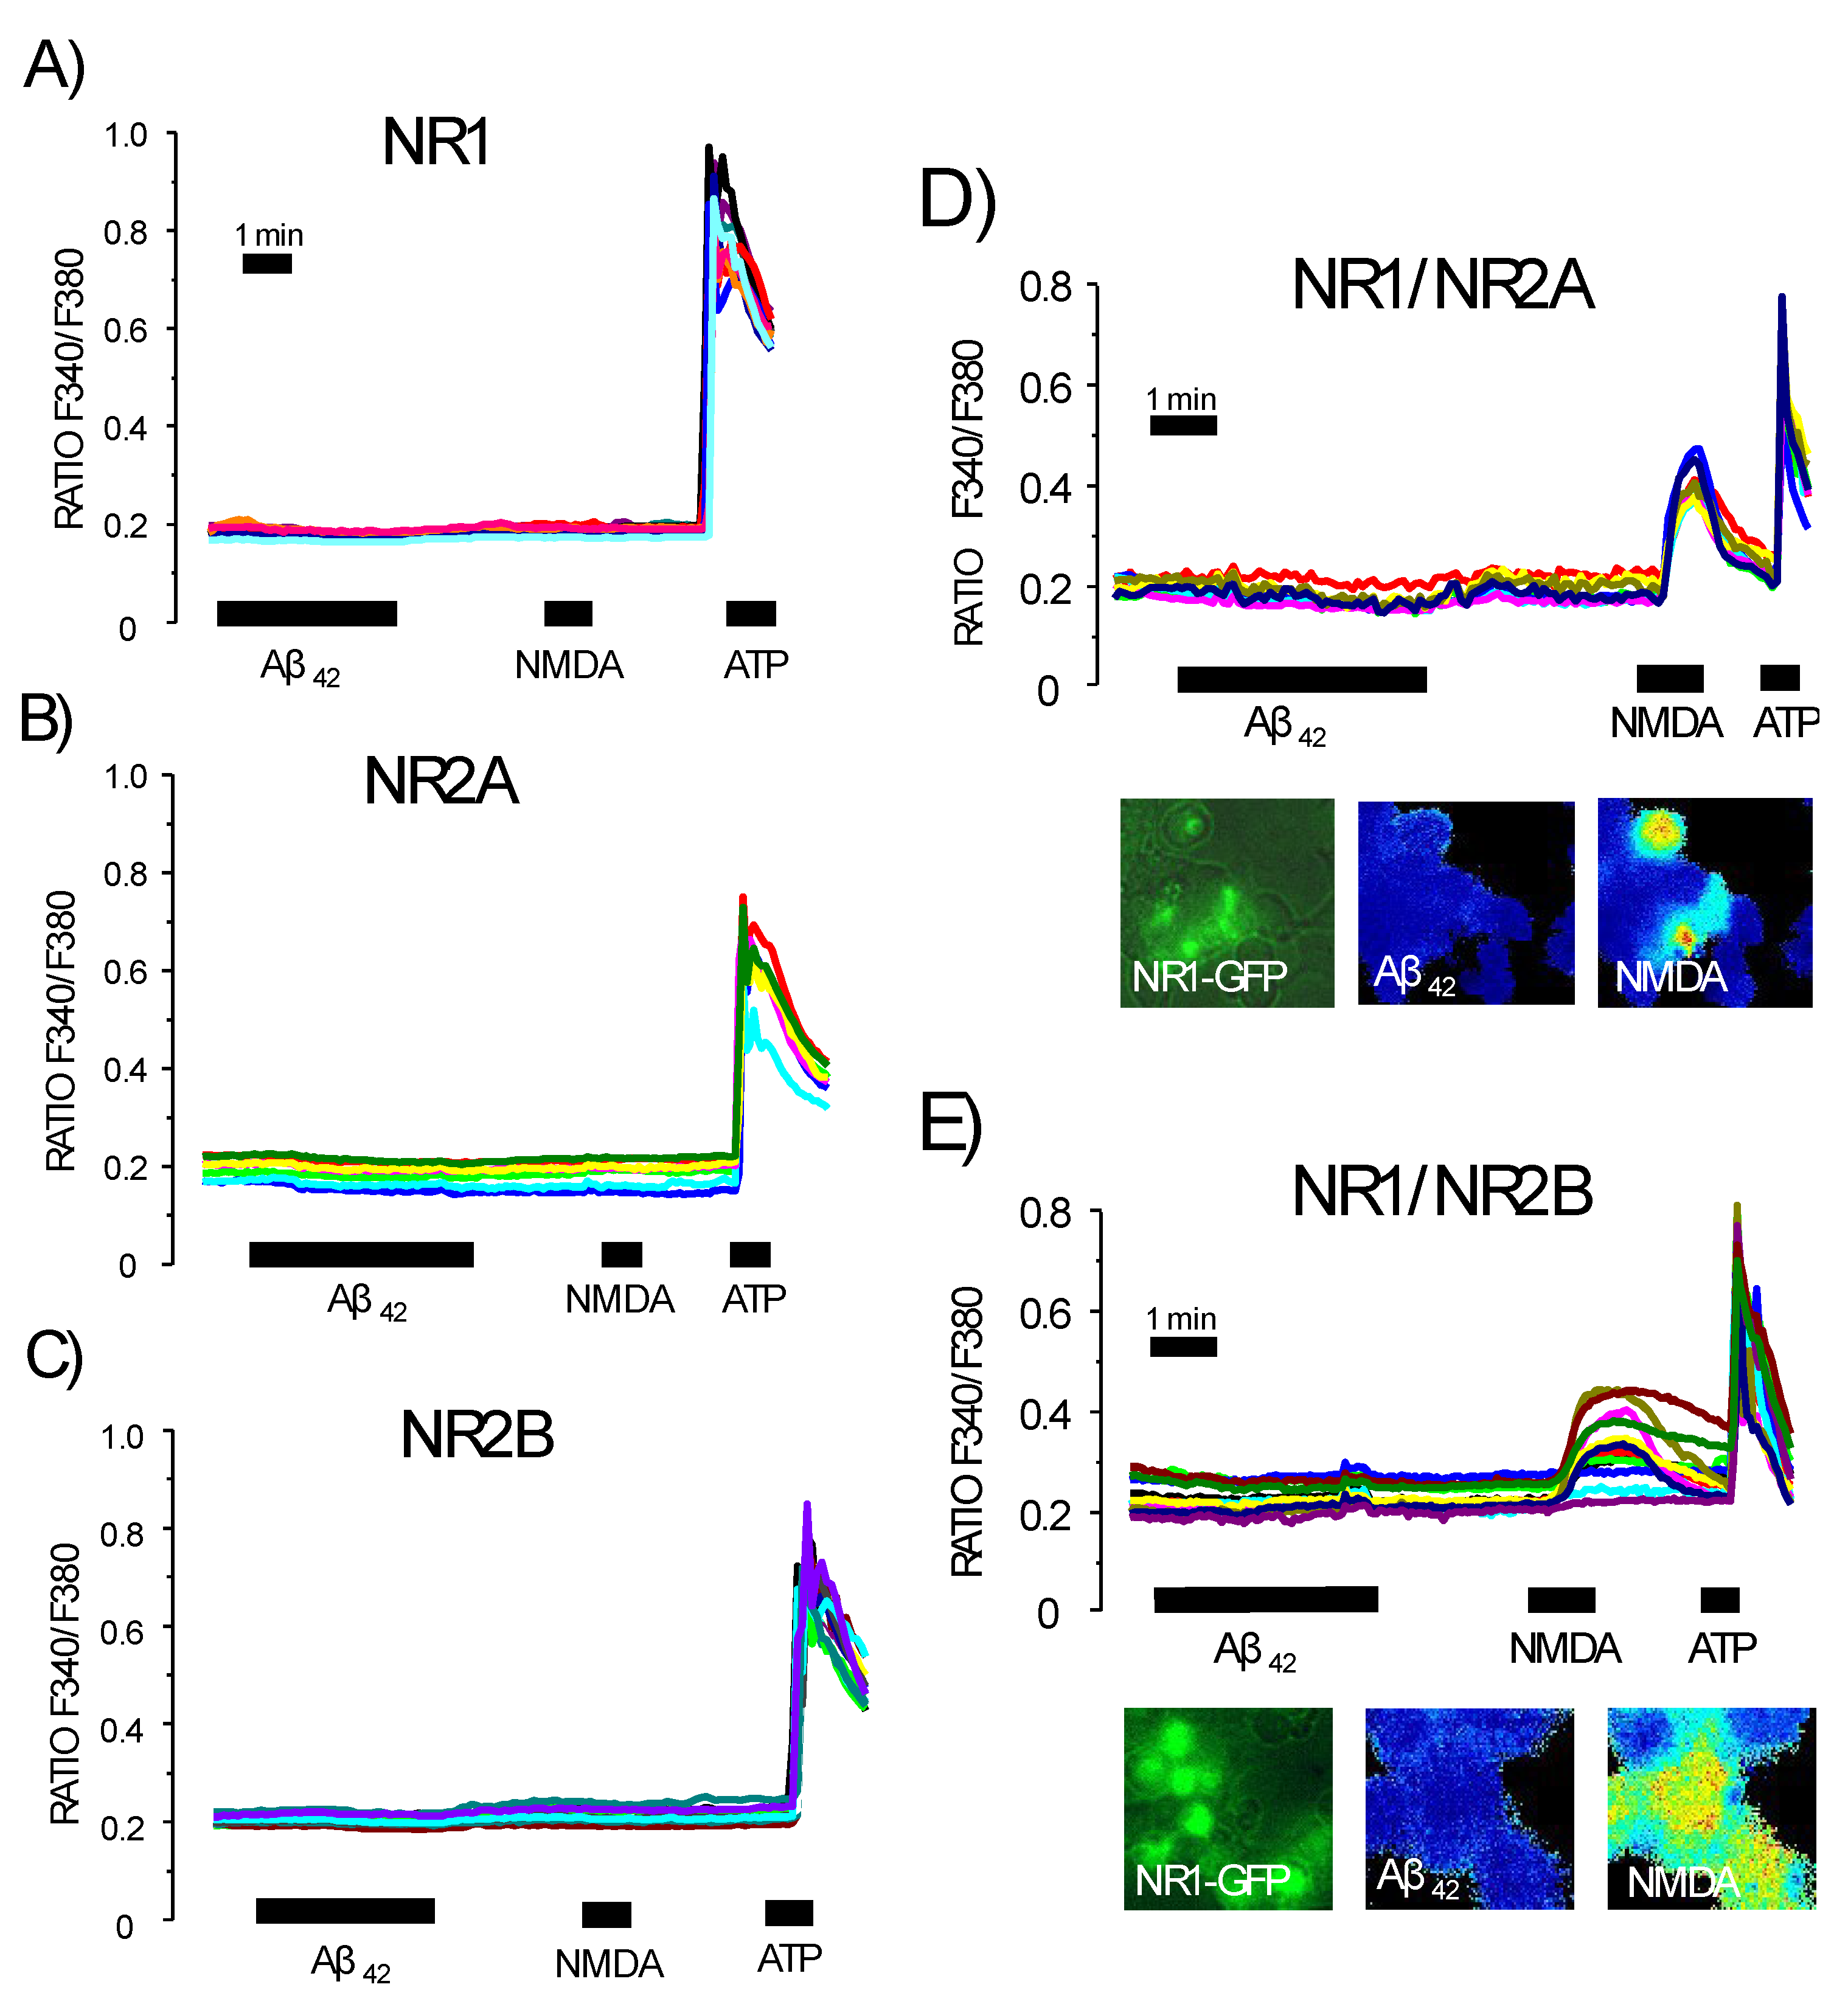
3.5. Expression of NMDA Receptors Is Mandatory for Ca2+ Responses to Aβ1–42 Oligomers
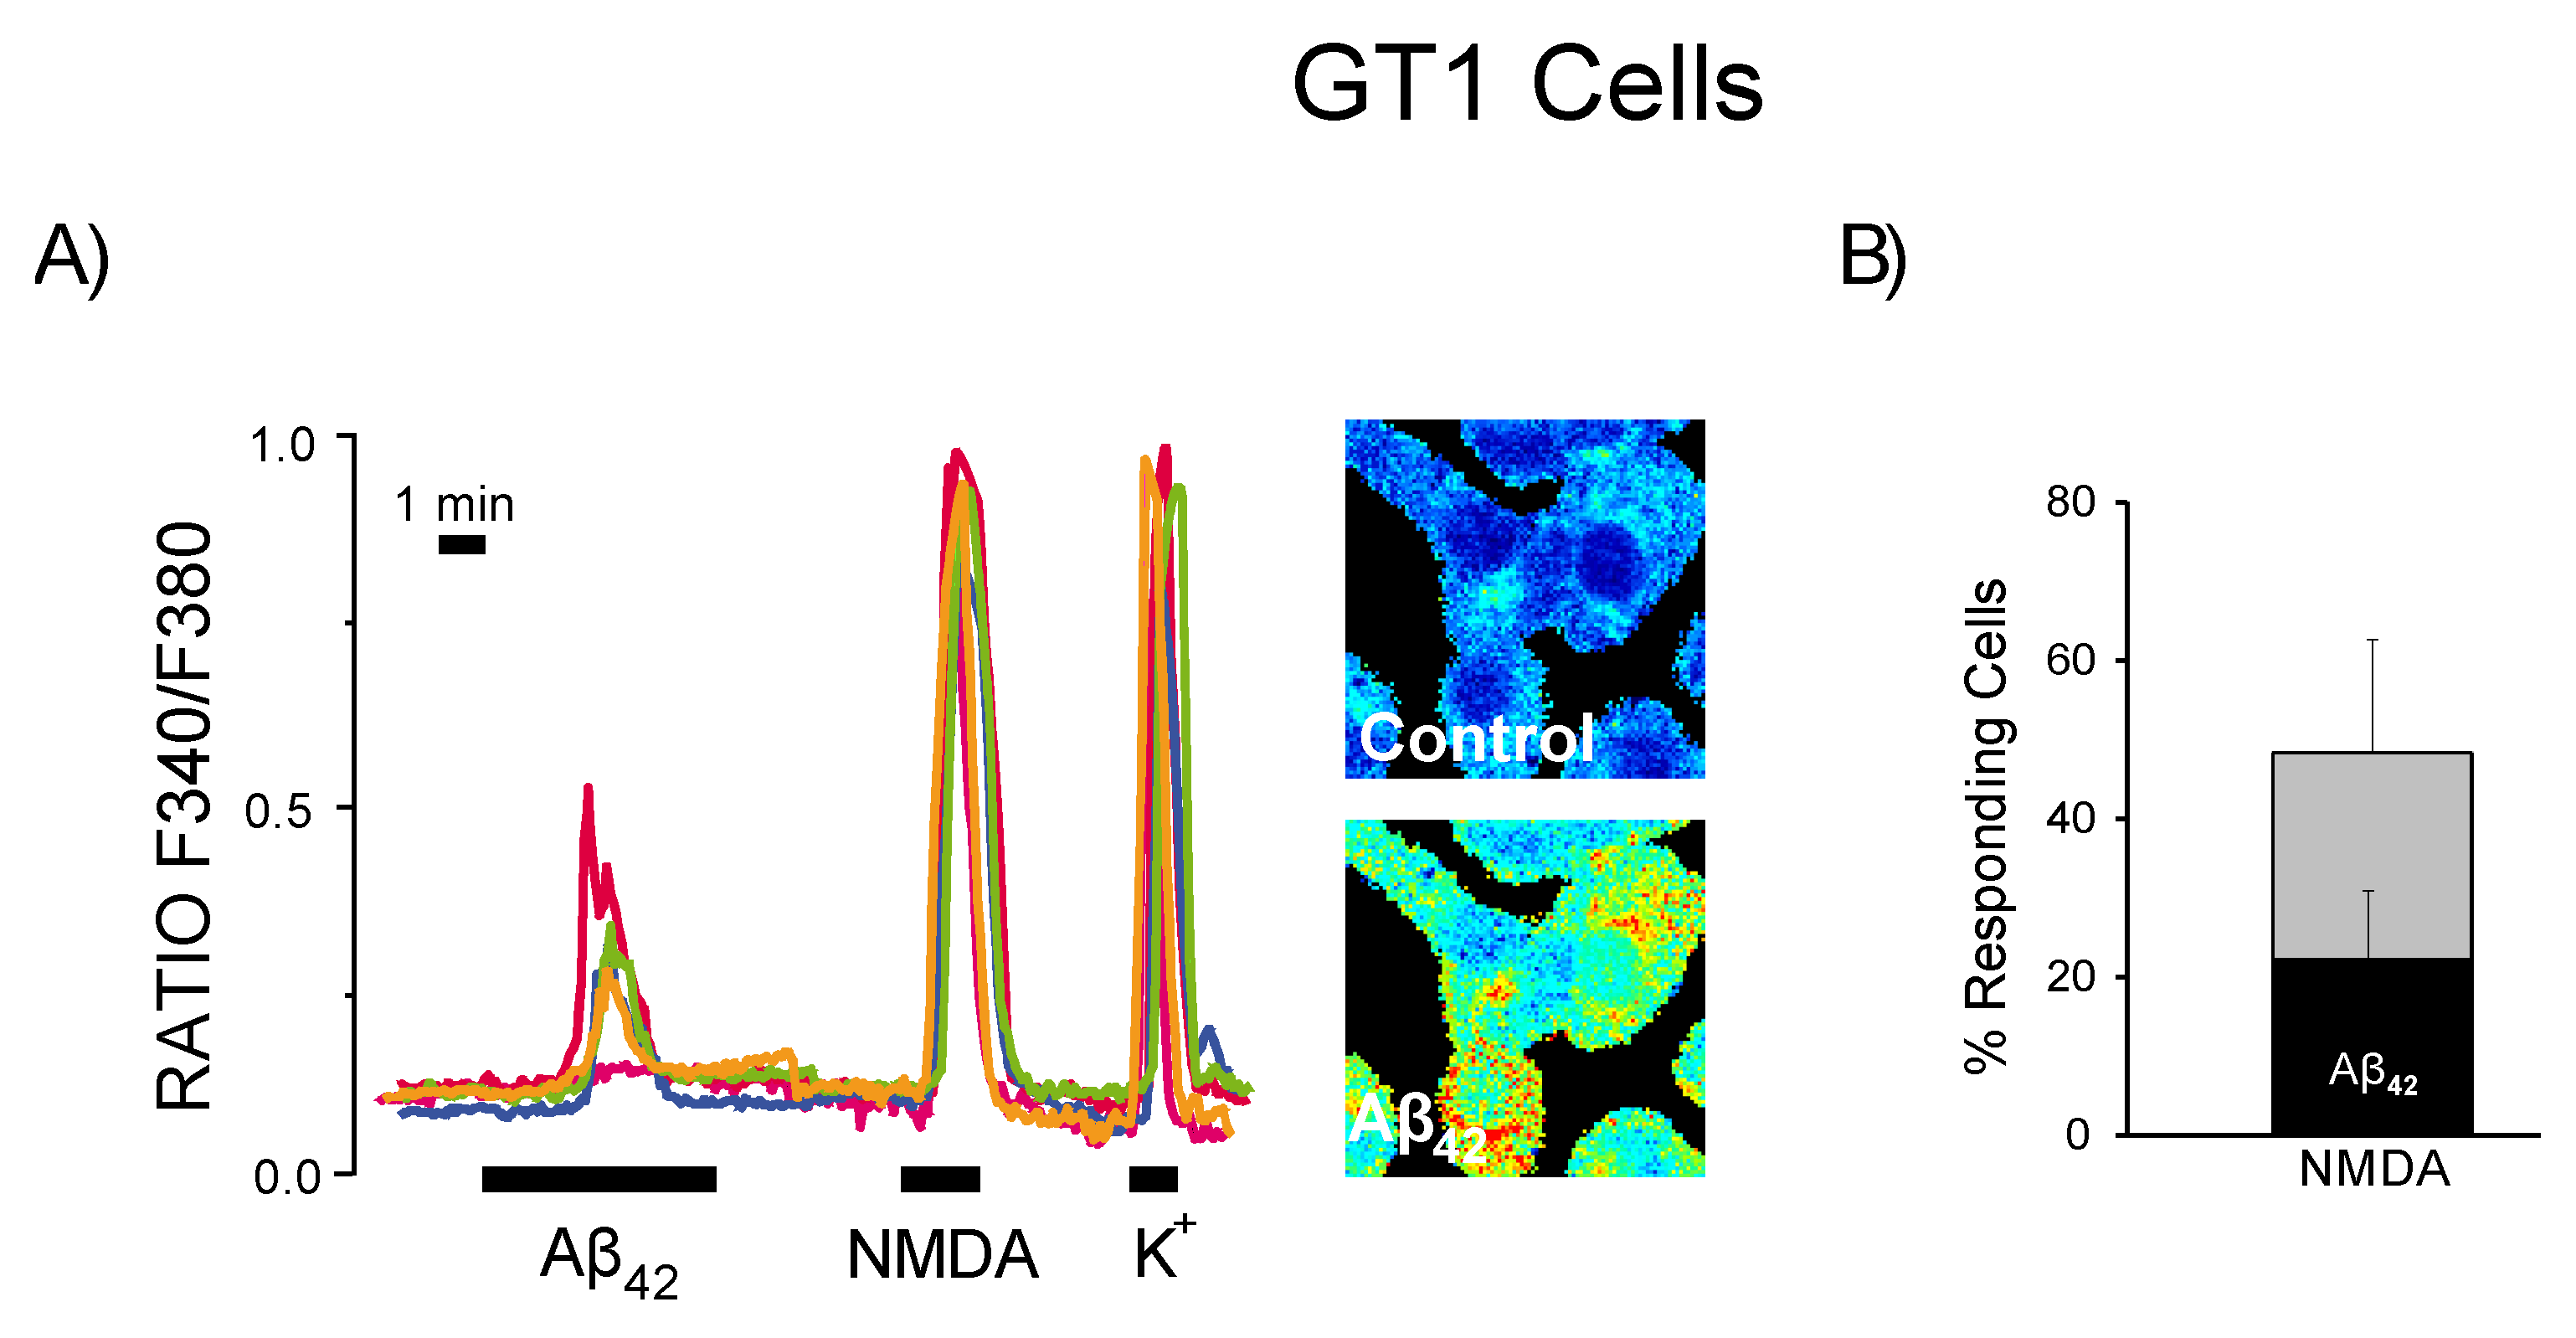
3.6. Expression of Functional NMDA Receptors Is Not Sufficient for Ca2+ Responses Induced by Aβ1–42 Oligomers
4. Discussion
Supplementary Materials
Author Contributions
Funding
Institutional Review Board Statement
Informed Consent Statement
Data Availability Statement
Acknowledgments
Conflicts of Interest
References
- Alzheimer, A. Uber eine eigenartige Erkrankung der Hirnrinde. Allg. Z. Psychiatr. Phychish Gerichtl. Med. 1907, 64, 146–148. [Google Scholar]
- Tahami Monfared, A.A.; Byrnes, M.J.; White, L.A.; Zhang, Q. The Humanistic and Economic Burden of Alzheimer’s Disease. Neurol. Ther. 2022, ahead of print.
- Kim, C.K.; Lee, Y.R.; Ong, L.; Gold, M.; Kalali, A.; Sarkar, J. Alzheimer’s Disease: Key Insights from Two Decades of Clinical Trial Failures. J. Alzheimer’s Dis. 2022, 87, 83–100. [Google Scholar] [CrossRef] [PubMed]
- Haass, C.; Selkoe, D.J. Soluble protein oligomers in neurodegeneration: Lessons from the Alzheimer’s amyloid beta peptide. Nat. Rev. Mol. Cell. Biol. 2007, 8, 101–112. [Google Scholar] [CrossRef] [PubMed]
- Jellinger, K.A. Recent update on the heterogeneity of the Alzheimer’s disease spectrum. J. Neural Transm. 2022, 129, 1–24. [Google Scholar] [CrossRef]
- Tanzi, R.E.; Kovacs, D.M.; Kim, T.W.; Moir, R.D.; Guenette, S.Y.; Wasco, W. The gene defects responsible for familial Alzheimer’s disease. Neurobiol. Dis. 1996, 3, 159–168. [Google Scholar] [CrossRef] [Green Version]
- Sanz-Blasco, S.; Valero, R.A.; Rodríguez-Crespo, I.; Villalobos, C.; Núñez, L. Mitochondrial Ca2+ overload underlies Aβ oligomers neurotoxicity providing an unexpected mechanism of neuroprotection by NSAIDs. PLoS ONE 2008, 3, e2718. [Google Scholar] [CrossRef] [Green Version]
- Calvo, M.; Sanz-Blasco, S.; Caballero, E.; Villalobos, C.; Núñez, L. Susceptibility to excitotoxicity in aged hippocampal cultures and neuroprotection by non-steroidal anti-inflammatory drugs: Role of mitochondrial calcium. J. Neurochem. 2015, 132, 403–417. [Google Scholar] [CrossRef]
- Caballero, E.; Calvo-Rodriguez, M.; Gonzalo-Ruiz, A.; Villalobos, C.; Núñez, L. A new procedure for amyloid β oligomers preparation enables the unambiguous testing of their effects on cytosolic and mitochondrial Ca2+ entry and cell death in primary neurons. Neurosci. Lett. 2016, 612, 66–73. [Google Scholar] [CrossRef]
- Calvo-Rodríguez, M.; Núñez, L.; Villalobos, C. Non-steroidal anti-inflammatory drugs (NSAIDs) and neuroprotection in the elderly: A view from the mitochondria. Neural Regen. Res. 2015, 10, 1371–1372. [Google Scholar]
- Calvo-Rodríguez, M.; García-Durillo, M.; Villalobos, C.; Núñez, L. Aging enables Ca2+ overload and apoptosis induced by amyloid-β oligomers in rat hippocampal neurons: Neuroprotection by non-steroidal anti-inflammatory drugs and R-flurbiprofen in aging neurons. J. Alzheimer’s Dis. 2016, 54, 207–221. [Google Scholar] [CrossRef]
- Sanz-Blasco, S.; Calvo-Rodríguez, M.; Caballero, E.; García-Durillo, M.; Núñez, L.; Villalobos, C. Is it all said for NSAIDs in Alzheimer’s disease? Role of mitochondrial calcium uptake. Curr. Alzheimer Res. 2018, 15, 504–510. [Google Scholar] [CrossRef] [PubMed]
- Calvo-Rodríguez, M.; García-Durillo, M.; Villalobos, C.; Núñez, L. In vitro aging promotes endoplasmic reticulum (ER)-mitochondria Ca2+ cross talk and loss of store-operated Ca2+ entry (SOCE) in rat hippocampal neurons. Biochim. Biophys. Acta Mol. Cell Res. 2016, 863, 2637–2649. [Google Scholar] [CrossRef] [PubMed]
- Zhang, H.; Wu, L.; Pchitskaya, E.; Zakharova, O.; Saito, T.; Saido, T.; Bezprozvanny, I. Neuronal Store-Operated Calcium Entry and Mushroom Spine Loss in Amyloid Precursor Protein Knock-In Mouse Model of Alzheimer’s Disease. J. Neurosci. 2015, 35, 13275–13286. [Google Scholar] [CrossRef] [PubMed] [Green Version]
- Calvo-Rodríguez, M.; de la Fuente, C.; García-Durillo, M.; García-Rodríguez, C.; Villalobos, C.; Núñez, L. Aging and amyloid β oligomers enhance TLR4 expression, LPS-induced Ca2+ responses and neuron cell death in cultured rat hippocampal neurons. J. Neuroinflamm. 2017, 14, 24. [Google Scholar] [CrossRef] [Green Version]
- Calvo-Rodriguez, M.; Hernando-Pérez, E.; Núñez, L.; Villalobos, C. Amyloid β oligomers increase ER-mitochondria Ca2+ cross talk in young hippocampal neurons and exacerbate aging-induced intracellular Ca2+ remodeling. Front. Cell. Neurosci. 2019, 13, 22. [Google Scholar] [CrossRef] [PubMed]
- Calvo-Rodriguez, M.; García-Rodríguez, C.; Villalobos, C.; Núñez, L. Role of Toll like receptor 4 in Alzheimer´s disease. Front. Immunol. 2020, 11, 1588. [Google Scholar] [CrossRef]
- Calvo-Rodriguez, M.; Hernando-Pérez, E.; López-Vázquez, S.; Núñez, J.; Villalobos, C.; Núñez, L. Remodeling of intracellular Ca2+ homeostasis in rat hippocampal neurons aged in vitro. Int. J. Mol. Sci. 2020, 21, 1549. [Google Scholar] [CrossRef] [Green Version]
- Pascual, M.; Calvo-Rodríguez, M.; Núñez, L.; Villalobos, C.; Ureña, J.; Guerri, C. Toll-like receptors in neuroinflammation, neurodegeneration and alcohol-induced brain damage. IUBMB Life 2021, 73, 900–915. [Google Scholar] [CrossRef]
- Arispe, N.; Rojas, E.; Pollard, H.B. Alzheimer disease amyloid beta protein forms calcium channels in bilayer membranes: Blockade by tromethamine and aluminum. Proc. Natl. Acad. Sci. USA 1993, 90, 567–571. [Google Scholar] [CrossRef] [Green Version]
- Lin, H.; Arispe, N.J. Single-cell screening of cytosolic [Ca2+] reveals cell-selective action by the Alzheimer’s Aβ peptide ion channel. Cell Stress Chaperones 2015, 20, 333–342. [Google Scholar] [CrossRef] [Green Version]
- De Felice, F.G.; Velasco, P.T.; Lambert, M.P.; Viola, K.; Fernandez, S.J.; Ferreira, S.T.; Klein, W.L. Abeta oligomers induce neuronal oxidative stress through an N-methyl-D-aspartate receptor-dependent mechanism that is blocked by the Alzheimer drug memantine. J. Biol. Chem. 2007, 282, 11590–11601. [Google Scholar] [CrossRef] [PubMed] [Green Version]
- Alberdi, E.; Sánchez-Gómez, M.V.; Cavaliere, F.; Pérez-Samartín, A.; Zugaza, J.L.; Trullas, R.; Domercq, M.; Matute, C. Amyloid beta oligomers induce Ca2+ dysregulation and neuronal death through activation of ionotropic glutamate receptors. Cell Calcium 2010, 47, 264–272. [Google Scholar] [CrossRef] [PubMed] [Green Version]
- Texidó, L.; Martín-Satué, M.; Alberdi, E.; Solsona, C.; Matute, C. Amyloid beta peptide oligomers directly activate NMDA receptors. Cell Calcium 2011, 49, 184–190. [Google Scholar] [CrossRef] [PubMed]
- Sivanesan, S.; Tan, A.; Rajadas, J. Pathogenesis of Aβ oligomers in synaptic failure. Curr. Alzheimer Res. 2013, 10, 316–323. [Google Scholar] [CrossRef] [PubMed]
- Núñez, L.; Sánchez, A.; Fonteriz, R.I.; Garcia-Sancho, J. Mechanisms for synchronous calcium oscillations in cultured rat cerebellar neurons. Eur. J. Neurosci. 1996, 8, 192–201. [Google Scholar] [CrossRef] [PubMed]
- Alonso, M.T.; Chamero, P.; Villalobos, C.; García-Sancho, J. Fura-2 antagonises calcium-induced calcium release. Cell Calcium 2003, 33, 27–35. [Google Scholar] [CrossRef]
- Sobradillo, D.; Hernández-Morales, M.; Ubierna, D.; Moyer, M.P.; Núñez, L.; Villalobos, C. A reciprocal shift in transient receptor potential channel 1 (TRPC1) and stromal interaction molecule 2 (STIM2) contributes to Ca2+ remodeling and cancer hallmarks in colorectal carcinoma cells. J. Biol. Chem. 2014, 289, 28765–28782. [Google Scholar] [CrossRef] [Green Version]
- Jara, E.; Hidalgo, M.A.; Hancke, J.L.; Hidalgo, A.I.; Brauchi, S.; Nuñez, L.; Villalobos, C.; Burgos, R.A. Delphinidin activates NFAT and induces IL-2 production through SOCE in T cells. Cell Biochem. Biophys. 2014, 68, 497–509. [Google Scholar] [CrossRef]
- Nuñez, L.; Faught, W.J.; Frawley, L.S. Episodic gonadotropin-releasing hormone gene expression revealed by dynamic monitoring of luciferase reporter activity in single, living neurons. Proc. Natl. Acad. Sci. USA 1998, 95, 9648–9653. [Google Scholar] [CrossRef] [Green Version]
- Núñez, L.; Bird, G.S.; Hernando-Pérez, E.; Pérez-Riesgo, E.; Putney, J.W., Jr.; Villalobos, C. Store-operated Ca2+ entry and Ca2+ responses to hypothalamic releasing hormones in anterior pituitary cells from Orai1-/- and heptaTRPC knockout mice. Biochim. Biophys. Acta Mol. Cell. Res. 2019, 1866, 1124–1136. [Google Scholar] [CrossRef]
- Penn, Y.; Segal, M.; Moses, E. Network synchronization in hippocampal neurons. Proc. Natl. Acad. Sci. USA 2016, 113, 3341–3346. [Google Scholar] [CrossRef] [PubMed] [Green Version]
- Villalobos, C.; Núñez, L.; Garcia-Sancho, J. Functional glutamate receptors in a subpopulation of anterior pituitary cells. FASEB J. 1996, 10, 654–660. [Google Scholar] [CrossRef] [PubMed]
- Miglio, G.; Dianzani, C.; Fallarini, S.; Fantozzi, R.; Lombardi, G. Stimulation of N-methyl-D-aspartate receptors modulates Jurkat T cell growth and adhesion to fibronectin. Biochem. Biophys. Res. Commun. 2007, 361, 404–409. [Google Scholar] [CrossRef] [PubMed]
- Mahesh, V.B.; Zamorano, P.; De Sevilla, L.; Lewis, D.; Brann, D.W. Characterization of ionotropic glutamate receptors in rat hypothalamus, pituitary and immortalized gonadotropin-releasing hormone (GnRH) neurons (GT1-7 cells). Neuroendocrinology 1999, 69, 397–407. [Google Scholar] [CrossRef]
- Kloda, A.; Martinac, B.; Adams, D.J. Polymodal regulation of NMDA receptor channels. Channels 2007, 1, 334–343. [Google Scholar] [CrossRef] [Green Version]
- Atwood, C.; Bacskai, B.; Kuchibhotla, K.; Bezprozvanny, I.; Chakroborty, S.; Fagan, T.; Foskett, K.; Green, K.; Goussakov, I.; Moyer, J.; et al. Alzheimer research forum live discussion: Calcium in AD pathogenesis. J. Alzheimer’s Dis. 2009, 16, 909–917. [Google Scholar]
- Berridge, M.J. Calcium signalling and Alzheimer’s disease. Neurochem. Res. 2011, 36, 1149–1156. [Google Scholar] [CrossRef]
- Cascella, R.; Cecchi, C. Calcium Dyshomeostasis in Alzheimer’s Disease Pathogenesis. Int. J. Mol. Sci. 2021, 22, 4914. [Google Scholar] [CrossRef]
- Arbel-Ornath, M.; Hudry, E.; Boivin, J.R.; Hashimoto, T.; Takeda, S.; Kuchibhotla, K.V.; Hou, S.; Lattarulo, C.R.; Belcher, A.M.; Shakerdge, N.; et al. Soluble oligomeric amyloid-β induces calcium dyshomeostasis that precedes synapse loss in the living mouse brain. Mol. Neurodegener. 2017, 12, 27. [Google Scholar] [CrossRef] [Green Version]
- Calvo-Rodriguez, M.; Hou, S.S.; Snyder, A.C.; Kharitonova, E.K.; Russ, A.N.; Das, S.; Fan, Z.; Muzikansky, A.; Garcia-Alloza, M.; Serrano-Pozo, A.; et al. Increased mitochondrial calcium levels associated with neuronal death in a mouse model of Alzheimer’s disease. Nat. Commun. 2020, 11, 2146. [Google Scholar] [CrossRef]
- Ferreira, I.L.; Ferreiro, E.; Schmidt, J.; Cardoso, J.M.; Pereira, C.M.; Carvalho, A.L.; Oliveira, C.R.; Rego, A.C. Aβ and NMDAR activation cause mitochondrial dysfunction involving ER calcium release. Neurobiol. Aging 2015, 36, 680–692. [Google Scholar] [CrossRef] [PubMed] [Green Version]
- Zempel, H.; Thies, E.; Mandelkow, E.; Mandelkow, E.M. Aβ oligomers cause localized Ca2+ elevation, missorting of endogenous Tau into dendrites, Tau phosphorylation, and destruction of microtubules and spines. J. Neurosci. 2010, 30, 11938–11950. [Google Scholar] [CrossRef] [PubMed]


Publisher’s Note: MDPI stays neutral with regard to jurisdictional claims in published maps and institutional affiliations. |
© 2022 by the authors. Licensee MDPI, Basel, Switzerland. This article is an open access article distributed under the terms and conditions of the Creative Commons Attribution (CC BY) license (https://creativecommons.org/licenses/by/4.0/).
Share and Cite
Caballero, E.; Hernando-Pérez, E.; Tapias, V.; Calvo-Rodríguez, M.; Villalobos, C.; Núñez, L. Amyloid Beta Oligomers-Induced Ca2+ Entry Pathways: Role of Neuronal Networks, NMDA Receptors and Amyloid Channel Formation. Biomedicines 2022, 10, 1153. https://doi.org/10.3390/biomedicines10051153
Caballero E, Hernando-Pérez E, Tapias V, Calvo-Rodríguez M, Villalobos C, Núñez L. Amyloid Beta Oligomers-Induced Ca2+ Entry Pathways: Role of Neuronal Networks, NMDA Receptors and Amyloid Channel Formation. Biomedicines. 2022; 10(5):1153. https://doi.org/10.3390/biomedicines10051153
Chicago/Turabian StyleCaballero, Erica, Elena Hernando-Pérez, Victor Tapias, María Calvo-Rodríguez, Carlos Villalobos, and Lucía Núñez. 2022. "Amyloid Beta Oligomers-Induced Ca2+ Entry Pathways: Role of Neuronal Networks, NMDA Receptors and Amyloid Channel Formation" Biomedicines 10, no. 5: 1153. https://doi.org/10.3390/biomedicines10051153