
Dopamine Modulates the Processing of Food Odour in the Ventral Striatum

 , , , and
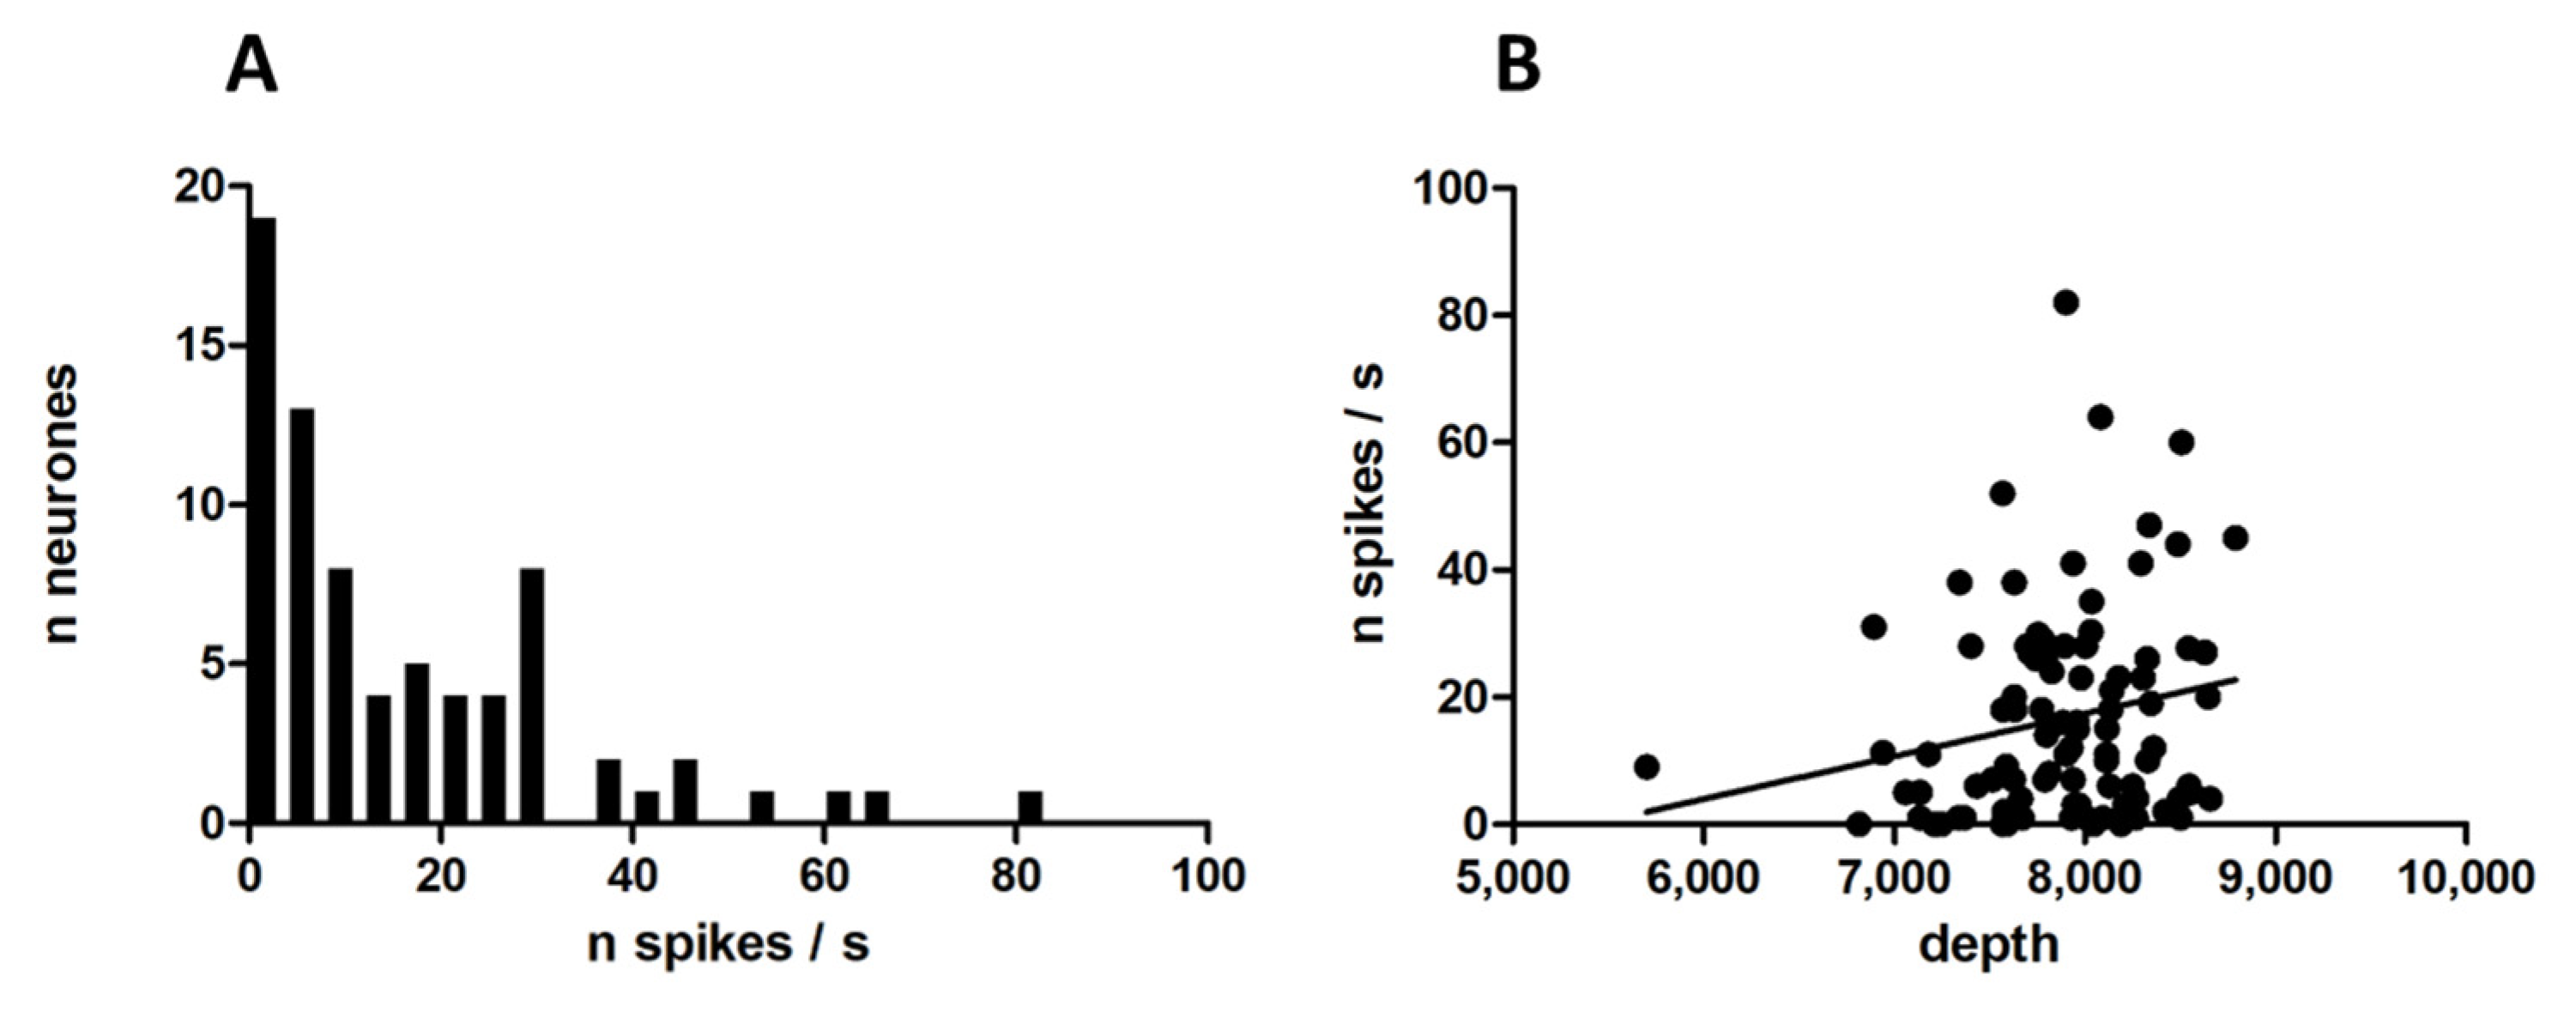
Abstract
:1. Introduction
2. Materials and Methods
2.1. Animals
2.2. Surgical Procedures
2.3. Electrodes
2.4. Stimulations
2.5. Drugs
2.6. Histology
2.7. 3D Reconstructions and Spatial Normalization
2.8. Data Analysis
3. Results
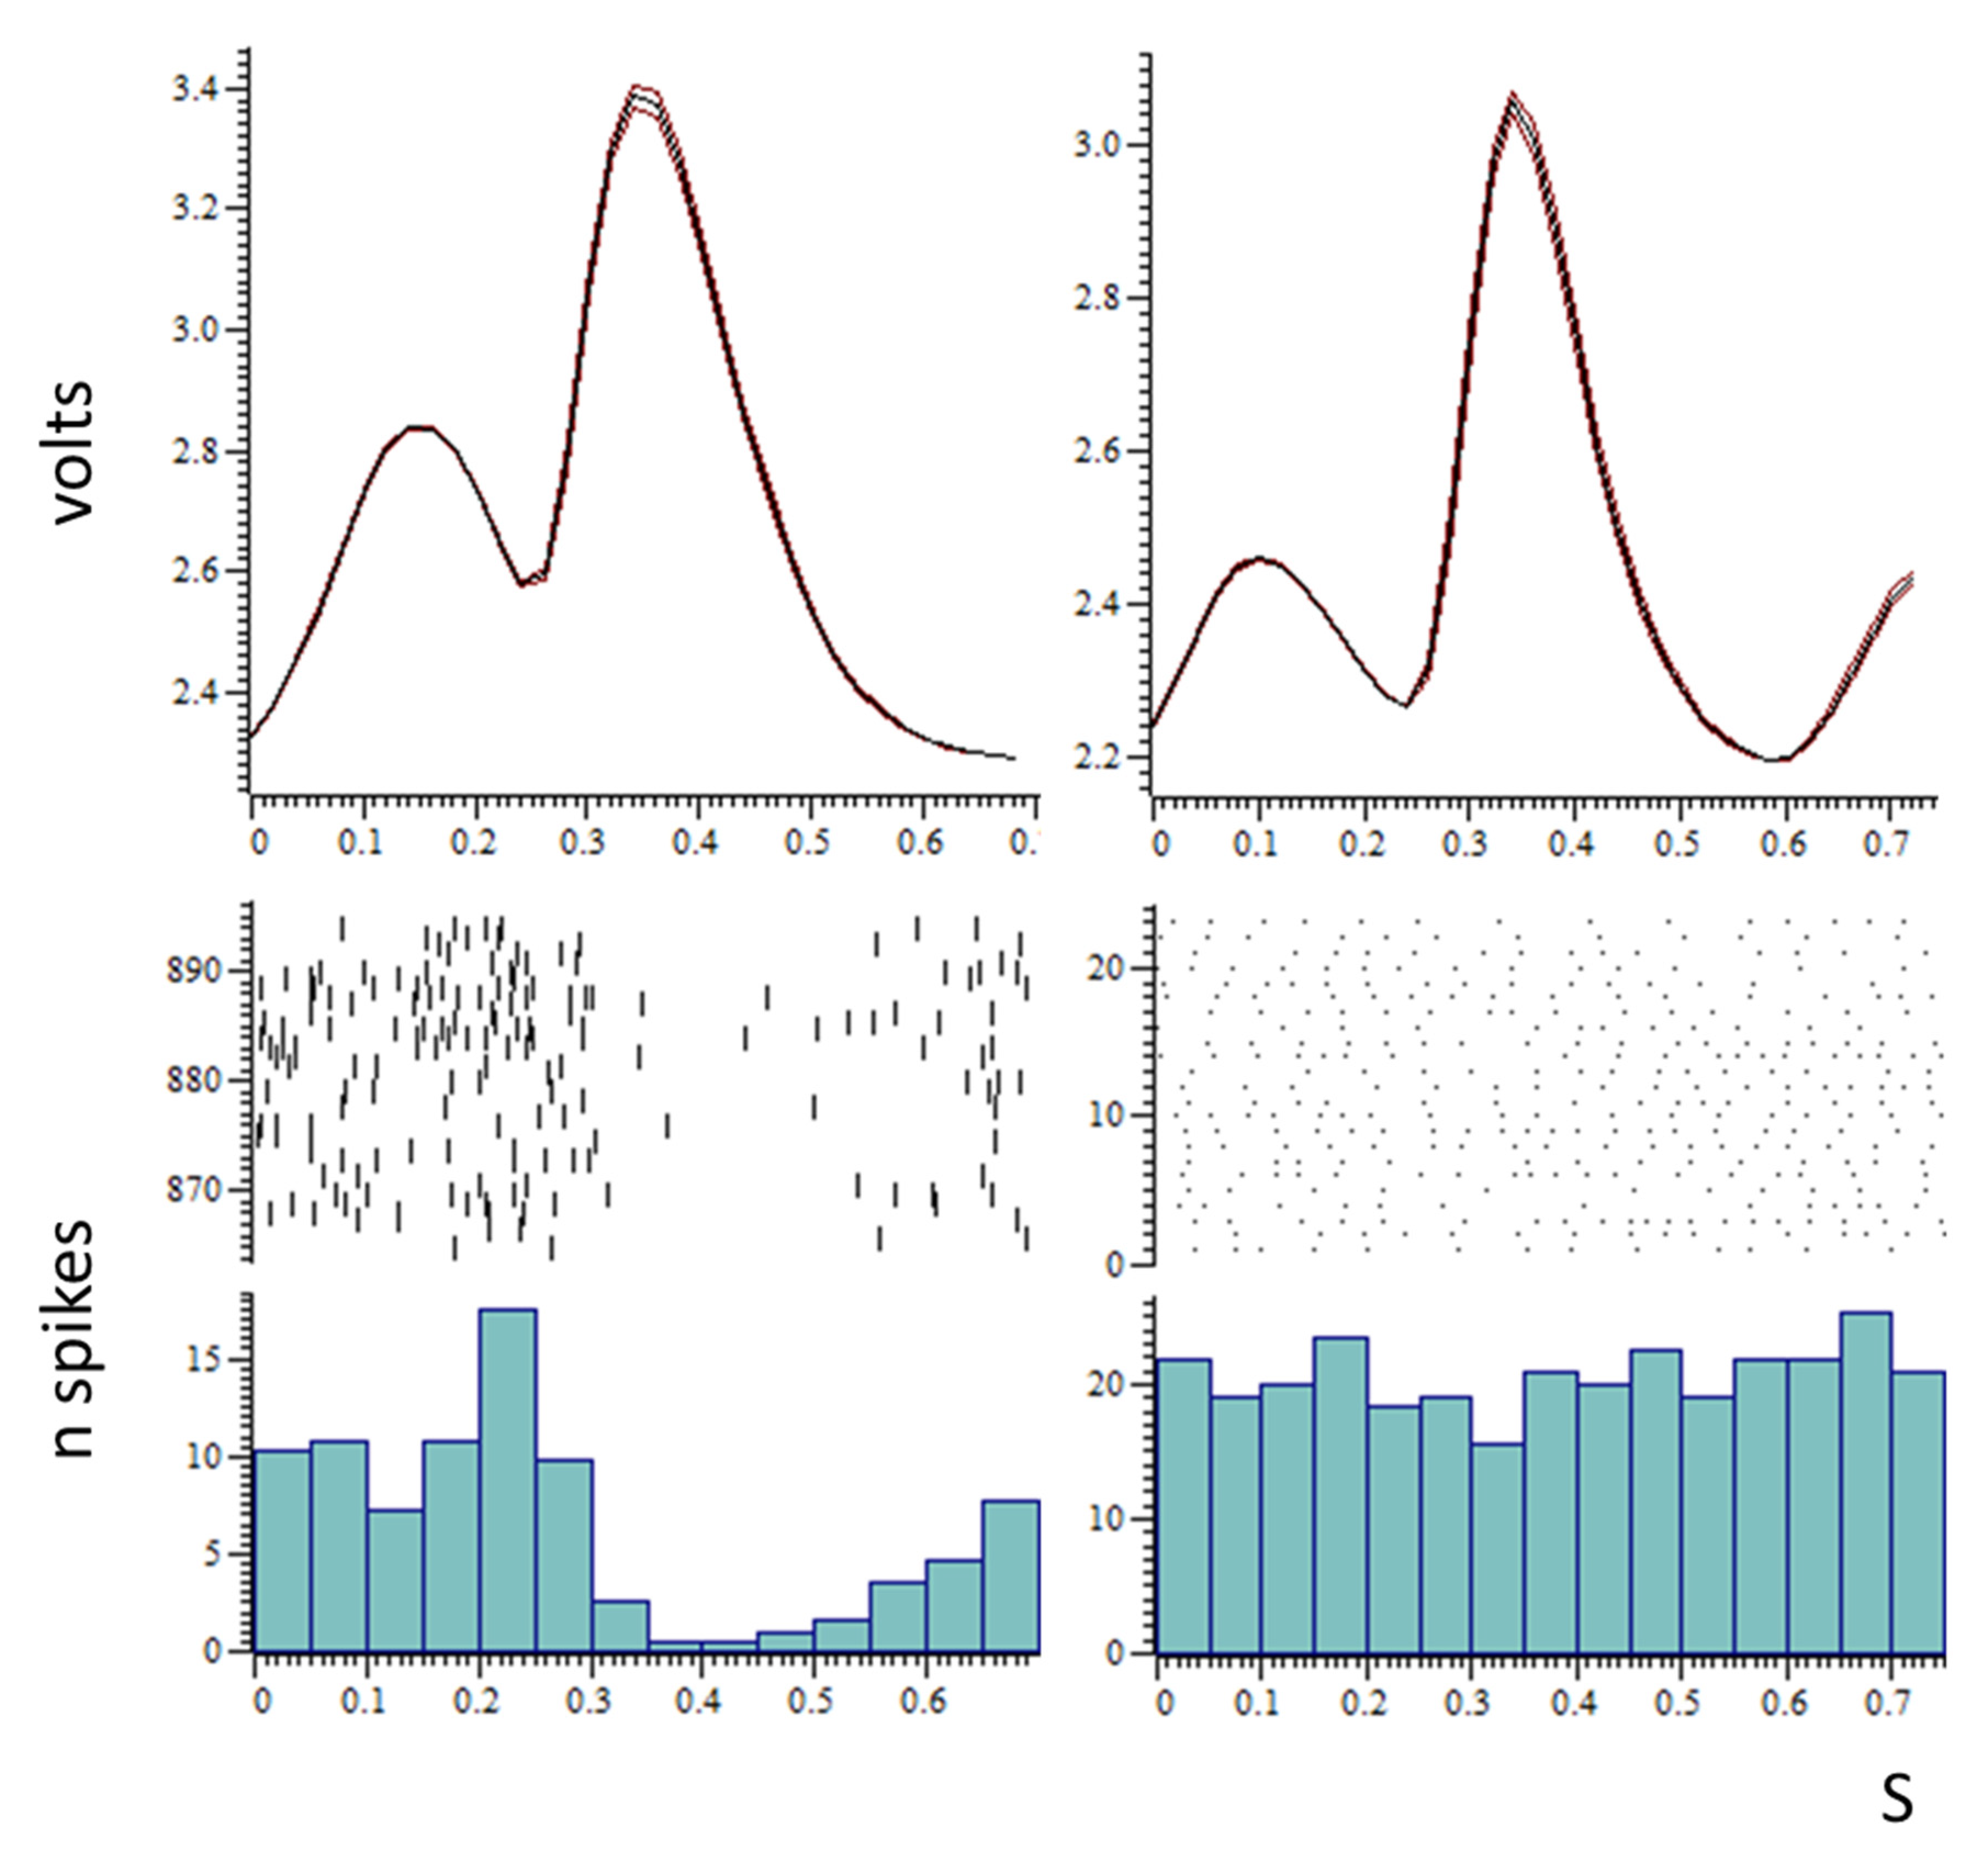
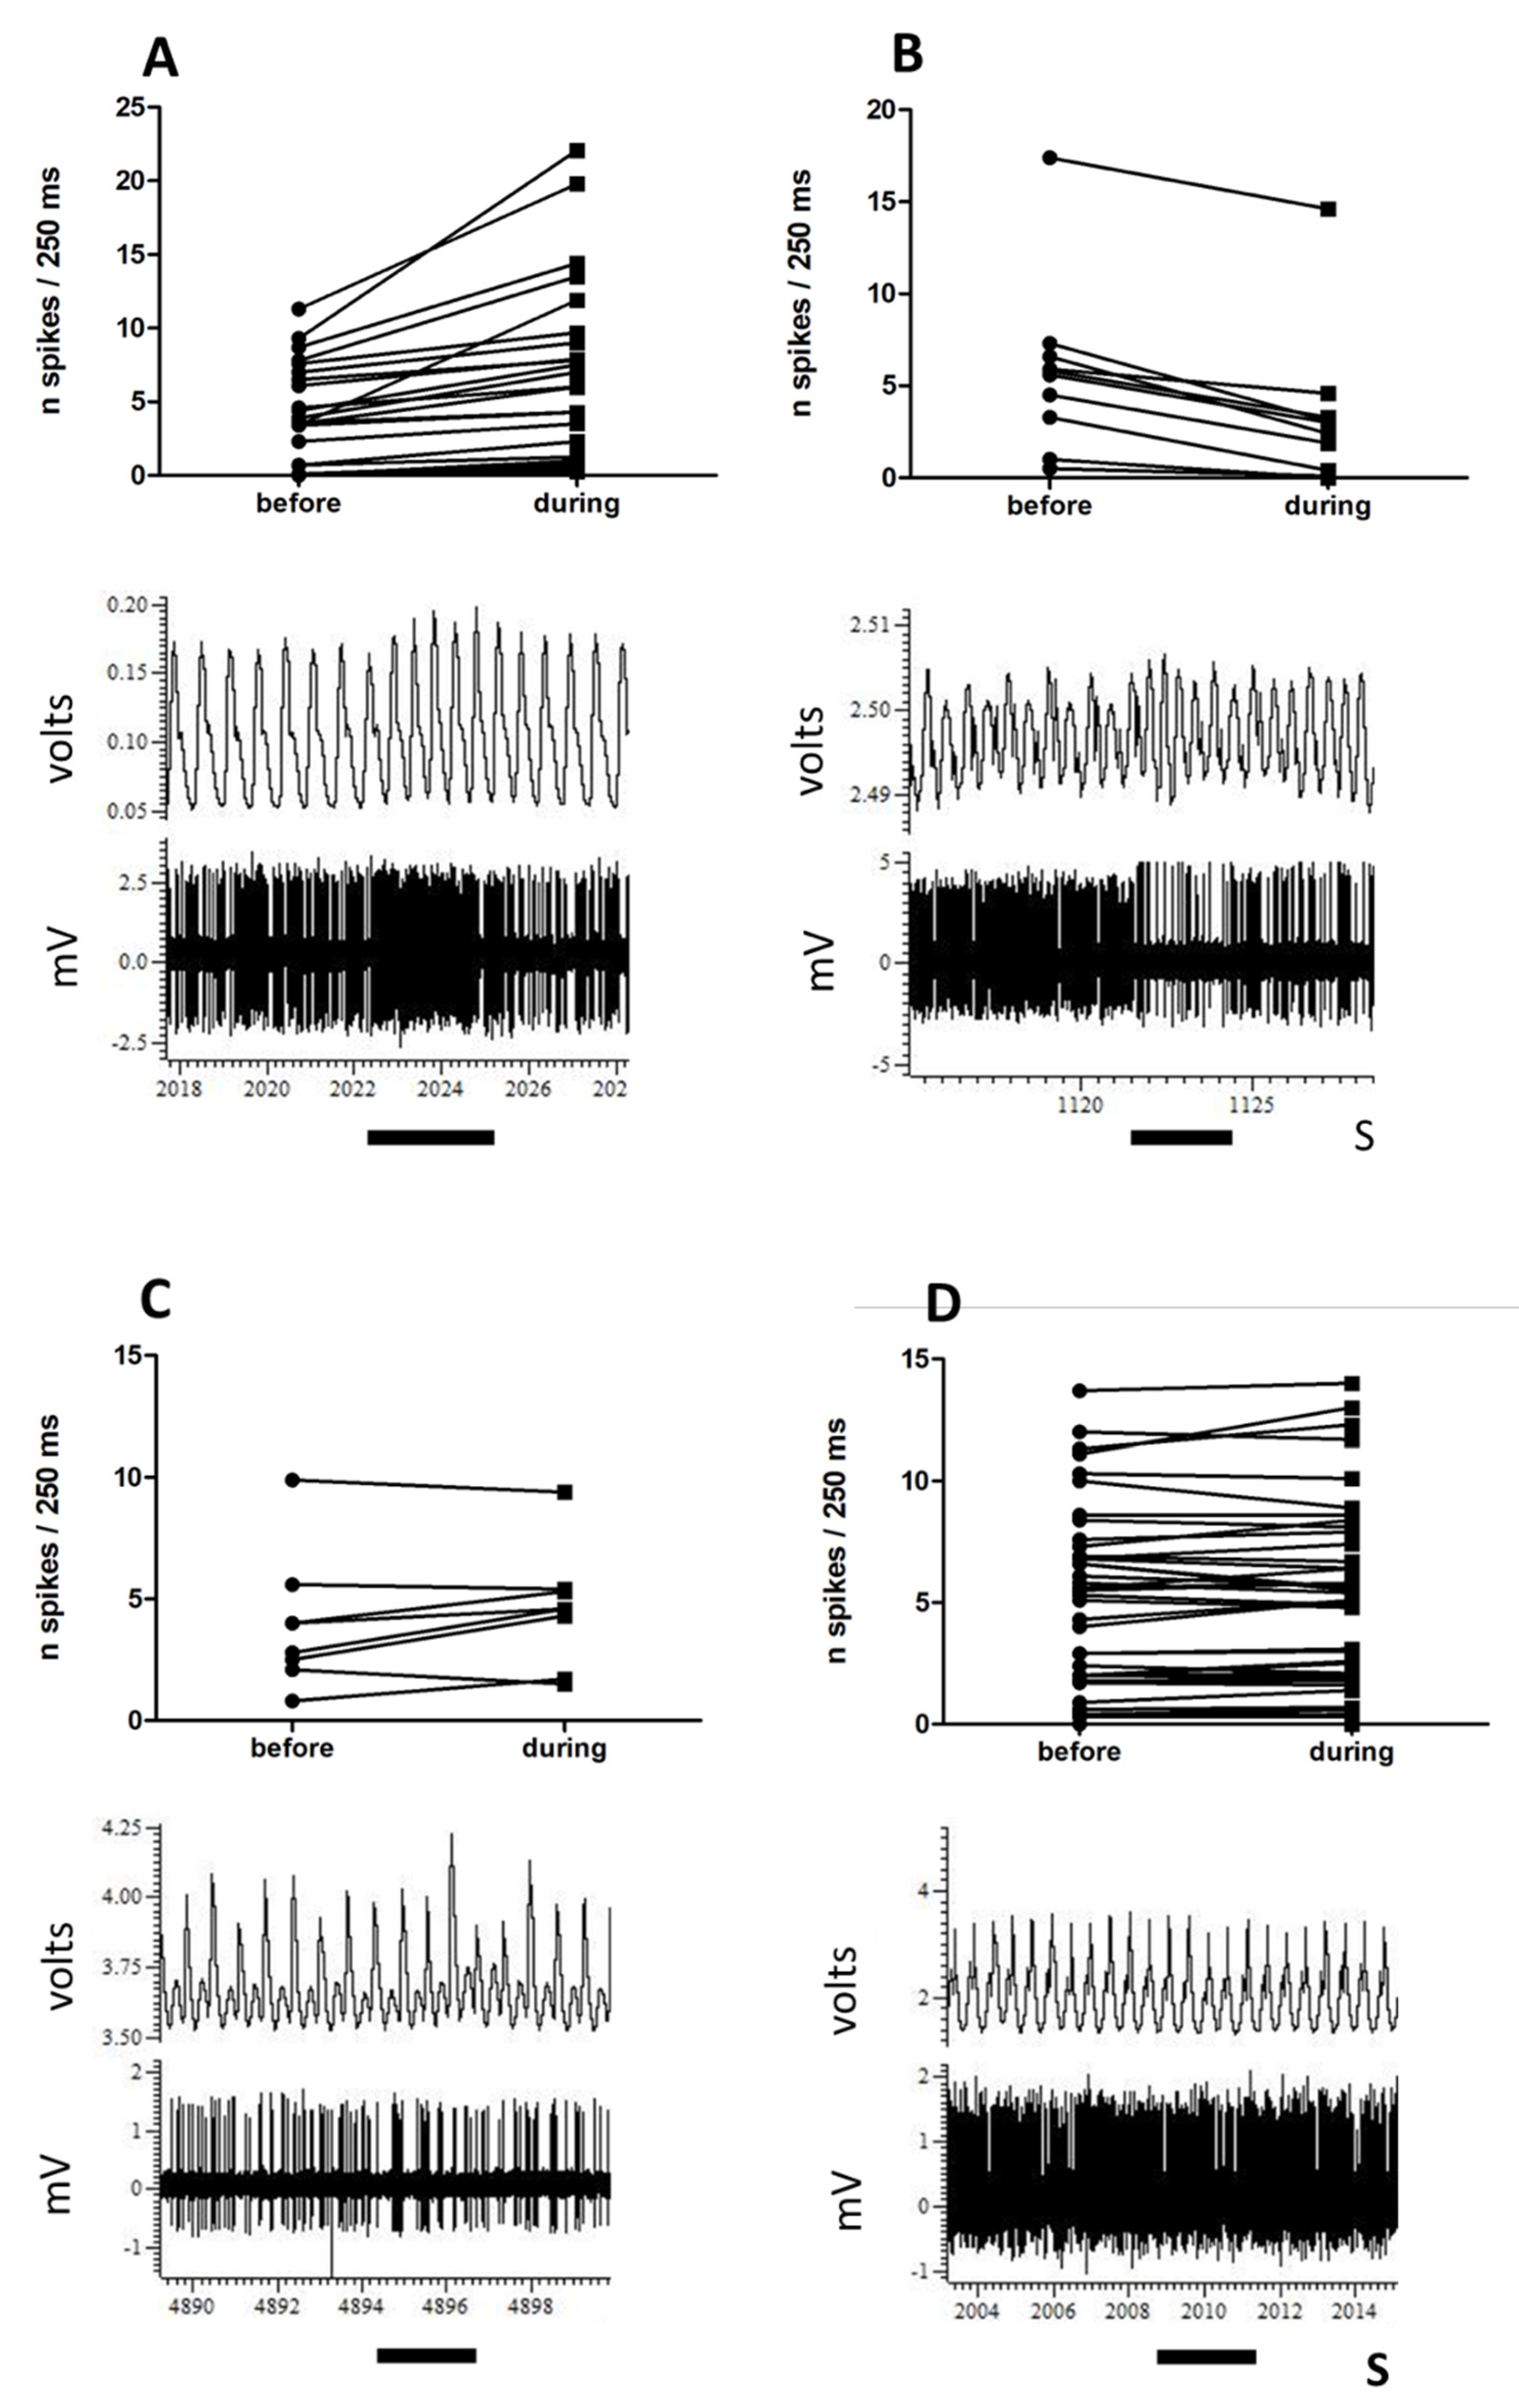
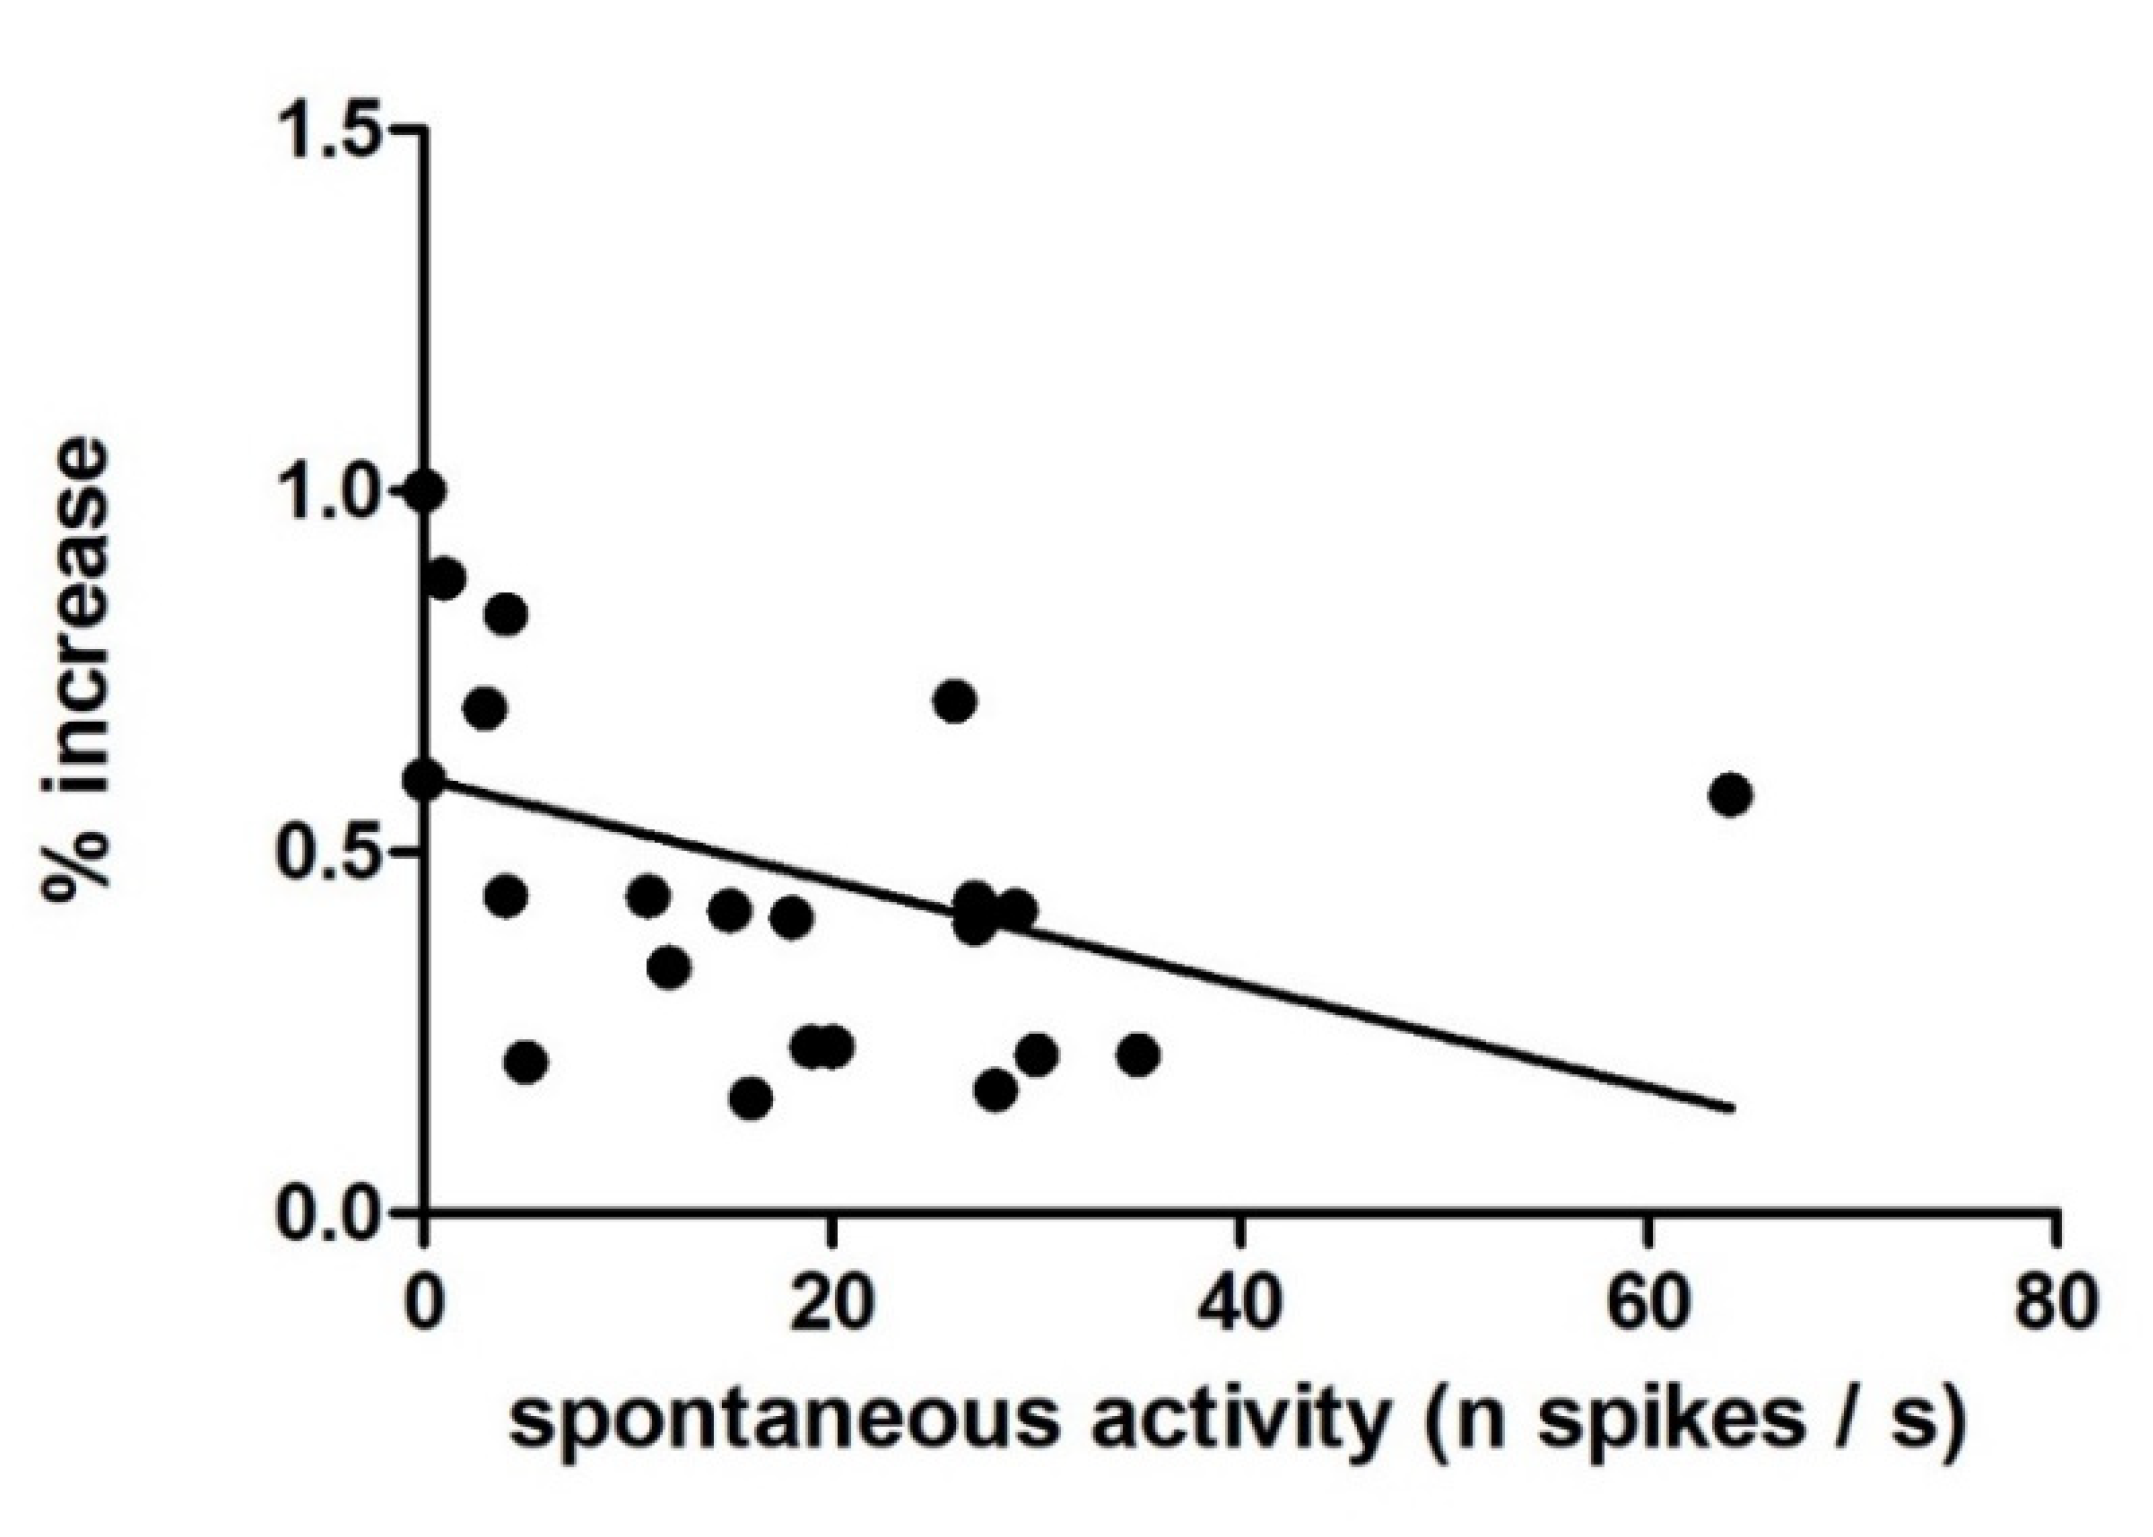
3.1. Single-Unit Recordings
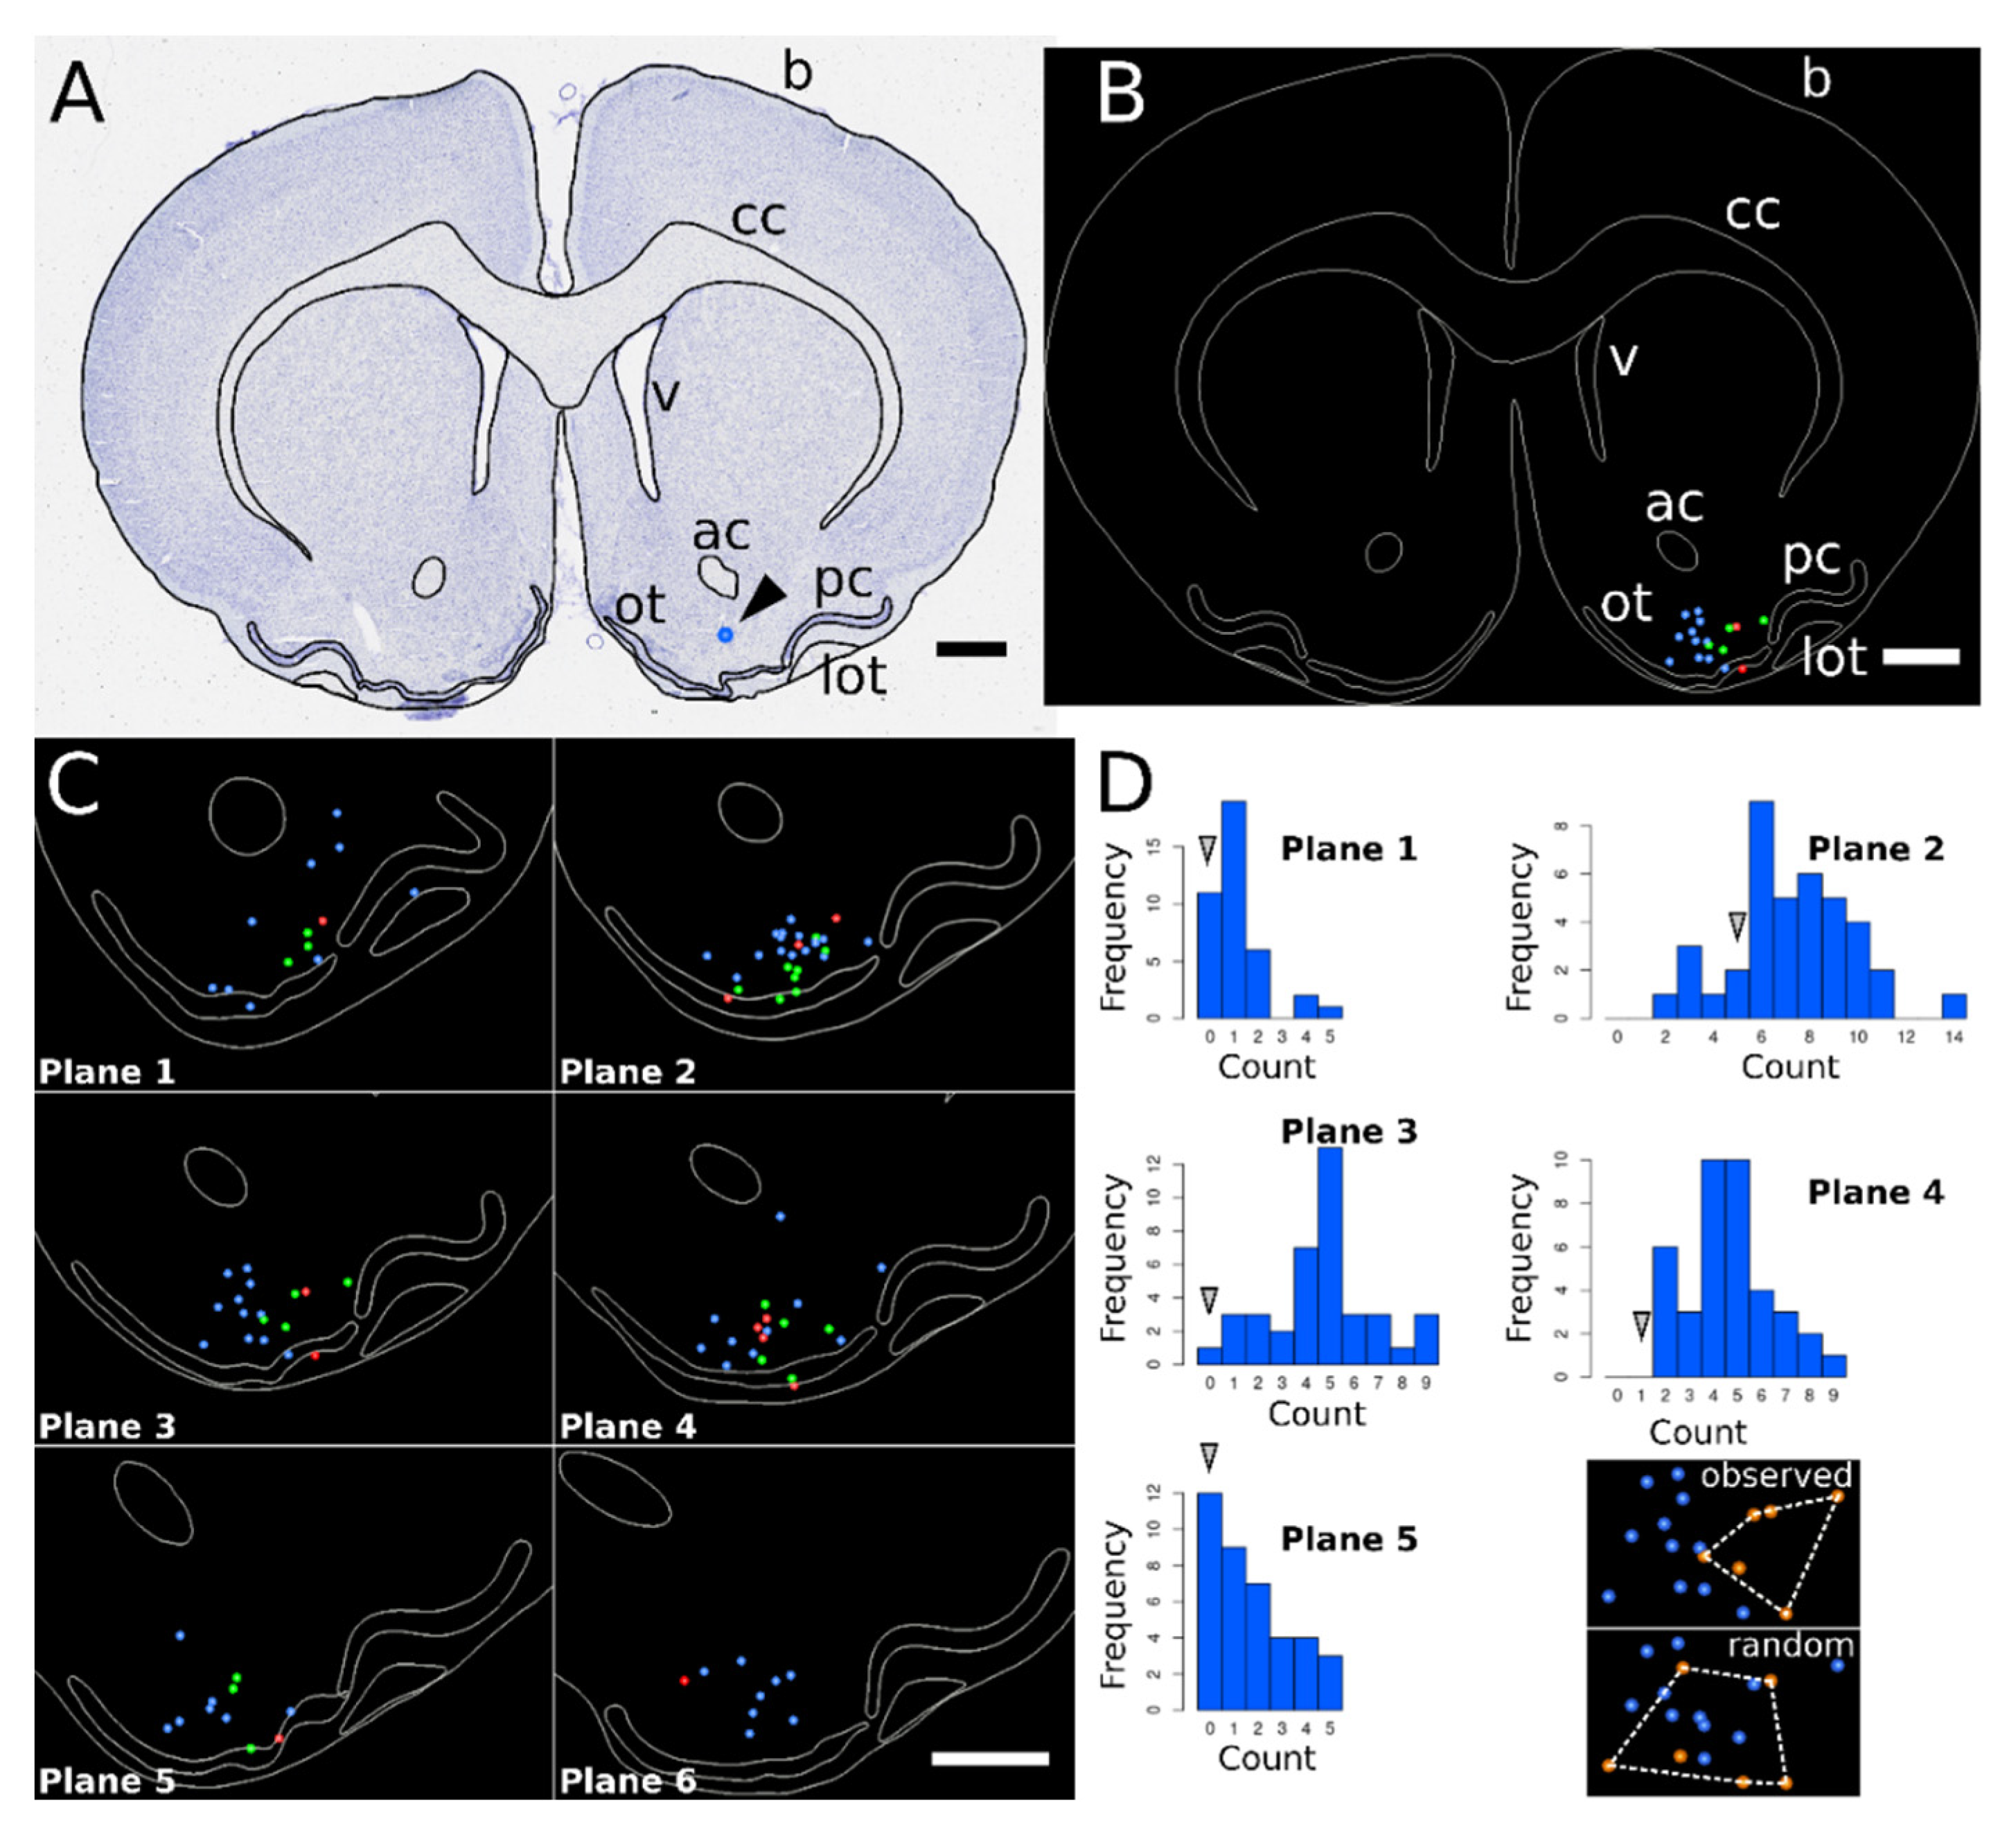
3.2. 3D Reconstruction
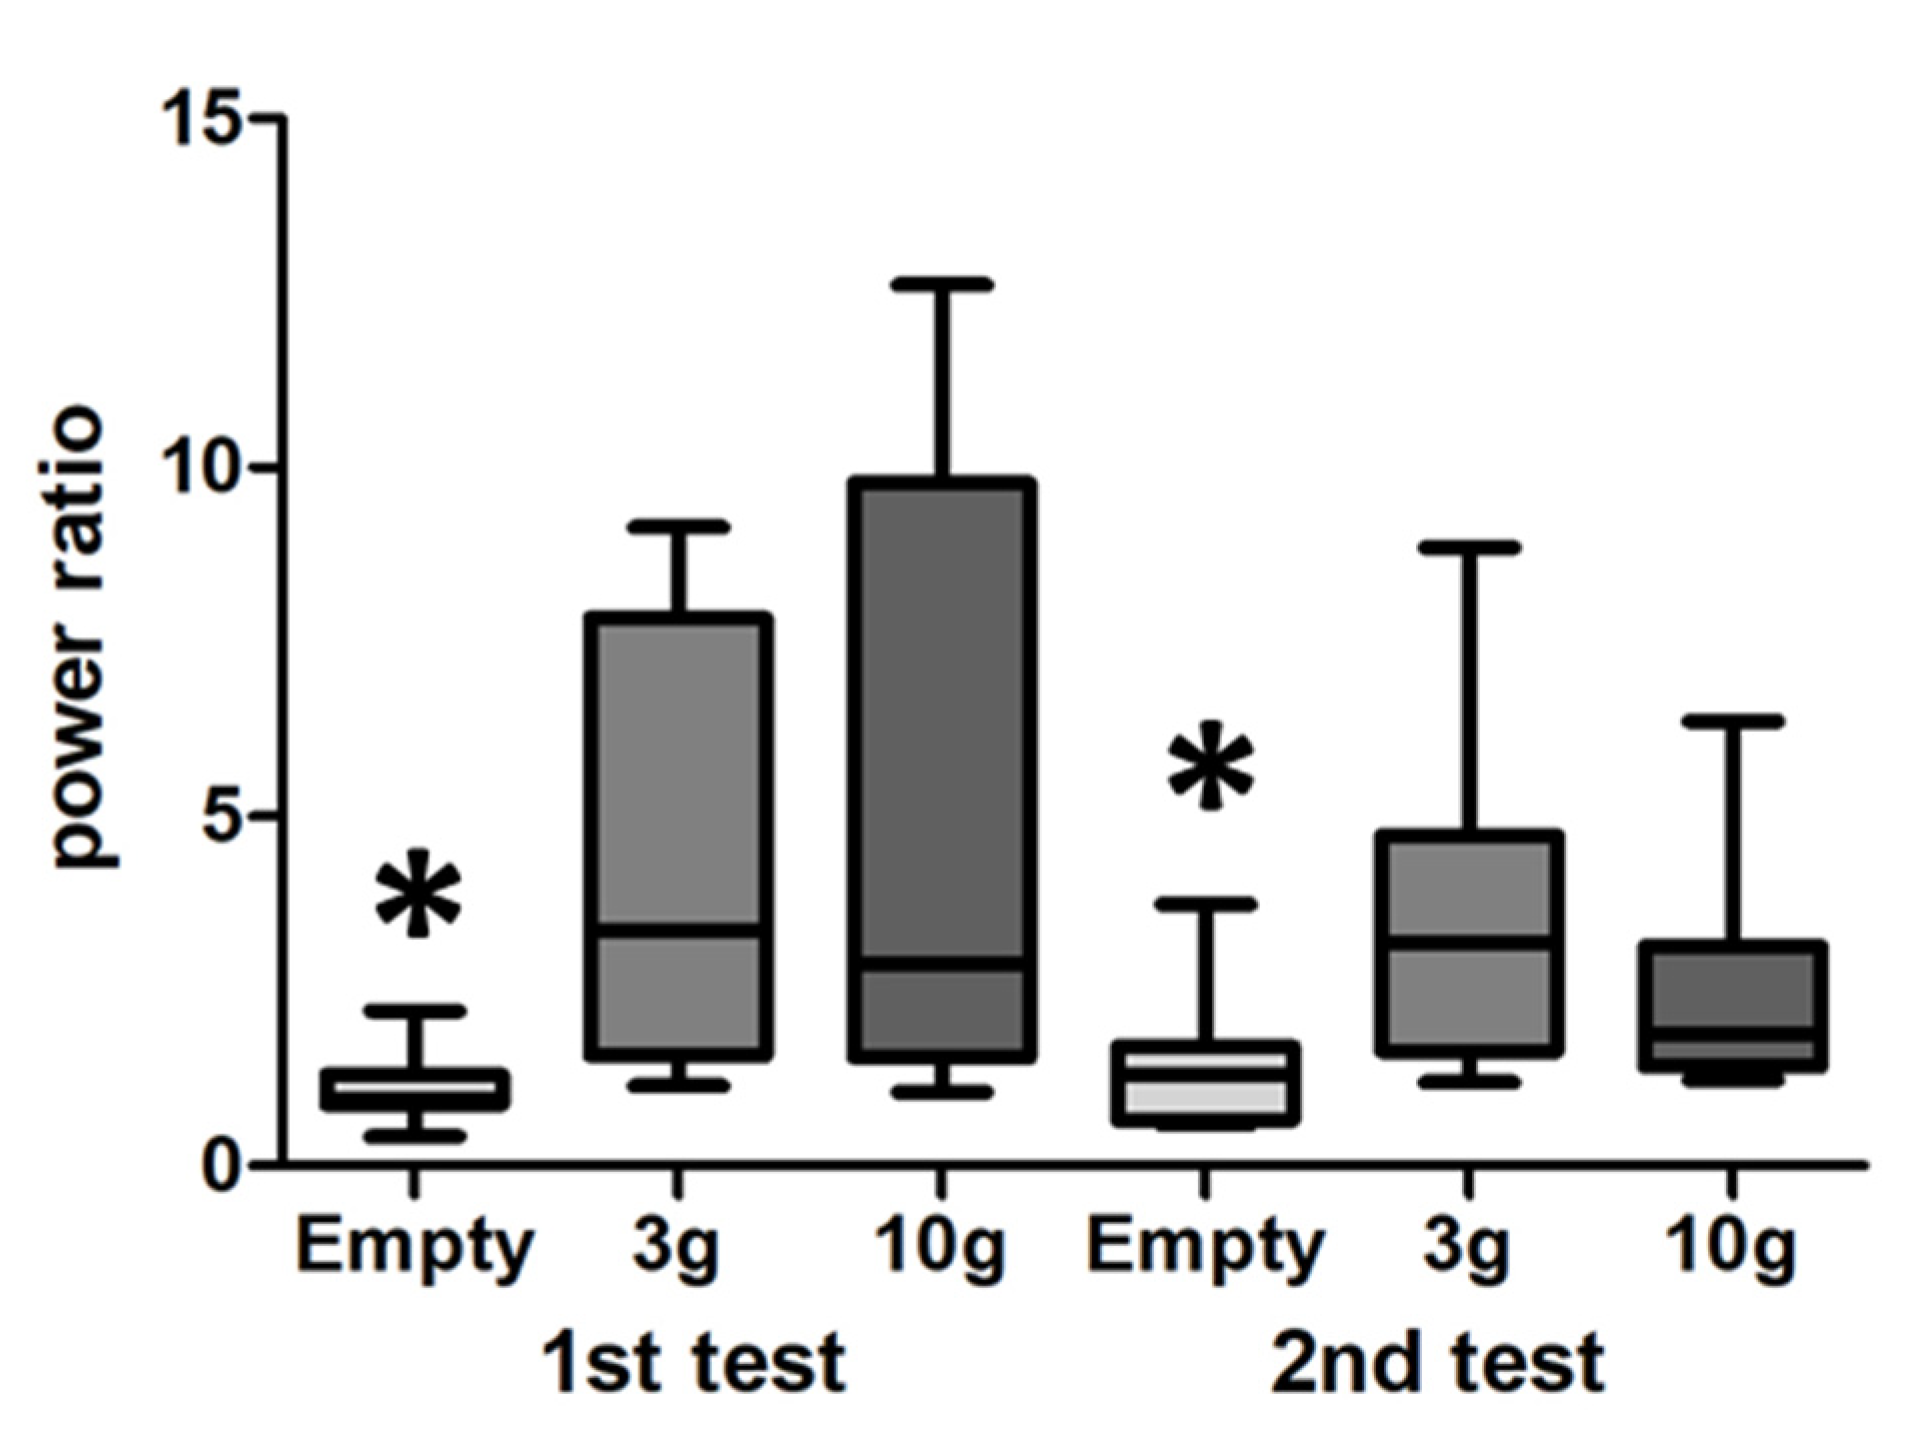
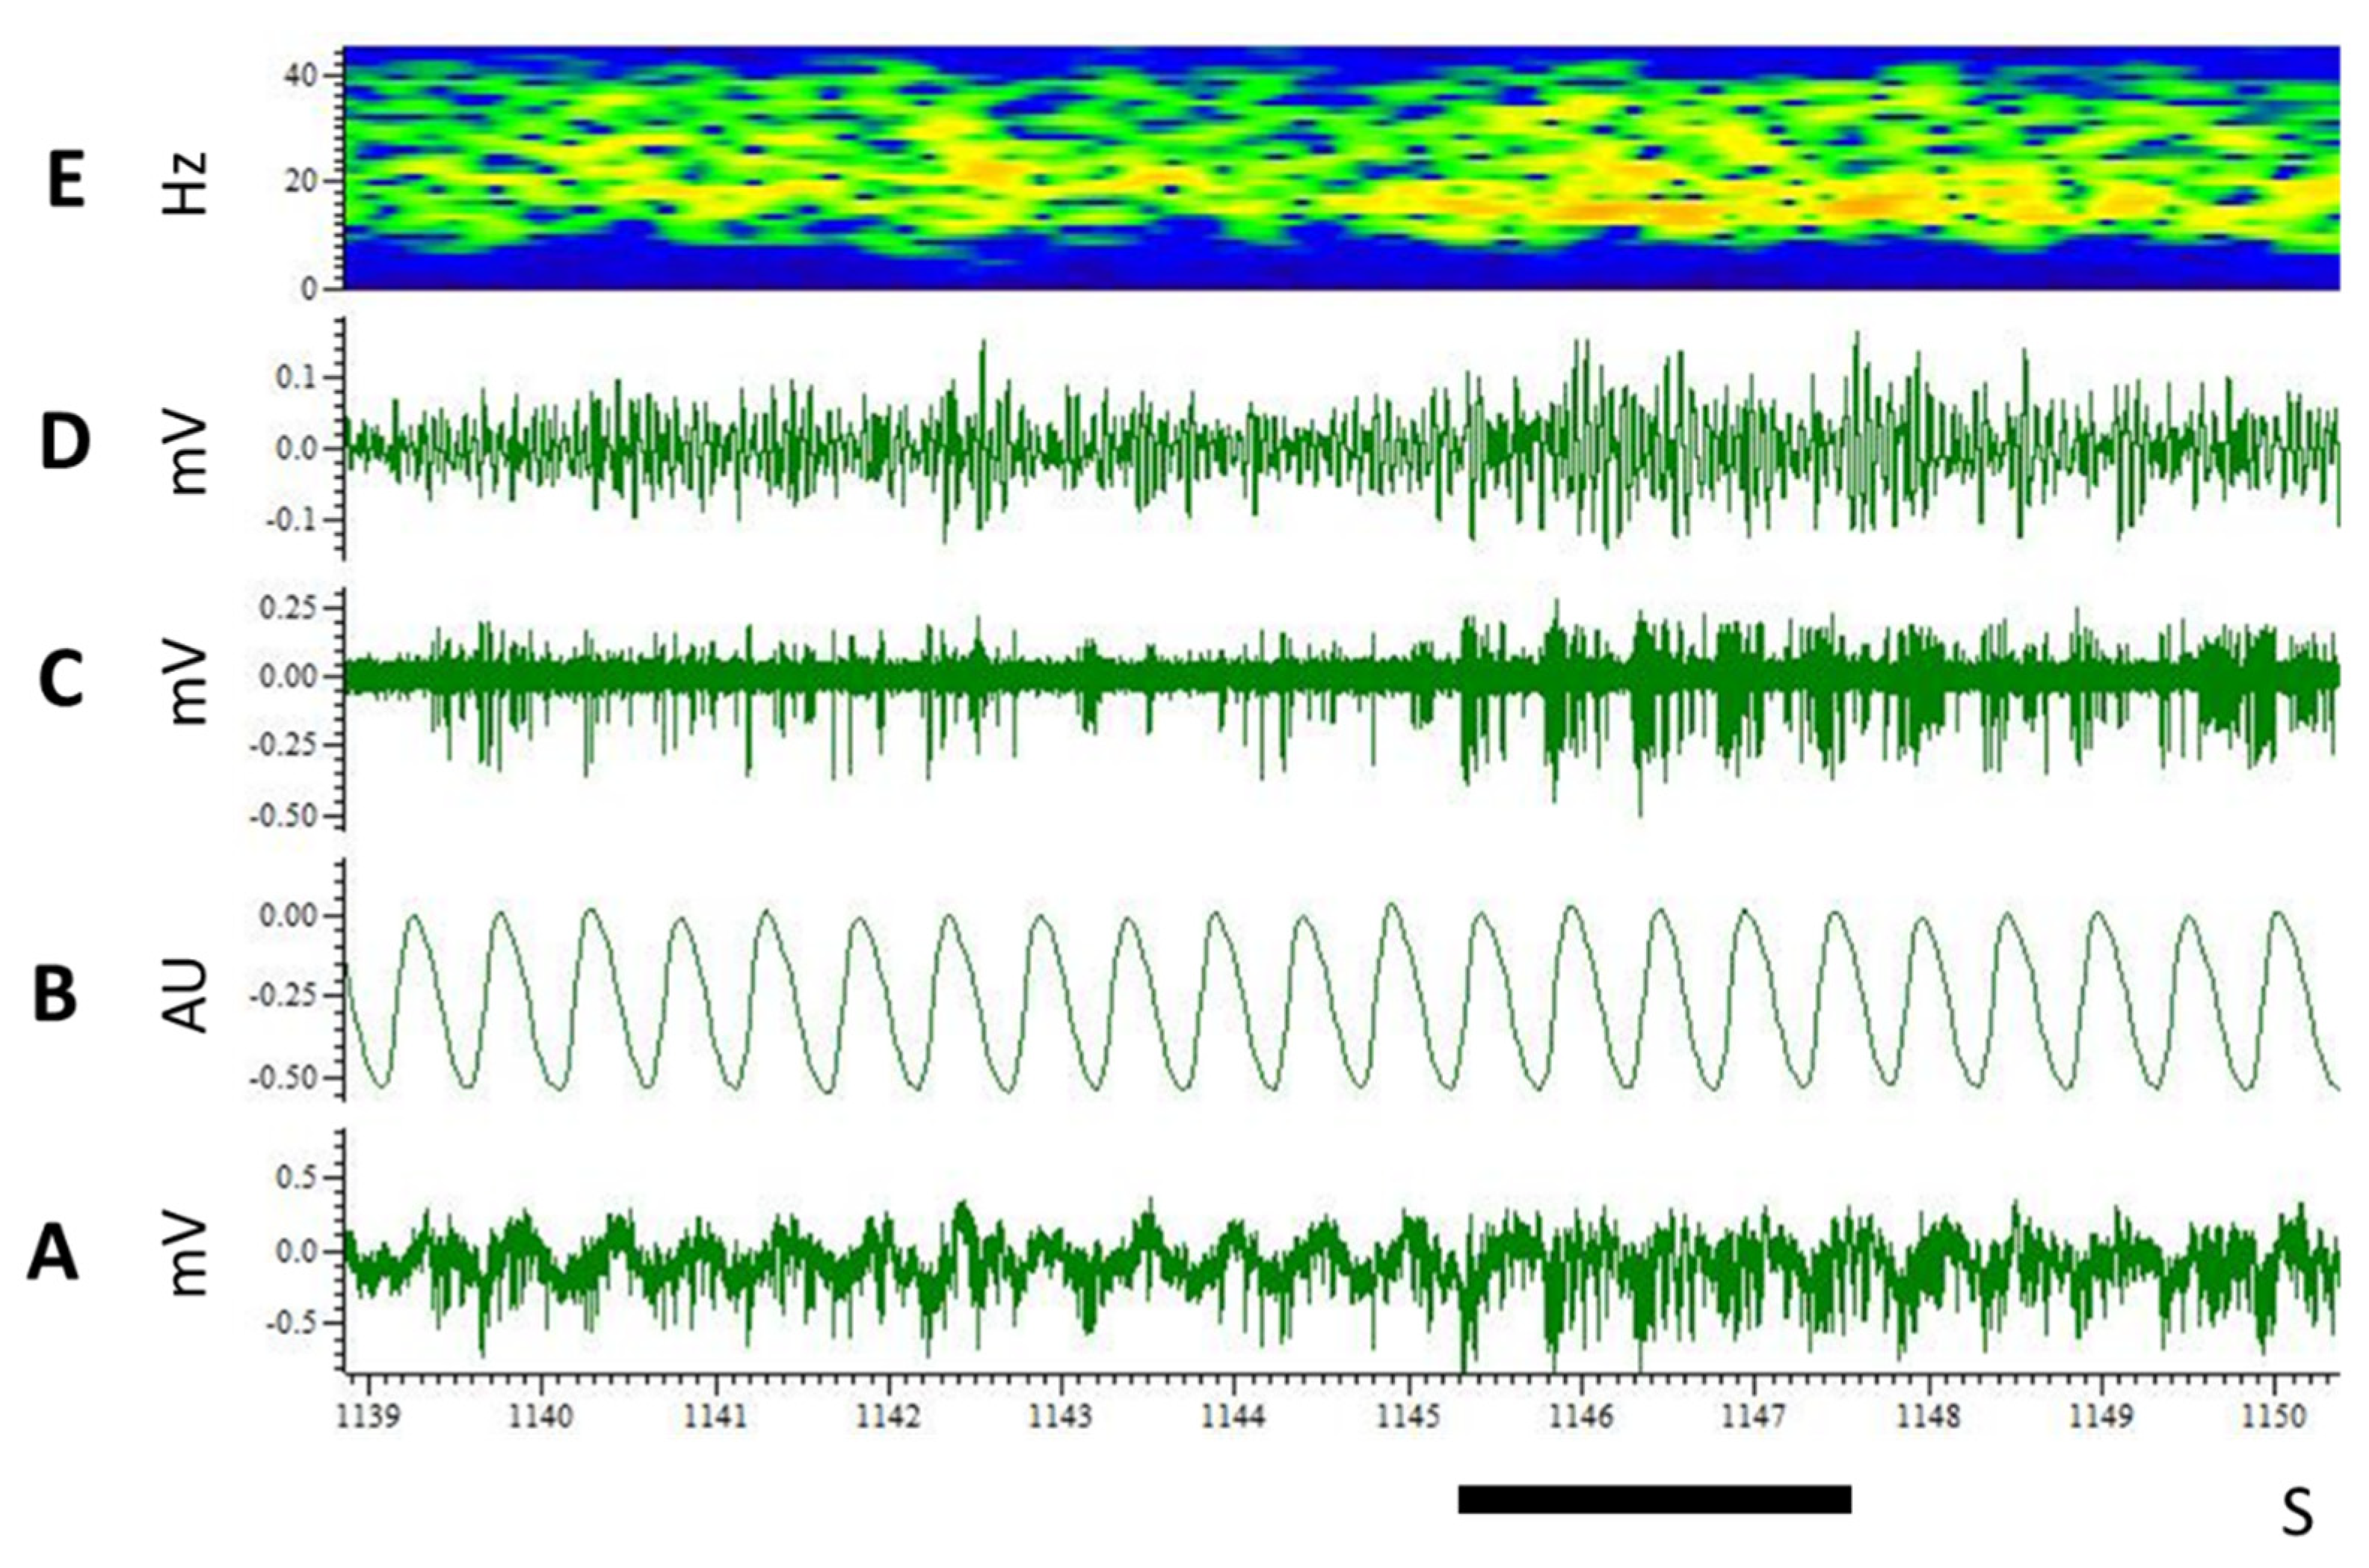
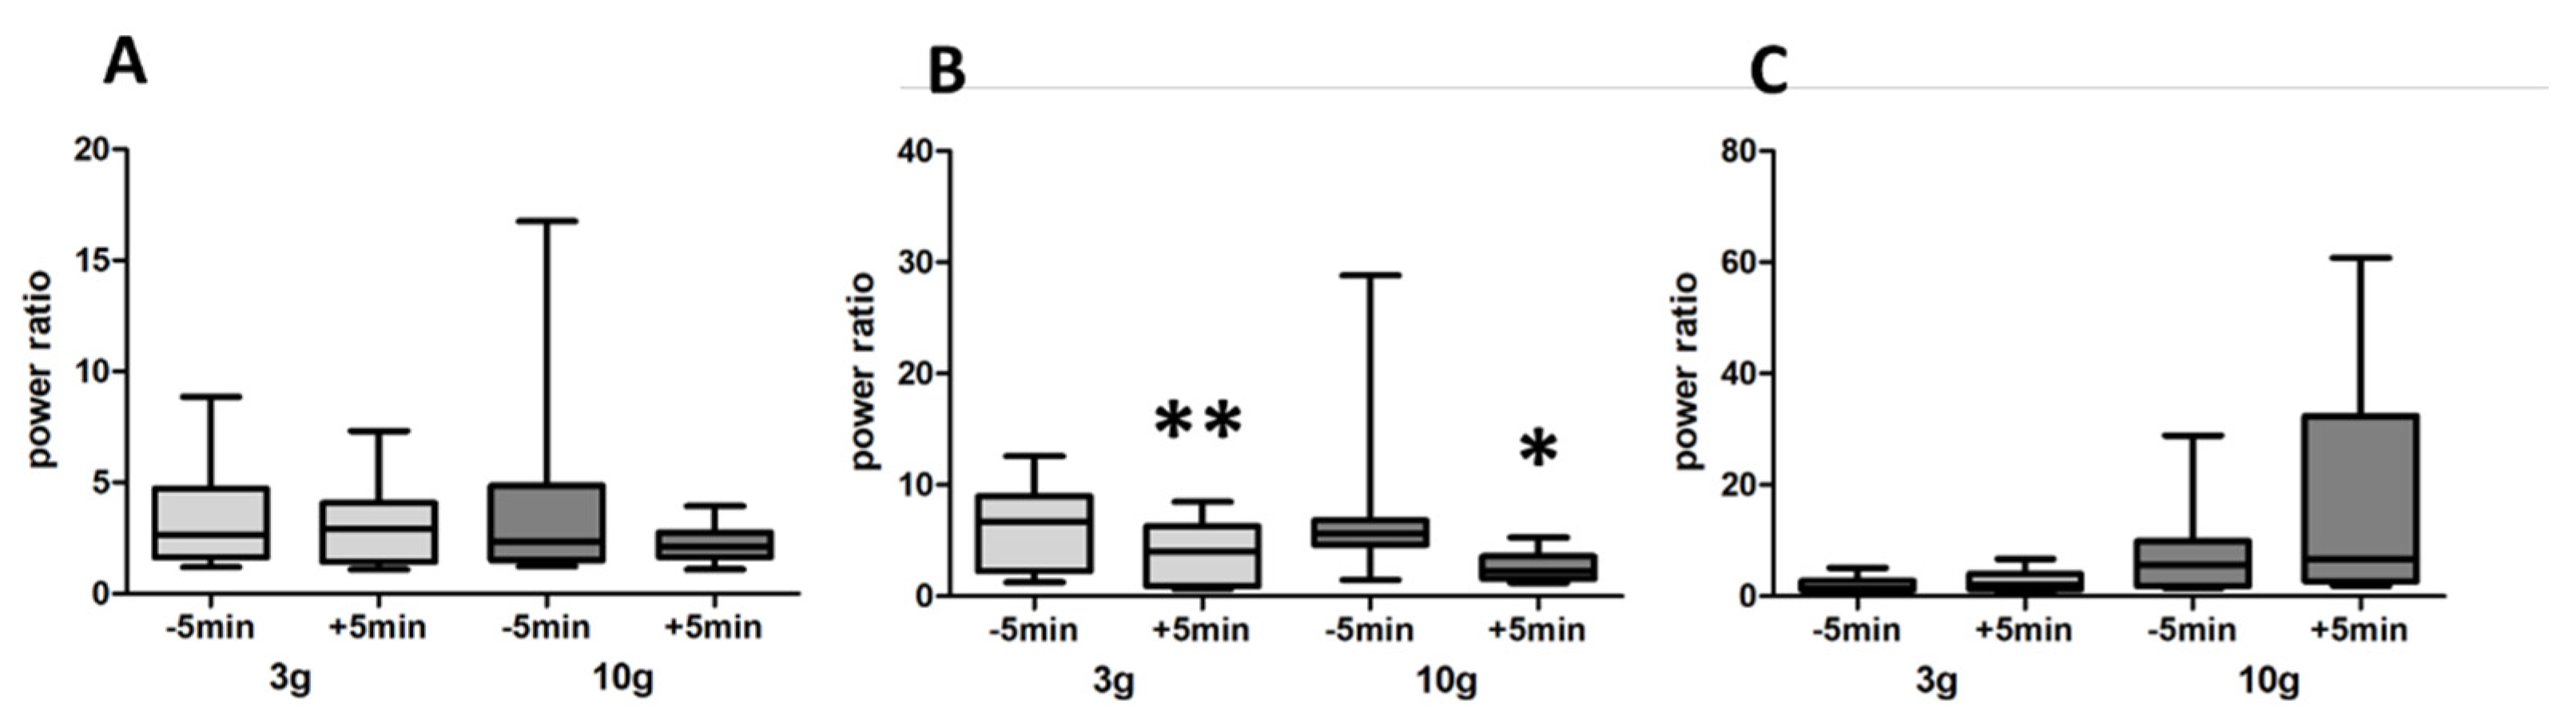
3.3. LFP
4. Discussion
5. Conclusions
Supplementary Materials
Author Contributions
Funding
Institutional Review Board Statement
Informed Consent Statement
Data Availability Statement
Acknowledgments
Conflicts of Interest
References
- Le Magnen, J. Role of dietary odour in the short-term control of intake in the white rat (first published in French in 1956). Appetite 1999, 33, 30–32. [Google Scholar] [CrossRef] [PubMed]
- Rolls, E.T. Taste, olfactory, and food texture processing in the brain, and the control of food intake. Physiol. Behav. 2005, 85, 45–56. [Google Scholar] [CrossRef] [PubMed]
- Oostindjer, M. The role of olfaction in feeding and foraging. Chapter 6. In Olfaction in Animal Behaviour and Welfare; Nielsen, B.L., Ed.; CAB International: Wallingford, UK, 2017; pp. 73–84. [Google Scholar]
- Aimé, P.; Palouzier-Paulignan, B.; Salem, R.; Al Koborssy, D.; Garcia, S.; Duchamp, C.; Romestaing, C.; Julliard, A.K. Modulation of olfactory sensitivity and glucose-sensing by the feeding state in obese Zucker rats. Front. Behav. Neurosci. 2014, 8, 326. [Google Scholar] [CrossRef] [PubMed] [Green Version]
- Wesson, D.W.; Wilson, D.A. Sniffing out the contributions of the olfactory tubercle to the sense of smell: Hedonics, sensory integration, and more? Neurosci. Biobehav. Rev. 2011, 35, 655–668. [Google Scholar] [CrossRef] [PubMed] [Green Version]
- Voorn, P.; Vanderschuren, L.J.M.J.; Groenewegen, H.J.; Robbins, T.W.; Pennartz, C.M.A. Putting a spin on the dorsal-ventral divide of the striatum. Trends Neurosci. 2004, 27, 468–474. [Google Scholar] [CrossRef] [PubMed]
- West, C.H.; Michael, R.P. Responses of units in the mesolimbic system to olfactory and somatosensory stimuli: Modulation of sensory input by ventral tegmental stimulation. Brain Res. 1990, 532, 307–316. [Google Scholar] [CrossRef]
- Setlow, B.; Schoenbaum, G.; Gallagher, M. Neural encoding in ventral striatum during olfactory discrimination learning. Neuron 2003, 38, 625–636. [Google Scholar] [CrossRef] [Green Version]
- Wesson, D.W.; Wilson, D.A. Smelling sounds: Olfactory-auditory sensory convergence in the olfactory tubercle. J. Neurosci. 2010, 30, 3013–3021. [Google Scholar] [CrossRef] [Green Version]
- Payton, P.A.; Wilson, D.A.; Wesson, D.W. Parallel odor processing by two anatomically distinct olfactory bulb target structures. PLoS ONE 2012, 7, e34926. [Google Scholar] [CrossRef]
- Rampin, O.; Bellier, C.; Maurin, Y. Electrophysiological responses of rat olfactory tubercle neurons to biologically relevant odours. Eur. J. Neurosci. 2012, 35, 97–105. [Google Scholar] [CrossRef]
- Millman, D.J.; Murthy, V.N. Rapid Learning of Odor-Value Association in the Olfactory Striatum. J. Neurosci. 2020, 40, 4335–4347. [Google Scholar] [CrossRef] [PubMed]
- Berridge, K.C.; Robinson, T.E. What is the role of dopamine in reward: Hedonic impact, reward learning, or incentive salience? Brain Res. Rev. 1998, 28, 309–369. [Google Scholar] [CrossRef]
- Volkow, N.D.; Wise, R.A.; Baler, R. The dopamine motive system: Implications for drug and food addiction. Nat. Rev. Neurosci. 2017, 18, 741–752. [Google Scholar] [CrossRef] [PubMed]
- Schultz, W. Predictive reward signal of dopamine neurons. J. Neurophysiol. 1998, 80, 1–27. [Google Scholar] [CrossRef] [PubMed]
- Ikemoto, S. Dopamine reward circuitry: Two projection systems from the ventral midbrain to the nucleus accumbens-olfactory tubercle complex. Brain Res. Rev. 2007, 56, 27–78. [Google Scholar] [CrossRef] [PubMed] [Green Version]
- Cansler, H.L.; Wright, K.N.; Stetzik, L.A.; Wesson, D.W. Neurochemical organization of the ventral striatum’s olfactory tubercle. J. Neurochem. 2020, 152, 425–448. [Google Scholar] [CrossRef] [PubMed] [Green Version]
- Zhang, Z.; Liu, Q.; Wen, P.; Zhang, J.; Rao, X.; Zhou, Z.; Zhang, H.; He, X.; Li, J.; Zhou, Z.; et al. Activation of the dopaminergic pathway from VTA to the medial olfactory tubercle generates odor-preference and reward. Elife 2017, 6, e25423. [Google Scholar] [CrossRef] [Green Version]
- Phillips, A.G.; Atkinson, L.J.; Blackburn, J.R.; Blaha, C.D. Increased extracellular dopamine in the nucleus accumbens of the rat elicited by a conditional stimulus for food: An electrochemical study. Can. J. Physiol. Pharmacol. 1993, 71, 387–393. [Google Scholar] [CrossRef]
- Ahn, S.; Phillips, A.G. Dopaminergic correlates of sensory-specific satiety in the medial prefrontal cortex and nucleus accumbens of the rat. J. Neurosci. 1999, 19, RC29. [Google Scholar] [CrossRef] [Green Version]
- Wilson, C.; Nomikos, G.G.; Collu, M.; Fibiger, H.C. Dopaminergic correlates of motivated behavior: Importance of drive. J. Neurosci. 1995, 15, 5169–5178. [Google Scholar] [CrossRef]
- Zhu, X.; Ottenheimer, D.; DiLeone, R.J. Activity of D1/2 Receptor Expressing Neurons in the Nucleus Accumbens Regulates Running, Locomotion, and Food Intake. Front. Behav. Neurosci. 2016, 10, 66. [Google Scholar] [CrossRef] [PubMed] [Green Version]
- Ferrario, C.R.; Labouèbe, G.; Liu, S.; Nieh, E.H.; Routh, V.H.; Xu, S.; O’Connor, E.C. Homeostasis Meets Motivation in the Battle to Control Food Intake. J. Neurosci. 2016, 36, 11469–11481. [Google Scholar] [CrossRef] [PubMed]
- Han, J.E.; Frasnelli, J.; Zeighami, Y.; Larcher, K.; Boyle, J.; McConnell, T.; Malik, S.; Jones-Gotman, M.; Dagher, A. Ghrelin Enhances Food Odor Conditioning in Healthy Humans: An fMRI Study. Cell Rep. 2018, 25, 2643–2652. [Google Scholar] [CrossRef] [PubMed] [Green Version]
- Paxinos, G.; Watson, C. The Rat Brain in Stereotaxic Coordinates, 6th ed.; Elsevier: Amsterdam, The Netherlands, 2007. [Google Scholar]
- Andrey, P.; Maurin, Y. Free-D: An integrated environment for three-dimensional reconstruction from serial sections. J. Neurosci. Methods 2005, 145, 233–244. [Google Scholar] [CrossRef]
- Maschino, E.; Maurin, Y.; Andrey, P. Joint registration and averaging of multiple 3D anatomical surface models. Comput. Vis. Image Underst. 2006, 101, 16–30. [Google Scholar] [CrossRef]
- Biot, E.; Crowell, E.; Burguet, J.; Höfte, H.; Vernhettes, S.; Andrey, P. Strategy and software for the statistical spatial analysis of 3D intracellular distributions. Plant J. 2016, 87, 230–242. [Google Scholar] [CrossRef] [Green Version]
- R Core Team. R: A Language and Environment for Statistical Computing; R Foundation for Statistical Computing: Vienna, Austria, 2020; Available online: https://www.R-project.org/ (accessed on 3 February 2021).
- Oettl, L.L.; Scheller, M.; Filosa, C.; Wieland, S.; Haag, F.; Loeb, C.; Durstewitz, D.; Shusterman, R.; Russo, E.; Kelsch, W. Phasic dopamine reinforces distinct striatal stimulus encoding in the olfactory tubercle driving dopaminergic reward prediction. Nat. Commun. 2020, 11, 3460. [Google Scholar] [CrossRef]
- Gadziola, M.A.; Tylicki, K.A.; Christian, D.L.; Wesson, D.W. The olfactory tubercle encodes odor valence in behaving mice. J. Neurosci. 2015, 35, 4515–4527. [Google Scholar] [CrossRef] [Green Version]
- Midroit, M.; Chalençon, L.; Renier, N.; Milton, A.; Thevenet, M.; Sacquet, J.; Breton, M.; Forest, J.; Noury, N.; Richard, M.; et al. Neural processing of the reward value of pleasant odorants. Curr. Biol. 2021, 31, 1592–1605. [Google Scholar] [CrossRef]
- Gadziola, M.A.; Stetzik, L.A.; Wright, K.N.; Milton, A.J.; Arakawa, K.; Del Mar Cortijo, M.; Wesson, D.W. A Neural System that Represents the Association of Odors with Rewarded Outcomes and Promotes Behavioral Engagement. Cell Rep. 2020, 32, 107919. [Google Scholar] [CrossRef]
- Shusterman, R.; Smear, M.C.; Koulakov, A.A.; Dmitry Rinberg, D. Precise olfactory responses tile the sniff cycle. Nat. Neurosci. 2011, 14, 1039–1044. [Google Scholar] [CrossRef] [PubMed]
- Wieland, S.; Schindler, S.; Huber, C.; Köhr, G.; Oswald, M.J.; Kelsch, W. Phasic Dopamine Modifies Sensory-Driven Output of Striatal Neurons through Synaptic Plasticity. J. Neurosci. 2015, 35, 9946–9956. [Google Scholar] [CrossRef] [PubMed] [Green Version]
- Carlson, K.S.; Gadziola, M.A.; Dauster, E.S.; Wesson, D.W. Selective Attention Controls Olfactory Decisions and the Neural Encoding of Odors. Curr. Biol. 2018, 28, 2195–2205. [Google Scholar] [CrossRef] [PubMed] [Green Version]
- Murata, K.; Kanno, M.; Ieki, N.; Mori, K.; Yamaguchi, M. Mapping of Learned Odor-Induced Motivated Behaviors in the Mouse Olfactory Tubercle. J. Neurosci. 2015, 35, 10581–10599. [Google Scholar] [CrossRef] [PubMed] [Green Version]
- Zhao, F.; Wang, X.; Zariwala, H.A.; Uslaner, J.M.; Houghton, A.K.; Evelhoch, J.L.; Williams, D.S.; Winkelmann, C.T. fMRI study of olfaction in the olfactory bulb and high olfactory structures of rats: Insight into their roles in habituation. Neuroimage 2016, 127, 445–455. [Google Scholar] [CrossRef] [PubMed]
- Ikemoto, S.; Qin, M.; Liu, Z.H. The functional divide for primary reinforcement of D-amphetamine lies between the medial and lateral ventral striatum: Is the division of the accumbens core, shell, and olfactory tubercle valid? J. Neurosci. 2005, 25, 5061–5065. [Google Scholar] [CrossRef] [PubMed]
- Millhouse, O.E.; Heimer, L. Cell configurations in the olfactory tubercle of the rat. J. Comp. Neurol. 1984, 228, 571–597. [Google Scholar] [CrossRef]
- Castro, D.C.; Cole, S.L.; Berridge, K.C. Lateral hypothalamus, nucleus accumbens, and ventral pallidum roles in eating and hunger: Interactions between homeostatic and reward circuitry. Front. Syst. Neurosci. 2015, 9, 90. [Google Scholar] [CrossRef] [Green Version]
- Lledo, P.M.; Gheusi, G.; Jean-Didier Vincent, J.D. Information processing in the mammalian olfactory system. Physiol. Rev. 2005, 85, 281–317. [Google Scholar] [CrossRef] [Green Version]
- Laurent, G.; Davidowitz, H. Encoding of olfactory information with oscillating neural assemblies. Science 1994, 265, 1872–1875. [Google Scholar] [CrossRef]
- Kay, L.M. Circuit oscillations in odor perception and memory. Prog. Brain Res. 2014, 208, 223–251. [Google Scholar] [CrossRef] [PubMed]
- Zibrowski, E.M.; Hoh, T.E.; Vanderwolf, C.H. Fast wave activity in the rat rhinencephalon: Elicitation by the odors of phytochemicals, organic solvents, and a rodent predator. Brain Res. 1998, 800, 207–215. [Google Scholar] [CrossRef]
- Baik, J.H. Dopamine signaling in reward-related behaviors. Front. Neural Circuits 2013, 7, 152. [Google Scholar] [CrossRef] [PubMed] [Green Version]
- Morales, I.; Berridge, K.C. ‘Liking’ and ‘wanting’ in eating and food reward: Brain mechanisms and clinical implications. Physiol. Behav. 2020, 227, 113–152. [Google Scholar] [CrossRef]
- Koob, G.F.; Balcom, G.J.; Meyerhoff, J.L. Dopamine and norepinephrine levels in the nucleus accumbens, olfactory tubercle and corpus striatum following lesions in the ventral tegmental area. Brain Res. 1975, 94, 45–55. [Google Scholar] [CrossRef]
- Fallon, J.H.; Moore, R.Y. Catecholamine innervation of the basal forebrain. IV. Topography of the dopamine projection to the basal forebrain and neostriatum. J. Comp. Neurol. 1978, 180, 545–580. [Google Scholar] [CrossRef]
- Mansour, A.; Meador-Woodruff, J.H.; Bunzow, J.R.; Civelli, O.; Akil, H.; Watson, S.J. Localization of dopamine D2 receptor mRNA and D1 and D2 receptor binding in the rat brain and pituitary: An in-situ hybridization-receptor autoradiographic analysis. J. Neurosci. 1990, 10, 2587–2600. [Google Scholar] [CrossRef] [Green Version]
- Murata, K.; Kinoshita, T.; Fukazawa, Y.; Kobayashi, K.; Yamanaka, A.; Hikida, T.; Manabe, H.; Yamaguchi, M. Opposing Roles of Dopamine Receptor D1- and D2-Expressing Neurons in the Anteromedial Olfactory Tubercle in Acquisition of Place Preference in Mice. Front. Behav. Neurosci. 2019, 13, 50. [Google Scholar] [CrossRef] [Green Version]
- Naleid, A.M.; Grace, M.K.; Cummings, D.E.; Levine, A.S. Ghrelin induces feeding in the mesolimbic reward pathway between the ventral tegmental area and the nucleus accumbens. Peptides 2005, 26, 2274–2279. [Google Scholar] [CrossRef]
- Anand, B.K.; Brobeck, J.R. Localization of a “feeding center” in the hypothalamus of the rat. Proc. Soc. Exp. Biol. Med. 1951, 77, 323–324. [Google Scholar] [CrossRef]
- Kühn, A.A.; Kupsch, A.; Schneider, G.H.; Brown, P. Reduction in subthalamic 8-35 Hz oscillatory activity correlates with clinical improvement in Parkinson’s disease. Eur. J. Neurosci. 2006, 23, 1956–1960. [Google Scholar] [CrossRef] [PubMed]
- Schwerdt, H.N.; Amemori, K.; Gibson, D.J.; Stanwicks, L.L.; Yoshida, T.; Bichot, N.P.; Amemori, S.; Desimone, R.; Langer, R.; Cima, M.J.; et al. Dopamine and beta-band oscillations differentially link to striatal value and motor control. Sci. Adv. 2020, 6, eabb9226. [Google Scholar] [CrossRef] [PubMed]
- Inokuchi, A.; Mooney, K.E.; Snow, J.B., Jr. Dopaminergic modulation of bulbofugal projections in the rat olfactory tubercle. Am. J. Otolaryngol. 1987, 8, 214–218. [Google Scholar] [CrossRef]
- Wilson, D.A.; Sullivan, R.M. The D2 antagonist spiperone mimics the effects of olfactory deprivation on mitral/tufted cell odor response patterns. J. Neurosci. 1995, 15, 5574–5581. [Google Scholar] [CrossRef] [Green Version]
- Berke, J.D. Fast oscillations in cortical-striatal networks switch frequency following rewarding events and stimulant drugs. Eur. J. Neurosci. 2009, 30, 848–859. [Google Scholar] [CrossRef] [PubMed] [Green Version]
- Doty, R.L.; Risser, J.M. Influence of the D-2 dopamine receptor agonist quinpirole on the odor detection performance of rats before and after spiperone administration. Psychopharmacology 1989, 98, 310–315. [Google Scholar] [CrossRef]
- Yue, E.L.; Cleland, T.A.; Pavlis, M.; Linster, C. Opposing effects of D1 and D2 receptor activation on odor discrimination learning. Behav. Neurosci. 2004, 118, 184–190. [Google Scholar] [CrossRef]
- Escanilla, O.; Yuhas, C.; Marzan, D.; Linster, C. Dopaminergic modulation of olfactory bulb processing affects odor discrimination learning in rats. Behav. Neurosci. 2009, 123, 828–833. [Google Scholar] [CrossRef] [Green Version]
- Murata, K. Hypothetical Roles of the Olfactory Tubercle in Odor-Guided Eating Behavior. Front. Neural Circuits 2020, 14, 577880. [Google Scholar] [CrossRef]
- Bragulat, V.; Dzemidzic, M.; Bruno, C.; Cox, C.A.; Talavage, T.; Considine, R.V.; Kareken, D.A. Food-related odor probes of brain reward circuits during hunger: A pilot FMRI study. Obesity 2010, 18, 1566–1571. [Google Scholar] [CrossRef]
- Han, P.; Roitzsch, C.; Horstmann, A.; Pössel, M.; Hummel, T. Increased Brain Reward Responsivity to Food-Related Odors in Obesity. Obesity 2021, 29, 1138–1145. [Google Scholar] [CrossRef] [PubMed]


Publisher’s Note: MDPI stays neutral with regard to jurisdictional claims in published maps and institutional affiliations. |
© 2022 by the authors. Licensee MDPI, Basel, Switzerland. This article is an open access article distributed under the terms and conditions of the Creative Commons Attribution (CC BY) license (https://creativecommons.org/licenses/by/4.0/).
Share and Cite
Rampin, O.; Saint Albin Deliot, A.; Ouali, C.; Burguet, J.; Gry, E.; Champeil Potokar, G.; Jérôme, N.; Davidenko, O.; Darcel, N.; Bombail, V.; et al. Dopamine Modulates the Processing of Food Odour in the Ventral Striatum. Biomedicines 2022, 10, 1126. https://doi.org/10.3390/biomedicines10051126
Rampin O, Saint Albin Deliot A, Ouali C, Burguet J, Gry E, Champeil Potokar G, Jérôme N, Davidenko O, Darcel N, Bombail V, et al. Dopamine Modulates the Processing of Food Odour in the Ventral Striatum. Biomedicines. 2022; 10(5):1126. https://doi.org/10.3390/biomedicines10051126
Chicago/Turabian StyleRampin, Olivier, Audrey Saint Albin Deliot, Christian Ouali, Jasmine Burguet, Elisa Gry, Gaelle Champeil Potokar, Nathalie Jérôme, Olga Davidenko, Nicolas Darcel, Vincent Bombail, and et al. 2022. "Dopamine Modulates the Processing of Food Odour in the Ventral Striatum" Biomedicines 10, no. 5: 1126. https://doi.org/10.3390/biomedicines10051126