
Toxic Exposure to Endocrine Disruptors Worsens Parkinson’s Disease Progression through NRF2/HO-1 Alteration

 , , , , , , , , and
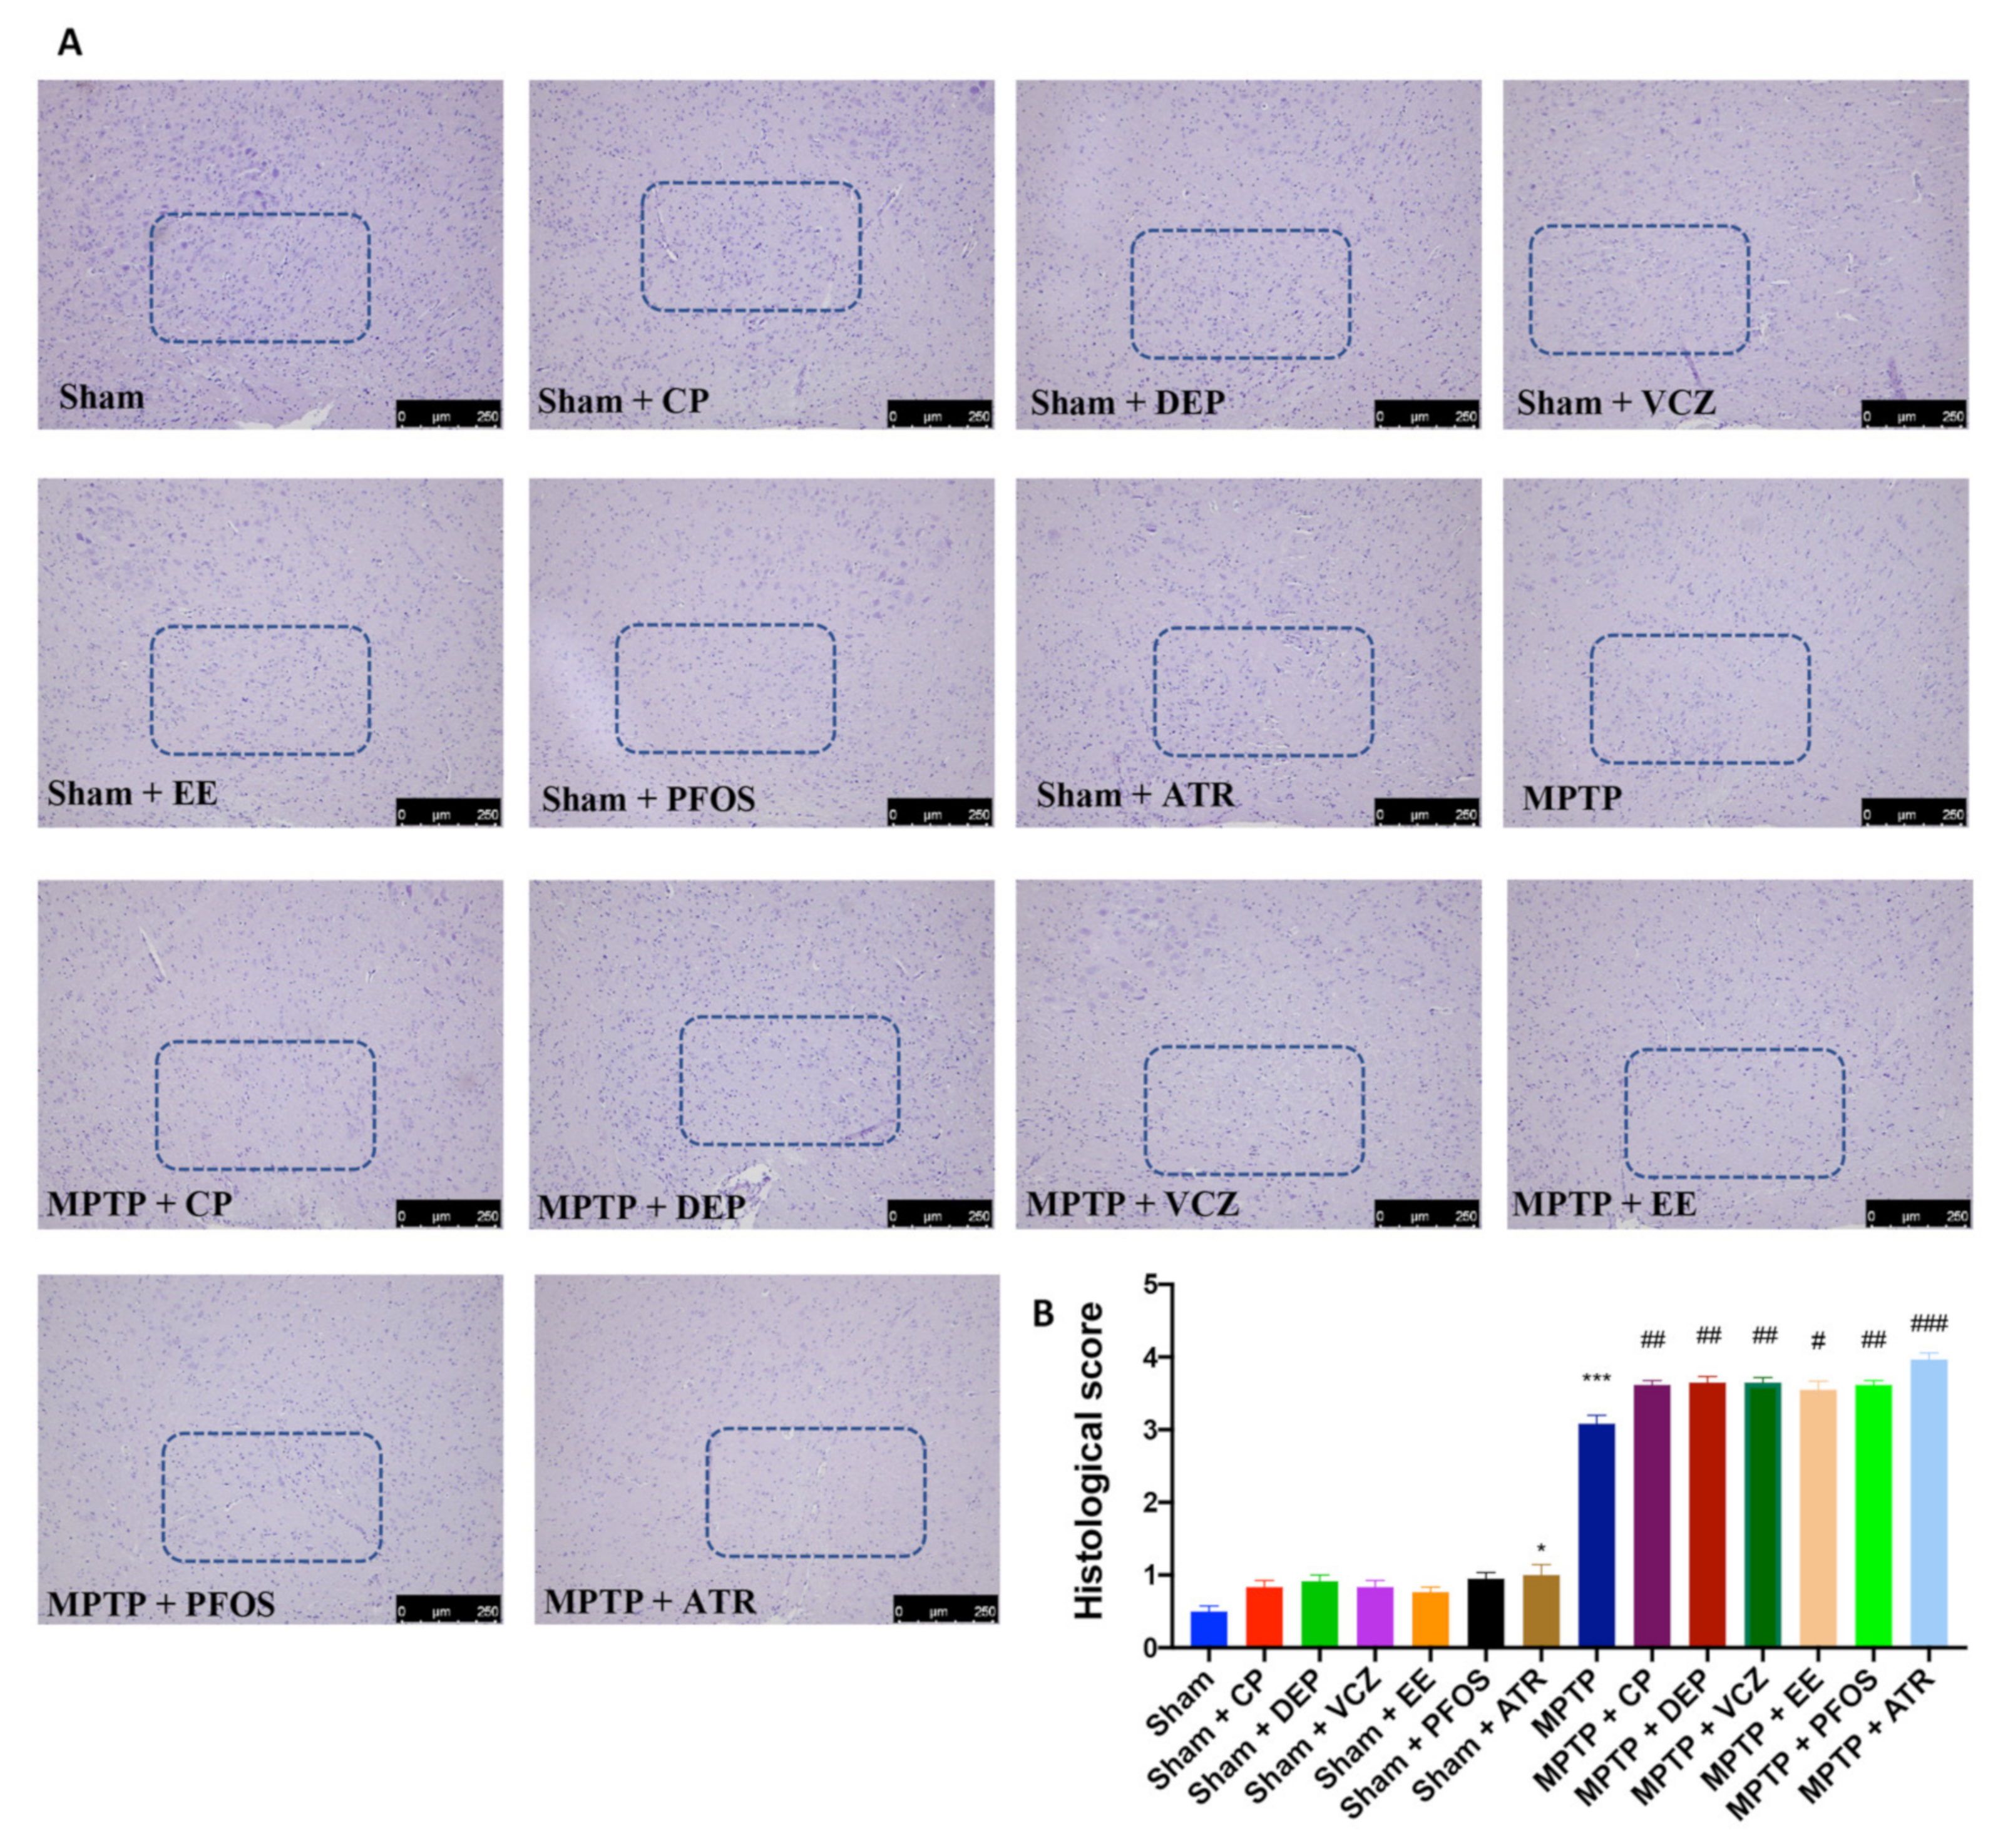
Abstract
:1. Introduction
2. Materials and Methods
2.1. Animals
2.2. MPTP-Induced PD and Treatments
2.3. Experimental Groups
- -
- MPTP: mice were subjected to the above-described PD induction;
- -
- MPTP + CP: same as the MPTP group, and CP (15 mg/kg) was administered;
- -
- MPTP + DEP: same as the MPTP group, and DEP (2 μg/mL) was administered;
- -
- MPTP + VCZ: same as the MPTP group, and VCZ (100 mg/kg) was administered;
- -
- MPTP + EE: same as the MPTP group, and EE (1 μg/kg) was administered;
- -
- MPTP + PFOS: same as the MPTP group, and PFOS (10 mg/kg) was administered;
- -
- MPTP + ATR: same as the MPTP group, and ATR (25 mg/kg) was administered;
- -
- Sham groups = only saline solution was administered i.p. during the 1st day, such as how the MPTP protocol and vehicle or CP, or DEP or VLZ, or EE or PFOS or ATR were administered for 7 days.
2.4. Histological Analysis
2.5. Immunohistochemical Analysis of TH and α-syn
2.6. Western Blot Analysis of TH, DAT, α-syn, GFAP, Iba-1, Nrf-2, Heme Oxigenase-1 (HO-1) and Neuronal Nitric Oxide Synthase (nNOS), p-JNK, p-ERK 1/2 and p-p38
2.7. Enzyme-Linked Immunosorbent Assay (ELISA)
2.8. Measurement of ROS Formation
2.9. Evaluation of Lipid Peroxidation
2.10. Nitrite/Nitrate Assay
2.11. Behavioral Test
2.11.1. Pole Test (PT)
2.11.2. Rotarod Test (RT)
2.11.3. Catalepsy Test
2.11.4. Elevated Plus-Maze Test (EPM)
2.11.5. Open Field Test (OF)
2.11.6. Barnes Maze Test (BM)
2.12. Materials
2.13. Statistical Evaluation
3. Results
3.1. Impact of EDs Exposure on Histopathological Alteration in Midbrain
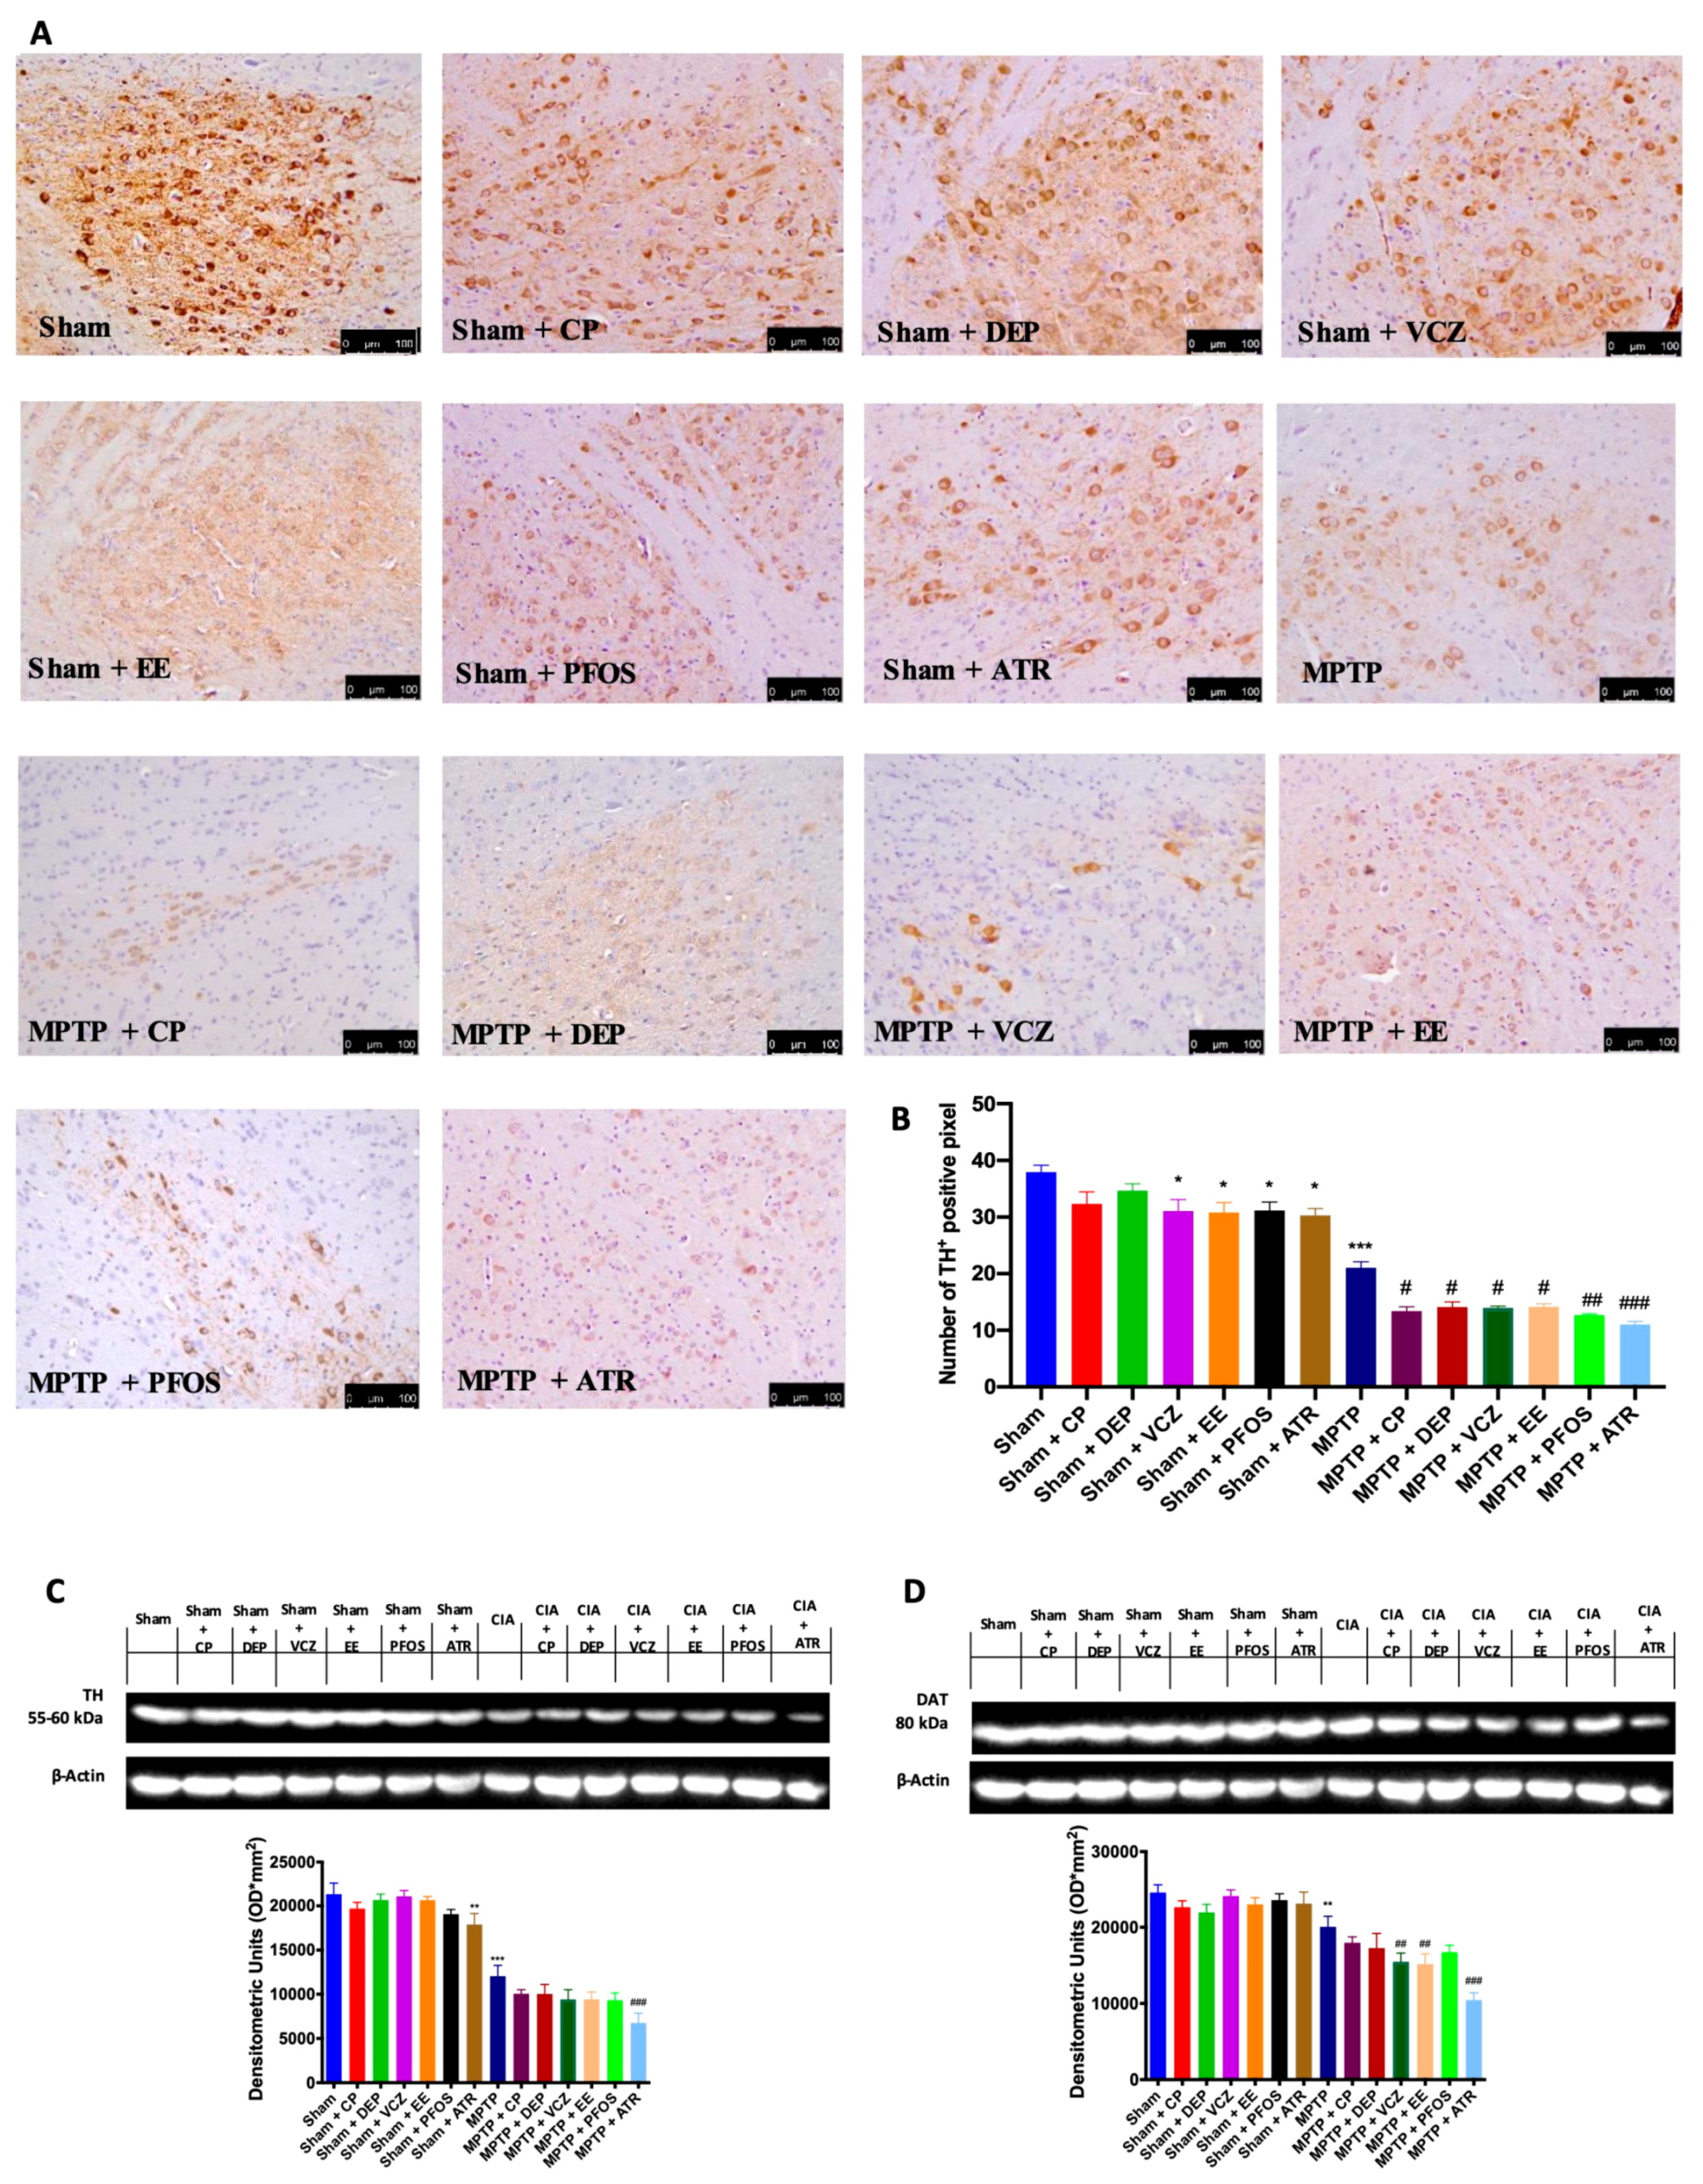
3.2. Impact of EDs Exposure on DA Metabolism-Related Markers
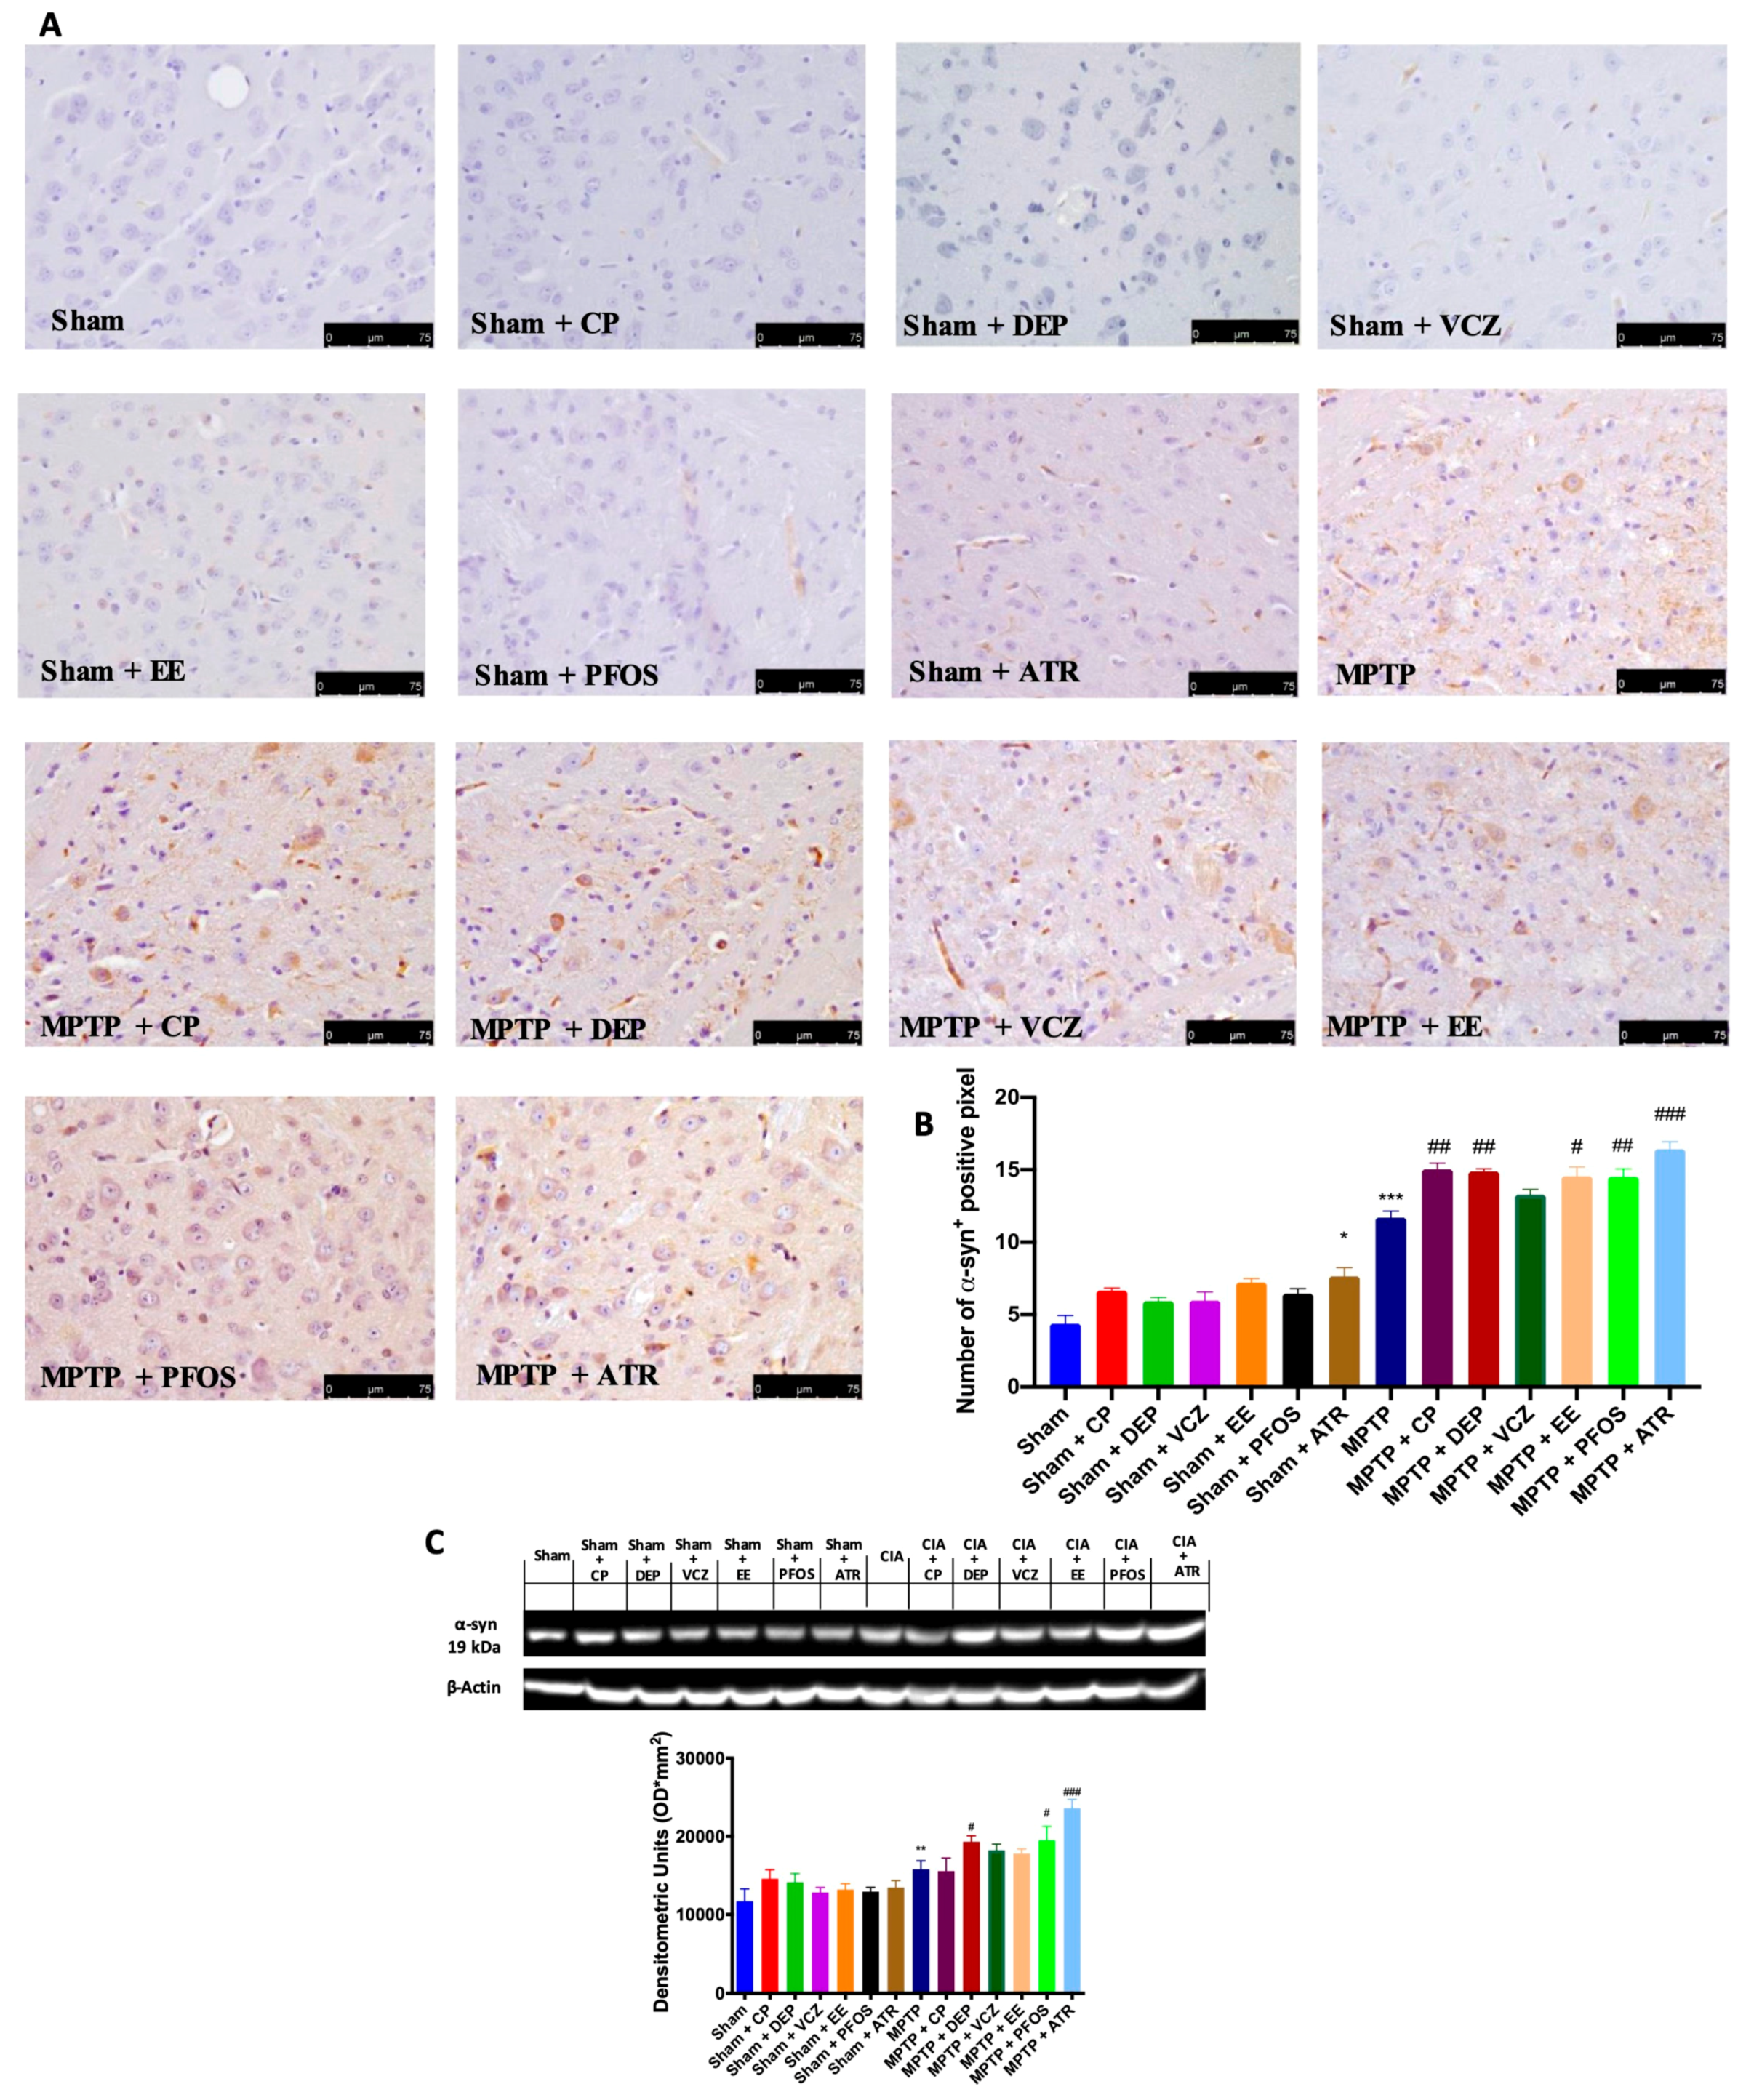
3.3. Impact of EDs Exposure on Endogenous Expression of α-Synuclein (α-Syn)
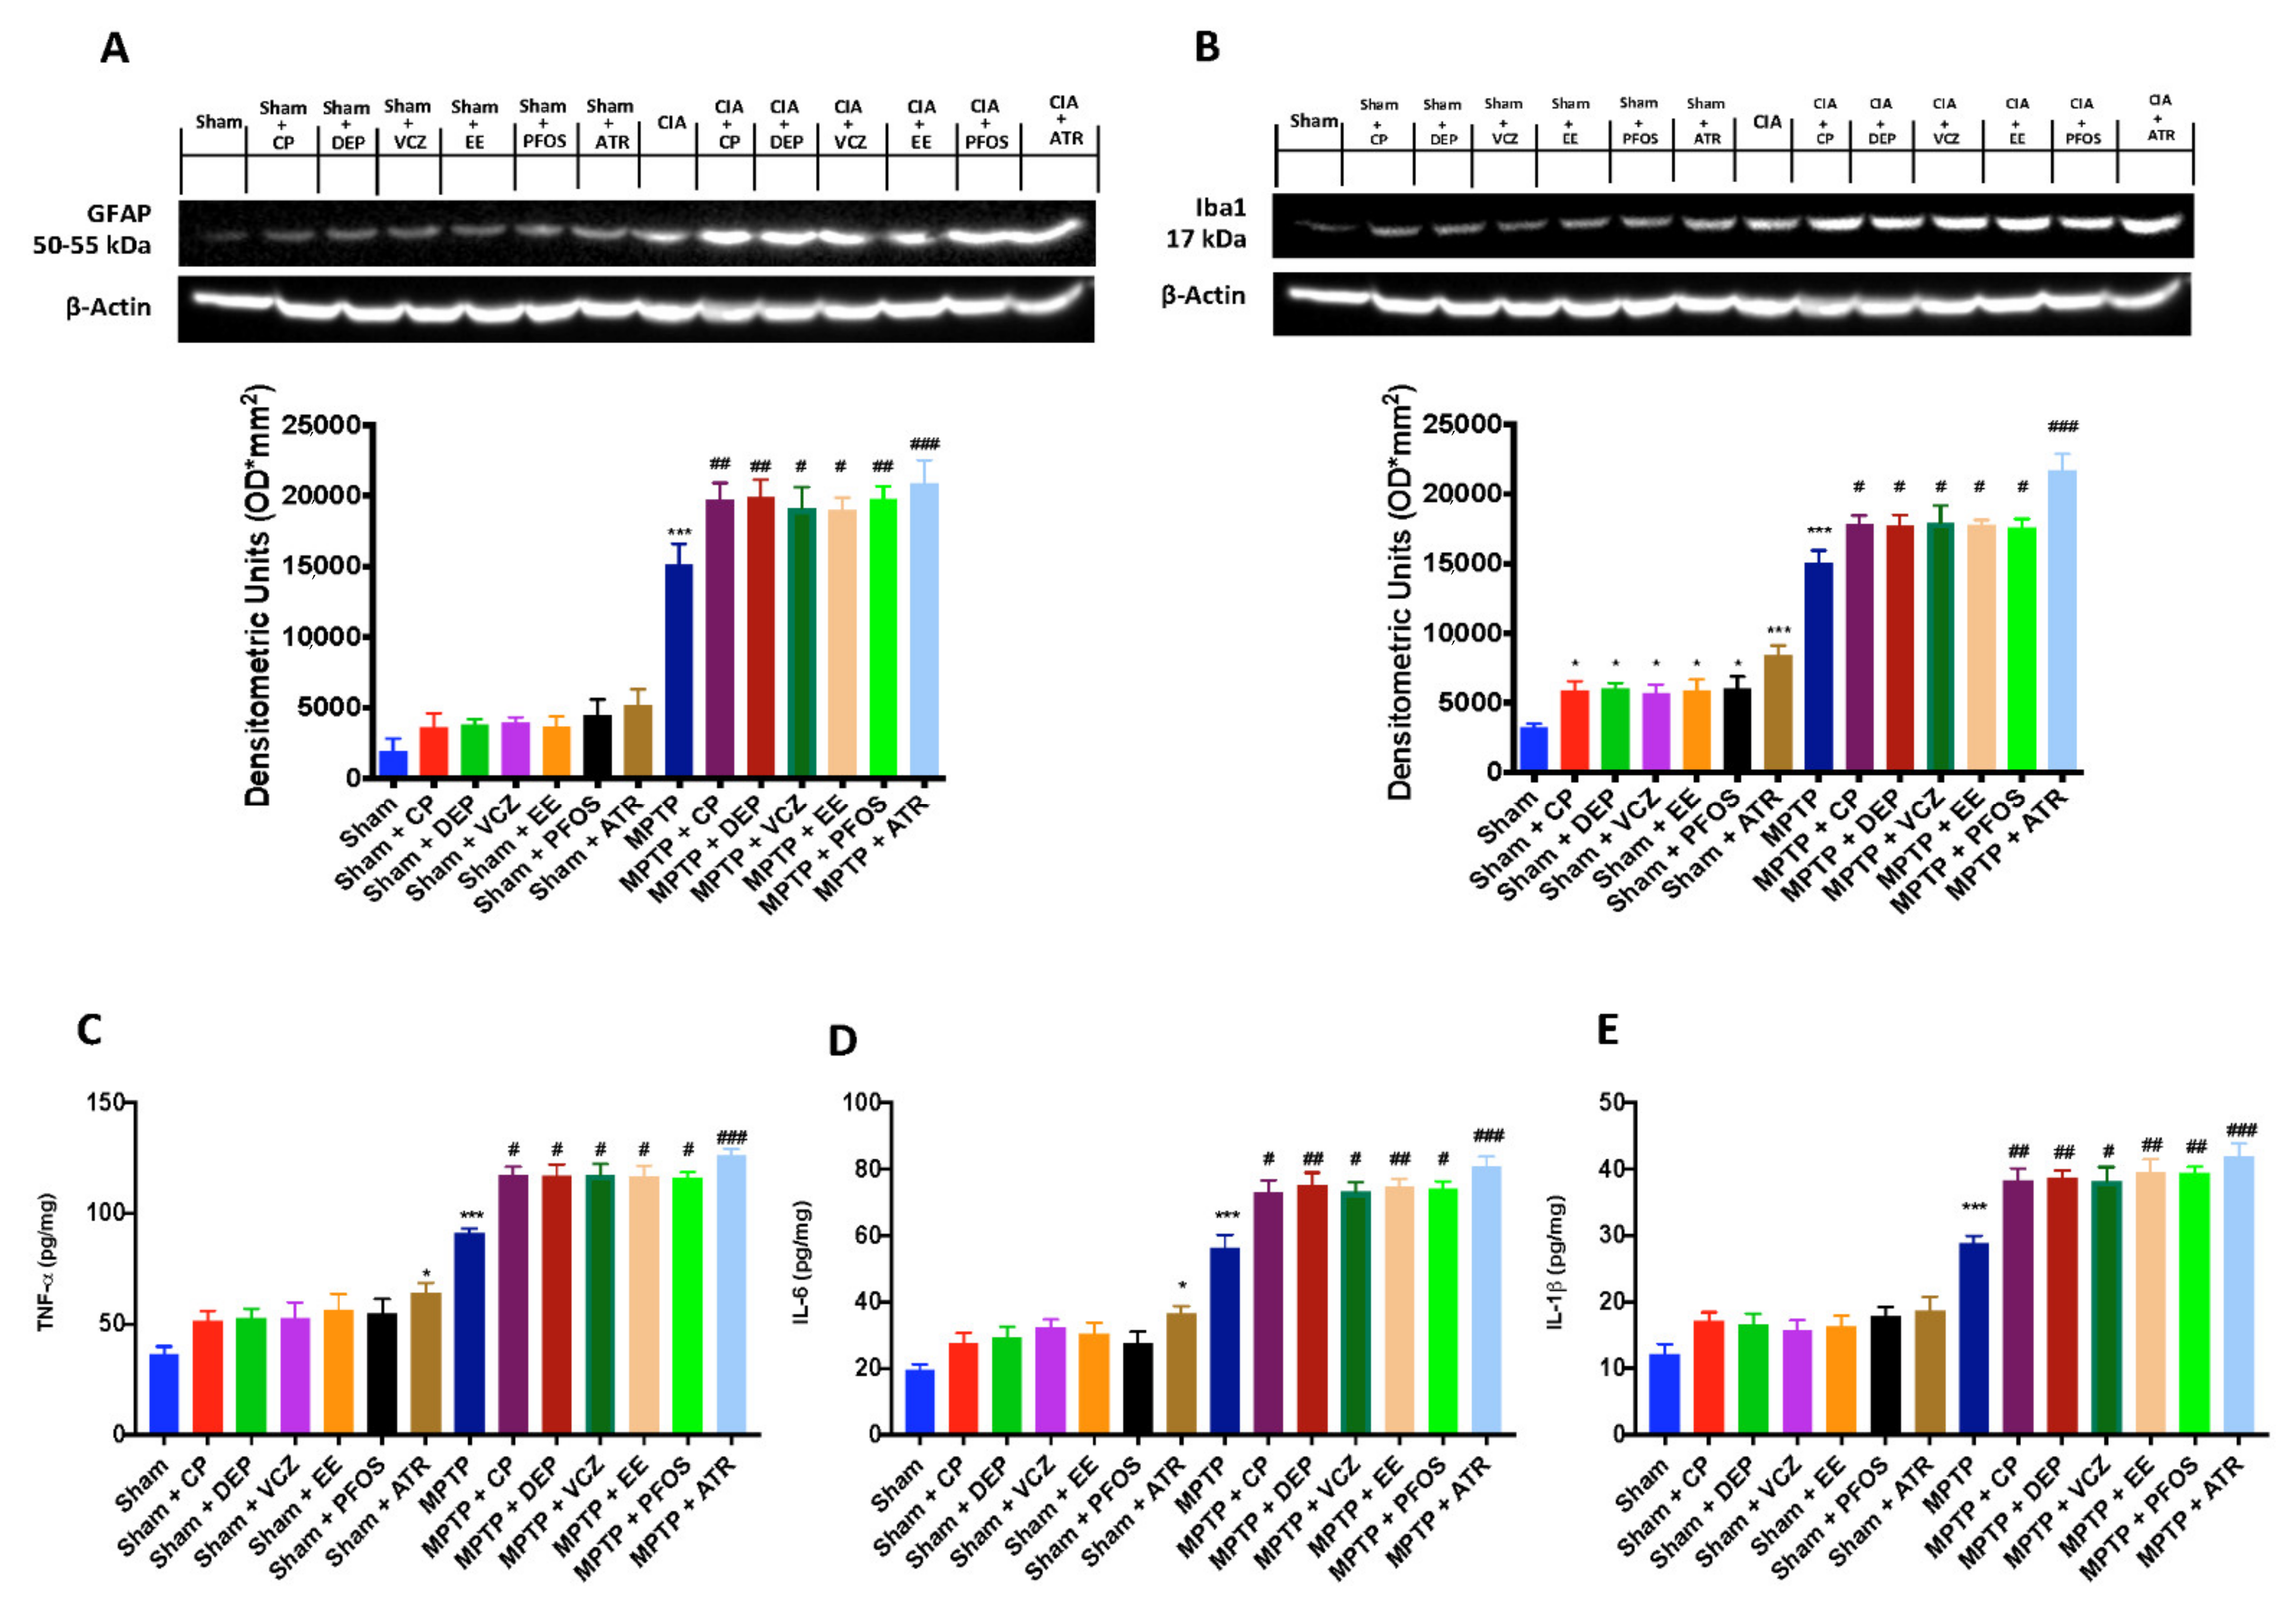
3.4. Impact of EDs Exposure on Neuroinflammation
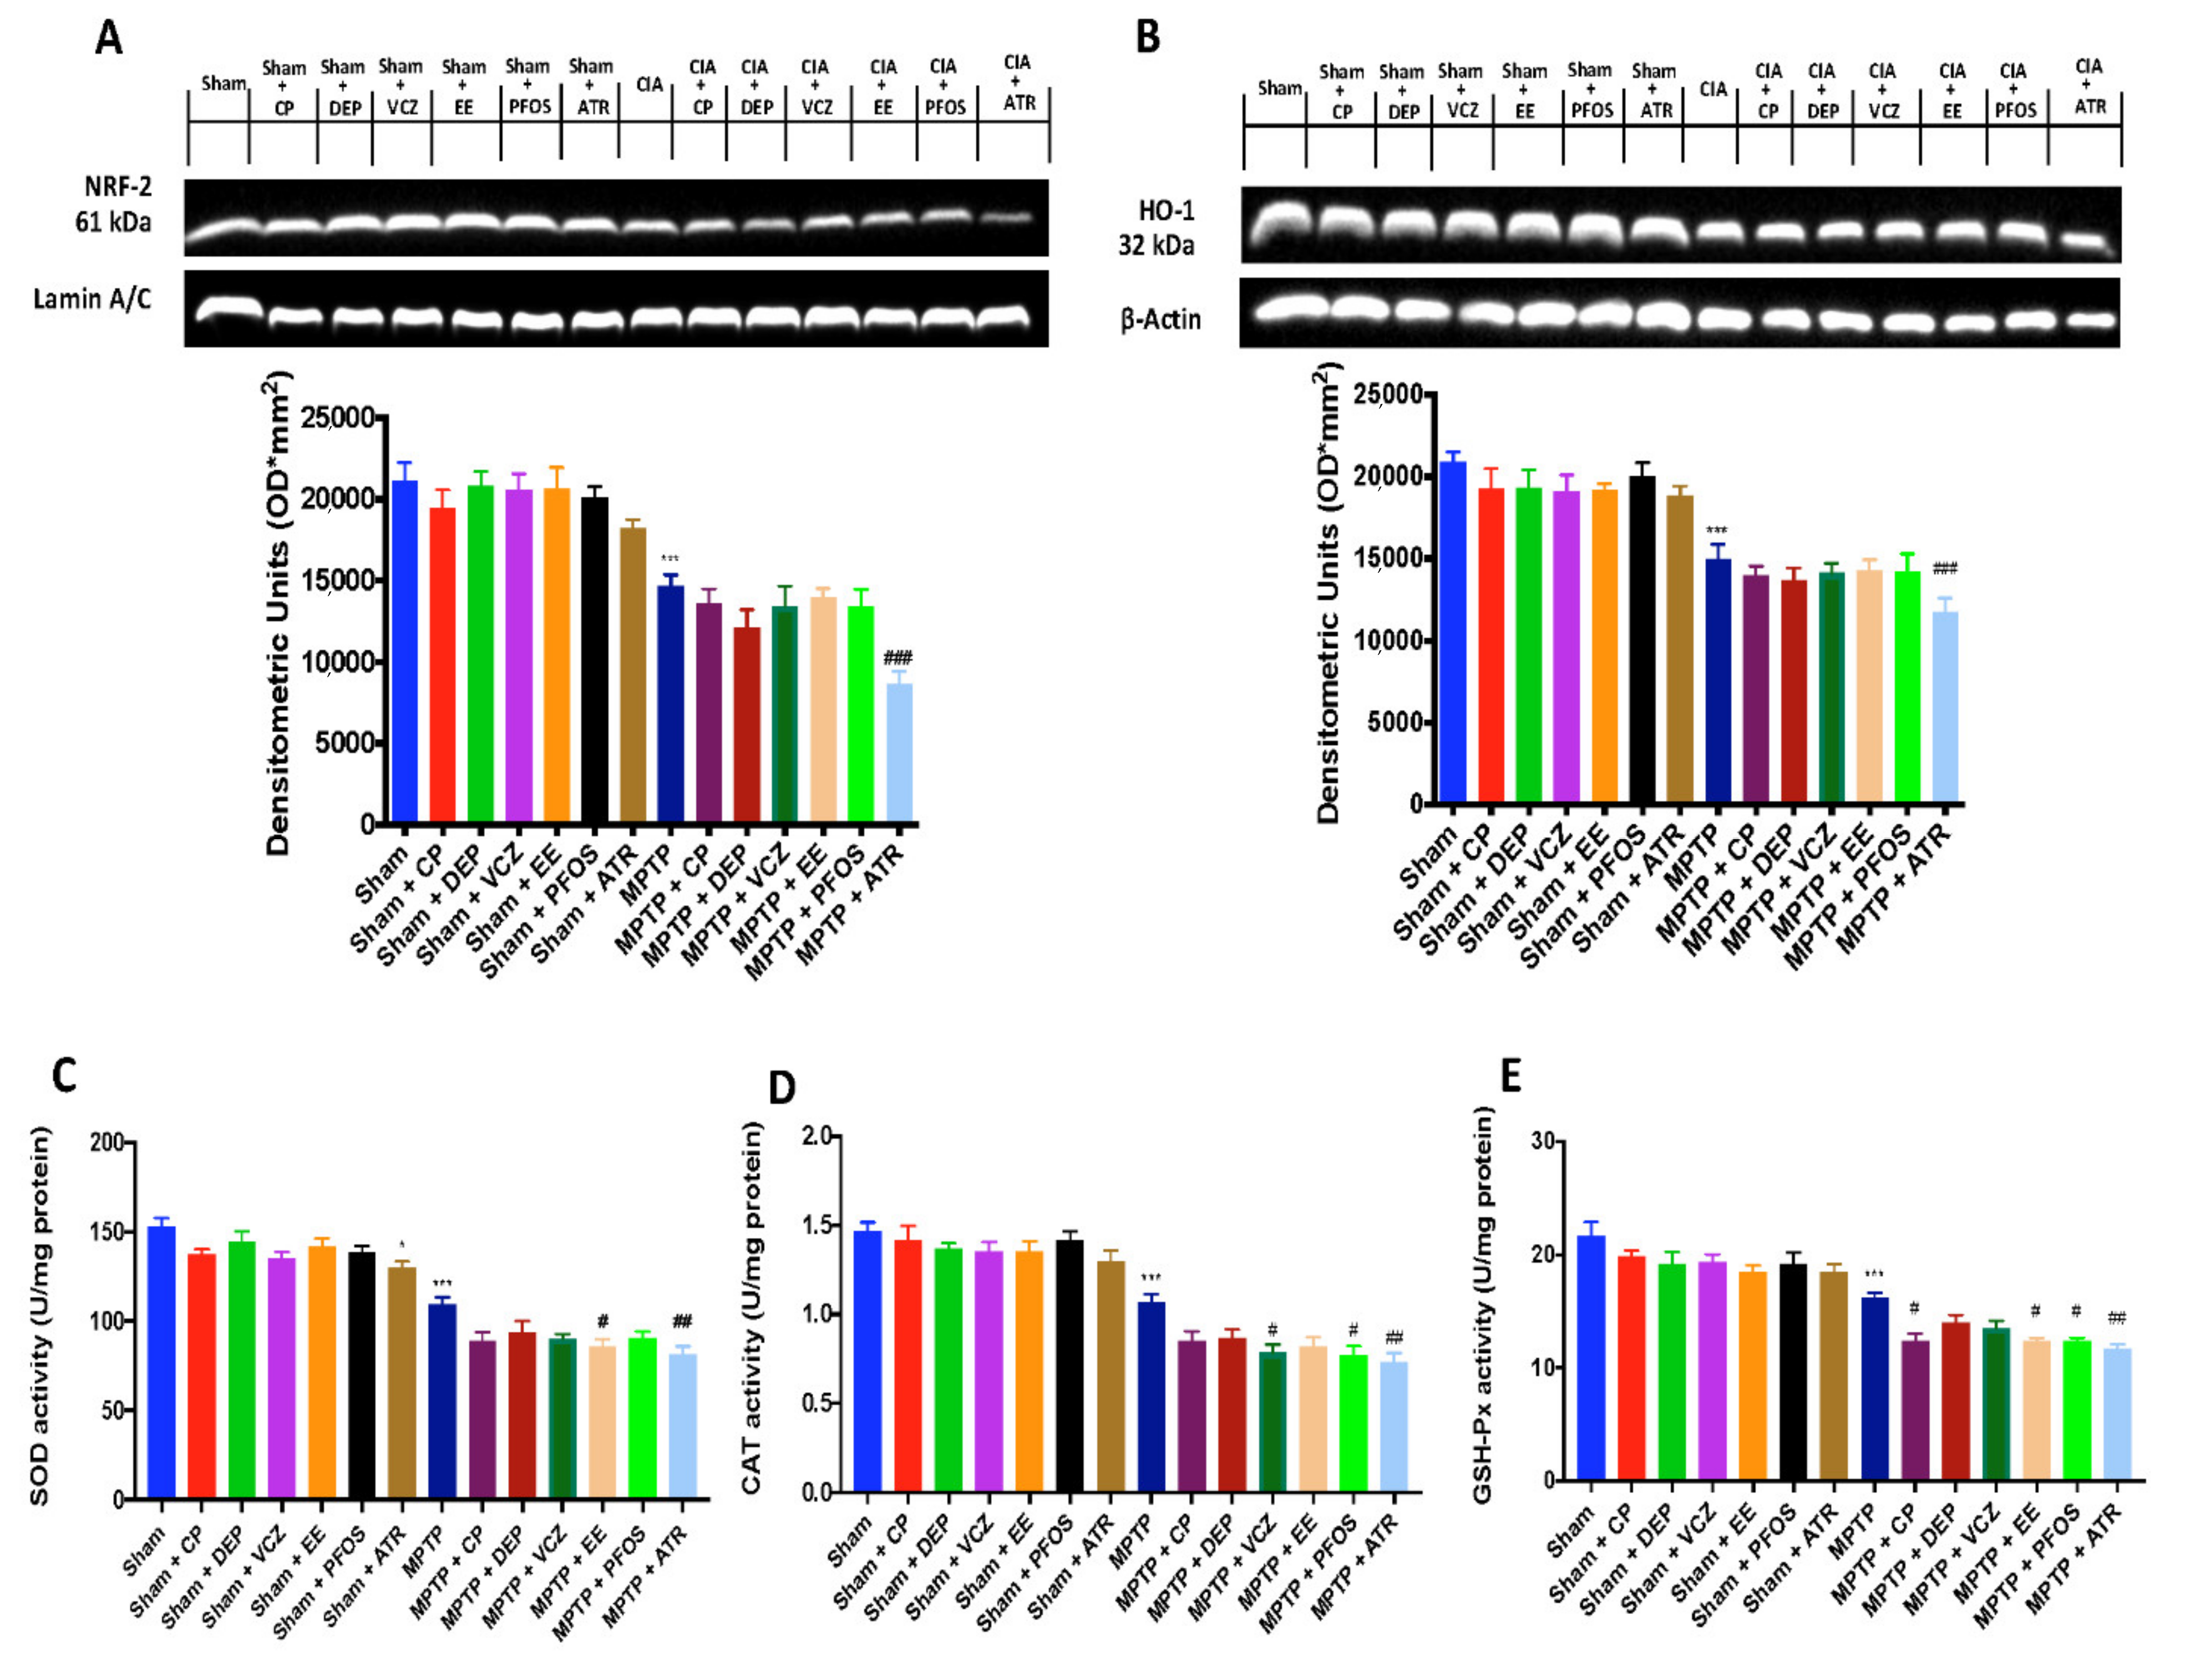
3.5. Impact of EDs Exposure on Nrf-2 Signaling Pathway
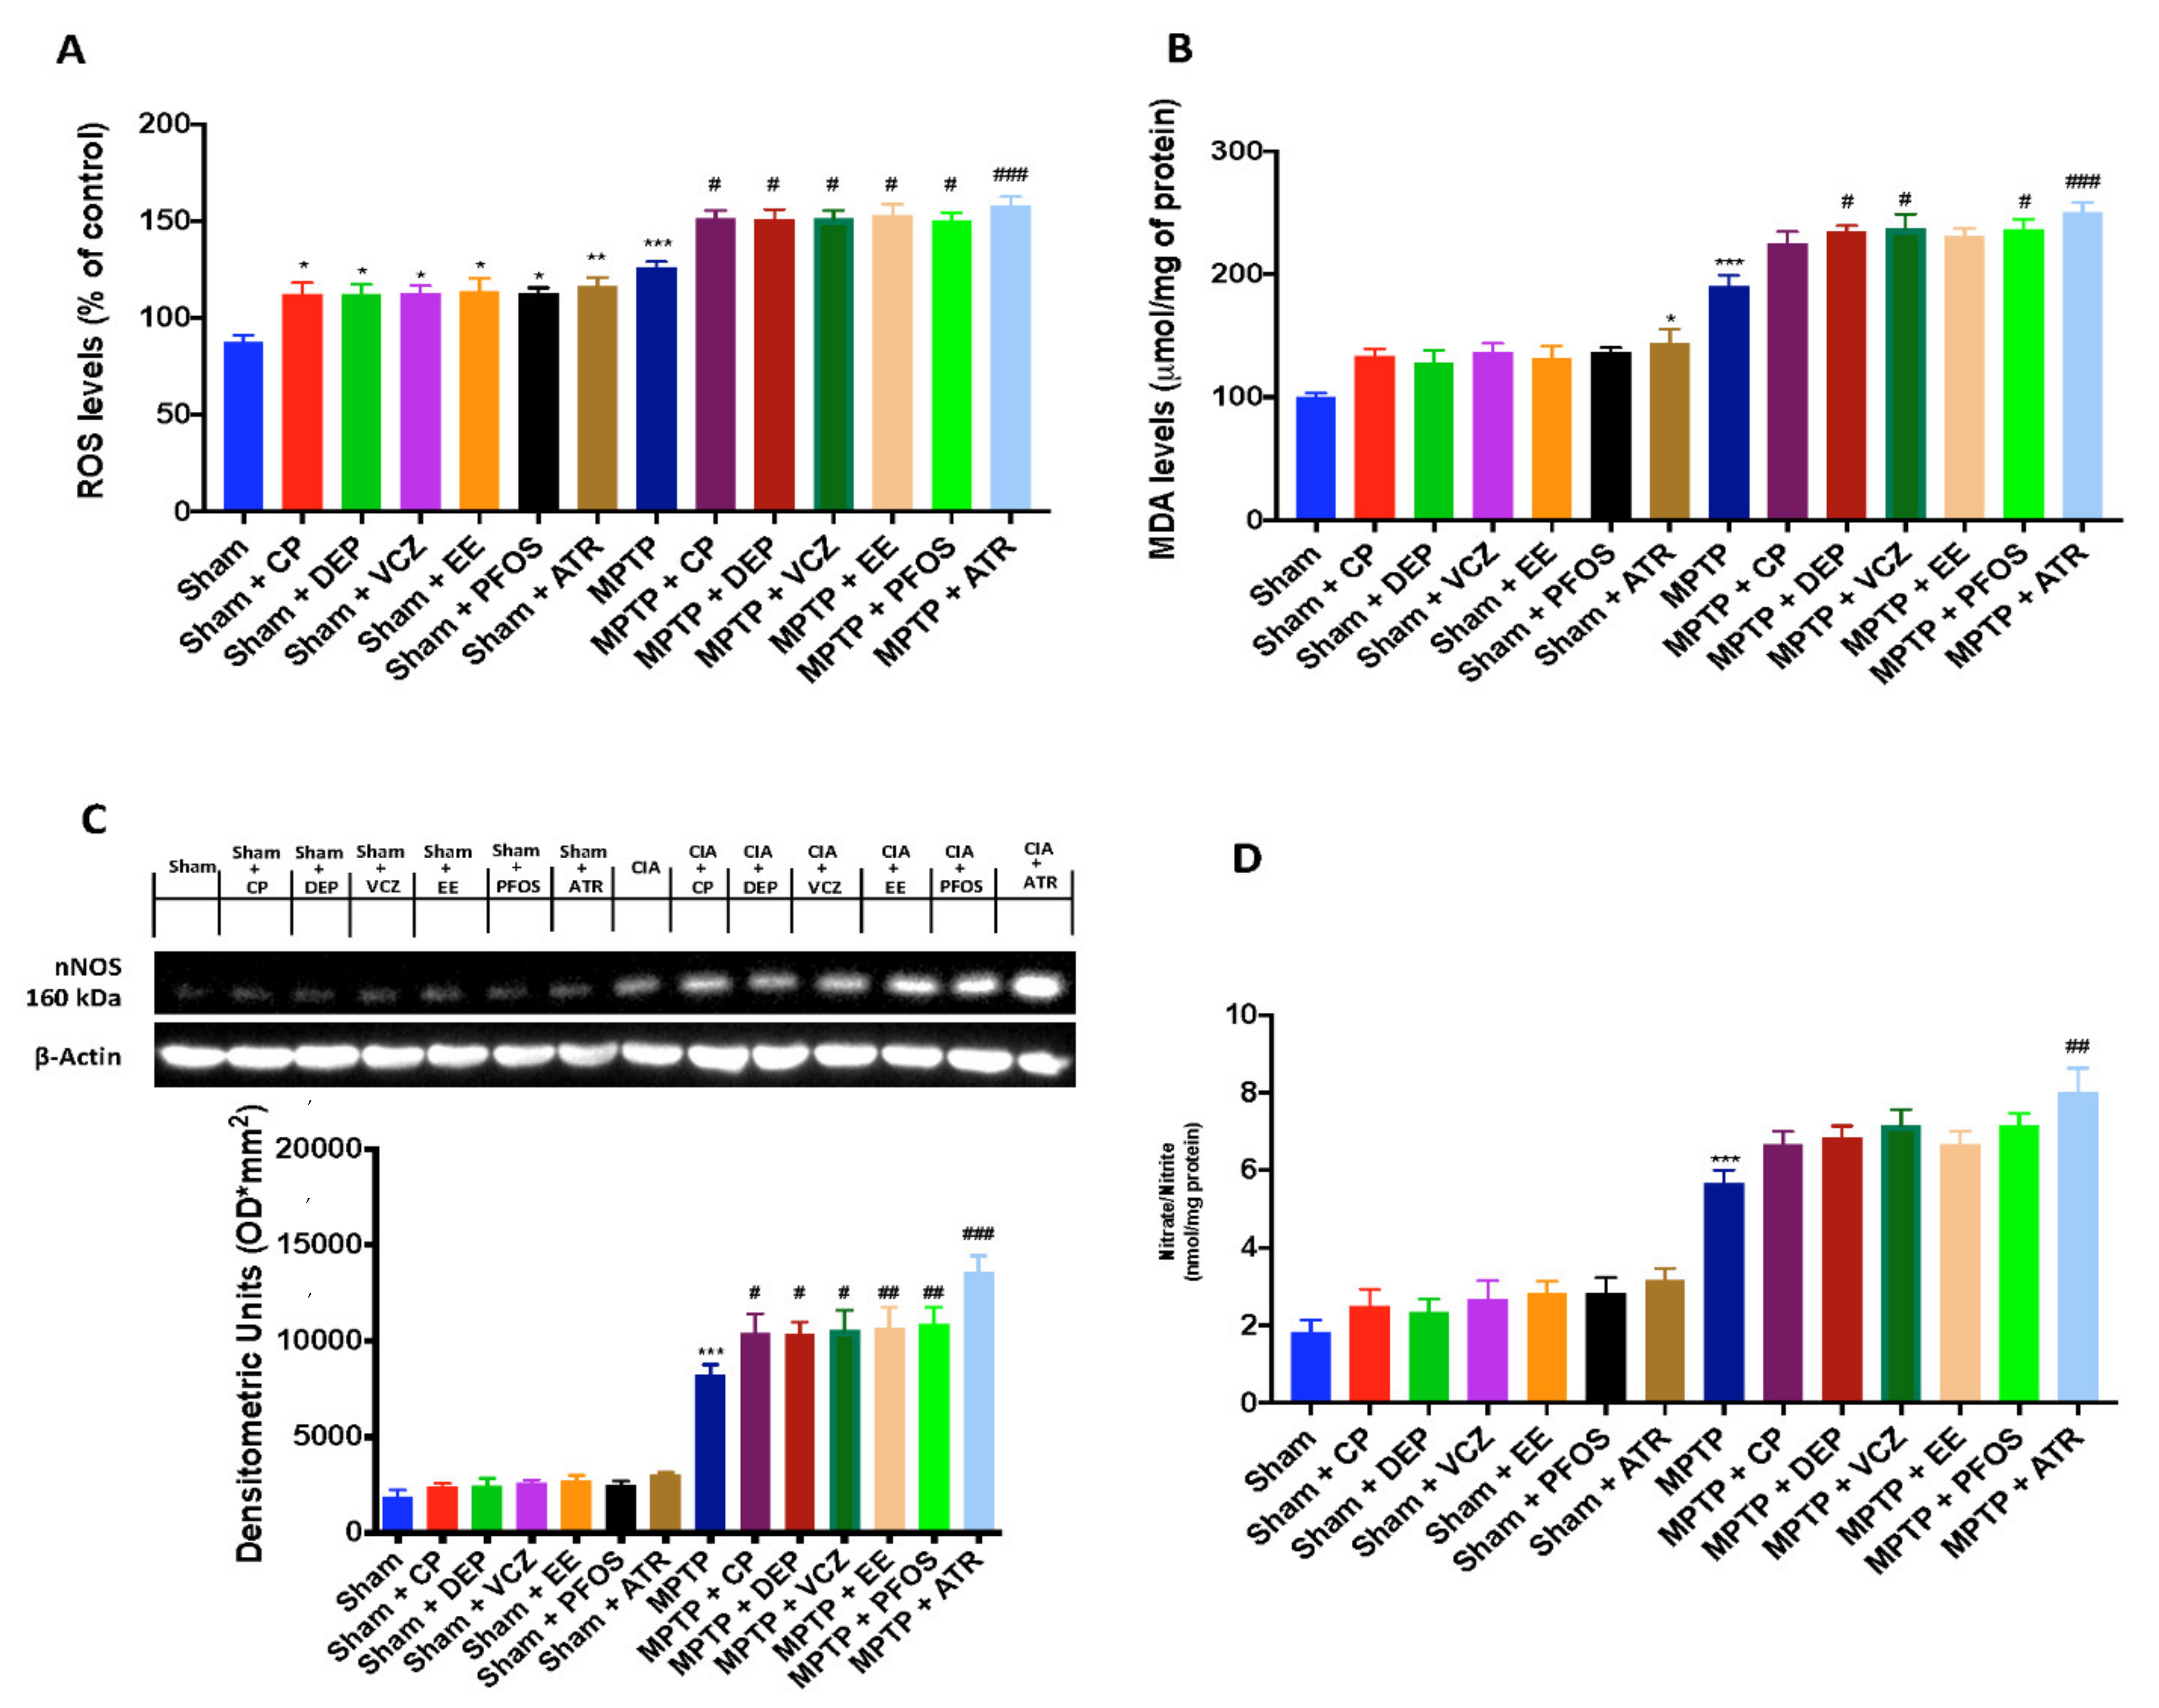
3.6. Impact of EDs Exposure on Oxidative/Nitrosative Stress and DNA Damage
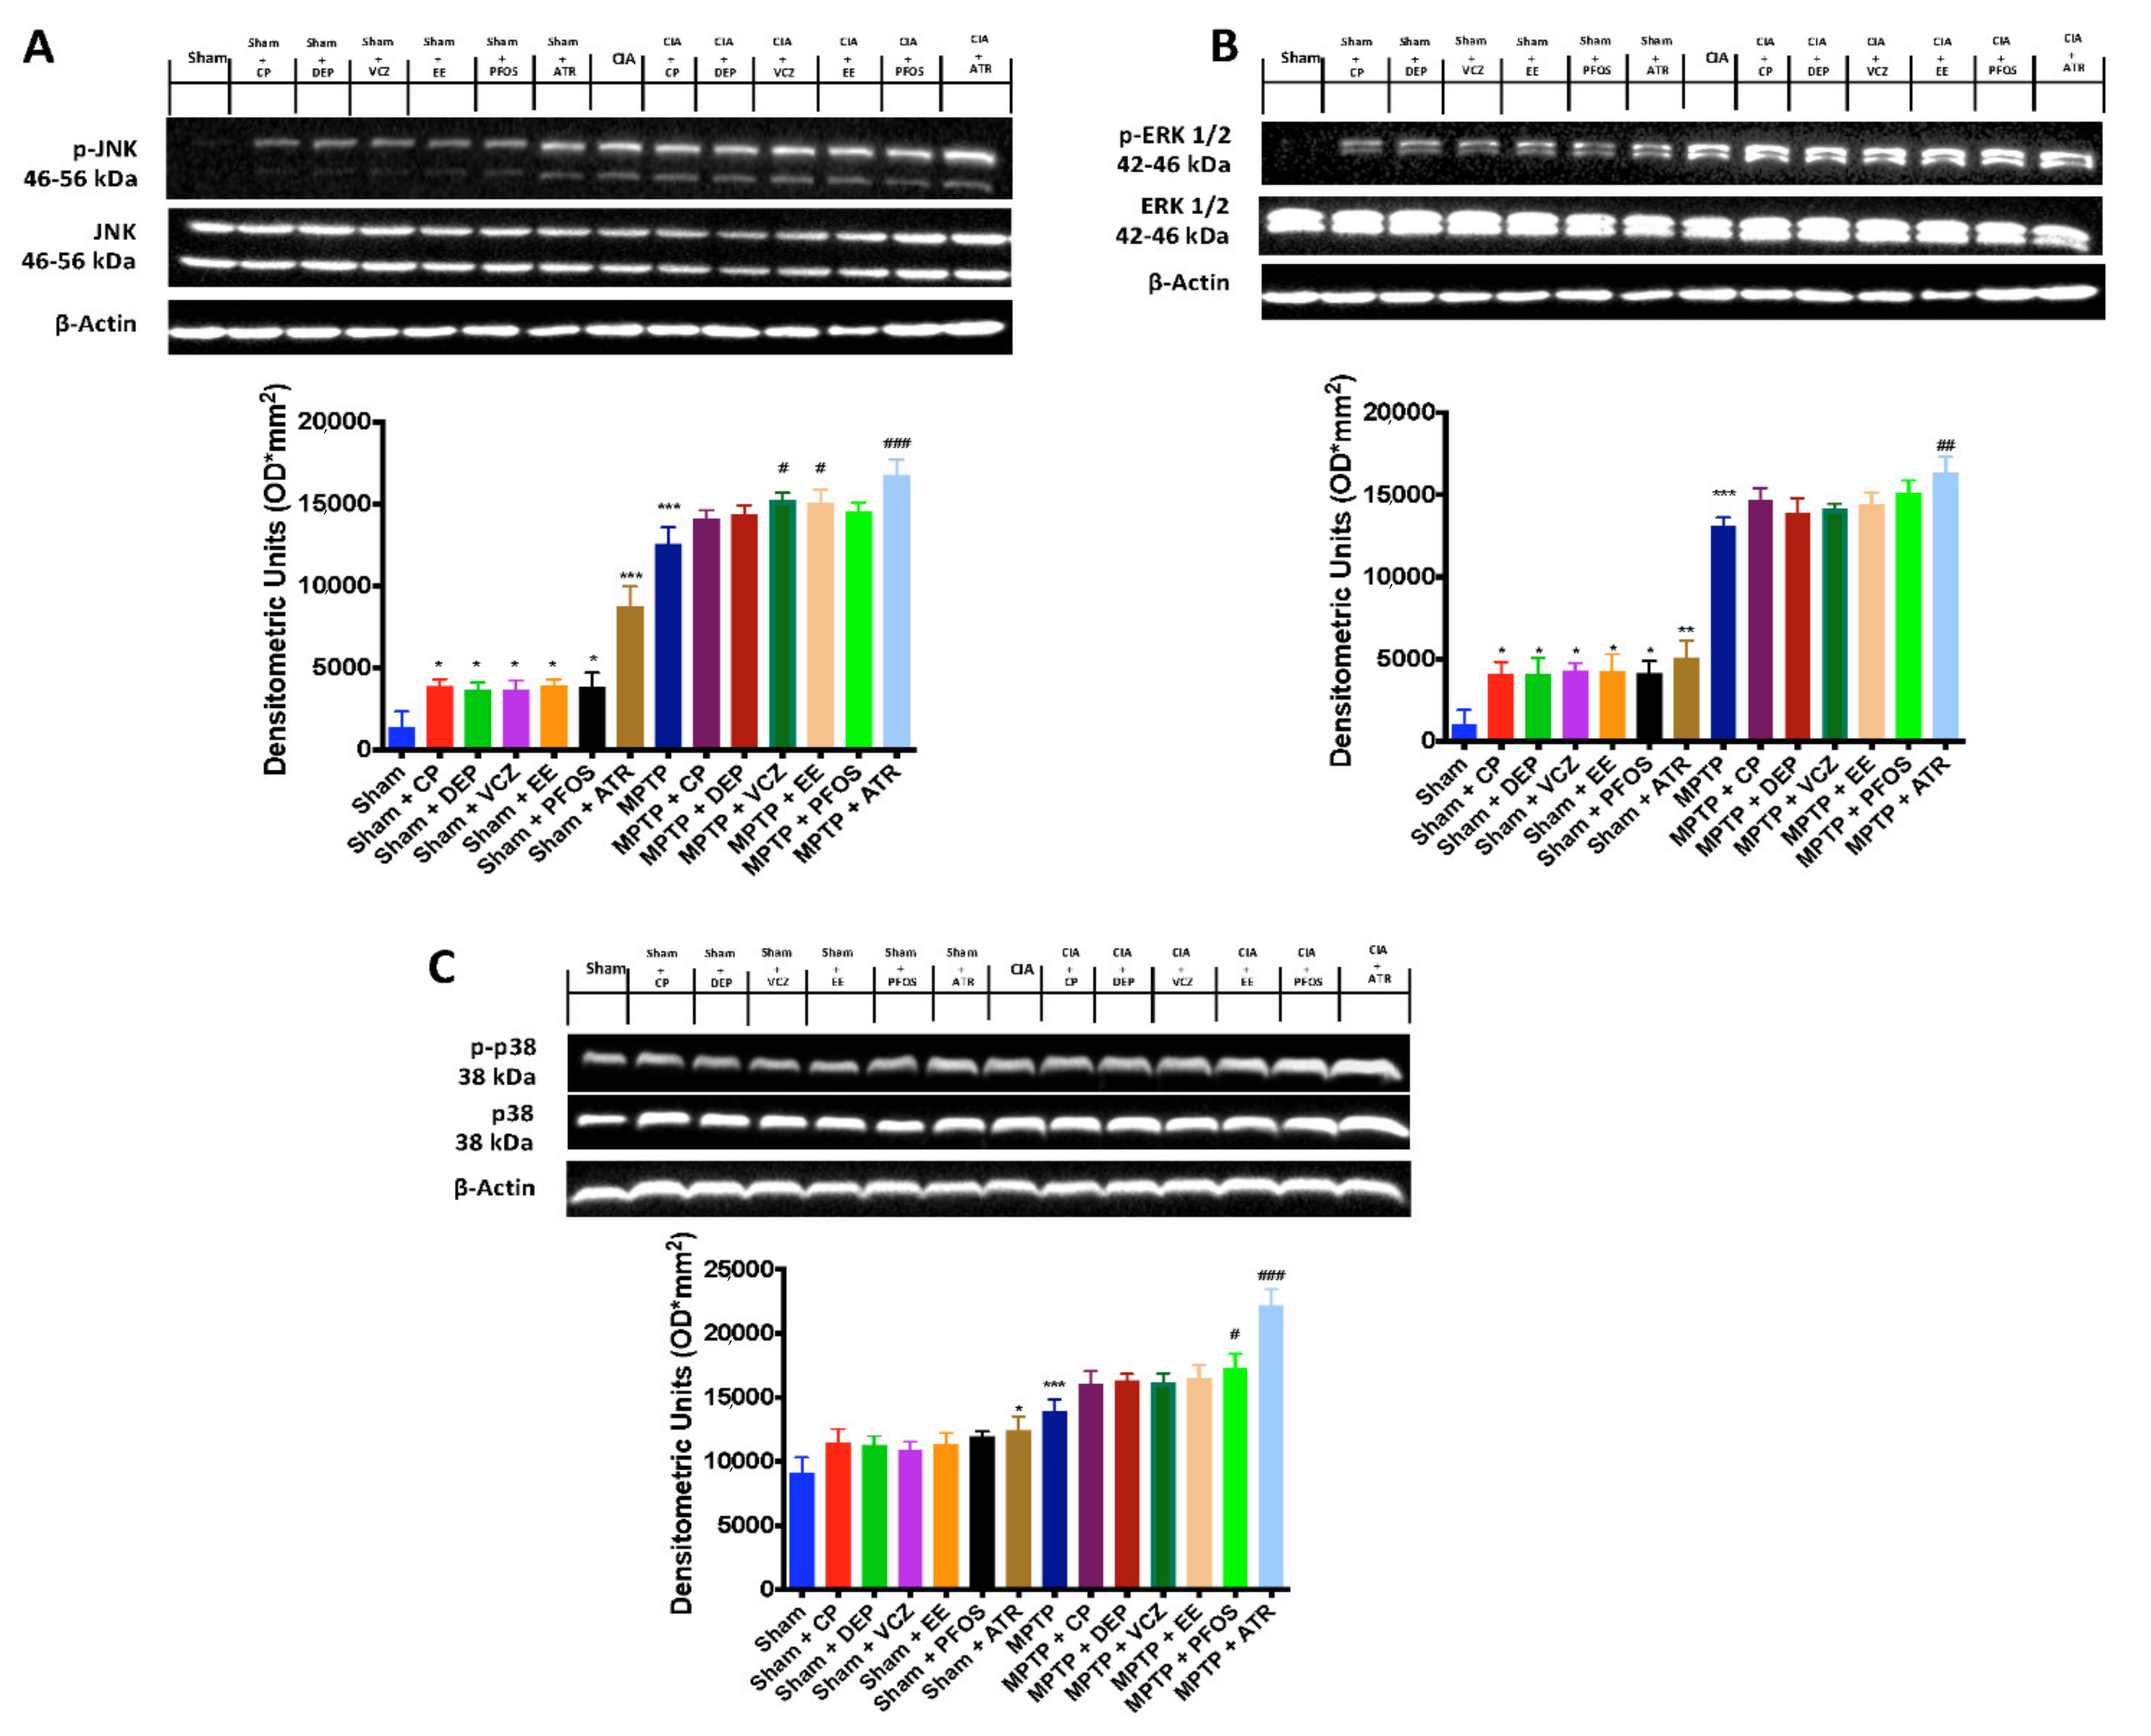
3.7. Impact of ED Exposure on the MAPK Signaling Pathway
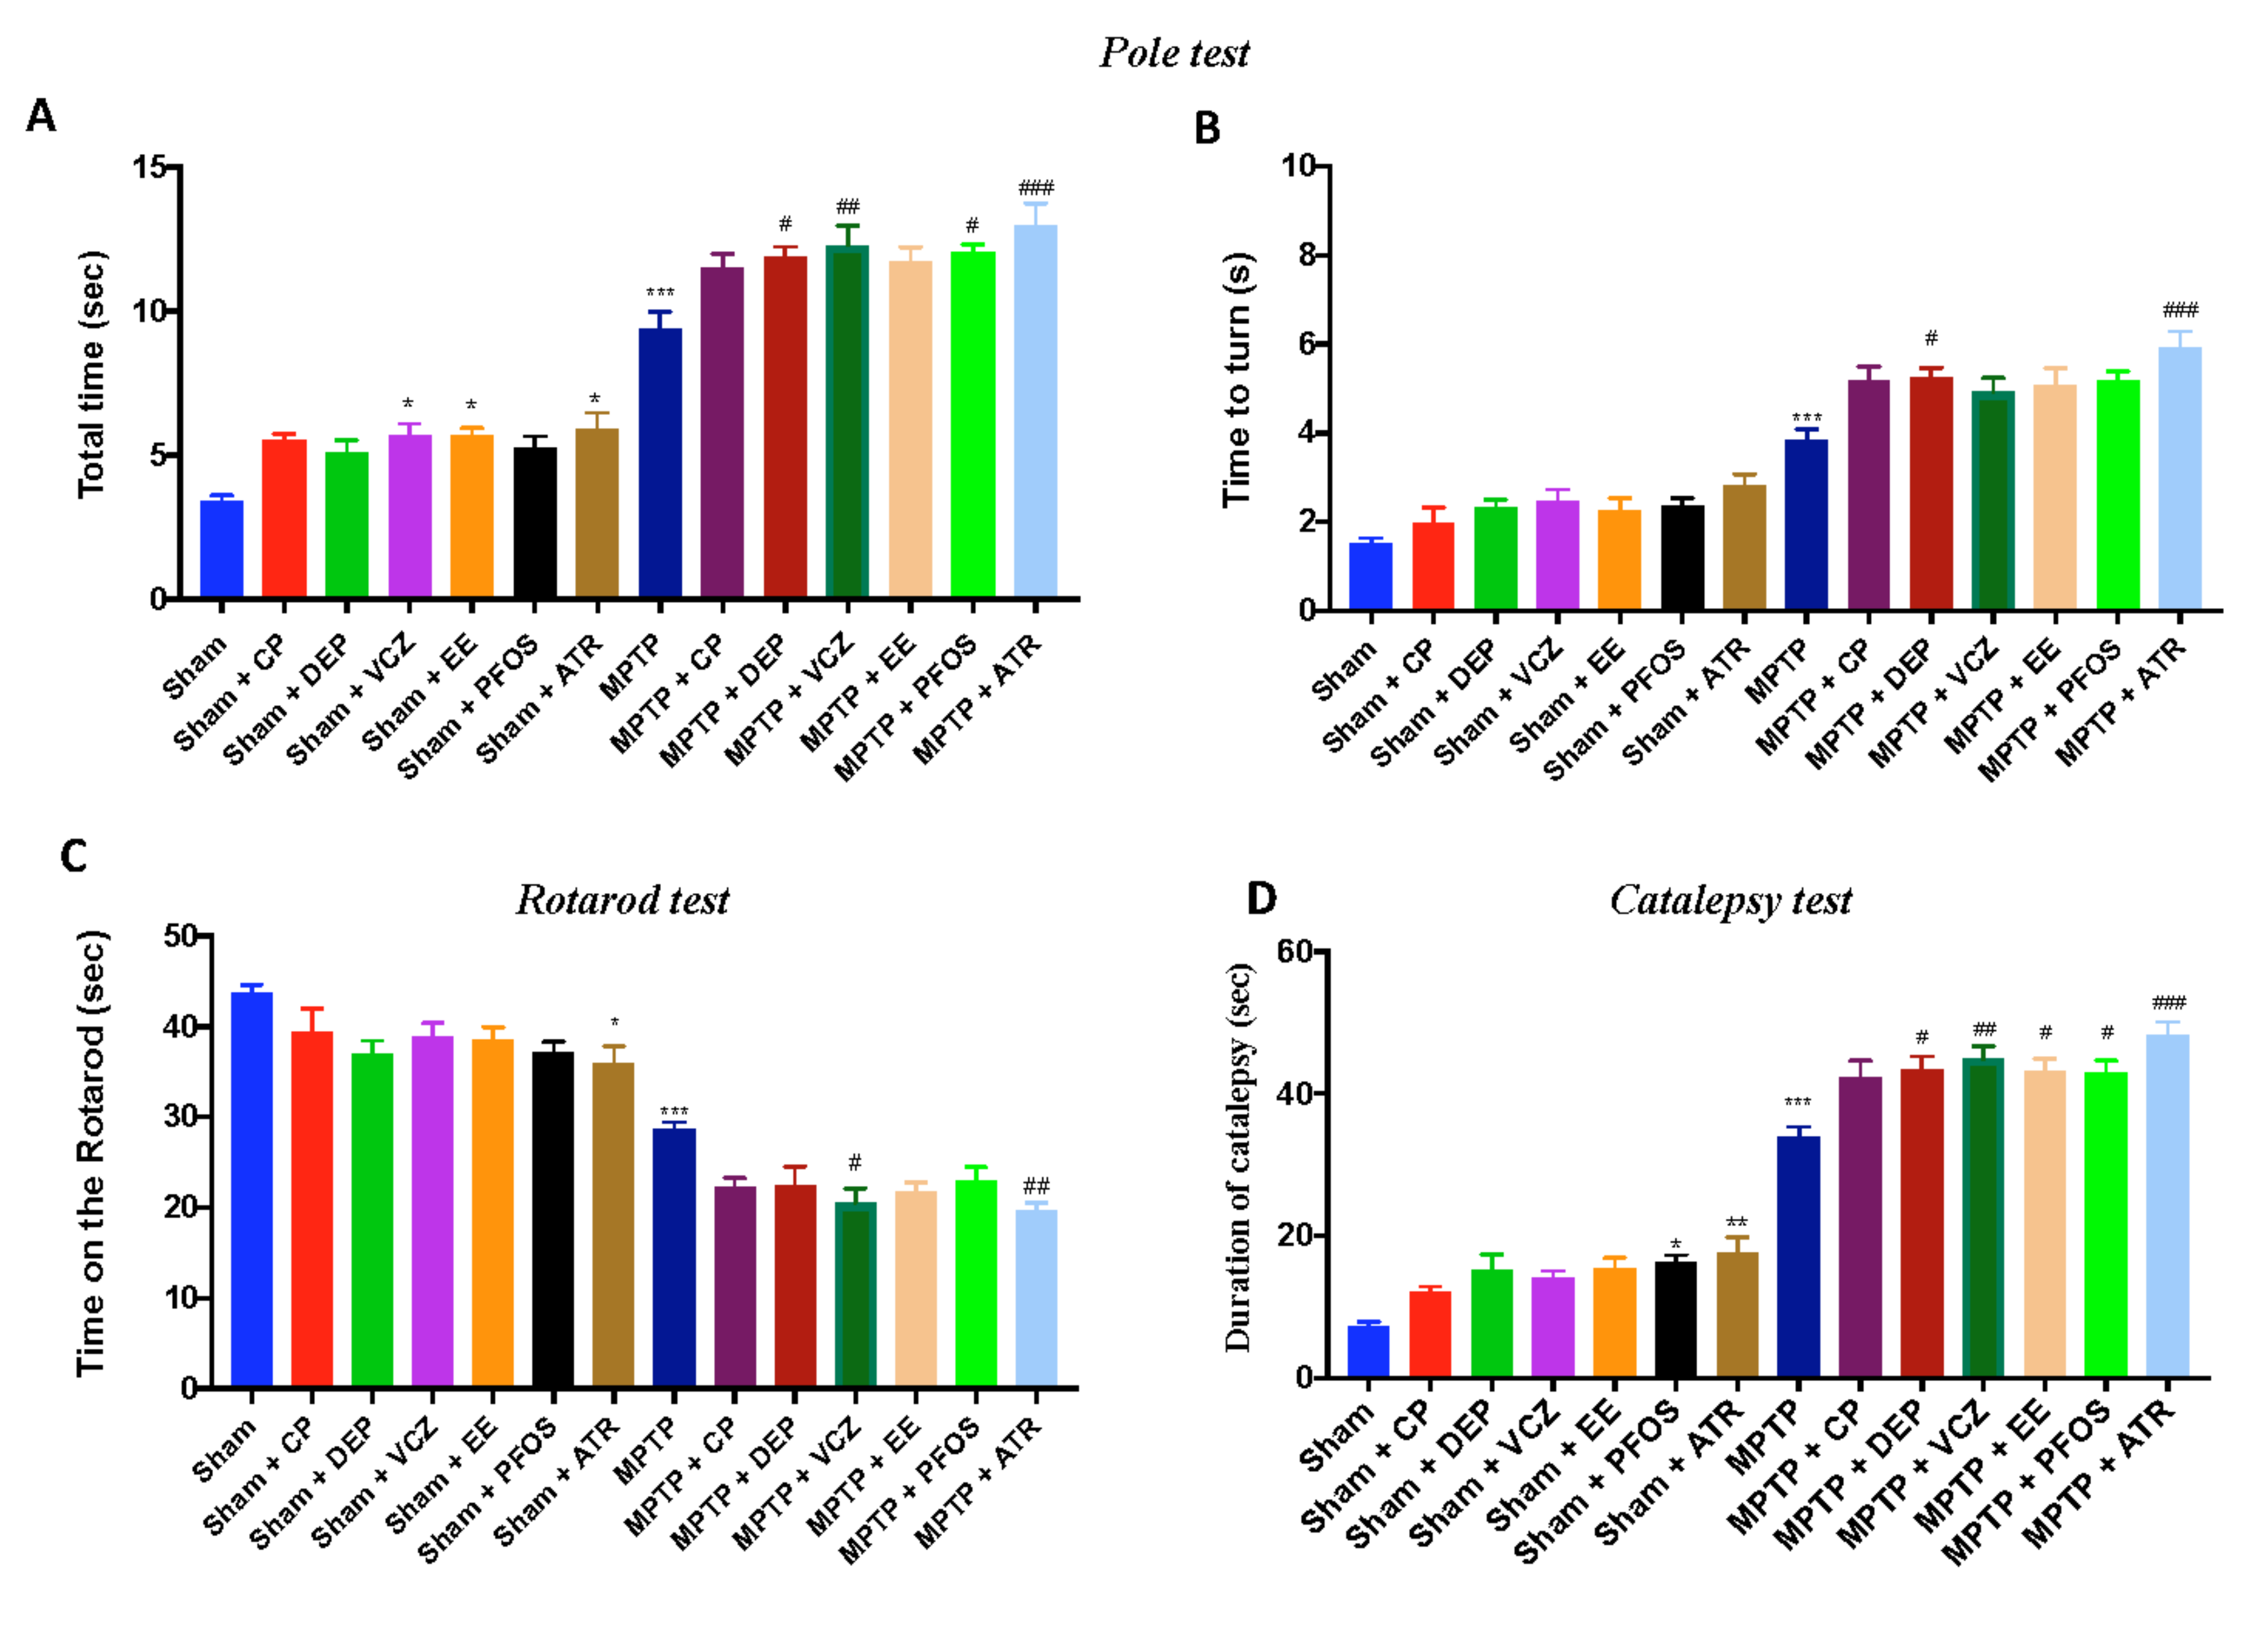
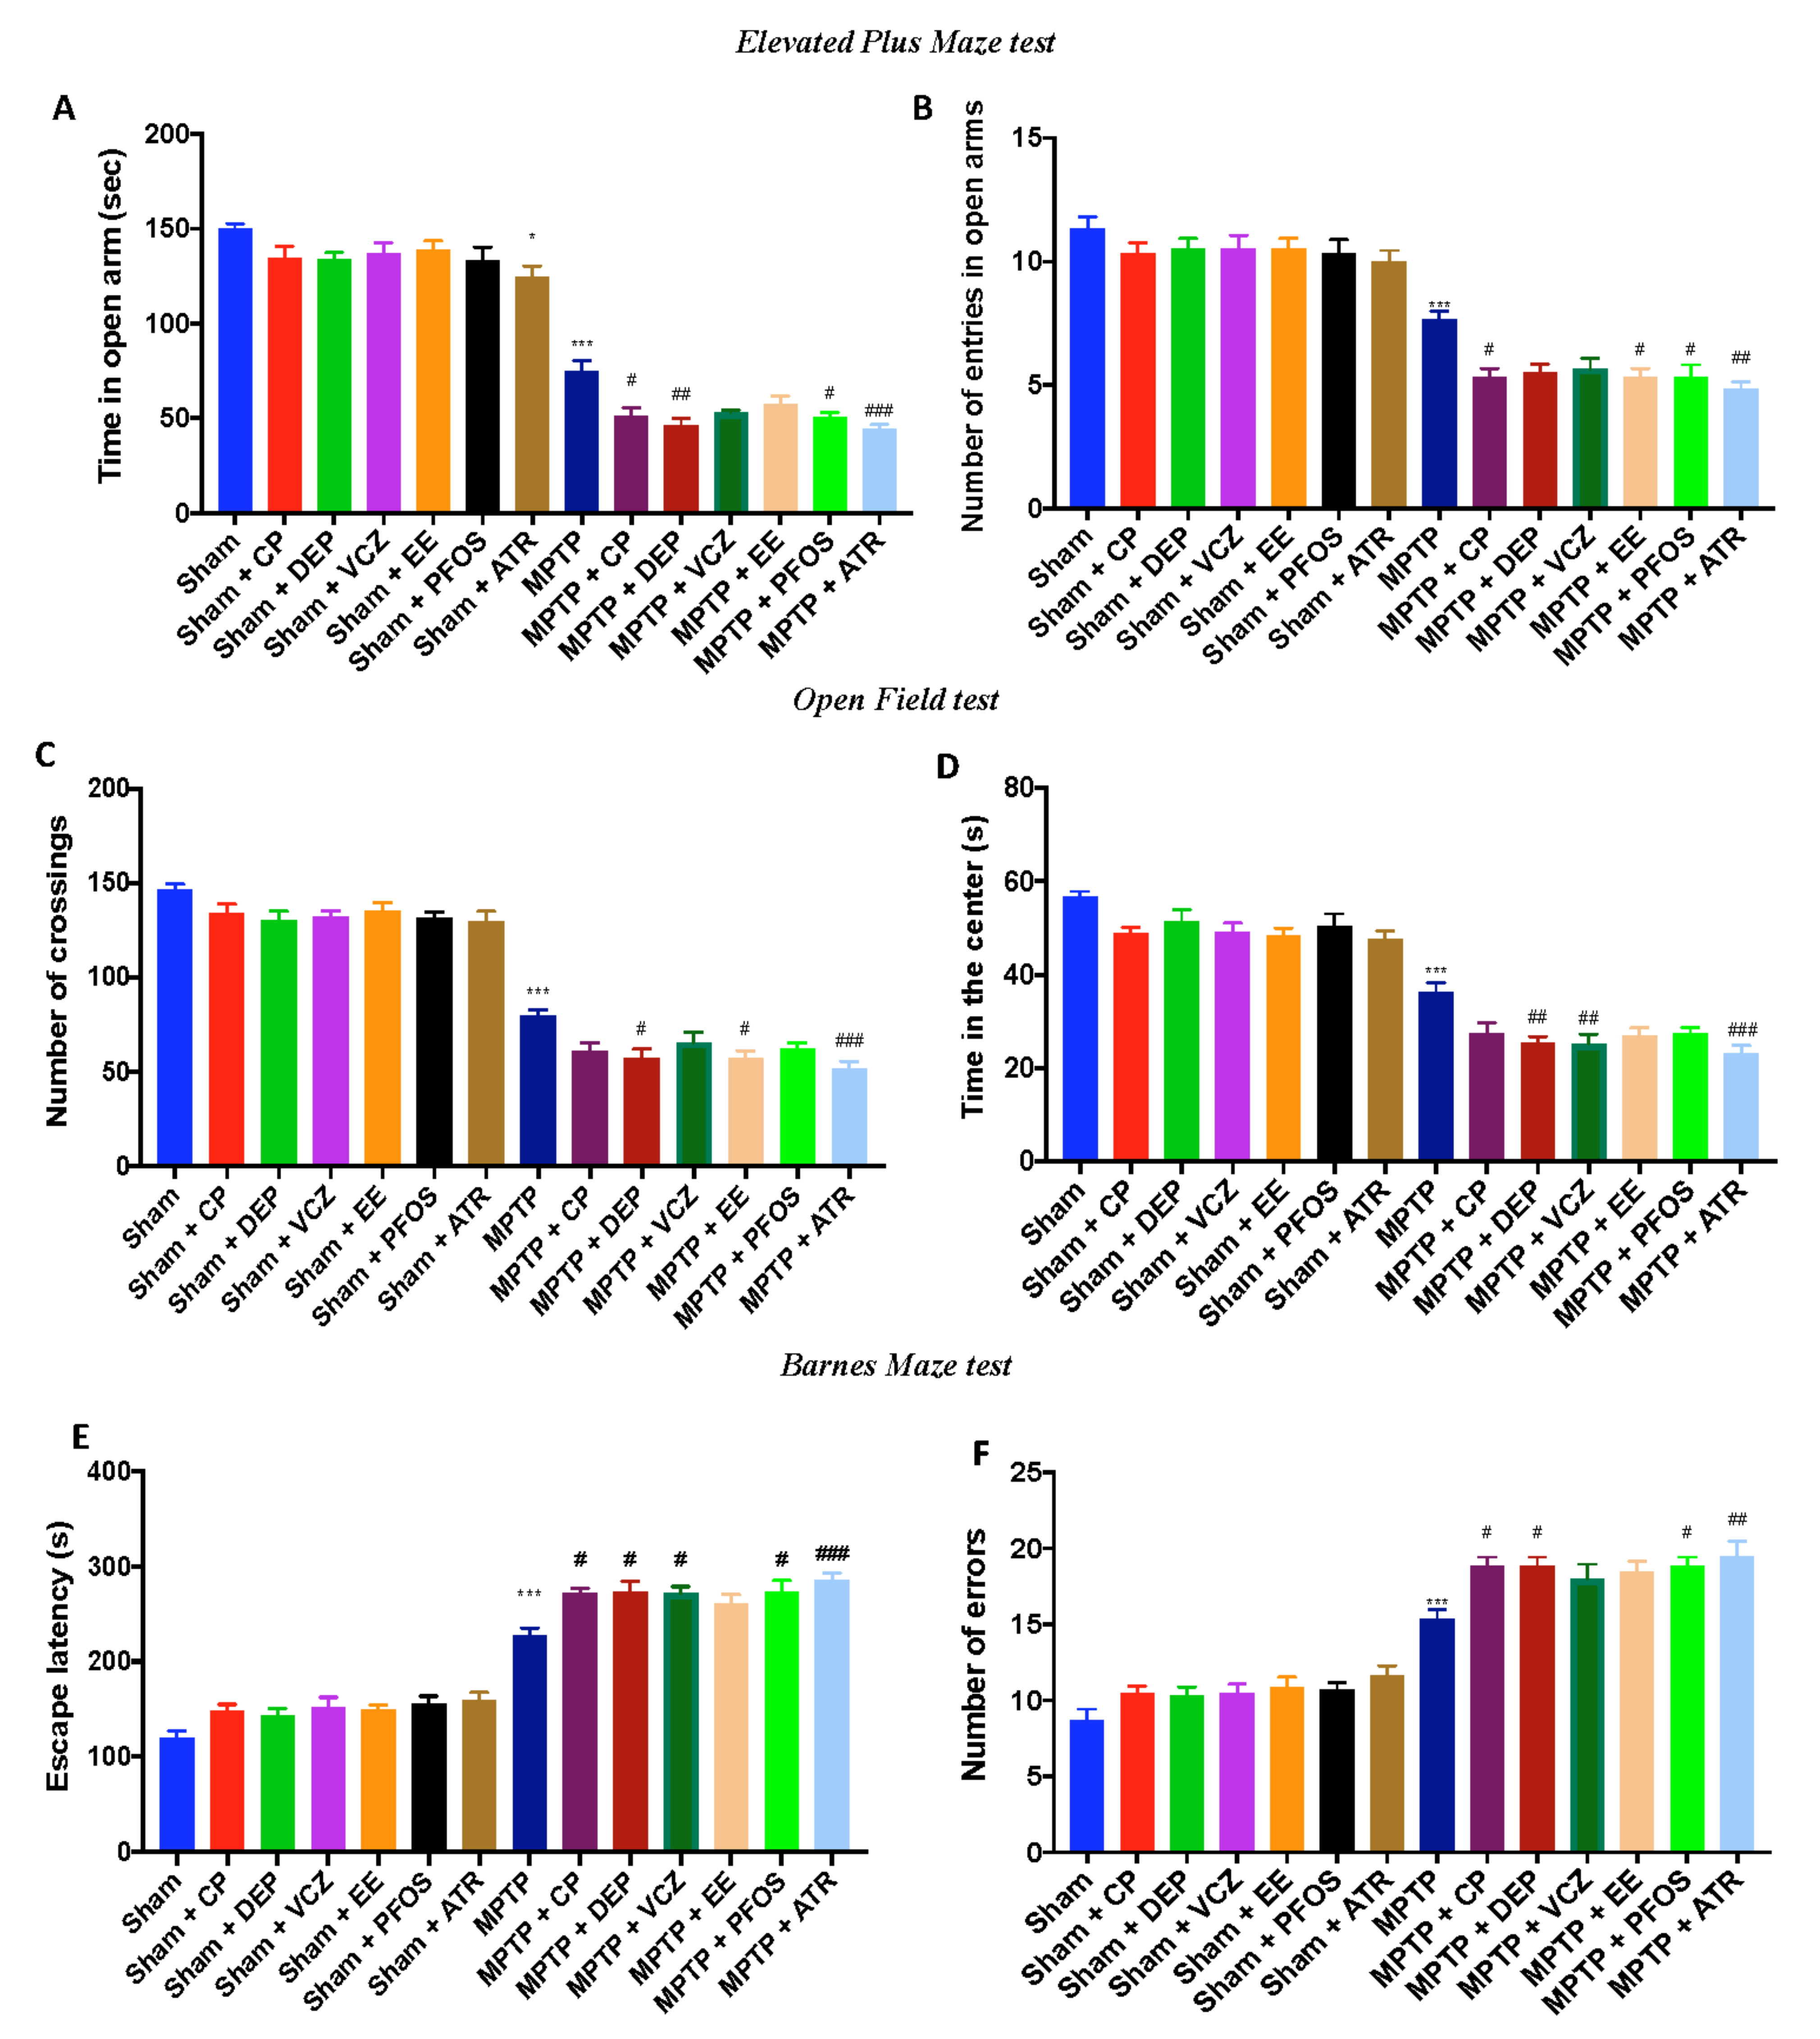
3.8. Impact of EDs Exposure on Motor Behavioral Impairments
3.9. Impact of EDs Exposure on Depression- and Anxiety-Like Behaviors and Cognitive Alteration
4. Discussion
5. Conclusions
Author Contributions
Funding
Institutional Review Board Statement
Data Availability Statement
Conflicts of Interest
References
- Yilmaz, B.; Terekeci, H.; Sandal, S.; Kelestimur, F. Endocrine disrupting chemicals: Exposure, effects on human health, mechanism of action, models for testing and strategies for prevention. Rev. Endocr. Metab. Disord. 2020, 21, 127–147. [Google Scholar] [CrossRef] [PubMed]
- Koch, C.A.; Diamanti-Kandarakis, E. Introduction to Endocrine Disrupting Chemicals--is it time to act? Rev. Endocr. Metab. Disord. 2015, 16, 269–270. [Google Scholar] [CrossRef] [PubMed]
- D’Amico, R.; Monaco, F.; Fusco, R.; Siracusa, R.; Impellizzeri, D.; Peritore, A.F.; Crupi, R.; Gugliandolo, E.; Cuzzocrea, S.; Di Paola, R.; et al. Atrazine Inhalation Worsen Pulmonary Fibrosis Regulating the Nuclear Factor-Erythroid 2-Related Factor (Nrf2) Pathways Inducing Brain Comorbidities. Cell. Physiol. Biochem. 2021, 55, 704–725. [Google Scholar] [CrossRef] [PubMed]
- Genovese, T.; Siracusa, R.; Fusco, R.; D’Amico, R.; Impellizzeri, D.; Peritore, A.F.; Crupi, R.; Gugliandolo, E.; Morabito, R.; Cuzzocrea, S.; et al. Atrazine Inhalation Causes Neuroinflammation, Apoptosis and Accelerating Brain Aging. Int. J. Mol. Sci. 2021, 22, 7938. [Google Scholar] [CrossRef]
- Rebolledo-Solleiro, D.; Castillo Flores, L.Y.; Solleiro-Villavicencio, H. Impact of BPA on behavior, neurodevelopment and neurodegeneration. Front. Biosci. 2021, 26, 363–400. [Google Scholar] [CrossRef]
- Santos, D.; Batoreu, M.C.; Tavares de Almeida, I.; Davis Randall, L.; Mateus, M.L.; Andrade, V.; Ramos, R.; Torres, E.; Aschner, M.; Marreilha dos Santos, A.P. Evaluation of neurobehavioral and neuroinflammatory end-points in the post-exposure period in rats sub-acutely exposed to manganese. Toxicology 2013, 314, 95–99. [Google Scholar] [CrossRef]
- Di Nisio, A.; Pannella, M.; Vogiatzis, S.; Sut, S.; Dall’Acqua, S.; Rocca, M.S.; Antonini, A.; Porzionato, A.; De Caro, R.; Bortolozzi, M.; et al. Impairment of human dopaminergic neurons at different developmental stages by perfluoro-octanoic acid (PFOA) and differential human brain areas accumulation of perfluoroalkyl chemicals. Environ. Int. 2022, 158, 106982. [Google Scholar] [CrossRef]
- Masuo, Y.; Ishido, M. Neurotoxicity of endocrine disruptors: Possible involvement in brain development and neurodegeneration. J. Toxicol. Environ. Health Part B 2011, 14, 346–369. [Google Scholar] [CrossRef]
- Lupu, D.; Andersson, P.; Bornehag, C.G.; Demeneix, B.; Fritsche, E.; Gennings, C.; Lichtensteiger, W.; Leist, M.; Leonards, P.E.G.; Ponsonby, A.L.; et al. The ENDpoiNTs Project: Novel Testing Strategies for Endocrine Disruptors Linked to Developmental Neurotoxicity. Int. J. Mol. Sci. 2020, 21, 3978. [Google Scholar] [CrossRef]
- Liu, Q.; Lei, Z.; Huang, A.; Wu, Q.; Xie, S.; Awais, I.; Dai, M.; Wang, X.; Yuan, Z. Toxic metabolites, MAPK and Nrf2/Keap1 signaling pathways involved in oxidative toxicity in mice liver after chronic exposure to Mequindox. Sci. Rep. 2017, 7, 41854. [Google Scholar] [CrossRef]
- Song, Q.; Peng, S.; Zhu, X. Baicalein protects against MPP(+)/MPTP-induced neurotoxicity by ameliorating oxidative stress in SH-SY5Y cells and mouse model of Parkinson’s disease. Neurotoxicology 2021, 87, 188–194. [Google Scholar] [CrossRef] [PubMed]
- He, J.; Zhu, G.; Wang, G.; Zhang, F. Oxidative Stress and Neuroinflammation Potentiate Each Other to Promote Progression of Dopamine Neurodegeneration. Oxid. Med. Cell. Longev. 2020, 2020, 6137521. [Google Scholar] [CrossRef] [PubMed]
- Xia, Q.P.; Cheng, Z.Y.; He, L. The modulatory role of dopamine receptors in brain neuroinflammation. Int. Immunopharmacol. 2019, 76, 105908. [Google Scholar] [CrossRef] [PubMed]
- Garcia, P.; Jurgens-Wemheuer, W.; Uriarte Huarte, O.; Michelucci, A.; Masuch, A.; Brioschi, S.; Weihofen, A.; Koncina, E.; Coowar, D.; Heurtaux, T.; et al. Neurodegeneration and neuroinflammation are linked, but independent of alpha-synuclein inclusions, in a seeding/spreading mouse model of Parkinson’s disease. Glia 2022, 70, 935–960. [Google Scholar] [CrossRef] [PubMed]
- Cordaro, M.; Siracusa, R.; Crupi, R.; Impellizzeri, D.; Peritore, A.F.; D’Amico, R.; Gugliandolo, E.; Di Paola, R.; Cuzzocrea, S. 2-Pentadecyl-2-Oxazoline Reduces Neuroinflammatory Environment in the MPTP Model of Parkinson Disease. Mol. Neurobiol. 2018, 55, 9251–9266. [Google Scholar] [CrossRef]
- Singh, D.; Irani, D.; Bhagat, S.; Vanage, G. Cypermethrin exposure during perinatal period affects fetal development and impairs reproductive functions of F1 female rats. Sci. Total Environ. 2020, 707, 135945. [Google Scholar] [CrossRef]
- Nilsson, E.; King, S.E.; McBirney, M.; Kubsad, D.; Pappalardo, M.; Beck, D.; Sadler-Riggleman, I.; Skinner, M.K. Vinclozolin induced epigenetic transgenerational inheritance of pathologies and sperm epimutation biomarkers for specific diseases. PLoS ONE 2018, 13, e0202662. [Google Scholar] [CrossRef]
- Leitz, J.; Kuballa, T.; Rehm, J.; Lachenmeier, D.W. Chemical analysis and risk assessment of diethyl phthalate in alcoholic beverages with special regard to unrecorded alcohol. PLoS ONE 2009, 4, e8127. [Google Scholar] [CrossRef]
- LaPlante, C.D.; Vandenberg, L.N. Data describing lack of effects of 17alpha-ethinyl estradiol on mammary gland morphology in female mice exposed during pregnancy and lactation. Data Brief 2017, 14, 337–343. [Google Scholar] [CrossRef]
- Yang, B.; Zou, W.; Hu, Z.; Liu, F.; Zhou, L.; Yang, S.; Kuang, H.; Wu, L.; Wei, J.; Wang, J.; et al. Involvement of oxidative stress and inflammation in liver injury caused by perfluorooctanoic acid exposure in mice. BioMed. Res. Int. 2014, 2014, 409837. [Google Scholar] [CrossRef]
- Coban, A.; Filipov, N.M. Dopaminergic toxicity associated with oral exposure to the herbicide atrazine in juvenile male C57BL/6 mice. J. Neurochem. 2007, 100, 1177–1187. [Google Scholar] [CrossRef] [PubMed]
- Siracusa, R.; Scuto, M.; Fusco, R.; Trovato, A.; Ontario, M.L.; Crea, R.; Di Paola, R.; Cuzzocrea, S.; Calabrese, V. Anti-inflammatory and Anti-oxidant Activity of Hidrox((R)) in Rotenone-Induced Parkinson’s Disease in Mice. Antioxidants 2020, 9, 824. [Google Scholar] [CrossRef] [PubMed]
- D’Amico, R.; Fusco, R.; Cordaro, M.; Siracusa, R.; Peritore, A.F.; Gugliandolo, E.; Crupi, R.; Scuto, M.; Cuzzocrea, S.; Di Paola, R.; et al. Modulation of NLRP3 Inflammasome through Formyl Peptide Receptor 1 (Fpr-1) Pathway as a New Therapeutic Target in Bronchiolitis Obliterans Syndrome. Int. J. Mol. Sci. 2020, 21, 2144. [Google Scholar] [CrossRef] [PubMed]
- Fusco, R.; Cordaro, M.; Genovese, T.; Impellizzeri, D.; Siracusa, R.; Gugliandolo, E.; Peritore, A.F.; D’Amico, R.; Crupi, R.; Cuzzocrea, S.; et al. Adelmidrol: A New Promising Antioxidant and Anti-Inflammatory Therapeutic Tool in Pulmonary Fibrosis. Antioxidants 2020, 9, 601. [Google Scholar] [CrossRef] [PubMed]
- Peritore, A.F.; D’Amico, R.; Siracusa, R.; Cordaro, M.; Fusco, R.; Gugliandolo, E.; Genovese, T.; Crupi, R.; Di Paola, R.; Cuzzocrea, S.; et al. Management of Acute Lung Injury: Palmitoylethanolamide as a New Approach. Int. J. Mol. Sci. 2021, 22, 5533. [Google Scholar] [CrossRef]
- Fusco, R.; Cordaro, M.; Siracusa, R.; D’Amico, R.; Genovese, T.; Gugliandolo, E.; Peritore, A.F.; Crupi, R.; Impellizzeri, D.; Cuzzocrea, S.; et al. Biochemical Evaluation of the Antioxidant Effects of Hydroxytyrosol on Pancreatitis-Associated Gut Injury. Antioxidants 2020, 9, 781. [Google Scholar] [CrossRef]
- Lee, J.E.; Sim, H.; Yoo, H.M.; Lee, M.; Baek, A.; Jeon, Y.J.; Seo, K.S.; Son, M.Y.; Yoon, J.S.; Kim, J. Neuroprotective Effects of Cryptotanshinone in a Direct Reprogramming Model of Parkinson’s Disease. Molecules 2020, 25, 3602. [Google Scholar] [CrossRef]
- Zhi, Y.; Jin, Y.; Pan, L.; Zhang, A.; Liu, F. Schisandrin A ameliorates MPTP-induced Parkinson’s disease in a mouse model via regulation of brain autophagy. Arch. Pharm. Res. 2019, 42, 1012–1020. [Google Scholar] [CrossRef]
- Nuzzo, D.; Galizzi, G.; Amato, A.; Terzo, S.; Picone, P.; Cristaldi, L.; Mule, F.; Di Carlo, M. Regular Intake of Pistachio Mitigates the Deleterious Effects of a High Fat-Diet in the Brain of Obese Mice. Antioxidants 2020, 9, 317. [Google Scholar] [CrossRef]
- Cordaro, M.; Siracusa, R.; Fusco, R.; D’Amico, R.; Peritore, A.F.; Gugliandolo, E.; Genovese, T.; Scuto, M.; Crupi, R.; Mandalari, G.; et al. Cashew (Anacardium occidentale L.) Nuts Counteract Oxidative Stress and Inflammation in an Acute Experimental Model of Carrageenan-Induced Paw Edema. Antioxidants 2020, 9, 660. [Google Scholar] [CrossRef]
- Cordaro, M.; Fusco, R.; D’Amico, R.; Siracusa, R.; Peritore, A.F.; Gugliandolo, E.; Genovese, T.; Crupi, R.; Mandalari, G.; Cuzzocrea, S.; et al. Cashew (Anacardium occidentale L.) Nuts Modulate the Nrf2 and NLRP3 Pathways in Pancreas and Lung after Induction of Acute Pancreatitis by Cerulein. Antioxidants 2020, 9, 992. [Google Scholar] [CrossRef] [PubMed]
- Aras, S.; Tanriover, G.; Aslan, M.; Yargicoglu, P.; Agar, A. The role of nitric oxide on visual-evoked potentials in MPTP-induced Parkinsonism in mice. Neurochem. Int. 2014, 72, 48–57. [Google Scholar] [CrossRef] [PubMed]
- Campolo, M.; Casili, G.; Biundo, F.; Crupi, R.; Cordaro, M.; Cuzzocrea, S.; Esposito, E. The Neuroprotective Effect of Dimethyl Fumarate in an MPTP-Mouse Model of Parkinson’s Disease: Involvement of Reactive Oxygen Species/Nuclear Factor-kappaB/Nuclear Transcription Factor Related to NF-E2. Antioxid. Redox Signal. 2017, 27, 453–471. [Google Scholar] [CrossRef] [PubMed]
- Siracusa, R.; Paterniti, I.; Cordaro, M.; Crupi, R.; Bruschetta, G.; Campolo, M.; Cuzzocrea, S.; Esposito, E. Neuroprotective Effects of Temsirolimus in Animal Models of Parkinson’s Disease. Mol. Neurobiol. 2018, 55, 2403–2419. [Google Scholar] [CrossRef]
- Peritore, A.F.; Crupi, R.; Scuto, M.; Gugliandolo, E.; Siracusa, R.; Impellizzeri, D.; Cordaro, M.; D’Amico, R.; Fusco, R.; Di Paola, R.; et al. The Role of Annexin A1 and Formyl Peptide Receptor 2/3 Signaling in Chronic Corticosterone-Induced Depression-Like behaviors and Impairment in Hippocampal-Dependent Memory. CNS Neurol. Disord. Drug Targets 2020, 19, 27–43. [Google Scholar] [CrossRef]
- Fusco, R.; Gugliandolo, E.; Siracusa, R.; Scuto, M.; Cordaro, M.; D’Amico, R.; Evangelista, M.; Peli, A.; Peritore, A.F.; Impellizzeri, D.; et al. Formyl Peptide Receptor 1 Signaling in Acute Inflammation and Neural Differentiation Induced by Traumatic Brain Injury. Biology 2020, 9, 938. [Google Scholar] [CrossRef]
- D’Amico, R.; Trovato Salinaro, A.; Fusco, R.; Cordaro, M.; Impellizzeri, D.; Scuto, M.; Ontario, M.L.; Lo Dico, G.; Cuzzocrea, S.; Di Paola, R.; et al. Hericium erinaceus and Coriolus versicolor Modulate Molecular and Biochemical Changes after Traumatic Brain Injury. Antioxidants 2021, 10, 898. [Google Scholar] [CrossRef]
- Attar, A.; Liu, T.; Chan, W.T.; Hayes, J.; Nejad, M.; Lei, K.; Bitan, G. A shortened Barnes maze protocol reveals memory deficits at 4-months of age in the triple-transgenic mouse model of Alzheimer’s disease. PLoS ONE 2013, 8, e80355. [Google Scholar] [CrossRef]
- Yokoyama, H.; Kuroiwa, H.; Yano, R.; Araki, T. Targeting reactive oxygen species, reactive nitrogen species and inflammation in MPTP neurotoxicity and Parkinson’s disease. Neurol. Sci. 2008, 29, 293–301. [Google Scholar] [CrossRef]
- Gore, A.C.; Chappell, V.A.; Fenton, S.E.; Flaws, J.A.; Nadal, A.; Prins, G.S.; Toppari, J.; Zoeller, R.T. EDC-2: The Endocrine Society’s Second Scientific Statement on Endocrine-Disrupting Chemicals. Endocr. Rev. 2015, 36, E1–E150. [Google Scholar] [CrossRef]
- Kassotis, C.D.; Vandenberg, L.N.; Demeneix, B.A.; Porta, M.; Slama, R.; Trasande, L. Endocrine-disrupting chemicals: Economic, regulatory, and policy implications. Lancet Diabetes Endocrinol. 2020, 8, 719–730. [Google Scholar] [CrossRef]
- Kalofiri, P.; Balias, G.; Tekos, F. The EU endocrine disruptors’ regulation and the glyphosate controversy. Toxicol. Rep. 2021, 8, 1193–1199. [Google Scholar] [CrossRef] [PubMed]
- He, H.; Liu, Y.; You, S.; Liu, J.; Xiao, H.; Tu, Z. A Review on Recent Treatment Technology for Herbicide Atrazine in Contaminated Environment. Int. J. Environ. Res. Public Health 2019, 16, 5129. [Google Scholar] [CrossRef]
- Ma, K.; Wu, H.Y.; Wang, S.Y.; Li, B.X. The Keap1/Nrf2-ARE signaling pathway is involved in atrazine induced dopaminergic neurons degeneration via microglia activation. Ecotoxicol. Environ. Saf. 2021, 226, 112862. [Google Scholar] [CrossRef] [PubMed]
- Gao, S.; Wang, Z.; Zhang, C.; Jia, L.; Zhang, Y. Oral Exposure to Atrazine Induces Oxidative Stress and Calcium Homeostasis Disruption in Spleen of Mice. Oxid. Med. Cell. Longev 2016, 2016, 7978219. [Google Scholar] [CrossRef] [PubMed]
- Li, J.; Li, X.; Bi, H.; Ma, K.; Li, B. Developmental Exposure to Atrazine Impairs Spatial Memory and Downregulates the Hippocampal D1 Dopamine Receptor and cAMP-Dependent Signaling Pathway in Rats. Int. J. Mol. Sci. 2018, 19, 2241. [Google Scholar] [CrossRef] [PubMed]
- Masato, A.; Plotegher, N.; Boassa, D.; Bubacco, L. Impaired dopamine metabolism in Parkinson’s disease pathogenesis. Mol. Neurodegener. 2019, 14, 35. [Google Scholar] [CrossRef]
- Teil, M.; Arotcarena, M.L.; Faggiani, E.; Laferriere, F.; Bezard, E.; Dehay, B. Targeting alpha-synuclein for PD Therapeutics: A Pursuit on All Fronts. Biomolecules 2020, 10, 391. [Google Scholar] [CrossRef]
- Guzman, J.N.; Sanchez-Padilla, J.; Wokosin, D.; Kondapalli, J.; Ilijic, E.; Schumacker, P.T.; Surmeier, D.J. Oxidant stress evoked by pacemaking in dopaminergic neurons is attenuated by DJ-1. Nature 2010, 468, 696–700. [Google Scholar] [CrossRef]
- Surmeier, D.J.; Halliday, G.M.; Simuni, T. Calcium, mitochondrial dysfunction and slowing the progression of Parkinson’s disease. Exp. Neurol. 2017, 298, 202–209. [Google Scholar] [CrossRef]
- Devine, M.J.; Ryten, M.; Vodicka, P.; Thomson, A.J.; Burdon, T.; Houlden, H.; Cavaleri, F.; Nagano, M.; Drummond, N.J.; Taanman, J.W.; et al. Parkinson’s disease induced pluripotent stem cells with triplication of the alpha-synuclein locus. Nat. Commun. 2011, 2, 440. [Google Scholar] [CrossRef] [PubMed]
- Vivekanantham, S.; Shah, S.; Dewji, R.; Dewji, A.; Khatri, C.; Ologunde, R. Neuroinflammation in Parkinson’s disease: Role in neurodegeneration and tissue repair. Int. J. Neurosci. 2015, 125, 717–725. [Google Scholar] [CrossRef] [PubMed]
- Yang, Y.; Kong, F.; Ding, Q.; Cai, Y.; Hao, Y.; Tang, B. Bruceine D elevates Nrf2 activation to restrain Parkinson’s disease in mice through suppressing oxidative stress and inflammatory response. Biochem. Biophys. Res. Commun. 2020, 526, 1013–1020. [Google Scholar] [CrossRef] [PubMed]
- Gao, C.; He, H.; Qiu, W.; Zheng, Y.; Chen, Y.; Hu, S.; Zhao, X. Oxidative Stress, Endocrine Disturbance, and Immune Interference in Humans Showed Relationships to Serum Bisphenol Concentrations in a Dense Industrial Area. Environ. Sci. Technol. 2021, 55, 1953–1963. [Google Scholar] [CrossRef]
- Meli, R.; Monnolo, A.; Annunziata, C.; Pirozzi, C.; Ferrante, M.C. Oxidative Stress and BPA Toxicity: An Antioxidant Approach for Male and Female Reproductive Dysfunction. Antioxidants 2020, 9, 405. [Google Scholar] [CrossRef]
- Cordaro, M.; D’Amico, R.; Morabito, R.; Fusco, R.; Siracusa, R.; Peritore, A.F.; Impellizzeri, D.; Genovese, T.; Crupi, R.; Gugliandolo, E.; et al. Physiological and Biochemical Changes in NRF2 Pathway in Aged Animals Subjected to Brain Injury. Cell. Physiol. Biochem. 2021, 55, 160–179. [Google Scholar] [CrossRef]
- He, J.; Zhong, W.; Zhang, M.; Zhang, R.; Hu, W. P38 Mitogen-activated Protein Kinase and Parkinson’s Disease. Transl. Neurosci. 2018, 9, 147–153. [Google Scholar] [CrossRef]


Publisher’s Note: MDPI stays neutral with regard to jurisdictional claims in published maps and institutional affiliations. |
© 2022 by the authors. Licensee MDPI, Basel, Switzerland. This article is an open access article distributed under the terms and conditions of the Creative Commons Attribution (CC BY) license (https://creativecommons.org/licenses/by/4.0/).
Share and Cite
D’Amico, R.; Gugliandolo, E.; Siracusa, R.; Cordaro, M.; Genovese, T.; Peritore, A.F.; Crupi, R.; Interdonato, L.; Di Paola, D.; Cuzzocrea, S.; et al. Toxic Exposure to Endocrine Disruptors Worsens Parkinson’s Disease Progression through NRF2/HO-1 Alteration. Biomedicines 2022, 10, 1073. https://doi.org/10.3390/biomedicines10051073
D’Amico R, Gugliandolo E, Siracusa R, Cordaro M, Genovese T, Peritore AF, Crupi R, Interdonato L, Di Paola D, Cuzzocrea S, et al. Toxic Exposure to Endocrine Disruptors Worsens Parkinson’s Disease Progression through NRF2/HO-1 Alteration. Biomedicines. 2022; 10(5):1073. https://doi.org/10.3390/biomedicines10051073
Chicago/Turabian StyleD’Amico, Ramona, Enrico Gugliandolo, Rosalba Siracusa, Marika Cordaro, Tiziana Genovese, Alessio Filippo Peritore, Rosalia Crupi, Livia Interdonato, Davide Di Paola, Salvatore Cuzzocrea, and et al. 2022. "Toxic Exposure to Endocrine Disruptors Worsens Parkinson’s Disease Progression through NRF2/HO-1 Alteration" Biomedicines 10, no. 5: 1073. https://doi.org/10.3390/biomedicines10051073