
One Year in the Extreme Isolation of Antarctica—Is This Enough to Modulate an “Allergic” Sensitization?

 , , , and
Abstract
:1. Introduction
2. Materials and Methods
2.1. Station Description and Original Study Protocol
2.2. Biochemical Measurements
| <20 kU/L—Allergy unlikely | 20–100 kU/L—Allergy possible | >100 kU/L—Allergy likely |
2.3. Questionnaire
2.4. Statistical Analyses
3. Results
3.1. Demographic Data
3.2. The ALEX Test
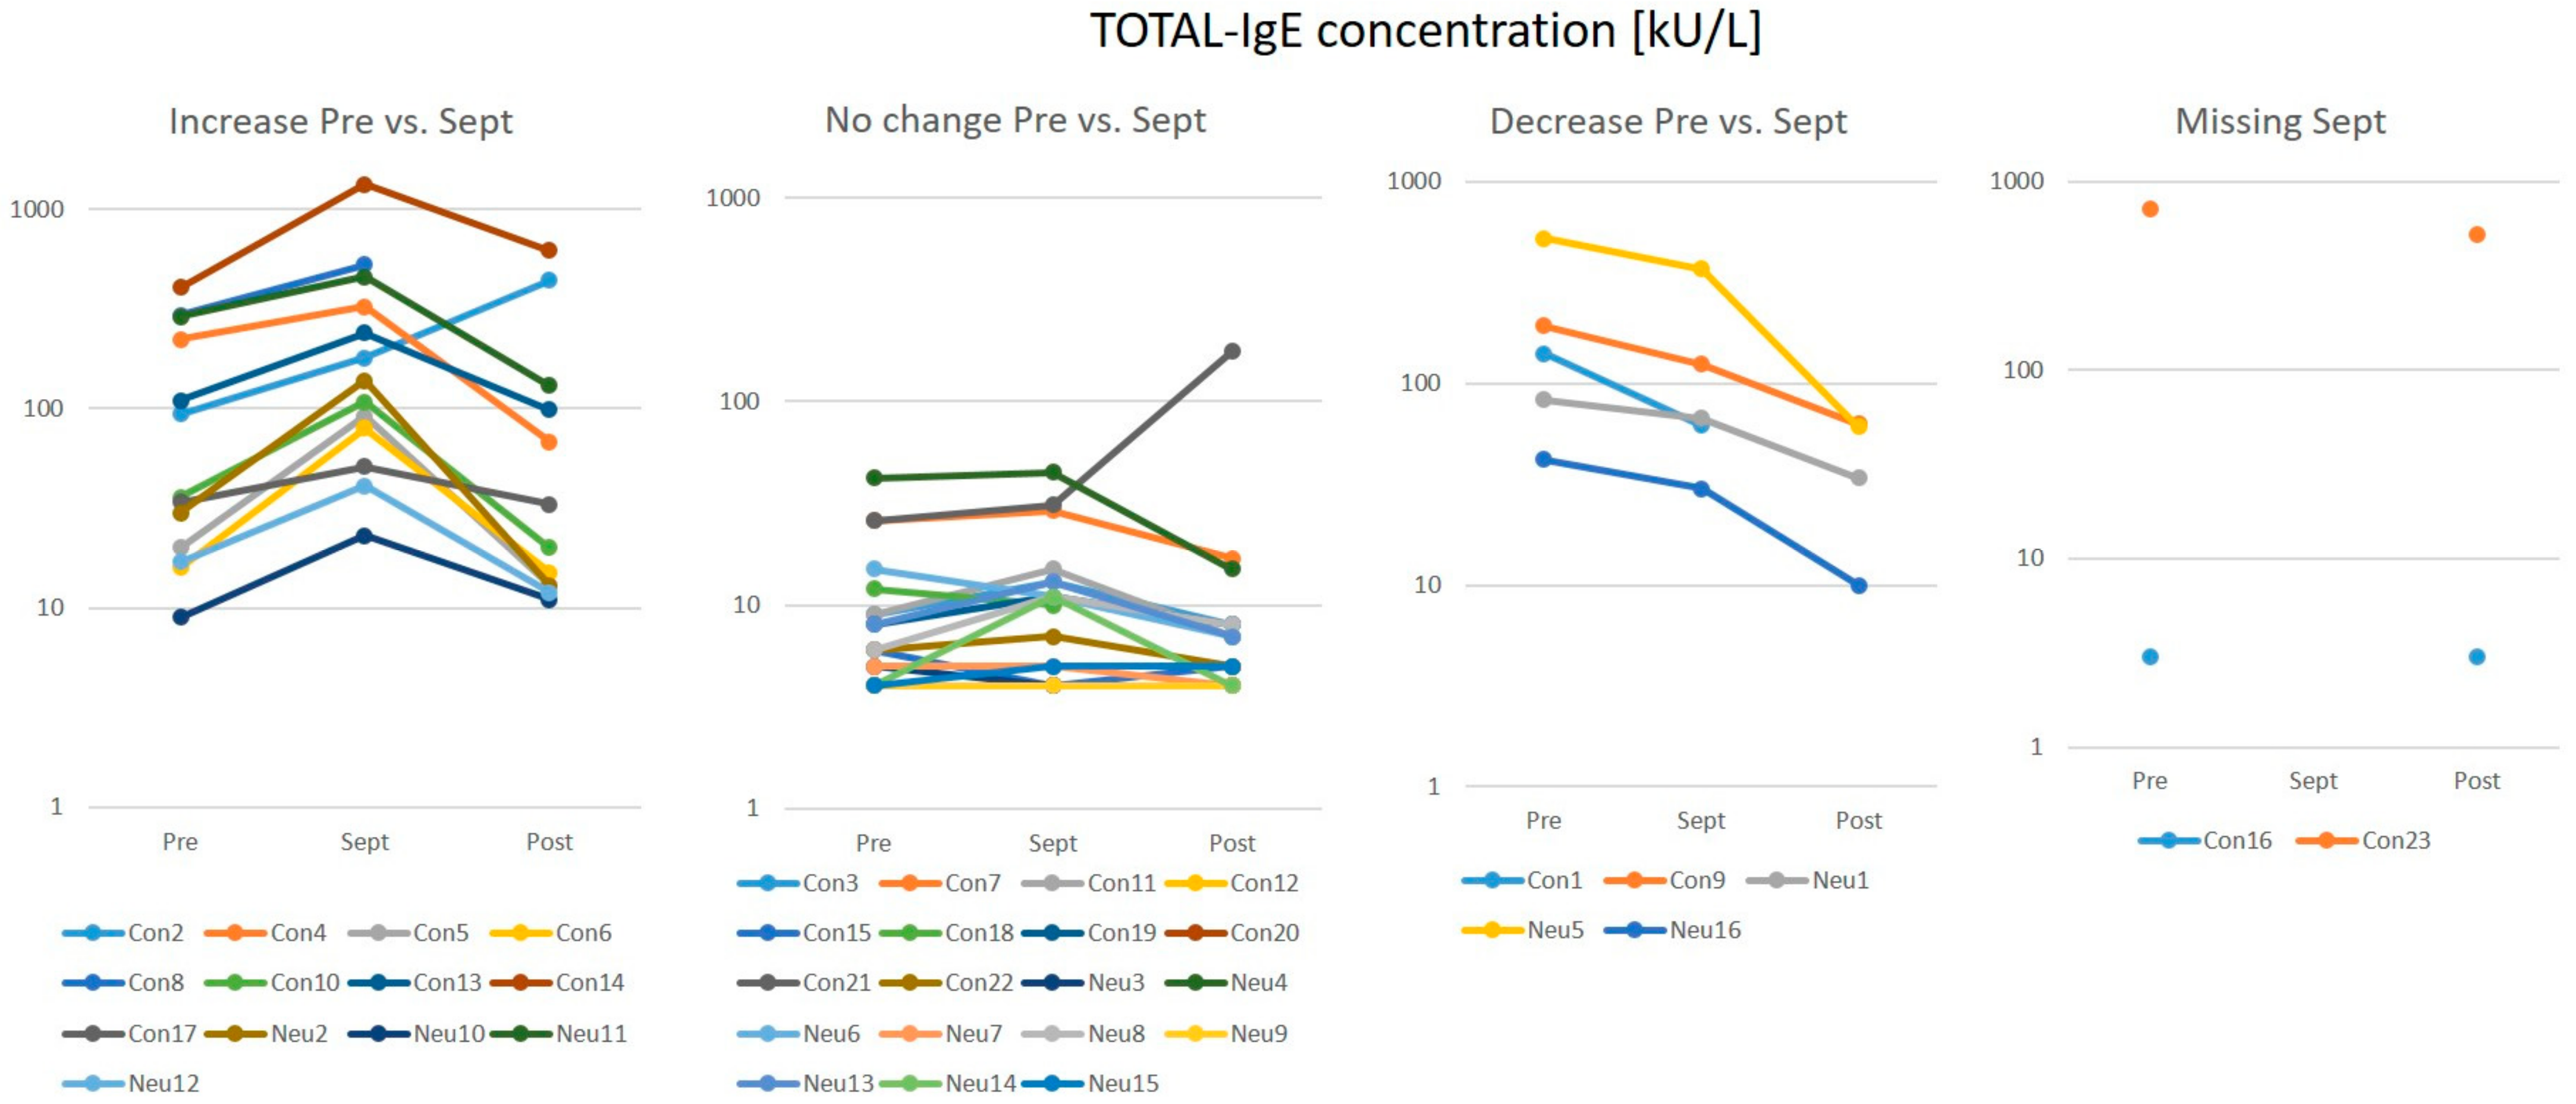
Total IgE
3.3. Specific IgEs
3.4. Grass Pollen
3.5. Tree Pollen
3.6. House Dust Mites & Storage Mites
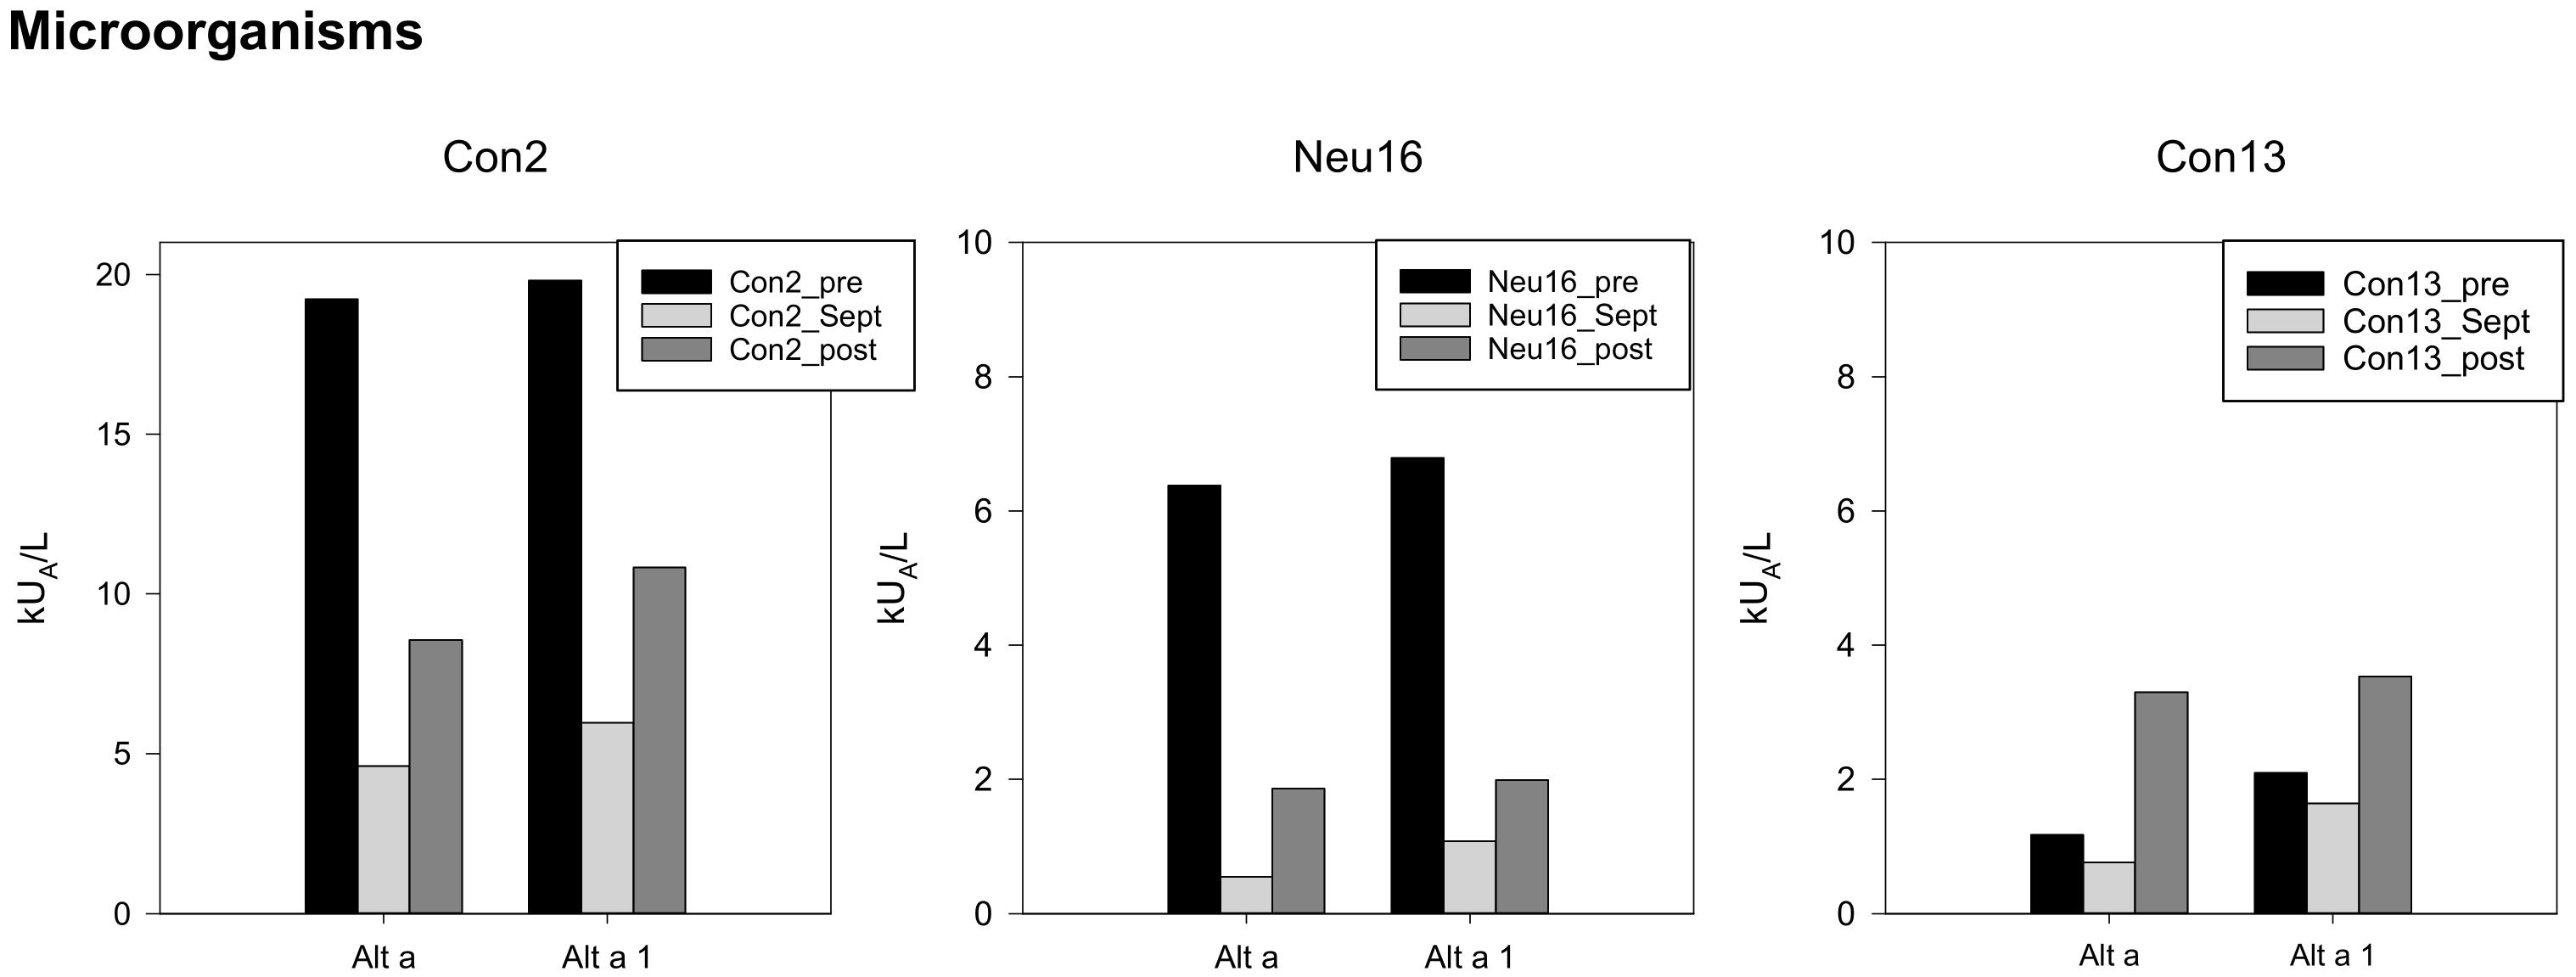
3.7. Microorganisms
3.8. Pets
3.9. Questionnaires and ALEX Results
4. Discussion
Limitations
Supplementary Materials
Author Contributions
Funding
Institutional Review Board Statement
Informed Consent Statement
Data Availability Statement
Acknowledgments
Conflicts of Interest
References
- Divison, A.A. Antarctic Weather. Available online: https://www.antarctica.gov.au/about-antarctica/weather-and-climate/weather/ (accessed on 26 January 2021).
- Feuerecker, M.; Crucian, B.E.; Quintens, R.; Buchheim, J.I.; Salam, A.P.; Rybka, A.; Moreels, M.; Strewe, C.; Stowe, R.; Mehta, S.; et al. Immune sensitization during 1 year in the Antarctic high-altitude Concordia Environment. Allergy 2019, 74, 64–77. [Google Scholar] [CrossRef]
- Strewe, C.; Moser, D.; Buchheim, J.I.; Gunga, H.C.; Stahn, A.; Crucian, B.E.; Fiedel, B.; Bauer, H.; Gossmann-Lang, P.; Thieme, D.; et al. Sex differences in stress and immune responses during confinement in Antarctica. Biol. Sex. Differ. 2019, 10, 20. [Google Scholar] [CrossRef] [PubMed]
- Feuerecker, M.; Crucian, B.; Salam, A.P.; Rybka, A.; Kaufmann, I.; Moreels, M.; Quintens, R.; Schelling, G.; Thiel, M.; Baatout, S.; et al. Early adaption to the antarctic environment at dome C: Consequences on stress-sensitive innate immune functions. High. Alt. Med. Biol. 2014, 15, 341–348. [Google Scholar] [CrossRef] [PubMed]
- Strewe, C.; Thieme, D.; Dangoisse, C.; Fiedel, B.; van den Berg, F.; Bauer, H.; Salam, A.P.; Gossmann-Lang, P.; Campolongo, P.; Moser, D.; et al. Modulations of Neuroendocrine Stress Responses during Confinement in Antarctica and the Role of Hypobaric Hypoxia. Front. Physiol. 2018, 9, 1647. [Google Scholar] [CrossRef] [PubMed]
- Lund, S.M.; Dowdle, E.B. The effect of prolonged isolation from environmental allergens on the clinical and laboratory manifestations of the allergic state. Observation on members of the South African Antarctic expedition. S. Afr. Med. J. 1977, 52, 556–561. [Google Scholar] [PubMed]
- Bojcukova, J.; Vlas, T.; Forstenlechner, P.; Panzner, P. Comparison of two multiplex arrays in the diagnostics of allergy. Clin. Transl. Allergy 2019, 9, 31. [Google Scholar] [CrossRef]
- Feuerecker, M.; Mayer, W.; Kaufmann, I.; Gruber, M.; Muckenthaler, F.; Yi, B.; Salam, A.P.; Briegel, J.; Schelling, G.; Thiel, M.; et al. A corticoid-sensitive cytokine release assay for monitoring stress-mediated immune modulation. Clin. Exp. Immunol. 2013, 172, 290–299. [Google Scholar] [CrossRef] [PubMed]
- Louis, R.; Pilette, C.; Michel, O.; Michils, A.; Brusselle, G.; Poskin, A.; Van Schoor, J.; Denhaerynck, K.; Vancayzeele, S.; Abraham, I.; et al. Variability in total serum IgE over 1 year in severe asthmatics. Allergy Asthma Clin. Immunol. 2019, 15, 20. [Google Scholar] [CrossRef] [PubMed]
- Amaral, A.F.S.; Newson, R.B.; Abramson, M.J.; Anto, J.M.; Bono, R.; Corsico, A.G.; de Marco, R.; Demoly, P.; Forsberg, B.; Gislason, T.; et al. Changes in IgE sensitization and total IgE levels over 20 years of follow-up. J. Allergy Clin. Immunol. 2016, 137, 1788–1795.e9. [Google Scholar] [CrossRef] [PubMed] [Green Version]
- Martins, T.B.; Bandhauer, M.E.; Bunker, A.M.; Roberts, W.L.; Hill, H.R. New childhood and adult reference intervals for total IgE. J. Allergy Clin. Immunol. 2014, 133, 589. [Google Scholar] [CrossRef] [PubMed]
- Ansotegui, I.J.; Melioli, G.; Canonica, G.W.; Caraballo, L.; Villa, E.; Ebisawa, M.; Passalacqua, G.; Savi, E.; Ebo, D.; Gomez, R.M.; et al. IgE allergy diagnostics and other relevant tests in allergy, a World Allergy Organization position paper. World Allergy Organ. J. 2020, 13, 100080. [Google Scholar] [CrossRef] [PubMed]
- Morris, D.O. Human allergy to environmental pet danders: A public health perspective. Vet. Dermatol. 2010, 21, 441–449. [Google Scholar] [CrossRef] [PubMed]
- Van Houdt, R.; De Boever, P.; Coninx, I.; Le Calvez, C.; Dicasillati, R.; Mahillon, J.; Mergeay, M.; Leys, N. Evaluation of the airborne bacterial population in the periodically confined Antarctic base Concordia. Microb. Ecol. 2009, 57, 640–648. [Google Scholar] [CrossRef] [PubMed]
- MacGillivray, D.M.; Kollmann, T.R. The role of environmental factors in modulating immune responses in early life. Front. Immunol. 2014, 5, 434. [Google Scholar] [CrossRef] [PubMed] [Green Version]
- Ter Horst, R.; Jaeger, M.; Smeekens, S.P.; Oosting, M.; Swertz, M.A.; Li, Y.; Kumar, V.; Diavatopoulos, D.A.; Jansen, A.F.M.; Lemmers, H.; et al. Host and Environmental Factors Influencing Individual Human Cytokine Responses. Cell 2016, 167, 1111–1124.e13. [Google Scholar] [CrossRef] [PubMed] [Green Version]
- Yi, B.; Rykova, M.; Jager, G.; Feuerecker, M.; Horl, M.; Matzel, S.; Ponomarev, S.; Vassilieva, G.; Nichiporuk, I.; Chouker, A. Influences of large sets of environmental exposures on immune responses in healthy adult men. Sci. Rep. 2015, 5, 13367. [Google Scholar] [CrossRef] [PubMed]
- Hamilton, R.G.; Kleine-Tebbe, J. Molecular Allergy Diagnostics: Analytical Features That Support Clinical Decisions. Curr. Allergy Asthma Rep. 2015, 15, 57. [Google Scholar] [CrossRef] [PubMed]
- Agha, N.H.; Baker, F.L.; Kunz, H.E.; Spielmann, G.; Mylabathula, P.L.; Rooney, B.V.; Mehta, S.K.; Pierson, D.L.; Laughlin, M.S.; Markofski, M.M.; et al. Salivary antimicrobial proteins and stress biomarkers are elevated during a 6-month mission to the International Space Station. J. Appl. Physiol. (1985) 2020, 128, 264–275. [Google Scholar] [CrossRef] [PubMed]
- Voorhies, A.A.; Mark Ott, C.; Mehta, S.; Pierson, D.L.; Crucian, B.E.; Feiveson, A.; Oubre, C.M.; Torralba, M.; Moncera, K.; Zhang, Y.; et al. Study of the impact of long-duration space missions at the International Space Station on the astronaut microbiome. Sci. Rep. 2019, 9, 9911. [Google Scholar] [CrossRef] [PubMed]
- Crucian, B.; Johnston, S.; Mehta, S.; Stowe, R.; Uchakin, P.; Quiriarte, H.; Pierson, D.; Laudenslager, M.L.; Sams, C. A case of persistent skin rash and rhinitis with immune system dysregulation onboard the International Space Station. Allergy Clin. Immunol. Pract. 2016, 4, 759–762.e8. [Google Scholar] [CrossRef] [PubMed]


| Concordia | Neumayer III | All | |
|---|---|---|---|
| Number | 23 | 16 | 39 |
| Gender [m/f] | 21/2 | 11/5 | 32/7 |
| Age during WO [years] | 36.5 ± 10.9 (23–62) | 33.3 ± 4.8 (25–42) | 35.2 ± 9.0 (23–62) |
| Height [cm] | 175.3 ± 7.1 (165–191) | 175.6 ± 9.0 (157–188) | 175.5 ±7.8 (157–191) |
| Weight [kg] | 76.6 ± 13.2 (58–107) | 78.3 ± 17.0 (52–109) | 77.3 ± 14.7 (52–109) |
| Body mass index [kg/m2] | 24.9 ± 3.8 (19.7–33.3) | 25.1 ± 3.8 (19.8–34.4) | 25.0 ± 3.8 (19.7–34.4) |
| Participant. | Pollen | Mites | Micro-Organisms | Plant-Based Food | Animal-Derived Food | Insects & Venoms | Epithelial Tissues of Animals | Others | Cross-Reactive Allergen Families | Total IgE | History of Allergy | Type of Allergy, Symptoms and Development | ||||||||||||||||
|---|---|---|---|---|---|---|---|---|---|---|---|---|---|---|---|---|---|---|---|---|---|---|---|---|---|---|---|---|
| Grass Pollen | Tree Pollen | Weed | House Dust Mites & Storage Mites | Fungal Spores & Yeast | Legumes | Fruits | Vegetables & mushrooms | Nuts & Seeds | Fish & Seafood | Meat | Bee, Wasp | Pets | Latex | Profilin | PR-10 | Ole e 1 Family | LTPs | Lipocalins | NPC2 | Serum albumin | Tropo-myosin | (kU/L) | ||||||
| Con2_pre | 3 | 0 | 1 | 3 | 4 | 0 | 0 | 0 | 0 | 0 | 0 | 0 | 1 | 0 | 0 | 0 | 1 | 0 | 0 | 3 | 0 | 0 | 94 | no | ||||
| Con2_Sept | 3 | 0 | 0 | 3 | 3 | 0 | 0 | 0 | 0 | 0 | 0 | 0 | 0 | 0 | 0 | 0 | 0 | 0 | 0 | 3 | 0 | 0 | 179 | |||||
| Con2_post | 3 | 0 | 0 | 3 | 3 | 0 | 0 | 0 | 0 | 0 | 0 | 0 | 0 | 0 | 0 | 0 | 0 | 0 | 0 | 3 | 0 | 0 | 441 | |||||
| Con3_pre | 0 | 0 | 0 | 0 | 0 | 0 | 0 | 0 | 0 | 0 | 0 | 0 | 0 | 0 | 0 | 0 | 0 | 0 | 0 | 0 | 0 | 0 | 9 | no | ||||
| Con3_Sept | 0 | 0 | 0 | 0 | 0 | 0 | 0 | 0 | 0 | 0 | 0 | 1 | 0 | 0 | 0 | 0 | 0 | 0 | 0 | 0 | 0 | 0 | 13 | |||||
| Con3_post | 0 | 0 | 0 | 0 | 0 | 0 | 0 | 0 | 0 | 0 | 0 | 0 | 0 | 0 | 0 | 0 | 0 | 0 | 0 | 0 | 0 | 0 | 8 | |||||
| Con4_pre | 4 | 3 | 0 | 2 | 0 | 1 | 0 | 1 | 1 | 0 | 0 | 2 | 0 | 2 | 2 | 3 | 2 | 0 | 0 | 0 | 0 | 0 | 223 | yes | hay fever, reactions to insect bites, younger age allergy towards cats/dogs, food reactions | |||
| Con4_Sept | 4 | 2 | 0 | 2 | 0 | 1 | 0 | 1 | 1 | 0 | 0 | 1 | 0 | 0 | 2 | 2 | 2 | 0 | 0 | 0 | 0 | 0 | 324 | |||||
| Con4_post | 3 | 2 | 0 | 2 | 0 | 1 | 1 | 0 | 1 | 0 | 0 | 1 | 0 | 2 | 2 | 2 | 2 | 0 | 0 | 0 | 0 | 0 | 68 | afterwards, same reactions as before, but more hay fever | ||||
| Con6_pre | 2 | 0 | 0 | 0 | 0 | 0 | 0 | 0 | 0 | 0 | 0 | 0 | 0 | 0 | 0 | 0 | 0 | 0 | 0 | 0 | 0 | 0 | 16 | no | ||||
| Con6_Sept | 2 | 0 | 0 | 0 | 0 | 0 | 0 | 0 | 0 | 0 | 0 | 0 | 0 | 0 | 0 | 0 | 0 | 0 | 0 | 0 | 0 | 0 | 80 | |||||
| Con6_post | 2 | 0 | 0 | 0 | 0 | 0 | 0 | 0 | 0 | 0 | 0 | 0 | 0 | 0 | 0 | 0 | 0 | 0 | 0 | 0 | 0 | 0 | 15 | |||||
| Con9_pre | 2 | 1 | 1 | 0 | 0 | 0 | 0 | 0 | 0 | 0 | 0 | 0 | 0 | 0 | 0 | 0 | 1 | 0 | 0 | 0 | 0 | 0 | 193 | yes | hay fever (pollen from olive trees) | |||
| Con9_Sept | 2 | 0 | 1 | 0 | 0 | 0 | 0 | 0 | 0 | 0 | 0 | 0 | 0 | 0 | 0 | 0 | 0 | 0 | 0 | 0 | 0 | 0 | 124 | |||||
| Con9_post | 2 | 2 | 0 | 0 | 0 | 0 | 0 | 0 | 0 | 0 | 0 | 0 | 0 | 0 | 0 | 0 | 2 | 0 | 0 | 0 | 0 | 0 | 63 | no hay fever after return | ||||
| Con15_pre | 0 | 0 | 0 | 2 | 0 | 0 | 0 | 0 | 0 | 0 | 0 | 0 | 0 | 0 | 0 | 0 | 0 | 0 | 0 | 2 | 0 | 0 | 6 | yes | hay fever (varying with years), dust mites | |||
| Con15_Sept | 0 | 0 | 0 | 2 | 0 | 0 | 0 | 0 | 0 | 0 | 0 | 0 | 0 | 0 | 0 | 0 | 0 | 0 | 0 | 2 | 0 | 0 | 4 | |||||
| Con15_post | 0 | 0 | 0 | 2 | 0 | 0 | 0 | 0 | 0 | 0 | 0 | 0 | 0 | 0 | 0 | 0 | 0 | 0 | 0 | 2 | 0 | 0 | 5 | worse hay fever after return | ||||
| Con17_pre | 0 | 0 | 0 | 0 | 0 | 0 | 0 | 0 | 0 | 0 | 0 | 1 | 0 | 0 | 0 | 0 | 0 | 0 | 0 | 0 | 0 | 0 | 34 | no | ||||
| Con17_Sept | 0 | 0 | 0 | 0 | 0 | 0 | 0 | 0 | 0 | 0 | 0 | 0 | 0 | 0 | 0 | 0 | 0 | 0 | 0 | 0 | 0 | 0 | 51 | |||||
| Con17_post | 0 | 0 | 0 | 0 | 0 | 0 | 0 | 0 | 0 | 0 | 0 | 0 | 0 | 0 | 0 | 0 | 0 | 0 | 0 | 0 | 0 | 0 | 33 | |||||
| Con21_pre | 2 | 0 | 0 | 0 | 0 | 0 | 0 | 0 | 0 | 0 | 0 | 0 | 1 | 0 | 0 | 0 | 0 | 0 | 0 | 0 | 0 | 0 | 26 | yes afterwards | ||||
| Con21_Sept | 1 | 0 | 0 | 0 | 0 | 0 | 0 | 0 | 0 | 0 | 0 | 0 | 1 | 0 | 0 | 0 | 0 | 0 | 0 | 0 | 0 | 0 | 31 | |||||
| Con21_post | 1 | 2 | 0 | 0 | 0 | 0 | 0 | 0 | 0 | 0 | 1 | 0 | 3 | 0 | 0 | 0 | 2 | 0 | 2 | 0 | 3 | 0 | 176 | newly experienced hay fever directly after return for a couple of days | ||||
| Con23_pre | 1 | 2 | 2 | 0 | 0 | 0 | 0 | 0 | 0 | 0 | 2 | 0 | 4 | 0 | 0 | 1 | 2 | 0 | 2 | 0 | 4 | 0 | 719 | yes | cats, dogs, rats -> wheezing | |||
| Con23_Sept | missing | |||||||||||||||||||||||||||
| Con23_post | 1 | 2 | 0 | 0 | 0 | 0 | 0 | 0 | 0 | 0 | 0 | 0 | 3 | 0 | 0 | 0 | 2 | 0 | 2 | 0 | 3 | 0 | 521 | new allergic reactions to gras/flowers ->hay fever, wheezing, throat swelling | ||||
| Neu4_pre | 0 | 2 | 0 | 0 | 0 | 0 | 0 | 0 | 1 | 0 | 0 | 0 | 1 | 0 | 0 | 2 | 0 | 0 | 0 | 0 | 0 | 0 | 41 | yes | grass and rabbit allergy | |||
| Neu4_Sept | 0 | 2 | 0 | 0 | 0 | 0 | 0 | 0 | 0 | 0 | 0 | 0 | 1 | 0 | 0 | 2 | 0 | 0 | 0 | 0 | 0 | 0 | 45 | |||||
| Neu4_post | 0 | 2 | 0 | 0 | 0 | 0 | 0 | 0 | 0 | 0 | 0 | 0 | 1 | 0 | 0 | 2 | 0 | 0 | 0 | 0 | 0 | 0 | 15 | |||||
| Neu6_pre | 0 | 0 | 0 | 0 | 0 | 0 | 0 | 0 | 0 | 2 | 0 | 0 | 0 | 0 | 0 | 0 | 0 | 0 | 0 | 0 | 0 | 0 | 15 | no | ||||
| Neu6_Sept | 0 | 0 | 0 | 0 | 0 | 0 | 1 | 0 | 0 | 2 | 0 | 1 | 0 | 0 | 0 | 0 | 0 | 0 | 0 | 0 | 0 | 0 | 11 | |||||
| Neu6_post | 0 | 0 | 0 | 0 | 0 | 0 | 0 | 0 | 0 | 2 | 0 | 0 | 0 | 0 | 0 | 0 | 0 | 0 | 0 | 0 | 0 | 0 | 7 | |||||
Publisher’s Note: MDPI stays neutral with regard to jurisdictional claims in published maps and institutional affiliations. |
© 2022 by the authors. Licensee MDPI, Basel, Switzerland. This article is an open access article distributed under the terms and conditions of the Creative Commons Attribution (CC BY) license (https://creativecommons.org/licenses/by/4.0/).
Share and Cite
Feuerecker, M.; Strewe, C.; Aumayr, M.; Heitland, T.; Limper, U.; Crucian, B.; Baatout, S.; Choukér, A. One Year in the Extreme Isolation of Antarctica—Is This Enough to Modulate an “Allergic” Sensitization? Biomedicines 2022, 10, 448. https://doi.org/10.3390/biomedicines10020448
Feuerecker M, Strewe C, Aumayr M, Heitland T, Limper U, Crucian B, Baatout S, Choukér A. One Year in the Extreme Isolation of Antarctica—Is This Enough to Modulate an “Allergic” Sensitization? Biomedicines. 2022; 10(2):448. https://doi.org/10.3390/biomedicines10020448
Chicago/Turabian StyleFeuerecker, Matthias, Claudia Strewe, Martina Aumayr, Tim Heitland, Ulrich Limper, Brian Crucian, Sarah Baatout, and Alexander Choukér. 2022. "One Year in the Extreme Isolation of Antarctica—Is This Enough to Modulate an “Allergic” Sensitization?" Biomedicines 10, no. 2: 448. https://doi.org/10.3390/biomedicines10020448