
Qualitative and Quantitative Comparison of Hippocampal Volumetric Software Applications: Do All Roads Lead to Rome?

 , , ,
, , ,
Abstract
:
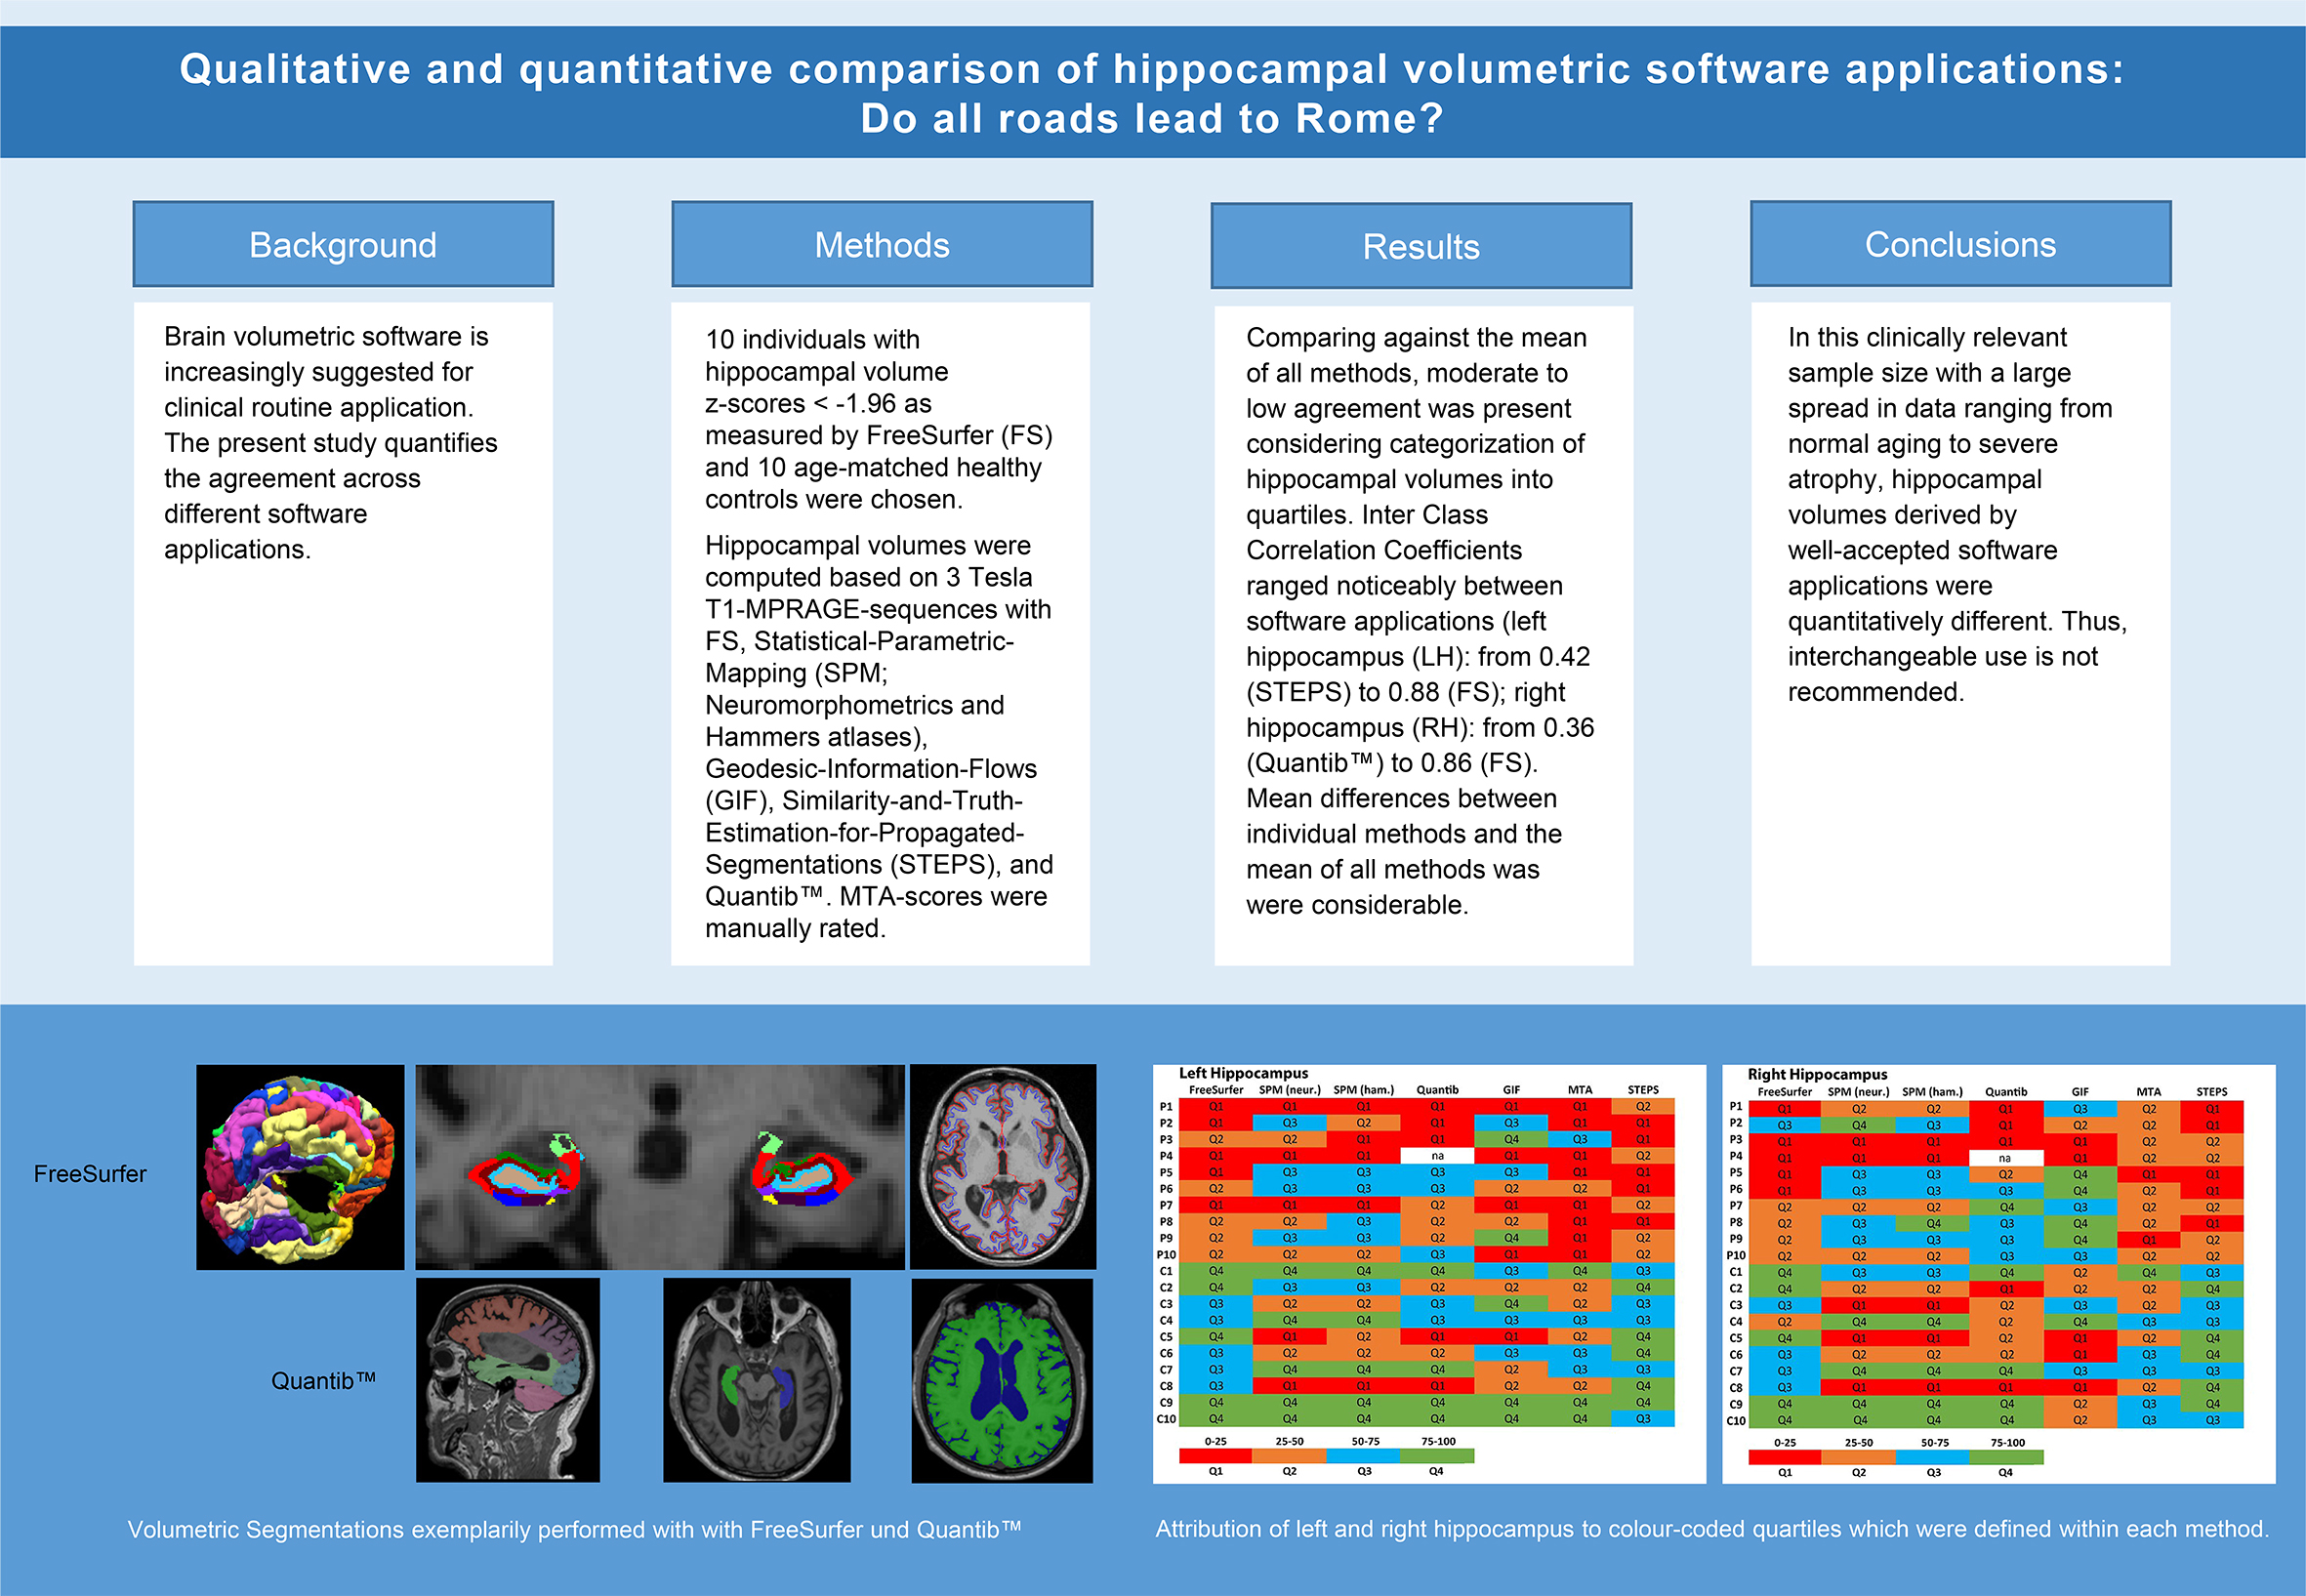
1. Introduction
2. Materials and Methods
2.1. Study Population
2.2. Magnetic Resonance Imaging Protocol and Image Analysis
2.3. Volumetric Measurements
2.4. Statistical Analysis
3. Results
4. Discussion
5. Conclusions
Author Contributions
Funding
Institutional Review Board Statement
Informed Consent Statement
Data Availability Statement
Acknowledgments
Conflicts of Interest
References
- Ten Kate, M.; Ingala, S.; Schwarz, A.J.; Fox, N.C.; Chetelat, G.; van Berckel, B.N.M.; Ewers, M.; Foley, C.; Gispert, J.D.; Hill, D.; et al. Secondary prevention of Alzheimer’s dementia: Neuroimaging contributions. Alzheimer’s Res. Ther. 2018, 10, 112. [Google Scholar] [CrossRef] [PubMed] [Green Version]
- Scheltens, P.; Leys, D.; Barkhof, F.; Huglo, D.; Weinstein, H.C.; Vermersch, P.; Kuiper, M.; Steinling, M.; Wolters, E.C.; Valk, J. Atrophy of medial temporal lobes on MRI in “probable” Alzheimer’s disease and normal ageing: Diagnostic value and neuropsychological correlates. J. Neurol. Neurosurg. Psychiatry 1992, 55, 967–972. [Google Scholar] [CrossRef] [PubMed]
- Shen, Q.; Loewenstein, D.A.; Potter, E.; Zhao, W.; Appel, J.; Greig, M.T.; Raj, A.; Acevedo, A.; Schofield, E.; Barker, W.; et al. Volumetric and visual rating of magnetic resonance imaging scans in the diagnosis of amnestic mild cognitive impairment and Alzheimer’s disease. Alzheimer’s Dement. 2011, 7, e101–e108. [Google Scholar] [CrossRef] [PubMed] [Green Version]
- Adachi, M.; Kawakatsu, S.; Sato, T.; Ohshima, F. Correlation between volume and morphological changes in the hippocampal formation in Alzheimer’s disease: Rounding of the outline of the hippocampal body on coronal MR images. Neuroradiology 2012, 54, 1079–1087. [Google Scholar] [CrossRef] [PubMed]
- Ridha, B.H.; Barnes, J.; van de Pol, L.A.; Schott, J.M.; Boyes, R.G.; Siddique, M.M.; Rossor, M.N.; Scheltens, P.; Fox, N.C. Application of automated medial temporal lobe atrophy scale to Alzheimer disease. Arch. Neurol. 2007, 64, 849–854. [Google Scholar] [CrossRef]
- Despotovic, I.; Goossens, B.; Philips, W. MRI segmentation of the human brain: Challenges, methods, and applications. Comput. Math. Methods Med. 2015, 2015, 450341. [Google Scholar] [CrossRef] [Green Version]
- Geuze, E.; Vermetten, E.; Bremner, J.D. MR-based in vivo hippocampal volumetrics: 2. Findings in neuropsychiatric disorders. Mol. Psychiatry 2005, 10, 160–184. [Google Scholar] [CrossRef] [Green Version]
- Campbell, S.; Marriott, M.; Nahmias, C.; MacQueen, G.M. Lower hippocampal volume in patients suffering from depression: A meta-analysis. Am. J. Psychiatry 2004, 161, 598–607. [Google Scholar] [CrossRef]
- Videbech, P.; Ravnkilde, B. Hippocampal volume and depression: A meta-analysis of MRI studies. Am. J. Psychiatry 2004, 161, 1957–1966. [Google Scholar] [CrossRef]
- Cook, M.J.; Fish, D.R.; Shorvon, S.D.; Straughan, K.; Stevens, J.M. Hippocampal volumetric and morphometric studies in frontal and temporal lobe epilepsy. Brain 1992, 115, 1001–1015. [Google Scholar] [CrossRef]
- Jack, C.R., Jr.; Sharbrough, F.W.; Twomey, C.K.; Cascino, G.D.; Hirschorn, K.A.; Marsh, W.R.; Zinsmeister, A.R.; Scheithauer, B. Temporal lobe seizures: Lateralization with MR volume measurements of the hippocampal formation. Radiology 1990, 175, 423–429. [Google Scholar] [CrossRef]
- Logue, M.W.; van Rooij, S.J.H.; Dennis, E.L.; Davis, S.L.; Hayes, J.P.; Stevens, J.S.; Densmore, M.; Haswell, C.C.; Ipser, J.; Koch, S.B.J.; et al. Smaller Hippocampal Volume in Posttraumatic Stress Disorder: A Multisite ENIGMA-PGC Study: Subcortical Volumetry Results from Posttraumatic Stress Disorder Consortia. Biol. Psychiatry 2018, 83, 244–253. [Google Scholar] [CrossRef] [PubMed] [Green Version]
- Gosche, K.M.; Mortimer, J.A.; Smith, C.D.; Markesbery, W.R.; Snowdon, D.A. Hippocampal volume as an index of Alzheimer neuropathology: Findings from the Nun Study. Neurology 2002, 58, 1476–1482. [Google Scholar] [CrossRef] [PubMed]
- Jack, C.R., Jr.; Petersen, R.C.; Xu, Y.; O’Brien, P.C.; Smith, G.E.; Ivnik, R.J.; Tangalos, E.G.; Kokmen, E. Rate of medial temporal lobe atrophy in typical aging and Alzheimer’s disease. Neurology 1998, 51, 993–999. [Google Scholar] [CrossRef] [PubMed] [Green Version]
- Kesslak, J.P.; Nalcioglu, O.; Cotman, C.W. Quantification of magnetic resonance scans for hippocampal and parahippocampal atrophy in Alzheimer’s disease. Neurology 1991, 41, 51–54. [Google Scholar] [CrossRef] [PubMed]
- Allen, J.S.; Bruss, J.; Brown, C.K.; Damasio, H. Normal neuroanatomical variation due to age: The major lobes and a parcellation of the temporal region. Neurobiol. Aging 2005, 26, 1245–1260; discussion 1279–1282. [Google Scholar] [CrossRef]
- Du, A.T.; Schuff, N.; Chao, L.L.; Kornak, J.; Jagust, W.J.; Kramer, J.H.; Reed, B.R.; Miller, B.L.; Norman, D.; Chui, H.C.; et al. Age effects on atrophy rates of entorhinal cortex and hippocampus. Neurobiol. Aging 2006, 27, 733–740. [Google Scholar] [CrossRef] [Green Version]
- Raz, N.; Rodrigue, K.M.; Head, D.; Kennedy, K.M.; Acker, J.D. Differential aging of the medial temporal lobe: A study of a five-year change. Neurology 2004, 62, 433–438. [Google Scholar] [CrossRef]
- Raz, N.; Rodrigue, K.M. Differential aging of the brain: Patterns, cognitive correlates and modifiers. Neurosci. Biobehav. Rev. 2006, 30, 730–748. [Google Scholar] [CrossRef] [PubMed]
- Walhovd, K.B.; Fjell, A.M.; Reinvang, I.; Lundervold, A.; Dale, A.M.; Eilertsen, D.E.; Quinn, B.T.; Salat, D.; Makris, N.; Fischl, B. Effects of age on volumes of cortex, white matter and subcortical structures. Neurobiol. Aging 2005, 26, 1261–1270; discussion 1275–1278. [Google Scholar] [CrossRef]
- Walhovd, K.B.; Westlye, L.T.; Amlien, I.; Espeseth, T.; Reinvang, I.; Raz, N.; Agartz, I.; Salat, D.H.; Greve, D.N.; Fischl, B.; et al. Consistent neuroanatomical age-related volume differences across multiple samples. Neurobiol. Aging 2011, 32, 916–932. [Google Scholar] [CrossRef] [PubMed] [Green Version]
- Firth, J.; Stubbs, B.; Vancampfort, D.; Schuch, F.; Lagopoulos, J.; Rosenbaum, S.; Ward, P.B. Effect of aerobic exercise on hippocampal volume in humans: A systematic review and meta-analysis. Neuroimage 2018, 166, 230–238. [Google Scholar] [CrossRef] [PubMed]
- Lenhart, L.; Seiler, S.; Pirpamer, L.; Goebel, G.; Potrusil, T.; Wagner, M.; Dal Bianco, P.; Ransmayr, G.; Schmidt, R.; Benke, T.; et al. Anatomically Standardized Detection of MRI Atrophy Patterns in Early-Stage Alzheimer’s Disease. Brain Sci. 2021, 11, 1494. [Google Scholar] [CrossRef] [PubMed]
- Lenhart, L.; Nagele, M.; Steiger, R.; Beliveau, V.; Skalla, E.; Zamarian, L.; Gizewski, E.R.; Benke, T.; Delazer, M.; Scherfler, C. Occupation-related effects on motor cortex thickness among older, cognitive healthy individuals. Brain Struct. Funct. 2021, 226, 1023–1030. [Google Scholar] [CrossRef] [PubMed]
- Sled, J.G.; Zijdenbos, A.P.; Evans, A.C. A nonparametric method for automatic correction of intensity nonuniformity in MRI data. IEEE Trans. Med. Imaging 1998, 17, 87–97. [Google Scholar] [CrossRef] [PubMed] [Green Version]
- Hammers, A.; Allom, R.; Koepp, M.J.; Free, S.L.; Myers, R.; Lemieux, L.; Mitchell, T.N.; Brooks, D.J.; Duncan, J.S. Three-dimensional maximum probability atlas of the human brain, with particular reference to the temporal lobe. Hum. Brain Mapp. 2003, 19, 224–247. [Google Scholar] [CrossRef]
- Cardoso, M.J.; Modat, M.; Wolz, R.; Melbourne, A.; Cash, D.; Rueckert, D.; Ourselin, S. Geodesic Information Flows: Spatially-Variant Graphs and Their Application to Segmentation and Fusion. IEEE Trans. Med. Imaging 2015, 34, 1976–1988. [Google Scholar] [CrossRef] [PubMed] [Green Version]
- Cardoso, M.J.; Modat, M.; Wolz, R.; Melbourne, A.; Cash, D.; Rueckert, D.; Ourselin, S. NiftyWeb: Web based platform for image processing on the cloud. In Proceedings of the International Society for Magnetic Resonance in Medicine (ISMRM) 24th Scientific Meeting and Exhibition, Singapore, 7–13 May 2016. [Google Scholar]
- Jorge Cardoso, M.; Leung, K.; Modat, M.; Keihaninejad, S.; Cash, D.; Barnes, J.; Fox, N.C.; Ourselin, S.; Alzheimer’s Disease Neuroimaging, I. STEPS: Similarity and Truth Estimation for Propagated Segmentations and its application to hippocampal segmentation and brain parcelation. Med. Image Anal. 2013, 17, 671–684. [Google Scholar] [CrossRef]
- Wahlund, L.O.; Julin, P.; Johansson, S.E.; Scheltens, P. Visual rating and volumetry of the medial temporal lobe on magnetic resonance imaging in dementia: A comparative study. J. Neurol. Neurosurg. Psychiatry 2000, 69, 630–635. [Google Scholar] [CrossRef] [PubMed] [Green Version]
- Scheltens, P.; Launer, L.J.; Barkhof, F.; Weinstein, H.C.; van Gool, W.A. Visual assessment of medial temporal lobe atrophy on magnetic resonance imaging: Interobserver reliability. J. Neurol. 1995, 242, 557–560. [Google Scholar] [CrossRef]
- Sastre-Garriga, J.; Pareto, D.; Rovira, A. Brain Atrophy in Multiple Sclerosis: Clinical Relevance and Technical Aspects. Neuroimaging Clin. N. Am. 2017, 27, 289–300. [Google Scholar] [CrossRef]
- Klauschen, F.; Goldman, A.; Barra, V.; Meyer-Lindenberg, A.; Lundervold, A. Evaluation of automated brain MR image segmentation and volumetry methods. Hum. Brain Mapp. 2009, 30, 1310–1327. [Google Scholar] [CrossRef] [PubMed]
- Heinen, R.; Bouvy, W.H.; Mendrik, A.M.; Viergever, M.A.; Biessels, G.J.; de Bresser, J. Robustness of Automated Methods for Brain Volume Measurements across Different MRI Field Strengths. PLoS ONE 2016, 11, e0165719. [Google Scholar] [CrossRef] [PubMed]
- Rocca, M.A.; Battaglini, M.; Benedict, R.H.; De Stefano, N.; Geurts, J.J.; Henry, R.G.; Horsfield, M.A.; Jenkinson, M.; Pagani, E.; Filippi, M. Brain MRI atrophy quantification in MS: From methods to clinical application. Neurology 2017, 88, 403–413. [Google Scholar] [CrossRef] [PubMed] [Green Version]
- Deutschmann, H.; Hinteregger, N.; Wiesspeiner, U.; Kneihsl, M.; Fandler-Hofler, S.; Michenthaler, M.; Enzinger, C.; Hassler, E.; Leber, S.; Reishofer, G. Automated MRI perfusion-diffusion mismatch estimation may be significantly different in individual patients when using different software packages. Eur. Radiol. 2021, 31, 658–665. [Google Scholar] [CrossRef]
- Fischl, B. FreeSurfer. Neuroimage 2012, 62, 774–781. [Google Scholar] [CrossRef] [Green Version]
- Ashburner, J.; Friston, K.J. Unified segmentation. Neuroimage 2005, 26, 839–851. [Google Scholar] [CrossRef]
- Gaser, C.; Dahnke, R. CAT-A Computational Anatomy Toolbox for the Analysis of Structural MRI Data. In Proceedings of the 22nd Annual Meeting of the Organization For Human Brain Mapping, Rome, Italy, 19–23 June 2016. [Google Scholar]
- Vrooman, H.A.; Cocosco, C.A.; van der Lijn, F.; Stokking, R.; Ikram, M.A.; Vernooij, M.W.; Breteler, M.M.; Niessen, W.J. Multi-spectral brain tissue segmentation using automatically trained k-Nearest-Neighbor classification. Neuroimage 2007, 37, 71–81. [Google Scholar] [CrossRef]
- de Boer, R.; Vrooman, H.A.; van der Lijn, F.; Vernooij, M.W.; Ikram, M.A.; van der Lugt, A.; Breteler, M.M.; Niessen, W.J. White matter lesion extension to automatic brain tissue segmentation on MRI. Neuroimage 2009, 45, 1151–1161. [Google Scholar] [CrossRef]
- de Boer, R.; Vrooman, H.A.; Ikram, M.A.; Vernooij, M.W.; Breteler, M.M.; van der Lugt, A.; Niessen, W.J. Accuracy and reproducibility study of automatic MRI brain tissue segmentation methods. Neuroimage 2010, 51, 1047–1056. [Google Scholar] [CrossRef]
- Viveiros, A.; Beliveau, V.; Panzer, M.; Schaefer, B.; Glodny, B.; Henninger, B.; Tilg, H.; Zoller, H.; Scherfler, C. Neurodegeneration in Hepatic and Neurologic Wilson’s Disease. Hepatology 2021, 74, 1117–1120. [Google Scholar] [CrossRef] [PubMed]
- Ehling, R.; Amprosi, M.; Kremmel, B.; Bsteh, G.; Eberharter, K.; Zehentner, M.; Steiger, R.; Tuovinen, N.; Gizewski, E.R.; Benke, T.; et al. Second language learning induces grey matter volume increase in people with multiple sclerosis. PLoS ONE 2019, 14, e0226525. [Google Scholar] [CrossRef] [PubMed]
- Stefani, A.; Mitterling, T.; Heidbreder, A.; Steiger, R.; Kremser, C.; Frauscher, B.; Gizewski, E.R.; Poewe, W.; Hogl, B.; Scherfler, C. Multimodal Magnetic Resonance Imaging reveals alterations of sensorimotor circuits in restless legs syndrome. Sleep 2019, 42, zsz171. [Google Scholar] [CrossRef]
- Scherfler, C.; Gobel, G.; Muller, C.; Nocker, M.; Wenning, G.K.; Schocke, M.; Poewe, W.; Seppi, K. Diagnostic potential of automated subcortical volume segmentation in atypical parkinsonism. Neurology 2016, 86, 1242–1249. [Google Scholar] [CrossRef]
- Schmitter, D.; Roche, A.; Marechal, B.; Ribes, D.; Abdulkadir, A.; Bach-Cuadra, M.; Daducci, A.; Granziera, C.; Kloppel, S.; Maeder, P.; et al. An evaluation of volume-based morphometry for prediction of mild cognitive impairment and Alzheimer’s disease. Neuroimage Clin. 2015, 7, 7–17. [Google Scholar] [CrossRef] [Green Version]
- Nordenskjold, R.; Malmberg, F.; Larsson, E.M.; Simmons, A.; Brooks, S.J.; Lind, L.; Ahlstrom, H.; Johansson, L.; Kullberg, J. Intracranial volume estimated with commonly used methods could introduce bias in studies including brain volume measurements. Neuroimage 2013, 83, 355–360. [Google Scholar] [CrossRef] [Green Version]
- Sargolzaei, S.; Sargolzaei, A.; Cabrerizo, M.; Chen, G.; Goryawala, M.; Noei, S.; Zhou, Q.; Duara, R.; Barker, W.; Adjouadi, M. A practical guideline for intracranial volume estimation in patients with Alzheimer’s disease. BMC Bioinform. 2015, 16 (Suppl. 7), S8. [Google Scholar] [CrossRef] [Green Version]
- Ashburner, J.; Friston, K.J. Voxel-based morphometry--the methods. Neuroimage 2000, 11, 805–821. [Google Scholar] [CrossRef] [PubMed] [Green Version]
- Whitwell, J.L. Voxel-based morphometry: An automated technique for assessing structural changes in the brain. J. Neurosci. 2009, 29, 9661–9664. [Google Scholar] [CrossRef] [Green Version]
- Caspers, J.; Heeger, A.; Turowski, B.; Rubbert, C. Automated age- and sex-specific volumetric estimation of regional brain atrophy: Workflow and feasibility. Eur. Radiol. 2021, 31, 1043–1048. [Google Scholar] [CrossRef]
- Szentkuti, A.; Guderian, S.; Schiltz, K.; Kaufmann, J.; Munte, T.F.; Heinze, H.J.; Duzel, E. Quantitative MR analyses of the hippocampus: Unspecific metabolic changes in aging. J. Neurol. 2004, 251, 1345–1353. [Google Scholar] [CrossRef] [PubMed]
- Cardenas, V.A.; Chao, L.L.; Blumenfeld, R.; Song, E.; Meyerhoff, D.J.; Weiner, M.W.; Studholme, C. Using automated morphometry to detect associations between ERP latency and structural brain MRI in normal adults. Hum. Brain Mapp. 2005, 25, 317–327. [Google Scholar] [CrossRef] [PubMed] [Green Version]
- Peper, J.S.; Schnack, H.G.; Brouwer, R.M.; Van Baal, G.C.; Pjetri, E.; Szekely, E.; van Leeuwen, M.; van den Berg, S.M.; Collins, D.L.; Evans, A.C.; et al. Heritability of regional and global brain structure at the onset of puberty: A magnetic resonance imaging study in 9-year-old twin pairs. Hum. Brain Mapp. 2009, 30, 2184–2196. [Google Scholar] [CrossRef]
- Roussotte, F.F.; Sulik, K.K.; Mattson, S.N.; Riley, E.P.; Jones, K.L.; Adnams, C.M.; May, P.A.; O’Connor, M.J.; Narr, K.L.; Sowell, E.R. Regional brain volume reductions relate to facial dysmorphology and neurocognitive function in fetal alcohol spectrum disorders. Hum. Brain Mapp. 2012, 33, 920–937. [Google Scholar] [CrossRef] [PubMed] [Green Version]
- Taki, Y.; Thyreau, B.; Kinomura, S.; Sato, K.; Goto, R.; Wu, K.; Kawashima, R.; Fukuda, H. A longitudinal study of the relationship between personality traits and the annual rate of volume changes in regional gray matter in healthy adults. Hum. Brain Mapp. 2013, 34, 3347–3353. [Google Scholar] [CrossRef] [PubMed]
- Whitwell, J.L.; Dickson, D.W.; Murray, M.E.; Weigand, S.D.; Tosakulwong, N.; Senjem, M.L.; Knopman, D.S.; Boeve, B.F.; Parisi, J.E.; Petersen, R.C.; et al. Neuroimaging correlates of pathologically defined subtypes of Alzheimer’s disease: A case-control study. Lancet Neurol. 2012, 11, 868–877. [Google Scholar] [CrossRef] [Green Version]
- Barnes, J.; Ridgway, G.R.; Bartlett, J.; Henley, S.M.; Lehmann, M.; Hobbs, N.; Clarkson, M.J.; MacManus, D.G.; Ourselin, S.; Fox, N.C. Head size, age and gender adjustment in MRI studies: A necessary nuisance? Neuroimage 2010, 53, 1244–1255. [Google Scholar] [CrossRef] [PubMed]
- Fischl, B.; Salat, D.H.; Busa, E.; Albert, M.; Dieterich, M.; Haselgrove, C.; van der Kouwe, A.; Killiany, R.; Kennedy, D.; Klaveness, S.; et al. Whole brain segmentation: Automated labeling of neuroanatomical structures in the human brain. Neuron 2002, 33, 341–355. [Google Scholar] [CrossRef] [Green Version]
- Fischl, B.; Salat, D.H.; van der Kouwe, A.J.; Makris, N.; Segonne, F.; Quinn, B.T.; Dale, A.M. Sequence-independent segmentation of magnetic resonance images. Neuroimage 2004, 23 (Suppl. 1), S69–S84. [Google Scholar] [CrossRef] [PubMed] [Green Version]
- Greve, D.N.; Fischl, B. Accurate and robust brain image alignment using boundary-based registration. Neuroimage 2009, 48, 63–72. [Google Scholar] [CrossRef] [Green Version]
- Postelnicu, G.; Zollei, L.; Fischl, B. Combined volumetric and surface registration. IEEE Trans. Med. Imaging 2009, 28, 508–522. [Google Scholar] [CrossRef]
- Fischl, B.; Rajendran, N.; Busa, E.; Augustinack, J.; Hinds, O.; Yeo, B.T.; Mohlberg, H.; Amunts, K.; Zilles, K. Cortical folding patterns and predicting cytoarchitecture. Cereb. Cortex 2008, 18, 1973–1980. [Google Scholar] [CrossRef]
- Yendiki, A.; Panneck, P.; Srinivasan, P.; Stevens, A.; Zollei, L.; Augustinack, J.; Wang, R.; Salat, D.; Ehrlich, S.; Behrens, T.; et al. Automated probabilistic reconstruction of white-matter pathways in health and disease using an atlas of the underlying anatomy. Front. Neuroinform. 2011, 5, 23. [Google Scholar] [CrossRef] [PubMed] [Green Version]
- Reuter, M.; Fischl, B. Avoiding asymmetry-induced bias in longitudinal image processing. Neuroimage 2011, 57, 19–21. [Google Scholar] [CrossRef] [PubMed] [Green Version]
- Reuter, M.; Rosas, H.D.; Fischl, B. Highly accurate inverse consistent registration: A robust approach. Neuroimage 2010, 53, 1181–1196. [Google Scholar] [CrossRef] [PubMed] [Green Version]
- Kremen, W.S.; Prom-Wormley, E.; Panizzon, M.S.; Eyler, L.T.; Fischl, B.; Neale, M.C.; Franz, C.E.; Lyons, M.J.; Pacheco, J.; Perry, M.E.; et al. Genetic and environmental influences on the size of specific brain regions in midlife: The VETSA MRI study. Neuroimage 2010, 49, 1213–1223. [Google Scholar] [CrossRef] [Green Version]
- Panizzon, M.S.; Fennema-Notestine, C.; Eyler, L.T.; Jernigan, T.L.; Prom-Wormley, E.; Neale, M.; Jacobson, K.; Lyons, M.J.; Grant, M.D.; Franz, C.E.; et al. Distinct genetic influences on cortical surface area and cortical thickness. Cereb. Cortex 2009, 19, 2728–2735. [Google Scholar] [CrossRef] [PubMed]
- Isaacs, E.B.; Gadian, D.G.; Sabatini, S.; Chong, W.K.; Quinn, B.T.; Fischl, B.R.; Lucas, A. The effect of early human diet on caudate volumes and IQ. Pediatr. Res. 2008, 63, 308–314. [Google Scholar] [CrossRef] [PubMed]
- Salat, D.H.; Greve, D.N.; Pacheco, J.L.; Quinn, B.T.; Helmer, K.G.; Buckner, R.L.; Fischl, B. Regional white matter volume differences in nondemented aging and Alzheimer’s disease. Neuroimage 2009, 44, 1247–1258. [Google Scholar] [CrossRef] [Green Version]
- Ikram, M.A.; van der Lugt, A.; Niessen, W.J.; Koudstaal, P.J.; Krestin, G.P.; Hofman, A.; Bos, D.; Vernooij, M.W. The Rotterdam Scan Study: Design update 2016 and main findings. Eur. J. Epidemiol. 2015, 30, 1299–1315. [Google Scholar] [CrossRef] [Green Version]
- Hilal, S.; Amin, S.M.; Venketasubramanian, N.; Niessen, W.J.; Vrooman, H.; Wong, T.Y.; Chen, C.; Ikram, M.K. Subcortical Atrophy in Cognitive Impairment and Dementia. J. Alzheimer’s Dis. 2015, 48, 813–823. [Google Scholar] [CrossRef] [PubMed] [Green Version]
- Hilal, S.; Ong, Y.T.; Cheung, C.Y.; Tan, C.S.; Venketasubramanian, N.; Niessen, W.J.; Vrooman, H.; Anuar, A.R.; Chew, M.; Chen, C.; et al. Microvascular network alterations in retina of subjects with cerebral small vessel disease. Neurosci. Lett. 2014, 577, 95–100. [Google Scholar] [CrossRef]
- Bigler, E.D.; Skiles, M.; Wade, B.S.C.; Abildskov, T.J.; Tustison, N.J.; Scheibel, R.S.; Newsome, M.R.; Mayer, A.R.; Stone, J.R.; Taylor, B.A.; et al. FreeSurfer 5.3 versus 6.0: Are volumes comparable? A Chronic Effects of Neurotrauma Consortium study. Brain Imaging Behav. 2020, 14, 1318–1327. [Google Scholar] [CrossRef]
- Reid, M.W.; Hannemann, N.P.; York, G.E.; Ritter, J.L.; Kini, J.A.; Lewis, J.D.; Sherman, P.M.; Velez, C.S.; Drennon, A.M.; Bolzenius, J.D.; et al. Comparing Two Processing Pipelines to Measure Subcortical and Cortical Volumes in Patients with and without Mild Traumatic Brain Injury. J. Neuroimaging 2017, 27, 365–371. [Google Scholar] [CrossRef]
- Persson, K.; Barca, M.L.; Cavallin, L.; Braekhus, A.; Knapskog, A.B.; Selbaek, G.; Engedal, K. Comparison of automated volumetry of the hippocampus using NeuroQuant(R) and visual assessment of the medial temporal lobe in Alzheimer’s disease. Acta Radiol. 2018, 59, 997–1001. [Google Scholar] [CrossRef]
- Schmidt, M.F.; Storrs, J.M.; Freeman, K.B.; Jack, C.R., Jr.; Turner, S.T.; Griswold, M.E.; Mosley, T.H., Jr. A comparison of manual tracing and FreeSurfer for estimating hippocampal volume over the adult lifespan. Hum. Brain Mapp. 2018, 39, 2500–2513. [Google Scholar] [CrossRef]
- Wilde, E.A.; Bigler, E.D.; Huff, T.; Wang, H.; Black, G.M.; Christensen, Z.P.; Goodrich-Hunsaker, N.; Petrie, J.A.; Abildskov, T.; Taylor, B.A.; et al. Quantitative structural neuroimaging of mild traumatic brain injury in the Chronic Effects of Neurotrauma Consortium (CENC): Comparison of volumetric data within and across scanners. Brain Inj. 2016, 30, 1442–1451. [Google Scholar] [CrossRef]
- Good, C.D.; Johnsrude, I.S.; Ashburner, J.; Henson, R.N.; Friston, K.J.; Frackowiak, R.S. A voxel-based morphometric study of ageing in 465 normal adult human brains. Neuroimage 2001, 14, 21–36. [Google Scholar] [CrossRef] [Green Version]
- De Stefano, N.; Giorgio, A.; Battaglini, M.; Rovaris, M.; Sormani, M.P.; Barkhof, F.; Korteweg, T.; Enzinger, C.; Fazekas, F.; Calabrese, M.; et al. Assessing brain atrophy rates in a large population of untreated multiple sclerosis subtypes. Neurology 2010, 74, 1868–1876. [Google Scholar] [CrossRef]
- De Stefano, N.; Stromillo, M.L.; Giorgio, A.; Bartolozzi, M.L.; Battaglini, M.; Baldini, M.; Portaccio, E.; Amato, M.P.; Sormani, M.P. Establishing pathological cut-offs of brain atrophy rates in multiple sclerosis. J. Neurol. Neurosurg. Psychiatry 2016, 87, 93–99. [Google Scholar] [CrossRef] [Green Version]
- Biberacher, V.; Schmidt, P.; Keshavan, A.; Boucard, C.C.; Righart, R.; Samann, P.; Preibisch, C.; Frobel, D.; Aly, L.; Hemmer, B.; et al. Intra- and interscanner variability of magnetic resonance imaging based volumetry in multiple sclerosis. Neuroimage 2016, 142, 188–197. [Google Scholar] [CrossRef]


| ID | Age [y] | Gender | Free Surfer z-Value | FreeSurfer [mm3] | SPM Neuromorphometrics [mm3] | SPM Hammers [mm3] | Quantib™ [mm3] | GIF [mm3] | STEPS [mm3] | MTA | ||||||||
|---|---|---|---|---|---|---|---|---|---|---|---|---|---|---|---|---|---|---|
| LH | RH | LH | RH | LH | RH | LH | RH | LH | RH | LH | RH | LH | RH | LH | RH | |||
| P1 | 68 | m | −3.45 | −2.42 | 2258 | 2593 | 1852 | 2390 | 1393 | 1703 | 2180 | 2540 | 3499 | 3896 | 3368 | 3242 | 3 | 2 |
| P2 | 65 | f | −3.03 | −1.33 | 2615 | 3063 | 2318 | 2868 | 1588 | 1982 | 2590 | 2840 | 4053 | 4831 | 2985 | 2718 | 3 | 2 |
| P3 | 74 | f | −1.82 | −2.42 | 2500 | 2307 | 2204 | 2097 | 1512 | 1421 | 2170 | 2060 | 3642 | 3335 | 3368 | 3383 | 1 | 2 |
| P4 | 71 | f | −4.59 | −4.34 | 1942 | 2119 | 1522 | 1667 | 1161 | 1190 | - | - | 3146 | 3548 | 3920 | 4001 | 3 | 2 |
| P5 | 58 | m | −3.33 | −2.64 | 3009 | 3279 | 2414 | 2756 | 1765 | 1964 | 3020 | 3170 | 4341 | 4793 | 3124 | 3149 | 3 | 3 |
| P6 | 61 | m | −2.66 | −2.79 | 3142 | 3136 | 2454 | 2855 | 1799 | 1953 | 2890 | 3070 | 4567 | 4723 | 3088 | 3274 | 2 | 2 |
| P7 | 81 | f | −3.12 | −2.17 | 2048 | 2527 | 1848 | 2485 | 1437 | 1709 | 2110 | 2590 | 3545 | 4053 | 3713 | 3711 | 3 | 2 |
| P8 | 66 | m | −2.79 | −2.27 | 2688 | 2966 | 2265 | 2833 | 1761 | 1987 | 2430 | 2730 | 3874 | 4259 | 2471 | 2571 | 3 | 2 |
| P9 | 77 | m | −2.14 | −1.65 | 2922 | 3293 | 2440 | 2664 | 1834 | 1961 | 2700 | 2990 | 4547 | 4583 | 3779 | 3728 | 3 | 3 |
| P10 | 77 | m | −2.27 | −1.92 | 2764 | 2989 | 2159 | 2492 | 1520 | 1714 | 2470 | 2730 | 4089 | 4502 | 3791 | 3661 | 3 | 2 |
| C1 | 81 | f | 1.79 | 0.81 | 3725 | 3653 | 2636 | 2742 | 1851 | 1857 | 2700 | 2710 | 4126 | 4404 | 6880 | 7348 | 0 | 0 |
| C2 | 74 | m | 0.71 | 0.67 | 3643 | 3636 | 2576 | 2563 | 1740 | 1688 | 2510 | 2260 | 4155 | 4319 | 7395 | 7798 | 2 | 2 |
| C3 | 74 | m | −0.19 | −0.48 | 3559 | 3371 | 2240 | 2244 | 1662 | 1578 | 2480 | 2570 | 4910 | 4879 | 6504 | 5911 | 2 | 2 |
| C4 | 71 | m | −1.23 | −1.41 | 3186 | 3376 | 2961 | 3215 | 2169 | 2312 | 3130 | 3220 | 4618 | 4859 | 6338 | 6610 | 1 | 1 |
| C5 | 82 | m | 1.13 | 1.15 | 3447 | 3685 | 2063 | 2178 | 1558 | 1561 | 2310 | 2520 | 3787 | 3947 | 9005 | 9366 | 2 | 2 |
| C6 | 76 | f | −0.47 | −0.22 | 3118 | 3189 | 2225 | 2524 | 1677 | 1793 | 2390 | 2610 | 3654 | 4034 | 8318 | 8366 | 1 | 1 |
| C7 | 77 | m | −0.38 | 0.23 | 2776 | 3039 | 2728 | 2942 | 2023 | 2117 | 2910 | 2920 | 4439 | 4606 | 6715 | 7042 | 1 | 1 |
| C8 | 74 | f | 0.08 | 0.35 | 2923 | 2991 | 2027 | 2259 | 1365 | 1501 | 2070 | 2200 | 3488 | 3708 | 7796 | 7875 | 2 | 2 |
| C9 | 49 | f | 0.98 | 1.23 | 3561 | 3671 | 3169 | 3336 | 2147 | 2171 | 3010 | 3070 | 4434 | 4824 | 8423 | 9695 | 0 | 1 |
| C10 | 49 | f | 0.44 | 0.70 | 3631 | 3840 | 3137 | 3346 | 2194 | 2256 | 3100 | 3140 | 4540 | 4895 | 7024 | 7667 | 0 | 1 |
| Method | ICC | Lower CI | Upper CI | p-Value | |
|---|---|---|---|---|---|
| LH | FreeSurfer | 0.88 | 0.73 | 0.95 | <0.001 |
| SPM Neuromorphometrics | 0.73 | 0.44 | 0.89 | <0.001 | |
| SPM Hammers | 0.58 | 0.20 | 0.81 | 0.003 | |
| Quantib™ | 0.49 | 0.05 | 0.76 | 0.015 | |
| GIF | 0.57 | 0.18 | 0.80 | 0.004 | |
| STEPS | 0.42 | −0.02 | 0.72 | 0.030 | |
| RH | FreeSurfer | 0.86 | 0.68 | 0.94 | <0.001 |
| SPM Neuromorphometrics | 0.62 | 0.25 | 0.83 | 0.001 | |
| SPM Hammers | 0.48 | 0.06 | 0.76 | 0.013 | |
| Quantib™ | 0.36 | −0.10 | 0.69 | 0.059 | |
| GIF | 0.54 | 0.13 | 0.79 | 0.006 | |
| STEPS | 0.38 | −0.07 | 0.70 | 0.046 |
Publisher’s Note: MDPI stays neutral with regard to jurisdictional claims in published maps and institutional affiliations. |
© 2022 by the authors. Licensee MDPI, Basel, Switzerland. This article is an open access article distributed under the terms and conditions of the Creative Commons Attribution (CC BY) license (https://creativecommons.org/licenses/by/4.0/).
Share and Cite
Mangesius, S.; Haider, L.; Lenhart, L.; Steiger, R.; Prados Carrasco, F.; Scherfler, C.; Gizewski, E.R. Qualitative and Quantitative Comparison of Hippocampal Volumetric Software Applications: Do All Roads Lead to Rome? Biomedicines 2022, 10, 432. https://doi.org/10.3390/biomedicines10020432
Mangesius S, Haider L, Lenhart L, Steiger R, Prados Carrasco F, Scherfler C, Gizewski ER. Qualitative and Quantitative Comparison of Hippocampal Volumetric Software Applications: Do All Roads Lead to Rome? Biomedicines. 2022; 10(2):432. https://doi.org/10.3390/biomedicines10020432
Chicago/Turabian StyleMangesius, Stephanie, Lukas Haider, Lukas Lenhart, Ruth Steiger, Ferran Prados Carrasco, Christoph Scherfler, and Elke R. Gizewski. 2022. "Qualitative and Quantitative Comparison of Hippocampal Volumetric Software Applications: Do All Roads Lead to Rome?" Biomedicines 10, no. 2: 432. https://doi.org/10.3390/biomedicines10020432