
Ultrasound-Based Hepatic Elastography in Non-Alcoholic Fatty Liver Disease: Focus on Patients with Type 2 Diabetes

 , , ,
, , ,
Abstract
:1. Introduction
2. Common Approaches in NAFLD Assessment
3. Ultrasound-Based Hepatic Shear Wave Elastography
3.1. Elastography-Based Imaging Techniques to Assess Hepatic Fibrosis
- TE or vibration-controlled transient elastography (VCTE)
- acoustic radiation force impulse (ARFI) quantification:
- ◦
- pSWE (point shear wave elastography)
- ◦
- 2D-SWE (two-dimensional shear wave elastography), or 3D-SWE (three-dimensional shear wave elastography) [46].
3.1.1. Transient Elastography
3.1.2. Point Shear Wave Elastography (pSWE)
3.1.3. Two-dimensional Shear Wave Elastography (2D-SWE)
3.2. Additional Results Obtained by Imaging Methods Complemented with Elastography
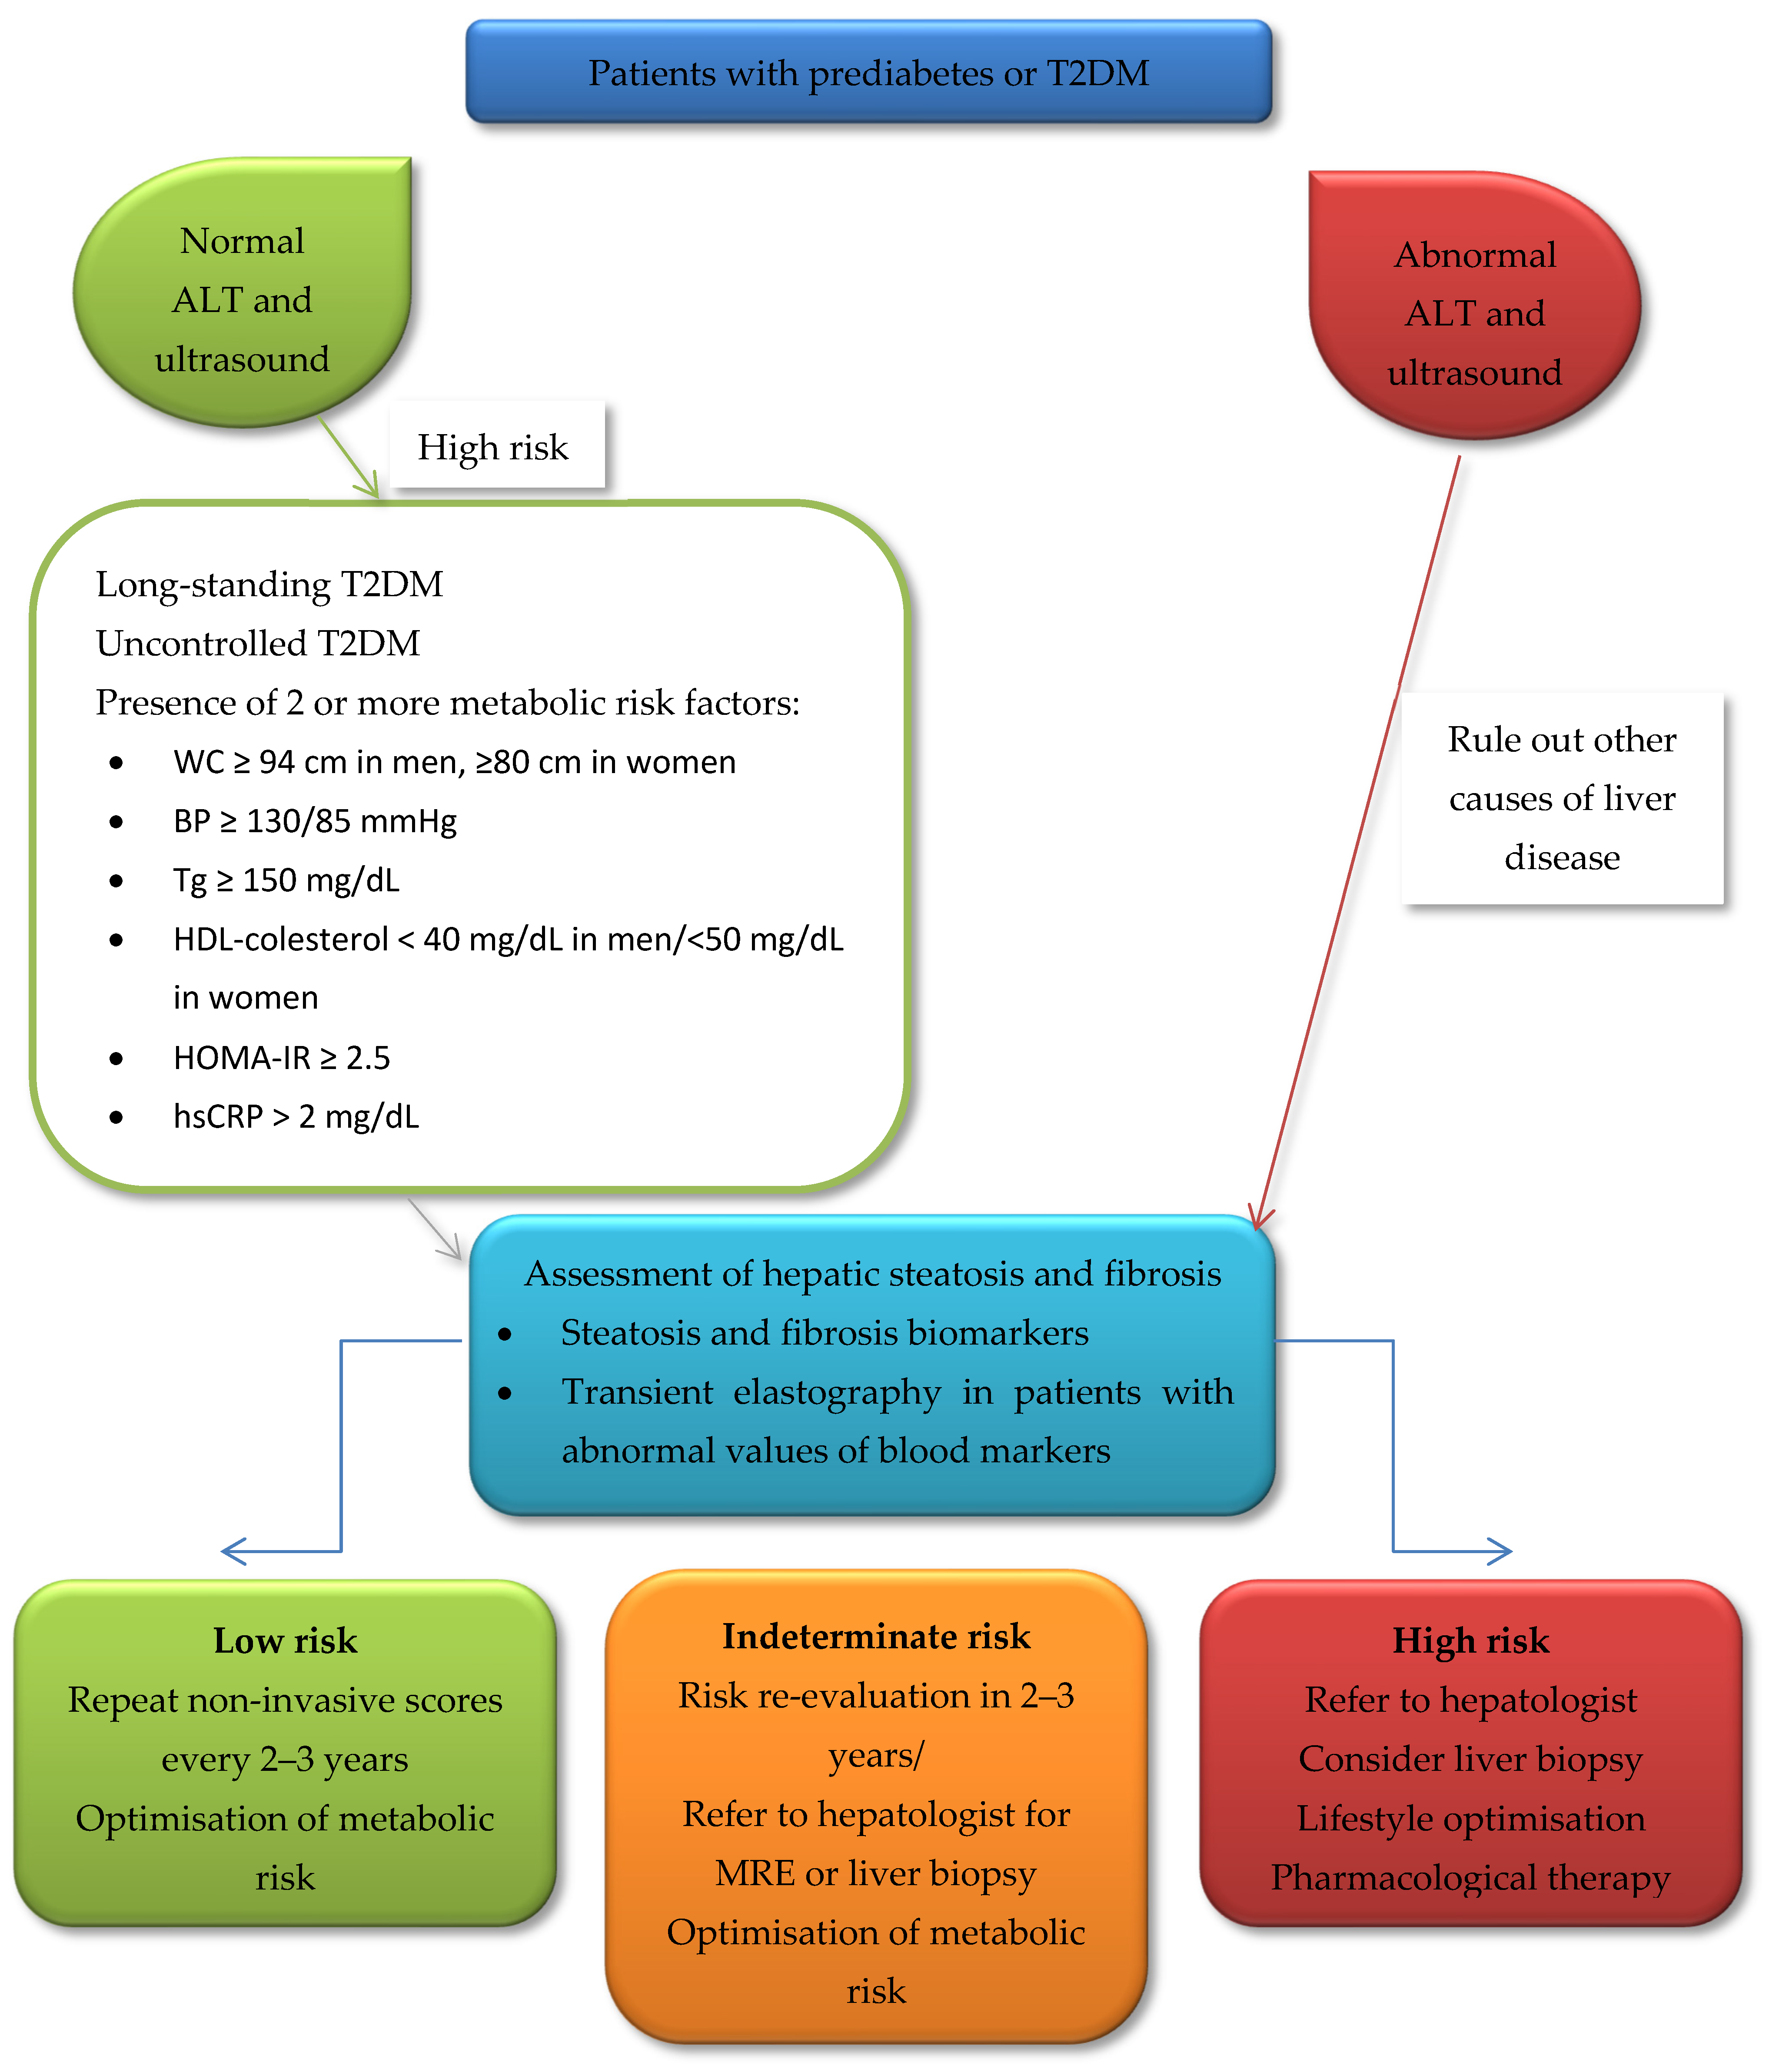
4. The Place of Elastography-Based Techniques in the Screening Algorithm for NAFLD
5. Gaps in Knowledge
6. Conclusions
Author Contributions
Funding
Institutional Review Board Statement
Informed Consent Statement
Data Availability Statement
Conflicts of Interest
References
- Younossi, Z.; Anstee, Q.M.; Marietti, M.; Hardy, T.; Henry, L.; Eslam, M.; George, J.; Bugianesi, E. Global Burden of NAFLD and NASH: Trends, Predictions, Risk Factors and Prevention. Nat. Rev. Gastroenterol. Hepatol. 2018, 15, 11–20. [Google Scholar] [CrossRef]
- Kanwal, F.; Shubrook, J.H.; Adams, L.A.; Pfotenhauer, K.; Wai-Sun Wong, V.; Wright, E.; Abdelmalek, M.F.; Harrison, S.A.; Loomba, R.; Mantzoros, C.S.; et al. Clinical Care Pathway for the Risk Stratification and Management of Patients With Nonalcoholic Fatty Liver Disease. Gastroenterology 2021, 161, 1657–1669. [Google Scholar] [CrossRef] [PubMed]
- IDF Diabetes Atlas. Available online: https://idf.org/e-library/epidemiology-research/diabetes-atlas.html?id=171 (accessed on 26 August 2022).
- Younossi, Z.M.; Koenig, A.B.; Abdelatif, D.; Fazel, Y.; Henry, L.; Wymer, M. Global Epidemiology of Nonalcoholic Fatty Liver Disease-Meta-Analytic Assessment of Prevalence, Incidence, and Outcomes. Hepatology 2016, 64, 73–84. [Google Scholar] [CrossRef] [PubMed]
- Younossi, Z.M.; Henry, L. Epidemiology of Non-Alcoholic Fatty Liver Disease and Hepatocellular Carcinoma. JHEP Rep. Innov. Hepatol. 2021, 3, 100305. [Google Scholar] [CrossRef] [PubMed]
- Younossi, Z.M.; Golabi, P.; de Avila, L.; Paik, J.M.; Srishord, M.; Fukui, N.; Qiu, Y.; Burns, L.; Afendy, A.; Nader, F. The Global Epidemiology of NAFLD and NASH in Patients with Type 2 Diabetes: A Systematic Review and Meta-Analysis. J. Hepatol. 2019, 71, 793–801. [Google Scholar] [CrossRef]
- Younossi, Z.; Tacke, F.; Arrese, M.; Chander Sharma, B.; Mostafa, I.; Bugianesi, E.; Wai-Sun Wong, V.; Yilmaz, Y.; George, J.; Fan, J. Global Perspectives on Nonalcoholic Fatty Liver Disease and Nonalcoholic Steatohepatitis. Hepatology 2019, 69, 2672–2682. [Google Scholar] [CrossRef]
- Duell, P.B.; Welty, F.K.; Miller, M.; Chait, A.; Hammond, G.; Ahmad, Z.; Cohen, D.E.; Horton, J.D.; Pressman, G.S.; Toth, P.P. Nonalcoholic Fatty Liver Disease and Cardiovascular Risk: A Scientific Statement from the American Heart Association. Arterioscler. Thromb. Vasc. Biol. 2022, 42, e168–e185. [Google Scholar] [CrossRef]
- Chalasani, N.; Younossi, Z.; Lavine, J.E.; Charlton, M.; Cusi, K.; Rinella, M.; Harrison, S.A.; Brunt, E.M.; Sanyal, A.J. The Diagnosis and Management of Nonalcoholic Fatty Liver Disease: Practice Guidance from the American Association for the Study of Liver Diseases. Hepatology 2018, 67, 328–357. [Google Scholar] [CrossRef]
- Ekstedt, M.; Hagström, H.; Nasr, P.; Fredrikson, M.; Stål, P.; Kechagias, S.; Hultcrantz, R. Fibrosis Stage Is the Strongest Predictor for Disease-Specific Mortality in NAFLD after up to 33 Years of Follow-Up. Hepatology 2015, 61, 1547–1554. [Google Scholar] [CrossRef]
- Eslam, M.; Sanyal, A.J.; George, J. International Consensus Panel MAFLD: A Consensus-Driven Proposed Nomenclature for Metabolic Associated Fatty Liver Disease. Gastroenterology 2020, 158, 1999–2014.e1. [Google Scholar] [CrossRef]
- Kang, S.H.; Cho, Y.; Jeong, S.W.; Kim, S.U.; Lee, J.-W. From Nonalcoholic Fatty Liver Disease to Metabolic-Associated Fatty Liver Disease: Big Wave or Ripple? Clin. Mol. Hepatol. 2021, 27, 257–269. [Google Scholar] [CrossRef] [PubMed]
- Hazlehurst, J.M.; Woods, C.; Marjot, T.; Cobbold, J.F.; Tomlinson, J.W. Non-Alcoholic Fatty Liver Disease and Diabetes. Metabolism 2016, 65, 1096–1108. [Google Scholar] [CrossRef] [PubMed]
- European Association for the Study of the Liver (EASL); European Association for the Study of Diabetes (EASD); European Association for the Study of Obesity (EASO). EASL-EASD-EASO Clinical Practice Guidelines for the Management of Non-Alcoholic Fatty Liver Disease. J. Hepatol. 2016, 64, 1388–1402. [Google Scholar] [CrossRef]
- Kitagawa, N.; Hashimoto, Y.; Hamaguchi, M.; Osaka, T.; Fukuda, T.; Yamazaki, M.; Fukui, M. Liver Stiffness Is Associated With Progression of Albuminuria in Adults With Type 2 Diabetes: Nonalcoholic Fatty Disease Cohort Study. Can. J. Diabetes 2020, 44, 428–433. [Google Scholar] [CrossRef] [PubMed]
- Powell, E.E.; Wong, V.W.-S.; Rinella, M. Non-Alcoholic Fatty Liver Disease. Lancet Lond. Engl. 2021, 397, 2212–2224. [Google Scholar] [CrossRef]
- Mantovani, A.; Petracca, G.; Beatrice, G.; Tilg, H.; Byrne, C.D.; Targher, G. Non-Alcoholic Fatty Liver Disease and Risk of Incident Diabetes Mellitus: An Updated Meta-Analysis of 501 022 Adult Individuals. Gut 2021, 70, 962–969. [Google Scholar] [CrossRef]
- Luo, J.; Xu, L.; Li, J.; Zhao, S. Nonalcoholic Fatty Liver Disease as a Potential Risk Factor of Cardiovascular Disease. Eur. J. Gastroenterol. Hepatol. 2015, 27, 193–199. [Google Scholar] [CrossRef]
- Wijarnpreecha, K.; Aby, E.S.; Ahmed, A.; Kim, D. Evaluation and Management of Extrahepatic Manifestations of Nonalcoholic Fatty Liver Disease. Clin. Mol. Hepatol. 2021, 27, 221–235. [Google Scholar] [CrossRef]
- Poustchi, H.; Alaei-Shahmiri, F.; Aghili, R.; Nobarani, S.; Malek, M.; Khamseh, M.E. Hepatic Steatosis and Fibrosis in Type 2 Diabetes: A Risk-Based Approach to Targeted Screening. Arch. Iran. Med. 2021, 24, 177–186. [Google Scholar] [CrossRef]
- Cotter, T.G.; Rinella, M. Nonalcoholic Fatty Liver Disease 2020: The State of the Disease. Gastroenterology 2020, 158, 1851–1864. [Google Scholar] [CrossRef]
- Guan, C.; Fu, S.; Zhen, D.; Yang, K.; An, J.; Wang, Y.; Ma, C.; Jiang, N.; Zhao, N.; Liu, J.; et al. Metabolic (Dysfunction)-Associated Fatty Liver Disease in Chinese Patients with Type 2 Diabetes from a Subcenter of the National Metabolic Management Center. J. Diabetes Res. 2022, 2022, e8429847. [Google Scholar] [CrossRef] [PubMed]
- Singh, A.; Le, P.; Peerzada, M.M.; Lopez, R.; Alkhouri, N. The Utility of Noninvasive Scores in Assessing the Prevalence of Nonalcoholic Fatty Liver Disease and Advanced Fibrosis in Type 2 Diabetic Patients. J. Clin. Gastroenterol. 2018, 52, 268–272. [Google Scholar] [CrossRef] [PubMed]
- Ciardullo, S.; Sala, I.; Perseghin, G. Screening Strategies for Nonalcoholic Fatty Liver Disease in Type 2 Diabetes: Insights from NHANES 2005-2016. Diabetes Res. Clin. Pract. 2020, 167, 108358. [Google Scholar] [CrossRef]
- Singh, A.; Garg, R.; Lopez, R.; Alkhouri, N. Diabetes Liver Fibrosis Score to Detect Advanced Fibrosis in Diabetics with Nonalcoholic Fatty Liver Disease. Clin. Gastroenterol. Hepatol. 2022, 20, e624–e626. [Google Scholar] [CrossRef] [PubMed]
- Bertot, L.C.; Jeffrey, G.P.; de Boer, B.; MacQuillan, G.; Garas, G.; Chin, J.; Huang, Y.; Adams, L.A. Diabetes Impacts Prediction of Cirrhosis and Prognosis by Non-Invasive Fibrosis Models in Non-Alcoholic Fatty Liver Disease. Liver Int. Off. J. Int. Assoc. Study Liver 2018, 38, 1793–1802. [Google Scholar] [CrossRef] [PubMed]
- Lee, Y.; Cho, Y.; Lee, B.-W.; Park, C.-Y.; Lee, D.H.; Cha, B.-S.; Rhee, E.-J. Nonalcoholic Fatty Liver Disease in Diabetes. Part I: Epidemiology and Diagnosis. Diabetes Metab. J. 2019, 43, 31–45. [Google Scholar] [CrossRef]
- Prashanth, M.; Ganesh, H.K.; Vima, M.V.; John, M.; Bandgar, T.; Joshi, S.R.; Shah, S.R.; Rathi, P.M.; Joshi, A.S.; Thakkar, H.; et al. Prevalence of Nonalcoholic Fatty Liver Disease in Patients with Type 2 Diabetes Mellitus. J. Assoc. Physicians India 2009, 57, 205–210. [Google Scholar]
- Williamson, R.M.; Price, J.F.; Glancy, S.; Perry, E.; Nee, L.D.; Hayes, P.C.; Frier, B.M.; Van Look, L.A.F.; Johnston, G.I.; Reynolds, R.M.; et al. Prevalence of and Risk Factors for Hepatic Steatosis and Nonalcoholic Fatty Liver Disease in People with Type 2 Diabetes: The Edinburgh Type 2 Diabetes Study. Diabetes Care 2011, 34, 1139–1144. [Google Scholar] [CrossRef]
- Garg, H.; Aggarwal, S.; Shalimar; Yadav, R.; Datta Gupta, S.; Agarwal, L.; Agarwal, S. Utility of Transient Elastography (Fibroscan) and Impact of Bariatric Surgery on Nonalcoholic Fatty Liver Disease (NAFLD) in Morbidly Obese Patients. Surg. Obes. Relat. Dis. Off. J. Am. Soc. Bariatr. Surg. 2018, 14, 81–91. [Google Scholar] [CrossRef]
- Troelstra, M.A.; Witjes, J.J.; van Dijk, A.-M.; Mak, A.L.; Gurney-Champion, O.; Runge, J.H.; Zwirs, D.; Stols-Gonçalves, D.; Zwinderman, A.H.; Ten Wolde, M.; et al. Assessment of Imaging Modalities Against Liver Biopsy in Nonalcoholic Fatty Liver Disease: The Amsterdam NAFLD-NASH Cohort. J. Magn. Reson. Imaging JMRI 2021, 54, 1937–1949. [Google Scholar] [CrossRef]
- Francque, S.M.; Marchesini, G.; Kautz, A.; Walmsley, M.; Dorner, R.; Lazarus, J.V.; Zelber-Sagi, S.; Hallsworth, K.; Busetto, L.; Frühbeck, G.; et al. Non-Alcoholic Fatty Liver Disease: A Patient Guideline. JHEP Rep. Innov. Hepatol. 2021, 3, 100322. [Google Scholar] [CrossRef]
- Tomah, S.; Alkhouri, N.; Hamdy, O. Nonalcoholic Fatty Liver Disease and Type 2 Diabetes: Where Do Diabetologists Stand? Clin. Diabetes Endocrinol. 2020, 6, 9. [Google Scholar] [CrossRef] [PubMed]
- Negi, C.K.; Babica, P.; Bajard, L.; Bienertova-Vasku, J.; Tarantino, G. Insights into the Molecular Targets and Emerging Pharmacotherapeutic Interventions for Nonalcoholic Fatty Liver Disease. Metabolism 2022, 126, 154925. [Google Scholar] [CrossRef]
- Arab, J.P.; Barrera, F.; Gallego, C.; Valderas, J.P.; Uribe, S.; Tejos, C.; Serrano, C.; Serrano, C.; Huete, Á.; Liberona, J.; et al. High Prevalence of Undiagnosed Liver Cirrhosis and Advanced Fibrosis in Type 2 Diabetic Patients. Ann. Hepatol. 2016, 15, 721–728. [Google Scholar] [CrossRef] [PubMed]
- American Diabetes Association Standards of Medical Care in Diabetes—2022 Abridged for Primary Care Providers. Clin. Diabetes 2022, 40, 10–38. [CrossRef]
- Dietrich, C.F.; Bamber, J.; Berzigotti, A.; Bota, S.; Cantisani, V.; Castera, L.; Cosgrove, D.; Ferraioli, G.; Friedrich-Rust, M.; Gilja, O.H.; et al. EFSUMB Guidelines and Recommendations on the Clinical Use of Liver Ultrasound Elastography, Update 2017 (Short Version). Ultraschall Med. 2017, 38, 377–394. [Google Scholar] [CrossRef] [PubMed]
- Srinivasa Babu, A.; Wells, M.L.; Teytelboym, O.M.; Mackey, J.E.; Miller, F.H.; Yeh, B.M.; Ehman, R.L.; Venkatesh, S.K. Elastography in Chronic Liver Disease: Modalities, Techniques, Limitations, and Future Directions. Radiographics 2016, 36, 1987–2006. [Google Scholar] [CrossRef] [PubMed]
- Eddowes, P.J.; Sasso, M.; Allison, M.; Tsochatzis, E.; Anstee, Q.M.; Sheridan, D.; Guha, I.N.; Cobbold, J.F.; Deeks, J.J.; Paradis, V.; et al. Accuracy of FibroScan Controlled Attenuation Parameter and Liver Stiffness Measurement in Assessing Steatosis and Fibrosis in Patients With Nonalcoholic Fatty Liver Disease. Gastroenterology 2019, 156, 1717–1730. [Google Scholar] [CrossRef] [PubMed]
- Marie, S.; Tripp, D.K.K.; Cherrington, N.J. Strategies to Diagnose Non-Alcoholic Steatohepatitis: A Novel Approach to Take Advantage of Pharmacokinetic Alterations. Drug Metab. Dispos. 2022, 50, 492–499. [Google Scholar] [CrossRef]
- Cardoso, C.R.L.; Villela-Nogueira, C.A.; Leite, N.C.; Salles, G.F. Prognostic Impact of Liver Fibrosis and Steatosis by Transient Elastography for Cardiovascular and Mortality Outcomes in Individuals with Nonalcoholic Fatty Liver Disease and Type 2 Diabetes: The Rio de Janeiro Cohort Study. Cardiovasc. Diabetol. 2021, 20, 193. [Google Scholar] [CrossRef]
- Eskridge, W.; Vierling, J.M.; Gosbee, W.; Wan, G.A.; Hyunh, M.-L.; Chang, H.E. Screening for Undiagnosed Non-Alcoholic Fatty Liver Disease (NAFLD) and Non-Alcoholic Steatohepatitis (NASH): A Population-Based Risk Factor Assessment Using Vibration Controlled Transient Elastography (VCTE). PLoS ONE 2021, 16, e0260320. [Google Scholar] [CrossRef] [PubMed]
- Petroff, D.; Blank, V.; Newsome, P.N.; Shalimar; Voican, C.S.; Thiele, M.; de Lédinghen, V.; Baumeler, S.; Chan, W.K.; Perlemuter, G.; et al. Assessment of Hepatic Steatosis by Controlled Attenuation Parameter Using the M and XL Probes: An Individual Patient Data Meta-Analysis. Lancet Gastroenterol. Hepatol. 2021, 6, 185–198. [Google Scholar] [CrossRef]
- Berzigotti, A.; Tsochatzis, E.; Boursier, J.; Castera, L.; Cazzagon, N.; Friedrich-Rust, M.; Petta, S.; Thiele, M. EASL Clinical Practice Guidelines on Non-Invasive Tests for Evaluation of Liver Disease Severity and Prognosis–2021 Update. J. Hepatol. 2021, 75, 659–689. [Google Scholar] [CrossRef] [PubMed]
- Ferraioli, G. Ultrasound Techniques for the Assessment of Liver Stiffness: A Correct Terminology. Hepatology 2019, 69, 461. [Google Scholar] [CrossRef] [PubMed]
- Lupsor-Platon, M. Noninvasive Evaluation of Fibrosis and Steatosis in Nonalcoholic Fatty Liver Disease by Elastographic Methods; IntechOpen: London, UK, 2017; ISBN 978-953-51-3924-9. [Google Scholar]
- Yoneda, M.; Yoneda, M.; Yoneda, M.; Fujita, K.; Fujita, K.; Inamori, M.; Inamori, M.; Tamano, M.; Tamano, M.; Hiriishi, H.; et al. Transient Elastography in Patients with Non-Alcoholic Fatty Liver Disease (NAFLD). Gut 2007, 56, 1330–1331. [Google Scholar] [CrossRef] [PubMed]
- European Association for Study of Liver; Asociacion Latinoamericana para el Estudio del Higado EASL-ALEH Clinical Practice Guidelines: Non-Invasive Tests for Evaluation of Liver Disease Severity and Prognosis. J. Hepatol. 2015, 63, 237–264. [CrossRef]
- Lim, J.K.; Flamm, S.L.; Singh, S.; Falck-Ytter, Y.T. Clinical Guidelines Committee of the American Gastroenterological Association American Gastroenterological Association Institute Guideline on the Role of Elastography in the Evaluation of Liver Fibrosis. Gastroenterology 2017, 152, 1536–1543. [Google Scholar] [CrossRef]
- Roulot, D. Screening for Liver Fibrosis in General or At-Risk Populations Using Transient Elastography. In Liver Elastography: Clinical Use and Interpretation; Mueller, S., Ed.; Springer International Publishing: Cham, Switzerland, 2020; pp. 545–550. ISBN 978-3-030-40542-7. [Google Scholar]
- Sporea, I.; Șirli, R.; Mare, R.; Popescu, A.; Ivașcu, S.C. Feasibility of Transient Elastography with M and XL Probes in Real Life. Med. Ultrason. 2016, 18, 7–10. [Google Scholar] [CrossRef]
- De Franchis, R. Baveno VI Faculty Expanding Consensus in Portal Hypertension: Report of the Baveno VI Consensus Workshop: Stratifying Risk and Individualizing Care for Portal Hypertension. J. Hepatol. 2015, 63, 743–752. [Google Scholar] [CrossRef]
- Mantovani, A.; Byrne, C.D.; Bonora, E.; Targher, G. Nonalcoholic Fatty Liver Disease and Risk of Incident Type 2 Diabetes: A Meta-Analysis. Diabetes Care 2018, 41, 372–382. [Google Scholar] [CrossRef]
- Koehler, E.M.; Plompen, E.P.C.; Schouten, J.N.L.; Hansen, B.E.; Darwish Murad, S.; Taimr, P.; Leebeek, F.W.G.; Hofman, A.; Stricker, B.H.; Castera, L.; et al. Presence of Diabetes Mellitus and Steatosis Is Associated with Liver Stiffness in a General Population: The Rotterdam Study. Hepatology 2016, 63, 138–147. [Google Scholar] [CrossRef] [PubMed] [Green Version]
- Hari, A. Ultrasound Elastography-Cornerstone of Non-Invasive Metabolic Dysfunction-Associated Fatty Liver Disease Assessment. Med. Kaunas Lith. 2021, 57, 516. [Google Scholar] [CrossRef] [PubMed]
- Cho, H.J.; Hwang, S.; Park, J.I.; Yang, M.J.; Hwang, J.C.; Yoo, B.M.; Lee, K.M.; Shin, S.J.; Lee, K.J.; Kim, J.H.; et al. Improvement of Nonalcoholic Fatty Liver Disease Reduces the Risk of Type 2 Diabetes Mellitus. Gut Liver 2019, 13, 440–449. [Google Scholar] [CrossRef] [PubMed]
- Sawaf, B.; Ali, A.H.; Jaafar, R.F.; Kanso, M.; Mukherji, D.; Khalife, M.J.; Faraj, W. Spectrum of Liver Diseases in Patients Referred for Fibroscan: A Single Center Experience in the Middle East. Ann. Med. Surg. 2020, 57, 166–170. [Google Scholar] [CrossRef] [PubMed]
- Ahn, J.M.; Paik, Y.-H.; Kim, S.H.; Lee, J.H.; Cho, J.Y.; Sohn, W.; Gwak, G.-Y.; Choi, M.S.; Lee, J.H.; Koh, K.C.; et al. Relationship of Liver Stiffness and Controlled Attenuation Parameter Measured by Transient Elastography with Diabetes Mellitus in Patients with Chronic Liver Disease. J. Korean Med. Sci. 2014, 29, 1113–1119. [Google Scholar] [CrossRef] [PubMed]
- Patel, P.; Hossain, F.; Horsfall, L.U.; Banh, X.; Hayward, K.L.; Williams, S.; Johnson, T.; Bernard, A.; Brown, N.N.; Lampe, G.; et al. A Pragmatic Approach Identifies a High Rate of Nonalcoholic Fatty Liver Disease With Advanced Fibrosis in Diabetes Clinics and At-Risk Populations in Primary Care. Hepatol. Commun. 2018, 2, 897–909. [Google Scholar] [CrossRef] [PubMed]
- Sandrin, L. Liver Stiffness Measurement Using Vibration-Controlled Transient Elastography. In Liver Elastography: Clinical Use and Interpretation; Mueller, S., Ed.; Springer International Publishing: Cham, Switzerland, 2020; pp. 29–39. ISBN 978-3-030-40542-7. [Google Scholar]
- Tuong, T.T.K.; Tran, D.K.; Phu, P.Q.T.; Hong, T.N.D.; Chu Dinh, T.; Chu, D.T. Non-Alcoholic Fatty Liver Disease in Patients with Type 2 Diabetes: Evaluation of Hepatic Fibrosis and Steatosis Using Fibroscan. Diagnostics 2020, 10, 159. [Google Scholar] [CrossRef]
- Sobhonslidsuk, A.; Pulsombat, A.; Kaewdoung, P.; Petraksa, S. Non-Alcoholic Fatty Liver Disease (NAFLD) and Significant Hepatic Fibrosis Defined by Non-Invasive Assessment in Patients with Type 2 Diabetes. Asian Pac. J. Cancer Prev. APJCP 2015, 16, 1789–1794. [Google Scholar] [CrossRef]
- Eslam, M.; Newsome, P.N.; Sarin, S.K.; Anstee, Q.M.; Targher, G.; Romero-Gomez, M.; Zelber-Sagi, S.; Wai-Sun Wong, V.; Dufour, J.-F.; Schattenberg, J.M.; et al. A New Definition for Metabolic Dysfunction-Associated Fatty Liver Disease: An International Expert Consensus Statement. J. Hepatol. 2020, 73, 202–209. [Google Scholar] [CrossRef]
- Anstee, Q.M.; Lawitz, E.J.; Alkhouri, N.; Wong, V.W.-S.; Romero-Gomez, M.; Okanoue, T.; Trauner, M.; Kersey, K.; Li, G.; Han, L.; et al. Noninvasive Tests Accurately Identify Advanced Fibrosis Due to NASH: Baseline Data From the STELLAR Trials. Hepatology 2019, 70, 1521–1530. [Google Scholar] [CrossRef]
- Chan, W.-K.; Treeprasertsuk, S.; Goh, G.B.-B.; Fan, J.-G.; Song, M.J.; Charatcharoenwitthaya, P.; Duseja, A.; Dan, Y.-Y.; Imajo, K.; Nakajima, A.; et al. Optimizing Use of Nonalcoholic Fatty Liver Disease Fibrosis Score, Fibrosis-4 Score, and Liver Stiffness Measurement to Identify Patients With Advanced Fibrosis. Clin. Gastroenterol. Hepatol. 2019, 17, 2570–2580.e37. [Google Scholar] [CrossRef] [PubMed] [Green Version]
- Petta, S.; Vanni, E.; Bugianesi, E.; Di Marco, V.; Cammà, C.; Cabibi, D.; Mezzabotta, L.; Craxì, A. The Combination of Liver Stiffness Measurement and NAFLD Fibrosis Score Improves the Noninvasive Diagnostic Accuracy for Severe Liver Fibrosis in Patients with Nonalcoholic Fatty Liver Disease. Liver Int. 2015, 35, 1566–1573. [Google Scholar] [CrossRef] [PubMed]
- Petta, S.; Wong, V.W.-S.; Cammà, C.; Hiriart, J.-B.; Wong, G.L.-H.; Vergniol, J.; Chan, A.W.-H.; Di Marco, V.; Merrouche, W.; Chan, H.L.-Y.; et al. Serial Combination of Non-Invasive Tools Improves the Diagnostic Accuracy of Severe Liver Fibrosis in Patients with NAFLD. Aliment. Pharmacol. Ther. 2017, 46, 617–627. [Google Scholar] [CrossRef] [PubMed]
- Newsome, P.N.; Sasso, M.; Deeks, J.J.; Paredes, A.; Boursier, J.; Chan, W.-K.; Yilmaz, Y.; Czernichow, S.; Zheng, M.-H.; Wong, V.W.-S.; et al. FibroScan-AST (FAST) Score for the Non-Invasive Identification of Patients with Non-Alcoholic Steatohepatitis with Significant Activity and Fibrosis: A Prospective Derivation and Global Validation Study. Lancet Gastroenterol. Hepatol. 2020, 5, 362–373. [Google Scholar] [CrossRef]
- Casey, S.P.; Kemp, W.W.; McLean, C.A.; Topliss, D.J.; Adams, L.A.; Roberts, S.K. A Prospective Evaluation of the Role of Transient Elastography for the Detection of Hepatic Fibrosis in Type 2 Diabetes without Overt Liver Disease. Scand. J. Gastroenterol. 2012, 47, 836–841. [Google Scholar] [CrossRef]
- Dai, C.-Y.; Fang, T.-J.; Hung, W.-W.; Tsai, H.-J.; Tsai, Y.-C. The Determinants of Liver Fibrosis in Patients with Nonalcoholic Fatty Liver Disease and Type 2 Diabetes Mellitus. Biomedicines 2022, 10, 1487. [Google Scholar] [CrossRef]
- Trifan, A.; Stratina, E.; Nastasa, R.; Rotaru, A.; Stafie, R.; Zenovia, S.; Huiban, L.; Sfarti, C.; Cojocariu, C.; Cuciureanu, T.; et al. Simultaneously Screening for Liver Steatosis and Fibrosis in Romanian Type 2 Diabetes Mellitus Patients Using Vibration-Controlled Transient Elastography with Controlled Attenuation Parameter. Diagnostics 2022, 12, 1753. [Google Scholar] [CrossRef]
- Alexopoulos, A.-S.; Duffy, R.; Kobe, E.A.; German, J.; Moylan, C.A.; Soliman, D.; Jeffreys, A.S.; Coffman, C.J.; Crowley, M.J. Underrecognition of Nonalcoholic Fatty Liver Disease in Poorly Controlled Diabetes: A Call to Action in Diabetes Care. J. Endocr. Soc. 2021, 5, bvab155. [Google Scholar] [CrossRef]
- Chhabra, S.; Singh, S.P.; Singh, A.; Mehta, V.; Kaur, A.; Bansal, N.; Sood, A. Diabetes Mellitus Increases the Risk of Significant Hepatic Fibrosis in Patients With Non-Alcoholic Fatty Liver Disease. J. Clin. Exp. Hepatol. 2022, 12, 409–416. [Google Scholar] [CrossRef]
- Ciardullo, S.; Monti, T.; Perseghin, G. High Prevalence of Advanced Liver Fibrosis Assessed by Transient Elastography Among U.S. Adults With Type 2 Diabetes. Diabetes Care 2021, 44, 519–525. [Google Scholar] [CrossRef]
- Grgurevic, I.; Salkic, N.; Mustapic, S.; Bokun, T.; Podrug, K.; Marusic, S.; Rahelic, D.; Matic, T.; Skurla, V.; Mikolasevic, I. Liver and Nonliver-Related Outcomes at 2 Years Are Not Influenced by the Results of the FIB-4 Test and Liver Elastography in a Real-Life Cohort of Patients with Type 2 Diabetes. Can. J. Gastroenterol. Hepatol. 2021, 2021, 5582813. [Google Scholar] [CrossRef] [PubMed]
- Gupta, A.; Anoop, S.; Ansari, I.A.; Prakash, S.; Misra, A. High Prevalence of Hepatic Steatosis and Hepatic Fibrosis in Patients with Type 2 Diabetes Mellitus. Clin. Nutr. ESPEN 2021, 46, 519–526. [Google Scholar] [CrossRef] [PubMed]
- Lomonaco, R.; Godinez Leiva, E.; Bril, F.; Shrestha, S.; Mansour, L.; Budd, J.; Portillo Romero, J.; Schmidt, S.; Chang, K.-L.; Samraj, G.; et al. Advanced Liver Fibrosis Is Common in Patients With Type 2 Diabetes Followed in the Outpatient Setting: The Need for Systematic Screening. Diabetes Care 2021, 44, 399–406. [Google Scholar] [CrossRef] [PubMed]
- Makker, J.; Tariq, H.; Kumar, K.; Ravi, M.; Shaikh, D.H.; Leung, V.; Hayat, U.; Hassan, M.T.; Patel, H.; Nayudu, S.; et al. Prevalence of Advanced Liver Fibrosis and Steatosis in Type-2 Diabetics with Normal Transaminases: A Prospective Cohort Study. World J. Gastroenterol. 2021, 27, 523–533. [Google Scholar] [CrossRef] [PubMed]
- Mansour, D.; Grapes, A.; Herscovitz, M.; Cassidy, P.; Vernazza, J.; Broad, A.; Anstee, Q.M.; McPherson, S. Embedding Assessment of Liver Fibrosis into Routine Diabetic Review in Primary Care. JHEP Rep. Innov. Hepatol. 2021, 3, 100293. [Google Scholar] [CrossRef]
- Sagara, M.; Iijima, T.; Kase, M.; Kato, K.; Sakurai, S.; Tomaru, T.; Jojima, T.; Usui, I.; Aso, Y. Serum Levels of Soluble Dipeptidyl Peptidase-4 in Type 2 Diabetes Are Associated with Severity of Liver Fibrosis Evaluated by Transient Elastography (FibroScan) and the FAST (FibroScan-AST) Score, a Novel Index of Non-Alcoholic Steatohepatitis with Significant Fibrosis. J. Diabetes Complicat. 2021, 35, 107885. [Google Scholar] [CrossRef]
- Trivedi, H.D.; Suri, J.; Oh, D.; Schwartz, J.; Goyes, D.; Idriss, R.; Curry, M.P.; Lai, M. The Presence of Diabetes Impacts Liver Fibrosis and Steatosis by Transient Elastography in a Primary Care Population. Ann. Hepatol. 2021, 24, 100336. [Google Scholar] [CrossRef]
- Blank, V.; Petroff, D.; Beer, S.; Böhlig, A.; Heni, M.; Berg, T.; Bausback, Y.; Dietrich, A.; Tönjes, A.; Hollenbach, M.; et al. Current NAFLD Guidelines for Risk Stratification in Diabetic Patients Have Poor Diagnostic Discrimination. Sci. Rep. 2020, 10, 18345. [Google Scholar] [CrossRef]
- Lee, C.-H.; Seto, W.-K.; Ieong, K.; Lui, D.T.W.; Fong, C.H.Y.; Wan, H.Y.; Chow, W.-S.; Woo, Y.-C.; Yuen, M.-F.; Lam, K.S.L. Development of a Non-Invasive Liver Fibrosis Score Based on Transient Elastography for Risk Stratification in Patients with Type 2 Diabetes. Endocrinol. Metab. 2021, 36, 134–145. [Google Scholar] [CrossRef]
- Lee, H.W.; Wong, G.L.-H.; Kwok, R.; Choi, K.C.; Chan, C.K.-M.; Shu, S.S.-T.; Leung, J.K.-Y.; Chim, A.M.-L.; Luk, A.O.-Y.; Ma, R.C.-W.; et al. Serial Transient Elastography Examinations to Monitor Patients With Type 2 Diabetes: A Prospective Cohort Study. Hepatology 2020, 72, 1230–1241. [Google Scholar] [CrossRef]
- Mantovani, A.; Turino, T.; Lando, M.G.; Gjini, K.; Byrne, C.D.; Zusi, C.; Ravaioli, F.; Colecchia, A.; Maffeis, C.; Salvagno, G.; et al. Screening for Non-Alcoholic Fatty Liver Disease Using Liver Stiffness Measurement and Its Association with Chronic Kidney Disease and Cardiovascular Complications in Patients with Type 2 Diabetes. Diabetes Metab. 2020, 46, 296–303. [Google Scholar] [CrossRef] [PubMed]
- Mikolasevic, I.; Domislovic, V.; Turk Wensveen, T.; Delija, B.; Klapan, M.; Juric, T.; Lukic, A.; Mijic, A.; Skenderevic, N.; Puz, P.; et al. Screening for Nonalcoholic Fatty Liver Disease in Patients with Type 2 Diabetes Mellitus Using Transient Elastography-a Prospective, Cross Sectional Study. Eur. J. Intern. Med. 2020, 82, 68–75. [Google Scholar] [CrossRef] [PubMed]
- Sporea, I.; Mare, R.; Popescu, A.; Nistorescu, S.; Baldea, V.; Sirli, R.; Braha, A.; Sima, A.; Timar, R.; Lupusoru, R. Screening for Liver Fibrosis and Steatosis in a Large Cohort of Patients with Type 2 Diabetes Using Vibration Controlled Transient Elastography and Controlled Attenuation Parameter in a Single-Center Real-Life Experience. J. Clin. Med. 2020, 9, E1032. [Google Scholar] [CrossRef]
- Arya, S.; Haria, J.M.; Mishra, A. To Study the Occurrence of Non-Alcoholic Fatty Liver Disease (NAFLD) in Type -II Diabetes Mellitus. J. Assoc. Physicians India 2020, 68, 51. [Google Scholar] [PubMed]
- Demir, M.; Deyneli, O.; Yılmaz, Y. Screening for Hepatic Fibrosis and Steatosis in Turkish Patients with Type 2 Diabetes Mellitus: A Transient Elastography Study. Turk. J. Gastroenterol. 2019, 30, 266–270. [Google Scholar] [CrossRef] [PubMed]
- Fernando, J.N.; Alba, R.L.; Alba, W. Factors Associated with the Severity of Findings on Hepatic Transient Elastography among Persons with Type 2 Diabetes and Fatty Liver. J. ASEAN Fed. Endocr. Soc. 2019, 34, 134–143. [Google Scholar] [CrossRef]
- Jaafar, R.F.; Hajj Ali, A.M.; Zaghal, A.M.; Kanso, M.; Habib, S.G.; Halaoui, A.F.; Daniel, F.; Mokaddem, F.; Khalife, M.J.; Mukherji, D.M.; et al. Fibroscan and Low-Density Lipoprotein as Determinants of Severe Liver Fibrosis in Diabetic Patients with Nonalcoholic Fatty Liver Disease. Eur. J. Gastroenterol. Hepatol. 2019, 31, 1540–1544. [Google Scholar] [CrossRef]
- Kumar, N.A.; Das, S. Fibroscan of Liver in Type 2 Diabetes Mellitus and Its Correlation with Risk Factors. J. Diabetes Mellit. 2019, 9, 62–68. [Google Scholar] [CrossRef]
- Lai, L.-L.; Wan Yusoff, W.N.I.; Vethakkan, S.R.; Nik Mustapha, N.R.; Mahadeva, S.; Chan, W.-K. Screening for Non-Alcoholic Fatty Liver Disease in Patients with Type 2 Diabetes Mellitus Using Transient Elastography. J. Gastroenterol. Hepatol. 2019, 34, 1396–1403. [Google Scholar] [CrossRef]
- Lombardi, R.; Airaghi, L.; Targher, G.; Serviddio, G.; Maffi, G.; Mantovani, A.; Maffeis, C.; Colecchia, A.; Villani, R.; Rinaldi, L.; et al. Liver Fibrosis by FibroScan® Independently of Established Cardiovascular Risk Parameters Associates with Macrovascular and Microvascular Complications in Patients with Type 2 Diabetes. Liver Int. 2020, 40, 347–354. [Google Scholar] [CrossRef]
- Wong, V.W.-S.; Irles, M.; Wong, G.L.-H.; Shili, S.; Chan, A.W.-H.; Merrouche, W.; Shu, S.S.-T.; Foucher, J.; Le Bail, B.; Chan, W.K.; et al. Unified Interpretation of Liver Stiffness Measurement by M and XL Probes in Non-Alcoholic Fatty Liver Disease. Gut 2019, 68, 2057–2064. [Google Scholar] [CrossRef] [PubMed]
- Zhao, H.; Song, X.; Li, Z.; Wang, X. Risk Factors Associated with Nonalcohol Fatty Liver Disease and Fibrosis among Patients with Type 2 Diabetes Mellitus. Medicine 2018, 97, e12356. [Google Scholar] [CrossRef] [PubMed]
- Kartikayan, R.; Vaishnavi Priya, C.; Rajkumar Solomon, T.; Aravind, A.; Caroline Selvi, K.; Balamurali, R.; Ramkumar, G.; Muthukumaran, K.; Kavitha, S.; Anand, A.; et al. Assessment of Liver Stiffness by Transient Elastography in Diabetics with Fatty Liver–A Single Center Cross Sectional Observational Study. IOSR J. Dent. Med. Sci. 2017, 16, 49–53. [Google Scholar] [CrossRef]
- Prasetya, I.B.; Hasan, I.; Wisnu, W.; Rumende, C.M. Prevalence and Profile of Fibrosis in Diabetic Patients with Non-Alcoholic Fatty Liver Disease and the Associated Factors. Acta Medica Indones. 2017, 49, 91–98. [Google Scholar]
- Kwok, R.; Choi, K.C.; Wong, G.L.-H.; Zhang, Y.; Chan, H.L.-Y.; Luk, A.O.-Y.; Shu, S.S.-T.; Chan, A.W.-H.; Yeung, M.-W.; Chan, J.C.-N.; et al. Screening Diabetic Patients for Non-Alcoholic Fatty Liver Disease with Controlled Attenuation Parameter and Liver Stiffness Measurements: A Prospective Cohort Study. Gut 2016, 65, 1359–1368. [Google Scholar] [CrossRef]
- De Lédinghen, V.; Vergniol, J.; Gonzalez, C.; Foucher, J.; Maury, E.; Chemineau, L.; Villars, S.; Gin, H.; Rigalleau, V. Screening for Liver Fibrosis by Using FibroScan(®) and FibroTest in Patients with Diabetes. Dig. Liver Dis. 2012, 44, 413–418. [Google Scholar] [CrossRef] [PubMed]
- Selvaraj, E.A.; Mózes, F.E.; Jayaswal, A.N.A.; Zafarmand, M.H.; Vali, Y.; Lee, J.A.; Levick, C.K.; Young, L.A.J.; Palaniyappan, N.; Liu, C.-H.; et al. Diagnostic Accuracy of Elastography and Magnetic Resonance Imaging in Patients with NAFLD: A Systematic Review and Meta-Analysis. J. Hepatol. 2021, 75, 770–785. [Google Scholar] [CrossRef]
- De Ledinghen, V. Fibrosis Assessment in Patients with NAFLD. In Liver Elastography: Clinical Use and Interpretation; Mueller, S., Ed.; Springer International Publishing: Cham, Switzerland, 2020; pp. 123–139. ISBN 978-3-030-40542-7. [Google Scholar]
- Roy, S. Clinical Case Series of Decrease in Shear Wave Elastography Values in Ten Diabetic Dyslipidemia Patients Having NAFLD with Saroglitazar 4 Mg: An Indian Experience. Case Rep. Med. 2020, 2020, 4287075. [Google Scholar] [CrossRef]
- Cassinotto, C.; Boursier, J.; de Lédinghen, V.; Lebigot, J.; Lapuyade, B.; Cales, P.; Hiriart, J.-B.; Michalak, S.; Bail, B.L.; Cartier, V.; et al. Liver Stiffness in Nonalcoholic Fatty Liver Disease: A Comparison of Supersonic Shear Imaging, FibroScan, and ARFI with Liver Biopsy. Hepatology 2016, 63, 1817–1827. [Google Scholar] [CrossRef]
- Jiang, W.; Huang, S.; Teng, H.; Wang, P.; Wu, M.; Zhou, X.; Ran, H. Diagnostic Accuracy of Point Shear Wave Elastography and Transient Elastography for Staging Hepatic Fibrosis in Patients with Non-Alcoholic Fatty Liver Disease: A Meta-Analysis. BMJ Open 2018, 8, e021787. [Google Scholar] [CrossRef]
- Giuffrè, M.; Giuricin, M.; Bonazza, D.; Rosso, N.; Giraudi, P.J.; Masutti, F.; Palmucci, S.; Basile, A.; Zanconati, F.; de Manzini, N.; et al. Optimization of Point-Shear Wave Elastography by Skin-to-Liver Distance to Assess Liver Fibrosis in Patients Undergoing Bariatric Surgery. Diagnostics 2020, 10, E795. [Google Scholar] [CrossRef] [PubMed]
- Barr, R.G.; Wilson, S.R.; Rubens, D.; Garcia-Tsao, G.; Ferraioli, G. Update to the Society of Radiologists in Ultrasound Liver Elastography Consensus Statement. Radiology 2020, 296, 263–274. [Google Scholar] [CrossRef] [PubMed]
- Meyer, G.; Dauth, N.; Grimm, M.; Herrmann, E.; Bojunga, J.; Friedrich-Rust, M. Shear Wave Elastography Reveals a High Prevalence of NAFLD-Related Fibrosis Even in Type 1 Diabetes. Exp. Clin. Endocrinol. Diabetes 2021. [Google Scholar] [CrossRef] [PubMed]
- Guzmán-Aroca, F.; Frutos-Bernal, M.D.; Bas, A.; Luján-Mompeán, J.A.; Reus, M.; de Dios Berná-Serna, J.; Parrilla, P. Detection of Non-Alcoholic Steatohepatitis in Patients with Morbid Obesity before Bariatric Surgery: Preliminary Evaluation with Acoustic Radiation Force Impulse Imaging. Eur. Radiol. 2012, 22, 2525–2532. [Google Scholar] [CrossRef]
- Corica, D.; Bottari, A.; Aversa, T.; Morabito, L.A.; Curatola, S.; Alibrandi, A.; Ascenti, G.; Wasniewska, M. Prospective Assessment of Liver Stiffness by Shear Wave Elastography in Childhood Obesity: A Pilot Study. Endocrine 2022, 75, 59–69. [Google Scholar] [CrossRef]
- Praveenraj, P.; Gomes, R.M.; Basuraju, S.; Kumar, S.; Senthilnathan, P.; Parathasarathi, R.; Rajapandian, S.; Palanivelu, C. Preliminary Evaluation of Acoustic Radiation Force Impulse Shear Wave Imaging to Detect Hepatic Fibrosis in Morbidly Obese Patients Before Bariatric Surgery. J. Laparoendosc. Adv. Surg. Tech. A 2016, 26, 192–195. [Google Scholar] [CrossRef]
- Shaji, N.; Singhai, A.; Sarawagi, R.; Pakhare, A.P.; Mishra, V.N.; Joshi, R. Assessment of Liver Fibrosis Using Non-Invasive Screening Tools in Individuals With Diabetes Mellitus and Metabolic Syndrome. Cureus 2022, 14, e22682. [Google Scholar] [CrossRef]
- Demirtas, D.; Kocaer, A.S.; Sumbul, H.E. The Role of Liver Elastography Point Quantification in the Assessment of Fibrosis in Non-Alcoholic Fatty Liver Disease and Comparison with Other Non-Invasive Methods. Akdeniz Med. J. 2020. [Google Scholar] [CrossRef]
- Roy, S.; Majumder, A. A Retrospective Study to Examine the Correlation of Bioelectrical Impedance Analysis with Shear-Wave Elastography in Indian Patients with Non-Alcoholic Fatty Liver Disease and Diabetes on Background Sodium-Glucose Cotransporter-2 Inhibitor Therapy. Cureus 2019, 11, e4674. [Google Scholar] [CrossRef]
- Castera, L. Noninvasive Evaluation of Nonalcoholic Fatty Liver Disease. Semin. Liver Dis. 2015, 35, 291–303. [Google Scholar] [CrossRef]
- Miyoshi, T.; Hamaguchi, M.; Kitagawa, N.; Hashimoto, Y.; Fukui, M. Correlation between Liver Stiffness by Two-Dimensional Shear Wave Elastography and Waist Circumference in Japanese Local Citizens with Abdominal Obesity. J. Clin. Med. 2021, 10, 1971. [Google Scholar] [CrossRef] [PubMed]
- Chimoriya, R.; Piya, M.K.; Simmons, D.; Ahlenstiel, G.; Ho, V. The Use of Two-Dimensional Shear Wave Elastography in People with Obesity for the Assessment of Liver Fibrosis in Non-Alcoholic Fatty Liver Disease. J. Clin. Med. 2021, 10, 95. [Google Scholar] [CrossRef]
- Jamialahmadi, T.; Jangjoo, A.; Rezvani, R.; Goshayeshi, L.; Tasbandi, A.; Nooghabi, M.J.; Rajabzadeh, F.; Ghaffarzadegan, K.; Mishamandani, Z.J.; Nematy, M. Hepatic Function and Fibrosis Assessment Via 2D-Shear Wave Elastography and Related Biochemical Markers Pre- and Post-Gastric Bypass Surgery. Obes. Surg. 2020, 30, 2251–2258. [Google Scholar] [CrossRef] [PubMed]
- Imajo, K.; Honda, Y.; Kobayashi, T.; Nagai, K.; Ozaki, A.; Iwaki, M.; Kessoku, T.; Ogawa, Y.; Takahashi, H.; Saigusa, Y.; et al. Direct Comparison of US and MR Elastography for Staging Liver Fibrosis in Patients with Nonalcoholic Fatty Liver Disease. Clin. Gastroenterol. Hepatol. 2022, 20, 908–917.e11. [Google Scholar] [CrossRef] [PubMed]
- Shaheen, A.A.; Riazi, K.; Medellin, A.; Bhayana, D.; Kaplan, G.G.; Jiang, J.; Park, R.; Schaufert, W.; Burak, K.W.; Sargious, M.; et al. Risk Stratification of Patients with Nonalcoholic Fatty Liver Disease Using a Case Identification Pathway in Primary Care: A Cross-Sectional Study. CMAJ Open 2020, 8, E370–E376. [Google Scholar] [CrossRef]
- Xie, L.-T.; Yan, C.-H.; Zhao, Q.-Y.; He, M.-N.; Jiang, T.-A. Quantitative and Noninvasive Assessment of Chronic Liver Diseases Using Two-Dimensional Shear Wave Elastography. World J. Gastroenterol. 2018, 24, 957–970. [Google Scholar] [CrossRef]
- Wernberg, C.; Thiele, M.; Balle Hugger, M. Steatosis Assessment with Controlled Attenuation Parameter (CAP) in Various Diseases. In Liver Elastography; Sebastian, M., Ed.; Springer: Berlin/Heidelberg, Germany, 2020; pp. 441–457. ISBN 978-3-030-40541-0. [Google Scholar]
- Sasso, M.; Beaugrand, M.; de Ledinghen, V.; Douvin, C.; Marcellin, P.; Poupon, R.; Sandrin, L.; Miette, V. Controlled Attenuation Parameter (CAP): A Novel VCTETM Guided Ultrasonic Attenuation Measurement for the Evaluation of Hepatic Steatosis: Preliminary Study and Validation in a Cohort of Patients with Chronic Liver Disease from Various Causes. Ultrasound Med. Biol. 2010, 36, 1825–1835. [Google Scholar] [CrossRef] [PubMed]
- Ferraioli, G.; Kumar, V.; Ozturk, A.; Nam, K.; de Korte, C.L.; Barr, R.G. US Attenuation for Liver Fat Quantification: An AIUM-RSNA QIBA Pulse-Echo Quantitative Ultrasound Initiative. Radiology 2022, 302, 495–506. [Google Scholar] [CrossRef]
- Karlas, T.; Petroff, D.; Sasso, M.; Fan, J.-G.; Mi, Y.-Q.; de Lédinghen, V.; Kumar, M.; Lupsor-Platon, M.; Han, K.-H.; Cardoso, A.C.; et al. Individual Patient Data Meta-Analysis of Controlled Attenuation Parameter (CAP) Technology for Assessing Steatosis. J. Hepatol. 2017, 66, 1022–1030. [Google Scholar] [CrossRef]
- Naveau, S.; Voican, C.S.; Lebrun, A.; Gaillard, M.; Lamouri, K.; Njiké-Nakseu, M.; Courie, R.; Tranchart, H.; Balian, A.; Prévot, S.; et al. Controlled Attenuation Parameter for Diagnosing Steatosis in Bariatric Surgery Candidates with Suspected Nonalcoholic Fatty Liver Disease. Eur. J. Gastroenterol. Hepatol. 2017, 29, 1022–1030. [Google Scholar] [CrossRef]
- Wan, T.; Köhn, N.; Kröll, D.; Berzigotti, A. Applicability and Results of Liver Stiffness Measurement and Controlled Attenuation Parameter Using XL Probe for Metabolic-Associated Fatty Liver Disease in Candidates to Bariatric Surgery. A Single-Center Observational Study. Obes. Surg. 2021, 31, 702–711. [Google Scholar] [CrossRef] [PubMed]
- Vedtofte, L.; Bahne, E.; Foghsgaard, S.; Bagger, J.I.; Andreasen, C.; Strandberg, C.; Gørtz, P.M.; Holst, J.J.; Grønbæk, H.; Svare, J.A.; et al. One Year’s Treatment with the Glucagon-Like Peptide 1 Receptor Agonist Liraglutide Decreases Hepatic Fat Content in Women with Nonalcoholic Fatty Liver Disease and Prior Gestational Diabetes Mellitus in a Randomized, Placebo-Controlled Trial. J. Clin. Med. 2020, 9, 3213. [Google Scholar] [CrossRef] [PubMed]
- Seko, Y.; Sumida, Y.; Tanaka, S.; Mori, K.; Taketani, H.; Ishiba, H.; Hara, T.; Okajima, A.; Umemura, A.; Nishikawa, T.; et al. Effect of 12-Week Dulaglutide Therapy in Japanese Patients with Biopsy-Proven Non-Alcoholic Fatty Liver Disease and Type 2 Diabetes Mellitus. Hepatol. Res. 2017, 47, 1206–1211. [Google Scholar] [CrossRef] [PubMed]
- Lee, Y.; Kim, J.H.; Kim, S.R.; Jin, H.Y.; Rhee, E.-J.; Cho, Y.M.; Lee, B.-W. Lobeglitazone, a Novel Thiazolidinedione, Improves Non-Alcoholic Fatty Liver Disease in Type 2 Diabetes: Its Efficacy and Predictive Factors Related to Responsiveness. J. Korean Med. Sci. 2017, 32, 60–69. [Google Scholar] [CrossRef] [PubMed]
- Sanyal, A.J.; Chalasani, N.; Kowdley, K.V.; McCullough, A.; Diehl, A.M.; Bass, N.M.; Neuschwander-Tetri, B.A.; Lavine, J.E.; Tonascia, J.; Unalp, A.; et al. Pioglitazone, Vitamin E, or Placebo for Nonalcoholic Steatohepatitis. N. Engl. J. Med. 2010, 362, 1675–1685. [Google Scholar] [CrossRef]
- Shimizu, M.; Suzuki, K.; Kato, K.; Jojima, T.; Iijima, T.; Murohisa, T.; Iijima, M.; Takekawa, H.; Usui, I.; Hiraishi, H.; et al. Evaluation of the Effects of Dapagliflozin, a Sodium-Glucose Co-Transporter-2 Inhibitor, on Hepatic Steatosis and Fibrosis Using Transient Elastography in Patients with Type 2 Diabetes and Non-Alcoholic Fatty Liver Disease. Diabetes Obes. Metab. 2019, 21, 285–292. [Google Scholar] [CrossRef]
- Rinella, M.E.; Tacke, F.; Sanyal, A.J.; Anstee, Q.M. Participants of the AASLD/EASL Workshop Report on the AASLD/EASL Joint Workshop on Clinical Trial Endpoints in NAFLD. Hepatology 2019, 70, 1424–1436. [Google Scholar] [CrossRef]
- Fujita, N.; Nishie, A.; Asayama, Y.; Ishigami, K.; Ushijima, Y.; Takayama, Y.; Okamoto, D.; Shirabe, K.; Yoshizumi, T.; Kotoh, K.; et al. Fibrosis in Nonalcoholic Fatty Liver Disease: Noninvasive Assessment Using Computed Tomography Volumetry. World J. Gastroenterol. 2016, 22, 8949–8955. [Google Scholar] [CrossRef]
- Graupera, I.; Thiele, M.; Ma, A.T.; Serra-Burriel, M.; Pich, J.; Fabrellas, N.; Caballeria, L.; de Knegt, R.J.; Grgurevic, I.; Reichert, M.; et al. LiverScreen Project: Study Protocol for Screening for Liver Fibrosis in the General Population in European Countries. BMC Public Health 2022, 22, 1385. [Google Scholar] [CrossRef]
- Harrison, S.A.; Oliver, D.; Arnold, H.L.; Gogia, S.; Neuschwander-Tetri, B.A. Development and Validation of a Simple NAFLD Clinical Scoring System for Identifying Patients without Advanced Disease. Gut 2008, 57, 1441–1447. [Google Scholar] [CrossRef]
- Venkatesh, S.K.; Yin, M.; Takahashi, N.; Glockner, J.F.; Talwalkar, J.A.; Ehman, R.L. Non-Invasive Detection of Liver Fibrosis: MR Imaging Features vs. MR Elastography. Abdom. Imaging 2015, 40, 766–775. [Google Scholar] [CrossRef]
- Dobbie, L.J.; Kassab, M.; Davison, A.S.; Grace, P.; Cuthbertson, D.J.; Hydes, T.J. Low Screening Rates Despite a High Prevalence of Significant Liver Fibrosis in People with Diabetes from Primary and Secondary Care. J. Clin. Med. 2021, 10, 5755. [Google Scholar] [CrossRef]
- Park, S.H.; Lee, J.H.; Jun, D.W.; Kang, K.A.; Kim, J.N.; Park, H.J.; Hong, H.P. Determining the Target Population That Would Most Benefit from Screening for Hepatic Fibrosis in a Primary Care Setting. Diagnostics 2021, 11, 1605. [Google Scholar] [CrossRef]
- Pandyarajan, V.; Gish, R.G.; Alkhouri, N.; Noureddin, M. Screening for Nonalcoholic Fatty Liver Disease in the Primary Care Clinic. Gastroenterol. Hepatol. 2019, 15, 357–365. [Google Scholar]
- Bril, F.; Cusi, K. Management of Nonalcoholic Fatty Liver Disease in Patients With Type 2 Diabetes: A Call to Action. Diabetes Care 2017, 40, 419–430. [Google Scholar] [CrossRef]
- Fang, C.; Lim, A.; Sidhu, P.S. Ultrasound-Based Liver Elastography in the Assessment of Fibrosis. Clin. Radiol. 2020, 75, 822–831. [Google Scholar] [CrossRef]
- Cusi, K.; Isaacs, S.; Barb, D.; Basu, R.; Caprio, S.; Garvey, W.T.; Kashyap, S.; Mechanick, J.I.; Mouzaki, M.; Nadolsky, K.; et al. American Association of Clinical Endocrinology Clinical Practice Guideline for the Diagnosis and Management of Nonalcoholic Fatty Liver Disease in Primary Care and Endocrinology Clinical Settings: Co-Sponsored by the American Association for the Study of Liver Diseases (AASLD). Endocr. Pract. 2022, 28, 528–562. [Google Scholar] [CrossRef]
- Dokmak, A.; Lizaola-Mayo, B.; Trivedi, H.D. The Impact of Nonalcoholic Fatty Liver Disease in Primary Care: A Population Health Perspective. Am. J. Med. 2021, 134, 23–29. [Google Scholar] [CrossRef]
- Sporea, I.; Grădinaru-Taşcău, O.; Bota, S.; Popescu, A.; Şirli, R.; Jurchiş, A.; Popescu, M.; Dănilă, M. How Many Measurements Are Needed for Liver Stiffness Assessment by 2D-Shear Wave Elastography (2D-SWE) and Which Value Should Be Used: The Mean or Median? Med. Ultrason. 2013, 15, 268–272. [Google Scholar] [CrossRef]
- Sanyal, A.J.; Shankar, S.S.; Calle, R.A.; Samir, A.E.; Sirlin, C.B.; Sherlock, S.P.; Loomba, R.; Fowler, K.J.; Dehn, C.A.; Heymann, H.; et al. Non-Invasive Biomarkers of Nonalcoholic Steatohepatitis: The FNIH NIMBLE Project. Nat. Med. 2022, 28, 430–432. [Google Scholar] [CrossRef]
- LITMUS-Liver Investigation: Testing Marker Utility in Steatohepatitis Home Page. Available online: https://litmus-project.eu/ (accessed on 20 August 2022).


| Author, Ref. | Year | Country | No. of Patients | No. of NAFLD Patients | No. of Diabetic Patients | Diabetes Duration (Years) | Mean Age (Years) | Mean BMI (kg/m2) | Fibrosis Stage | Cut-Off Level (kPa) |
|---|---|---|---|---|---|---|---|---|---|---|
| Dai et al. [70] | 2022 | Taiwan | 226 | 50 | 226 | 10 ± 7.8 | 62.1 ± 10.7 | 27.3 ± 4.1 | F3–4: 50 | >7 |
| Trifan et al. [71] | 2022 | Romania | 424 | 349 | 424 | 53.67 ± 11.37 | 28.07 ± 3.22 | F2: 57.14% F3: 11.7% F4: 13.6% | ≥8.2 ≥9.7 ≥13.6 | |
| Alexopoulos et al. [72] | 2021 | USA | 228 DM | 15 5 (TE) unknown NAFLD | 228 | 12.5 | 58.1 | 35 | F0–1: 40% F2: 20% F3: 40% F4: 0 | Unavailable |
| Known NAFLD 4 (TE) | 15.1 | 57.9 | 37.8 | F0–1: 25% F2: 25% F3: 50% F4: 0 | Unavailable | |||||
| Cardoso et al. [41] | 2021 | Brasil | 400 | 173 | 400 | 8 (3–15) | 64.4 | 30.4 | ≥F3: 15% | >9.6 |
| Chhabra et al. [73] | 2021 | India | 200 | 200 | 100 | – | 50.3 ± 11.13 | – | F1 F2: 30% F3–F4: 70% | <7 ≥7–8.6 ≥8.7–11.4 ≥11.5 |
| Ciardullo et al. [74] | 2021 | USA | 825 | 557 steatosis 179 fibrosis | 825 | 9.9 ± 0.75 9.2 ± 2.09 12.9 ± 4.08 10.4 ± 9.23 | 60.6 | 31.9 ± 0.47 36.3 ± 1,11 37.5 ± 1.42 38.9 ± 1.45 | F0–F1: 76.2% F2: 8.4% F3: 7.7% F4: 7.7% | <8.2 8.2–9.6 9.7–13.5 ≥13.6 |
| Grgurevic et al. [75] | 2021 | Croatia | 454 | 164 | 454 | – | 62.5 | 30.09 | 86 45 33 | >7.9 ≥9.6 ≥11.5 |
| Gupta et al. [76] | 2021 | India | 250 DM | 246 steatosis 205 fibrosis | 250 | 9.6 ± 6.4 | 51 ± 9 | 31.4 ± 8 | F0: 28.8% F1: 14.8% F2: 18.4% F3: 19.6% | <7 7.1–10 10.1–13 ≥13 |
| Lomonaco et al. [77] | 2021 | USA | 561 | 70% steatosis 21% fibrosis | 561 | – | 60 ± 11 | 33.4 ± 6.2 | F1: 6.5% F2: 5.6% F3: 6.2% F4: 3% | ≥7–8.1 8.2–9.6 9.7–13.5 ≥13.6 |
| Makker et al. [78] | 2021 | USA | 85 | - | 59 | 15 ± 9 | 62 ± 11.7 | 33.1 ± 8.4 | F0–1: 76% F2: 12% F3: 5% F4: 7% | ≤7 ≥7.5 ≥10 ≥14 |
| Mansour et al. [79] | 2021 | United Kingdom | 466 | 58 underwent TE, according to FIB-4 | 466 | – | 65.22 | 33.36 | 43.1% 20.7% 22.4% | >8 8–15 >15 |
| Sagara et al. [80] | 2021 | Japan | 115 | 67 | 115 | – | 59 ± 13.8 | 26.6 ± 4.7 | F2: 25% F3: 20.5% F4: 13.3% | 8–9.6 9.7–12.9 ≥13 |
| Trivedi et al. [81] | 2021 | USA | 437 | 385 | 124 | – | 58.4 | 33.5 | 52 100 24 | ≥7 <10 ≥10 |
| Blank et al. [82] | 2020 | Germany | 204 | 184 | 203 | 13 ± 10.3 | 64.2 ± 10.7 | 32.6 ± 7.6 | Low 125 Intermediate 10 High 46 | <7.9/7.2 M/XL probe 7.9–9.6/7.2–9.3 M/XL probe >9.6/9.3 M/XL probe |
| Lee CH et al. [83] | 2020 | China | 711 | 711 | 711 | 16.6 ± 9.2 | 59.4 ± 10.3 | 28.6 ± 4.5 | F0/F1: 40.2% F2: 40.3 % ≥F3: 19.5 % | - - ≥9.6 |
| Lee HW et al. [84] | 2020 | China | 611 | Baseline 611 | 611 | – | 57.7 ± 10.9 | – | 63.5% 20% | <10 ≥10 |
| After 3 years 611 | 56.5% 4.3% | <10 ≥10 | ||||||||
| Mantovani et al. [85] | 2020 | Italy | 137 | 37 | 137 | 11 | 69.9 ± 7 | 28.5 ± 4.7 | F2: 17.5% F3: 10.2% | ≥7 ≥8.7 |
| Mikolasevic et al. [86] | 2020 | Croatia | 679 | M probe 366 XL probe 313 | 679 | – | 65.2 ± 11.6 | 30.75 ± 5.15 | F1: 27.6% F2: 29.5% F3: 29.5% F4: 6.7% | - ≥7 ≥9.6/9.3 M/XL probe ≥11.5/11 M/XL probe |
| Sawaf et al. [57] | 2020 | Lebanon | 620 | 362 | 128 | – | 47.8 ± 13.4 | 26.21 ± 4.3 | F0–1: 56.6% F2: 9.3% F3: 6.1% F4: 27.9% | Unavailable |
| Sporea et al. [87] | 2020 | Romania | 776 | 534 | 534 | 10 ± 2 | 60.8 ± 8.7 | 32 ± 6 | ≤F1: 72.6% ≥F2: 7.8% ≥F3: 11.4% F4: 8.2% | - 8.2 9.7 13.6 |
| Tuong et al. [61] | 2020 | Vietnam | 307 | 18 | 307 | 6.5 (3–10) | 58.7 ± 11.3 | 26.3 ± 3.1 | F2: 13% F3: 5.9% F4: 3.6% | ≥7 ≥8.7 ≥11.5 |
| Arya et al. [88] | 2019 | India | 19,550 | 6749 | 13,498 | 7.52 ± 4.46 | 50 | 40% obese 22% overweight 30% normal 8% underweight | F0: 32% F1: 18% F2: 10% F3: 10% F4: 30% | <5.9 6–6.9 7–8.6 8.7–10.2 >10.3 |
| Demir et al. [89] | 2019 | Turkey | 124 | 31 | 124 | – | 53 ± 7 | 33.2 ± 6.6 | ≥F3: 16.9% F4: 8% | 9.6–11.49.5/9.3–10.9 M/XL probe F4 ≥ 11.5/≥11 M/XL probe |
| Fernando et al. [90] | 2019 | Philippines | 704 | 164 | 285 | 4.05 ± 3.63 | 57.27 ± 13.06 | 27.58 ± 4.25 | F0–1: 44.51% F2: 37.8% F3: 5.49% F4: 12.2% | ≥5.8 5.9–9.5 9.6–11.5 >11.5 |
| Jaafar et al. [91] | 2019 | Lebanon | 248 | 248 | 73 | – | 53.7 ± 14.6 | 29.43 ± 7.59 | ≤F1: 24.66% F2: 17.81% F3: 7% F4: 47.94% | Unavailable |
| Kumar NA et al. [92] | 2019 | India | 50 | 47 | 50 | Newly diagnosed | 45 ± 4 | 40% obese | F1: 34% F2: 10% F3: 22% F4: 22% 12% | <5.8 5.8–6.8 6.8–7.8 7.8–11.8 >11.8 |
| Lai et al. [93] | 2019 | Malaysia | 557 | 403 | 557 | 15.8 ± 11.7 | 60.4 ± 11 | 29.2 ± 5.2 | 171 57 37 | ≥8 M/XL probe ≥9.6/9.3 M/XL probe ≥11.5/11 M/XL probe |
| Lombardi et al. [94] | 2019 | Italy | 394 | 350 | 394 | 12.3 ± 7.5 | 65 ± 10 | 31.4 ± 4.7 | 83 | ≥7/6.2 M/XL probe |
| Wong VW-S et al. [95] | 2019 | France Hong Kong | 496 | 496 | 300 | – | 54 ± 12 | 30.4 ± 5.4 | F1: 112/124 F2: 83/96 F3: 84/91 F4: 59/70 | 6.8/6.1 M/XL probe 8.8/6.9 M/XL probe 11.8/8.8 M/XL probe 16.3/14.8 M/XL probe |
| Zhao et al. [96] | 2018 | China | 629 DM | – | 629 | – | 47.07 ± 12.2 | 26.58 ±4.17 | – | F1 > 7.4 F2 > 10.6 |
| Kartikayan et al. [97] | 2017 | India | 60 | 60 | 60 | 7.38 ± 4.2 | 54.12 ± 11.3 | 26.6 ± 2.42 | F1:16.7% F2:20% F3-F4: 34% | Mean: 7.95 |
| Prasetya et al. [98] | 2017 | Indonesia | 186 | 84 64 TE | 186 | <5 y: 38 ≥5 y: 46 | <40: 4 ≥40: 80 | <25: 25 ≥25: 59 | F0-F2: 51 F3-F4: 17 | <9.6 ≥9.6 |
| Kwok R et al. [99] | 2016 | China | 1918 | 334 | 2119 | 11.6 | 61.2 | 29.3 | F3: 17.1%/27.2% F4:11.2%/25 | ≥9.6–11.4/9.3–10.9 M/XL probe ≥11.5/11 M/XL probe |
| Sobhonslidsuk et al. [62] | 2015 | Thailand | 197 | 82 | 137 | – | 63.8 | 27.6 | 22% 5.93% | ≥7 ≥8.7 |
| Ahn et al. [58] | 2014 | South Korea | 979 | 13 | 165 | – | 51.9 | 25.12 ± 3.11 | F0–1: 14% F2/3: 18% F4: 31% | <8 8–19 >19 |
| Casey et al. [69] | 2012 | Australia | 74 | 26 | 74 | 12.2 ± 7.2 | 61.5 ± 8.6 | 36.1 ± 5.6 | ≥F2: 35% | ≥7.65 |
| de Lédinghen et al. [100] | 2012 | France | 277 | 20 | 277 (132 T2DM) | 13 | 63.2 ± 12.1 | 27.2 ± 4.3 | 17 | >8.7 |
| Author, Ref. | Year | Country | No. of Patients | No. of NAFLD Patients | No. of Diabetic Patients | Diabetes Duration (Years) | Mean Age (Years) | Mean BMI (kg/m2) | Fibrosis Stage | Optimal Cut-Off |
| Shaji et al. [112] | 2022 | India | 140 | 30 | 140 | 1–5 | 54.53 ± 12.42 | 27.37 ± 2.73 | 21.43% | Unavailable |
| Meyer et al. [108] | 2021 | Germany | 310 | 49 | T1DM: 93 | 29 | 53 | 25.3 | - F2–F4: 8% F3–F4: 5% | 1.34 m/s 1.55 m/s 1.8 |
| 88 | T2DM: 161 | 14 | 65 | 29.6 | - F2–F4: 27% F3–F4: 19% | 1.34 m/s 1.55 m/s 1.8 m/s | ||||
| Demirtas et al. [113] | 2020 | Turkey | 108 | 54 | 34 | – | 54.9 ± 7.7 | 28 ± 2.2 | F1 F2 F3 | 6.19 ± 1.89 kPa 7.6 ± 1.39 kPa 10.03 ± 4.71 kPa |
| Roy et al. [103] | 2020 | India | 10 | 10 | 10 (T2DM) | 7–11 | 59.3 | 25.21 ± 3.07 | N Mild Moderate Severe Unavailable | 1–1.5 m/s 1.5–1.75 m/s 1.75–2.1 m/s >2.1 m/s |
| Roy et al. [114] | 2019 | India | 36 | 32 | 36 (T2DM) | 6 | 52 | 27.75 | N: 11.1% Mild: 27.7% Moderate: 52.7% Severe: 8.3% | 1–1.5 m/s 1.5–1.75 m/s 1.75–2.1 m/s >2.1 m/s |
| Author, Ref | Year | Country | No. of Patients | No. of NAFLD Patients | No. of Diabetic Patients | Diabetes Duration (Years) | Mean Age (Years) | Mean BMI (kg/m2) | Fibrosis Stage | Optimal Cut-Off (kPa) |
|---|---|---|---|---|---|---|---|---|---|---|
| Miyoshi et al. [116] | 2021 | Japan | 318 | - | 41 | – | 63.4 | 22.7 | Unavailable | 5.79 ± 1.11 |
| Shaheen et al. [120] | 2020 | United Kingdom | 1958 | 67 (SWE ≥ 8 kPa) | 38 | – | 61 | 37.2 | 91.5% 3.4% 5.1% | <8 ≥8 inconclusive |
| Author, Ref | Year | Country | No. of Patients | No. of NAFLD Patients | No. of Diabetic Patients | Diabetes Duration (Years) | Mean Age (Years) | Mean BMI (kg/m2) | Steatosis Stage | Optimal Cut-Off (dB/m) |
|---|---|---|---|---|---|---|---|---|---|---|
| Trifan et al. [71] | 2022 | Romania | 424 | 424 | 424 | – | 55.22 ± 10.88 | 29.12 ± 5.64 | S1: 13.1% S2: 8.4% S3: 78.5% | ≥274 ≥290 ≥302 |
| Cardoso et al. [41] | 2021 | Brasil | 400 | 336 | 400 | 8 (3–15) | 64.4 | 30.4 | 41% 22% | >296 >330 |
| Ciardullo et al. [74] | 2021 | USA | 825 | 557 steatosis 179 fibrosis | 825 | 10.1 ± 0.67 9.8 ± 1.28 15.8 ± 4.16 9.40 ± 1.14 | 60.6 | 29.5 ± 0.4 30.3 ± 0.63 34.1 ± 2.72 35.1 ± 0.66 | S0: 26.2% S1: 7.2% S2: 8.3% S3: 58.3% | <274 274–289 290–301 ≥302 |
| Grgurevic et al. [75] | 2021 | Croatia | 454 | 353 | 454 | – | 64 | 30.09 | 29 22 302 | 249–268 269–280 >280 |
| Gupta et al. [76] | 2021 | India | 250 DM | 246 steatosis 205 fibrosis | 250 | 9.6 ± 6.4 | 51 ± 9 | 31.4 ± 8 | S1: - S2: - S3: 85.2% | 237–259 260–292 >292 |
| Lee CH et al. [83] | 2021 | China | 766 | 766 | 766 | 16.6 ± 9.2 | 59.4 ± 10.3 | 28.6 ± 4.5 | Mild: 10.2% Moderate: 27.4% Severe: 62.4% | 248–267 268–279 ≥280 |
| Lomonaco el al. [77] | 2021 | USA | 561 | 70% steatosis 21% fibrosis | 561 | – | 60 ± 11 | 33.4 ± 6.2 | S1: 9% S2: 7% S3: 54% | 274–289 290–301 ≥302 |
| Makker et al. [78] | 2021 | USA | 85 | 81 | 59 | 15 ± 9 | 62 ± 11.7 | 33.1 ± 8.4 | S0: 19% S1: 13% S2: 22% S3: 46% | <238 238 259 290 |
| Trivedi et al. [81] | 2021 | USA | 437 | 213 | 124 | – | 58.4 | 33.5 | 113 102 | ≥248 ≥280 |
| Lee HW et al. [84] | 2020 | China | 611 | Baseline 611 | 611 | – | 57.7 ± 10.9 | – | 32% 61% | <248 ≥248 |
| After 3 years 611 | 12% 52% | <10 ≥10 | ||||||||
| Mikolasevic et al. [86] | 2020 | Croatia | 679 | 568 | 679 | 7.15 ± 2.33 | 65.2 ± 11.6 | 30.75 ± 5.15 | 83.6% | ≥238 |
| Sawaf et al. [57] | 2020 | Lebanon | 620 | 131 | 128 | – | 47.8 ± 13.4 | 26.21 ± 4.3 | S1: 5.2% S2: 7% S3: 45.5% | Unavailable |
| Sporea et al. [87] | 2020 | Romania | 776 | 534 | 534 | 10 ± 2 | 60.8 ± 8.7 | 32 ± 6 | S0: 23.9% S1: 8.9% S2: 6.9% S3: 60.3% | - 274 290 302 |
| Tuong et al. [61] | 2020 | Vietnam | 307 | 225 | 307 | 3 | 56.5 ± 10.5 | 25.4 ± 2.8 | S0: 26.7% S1: 20.5% S2: 21.8% S3: 31% | - 234–269 270–300 ≥301 |
| Demir et al. [89] | 2019 | Turkey | 124 | 117 | 124 | – | 53 ± 7 | 33.2 ± 6.6 | Mild: 0 Moderate: 29 Severe: 88 | 222–232 233–289 ≥290 |
| Fernando et al. [90] | 2019 | Philippines | 704 | 164 | 285 | 4.05 ± 3.63 | 57.27 ± 13.06 | 27.58 ± 4.25 | S0: 3.66% S1: 12.8% S2: 39.02% S3: 44.51% | <221 222–232 233–289 ≥290 |
| Jaafar et al. [91] | 2019 | Lebanon | 248 | 248 | 73 | – | 53.7 ± 14.6 | 29.43 ± 7.59 | ≤S1 32.3% S2 18.46% S3 27.7% S4 21.54% | Unavailable |
| Lombardi et al. [94] | 2019 | Italy | 394 | 238 | 394 | 14 ± 8 | 67 ± 10 | 29.6 ± 4.2 | 171 128 | ≥248 ≥280 |
| Kwok et al. [99] | 2016 | China | 1918 | 1309 | 2119 | 10.7 | 60.6 | 26.2 | S1: 5.1% S2: 29.6% S3: 38% | 222–232 233–289 ≥290 |
| Ahn et al. [58] | 2014 | South Korea | 979 | 13 | 165 | - | 51.9 | 25.12 ± 3.11 | S1: 15% S2: 17% S3: 26% | 239–258 259–292 >292 |
Publisher’s Note: MDPI stays neutral with regard to jurisdictional claims in published maps and institutional affiliations. |
© 2022 by the authors. Licensee MDPI, Basel, Switzerland. This article is an open access article distributed under the terms and conditions of the Creative Commons Attribution (CC BY) license (https://creativecommons.org/licenses/by/4.0/).
Share and Cite
Cazac, G.-D.; Lăcătușu, C.-M.; Mihai, C.; Grigorescu, E.-D.; Onofriescu, A.; Mihai, B.-M. Ultrasound-Based Hepatic Elastography in Non-Alcoholic Fatty Liver Disease: Focus on Patients with Type 2 Diabetes. Biomedicines 2022, 10, 2375. https://doi.org/10.3390/biomedicines10102375
Cazac G-D, Lăcătușu C-M, Mihai C, Grigorescu E-D, Onofriescu A, Mihai B-M. Ultrasound-Based Hepatic Elastography in Non-Alcoholic Fatty Liver Disease: Focus on Patients with Type 2 Diabetes. Biomedicines. 2022; 10(10):2375. https://doi.org/10.3390/biomedicines10102375
Chicago/Turabian StyleCazac, Georgiana-Diana, Cristina-Mihaela Lăcătușu, Cătălina Mihai, Elena-Daniela Grigorescu, Alina Onofriescu, and Bogdan-Mircea Mihai. 2022. "Ultrasound-Based Hepatic Elastography in Non-Alcoholic Fatty Liver Disease: Focus on Patients with Type 2 Diabetes" Biomedicines 10, no. 10: 2375. https://doi.org/10.3390/biomedicines10102375