Article

Gold Nanocluster-Based Fluorescent Sensor Array for Antibiotic Sensing and Identification

1
State Key Laboratory of Natural Medicine, School of Basic Medical Sciences and Clinical Pharmacy, China Pharmaceutical University, Nanjing 211198, China
2
School of Intelligent Manufacturing and Electronic Engineering, Wenzhou University of Technology, Wenzhou 325025, China
*
Author to whom correspondence should be addressed.
Chemosensors 2023, 11(6), 330; https://doi.org/10.3390/chemosensors11060330
Submission received: 26 April 2023 / Revised: 23 May 2023 / Accepted: 30 May 2023 / Published: 3 June 2023

Abstract

:
Antibiotic contamination has become a serious global problem due to abuse and misuse. Therefore, it is important to develop an efficient detection method to monitor the rational use of antibiotics. In this study, fluorescent gold nanoclusters with 11-mercaptoundecanoic acid as ligands (MUA-AuNCs) were synthesized by a one-step method firstly. Rare earth ions (Re3+) can enhance the fluorescence of MUA-AuNCs through inducing the aggregation of MUA-AuNCs, but antibiotics decrease the fluorescence of the Re3+-MUA-AuNCs to different degrees through coordination with Re3+ and competitive absorption with AuNCs. Therefore, a sensor array was obtained on the basis of the above mechanism, which can detect and discriminate six different antibiotics with a detection range from 40 to 300 μM. A 100% correct classification was achieved. The fluorescent sensor array showed high selectivity for tetracycline antibiotics and good anti-interference performance was demonstrated. Combined with pattern recognition methods, the proposed sensor array can be used for the discrimination of different antibiotics and binary antibiotic mixtures. Furthermore, the excellent performance of this sensor array in quantitation and blind sample recognition further validates its potential for practical applications.

1. Introduction

Hundreds of antibiotics have been developed to treat human diseases and animal infections since the discovery of antibiotics in the 20th century. For instance, tetracyclines (TCs) are a class of broad-spectrum antibiotics, including tetracycline (TET), oxytetracycline (OTC), chlorotetracycline (CTC), and doxycycline (DOCX). They are mainly used as veterinary drugs in animal breeding for the treatment of infectious diseases or as feed additives in subtherapeutic doses to prevent disease and promote growth [1,2]. Chloramphenicol (CAP) has been widely added to water and feedstuff for sterilization, but it has been banned from edible animals due to its severe adverse reactions, especially the harm to the human hematopoietic system [3]. Vancomycin hydrochloride (VA) is a glycopeptide macromolecular antibiotic with a strong antibacterial effect on Gram-positive bacteria. However, it has potential nephrotoxicity and ototoxicity [4]. Generally speaking, the application of antibiotics in agriculture, animal husbandry and medicine has greatly promoted the development of human society. However, due to the abuse and misuse of antibiotics in recent years, excessive amounts of antibiotics have been detected many times in surface water, groundwater, sewage treatment plants and soil in China and even around the world [5,6,7]. At the same time, the overuse of antibiotics leads to the rapid emergence of drug-resistant bacteria and resistance genes [8,9], thus reducing the therapeutic effect of antibiotics on human and animal pathogens [10]. In short, antibiotic residues in the environment pose a major threat to both ecosystems and human health [11]. Therefore, the development of sensitive, rapid and efficient detection methods of antibiotics is crucial to prevent their overuse.
To date, various methods for the antibiotic detection have been established, such as enzyme-linked immunoassay [12], high-performance liquid chromatography [13], capillary electrophoresis [14], colorimetry [15], high-performance liquid chromatography–mass spectrometry [16], and the fluorescence method [17,18,19]. Among these methods is the fluorescent technique, with the advantages of simplicity, rapidity, high sensitivity and low cost, and is one of the most promising methods for the antibiotic detection. The fluorescent sensor array not only has the above advantages, but can also be applied to multi-target recognition. For instance, a lanthanide-based fluorescent sensor array, named “chemical tongue”, was reported to detect eleven heavy metal ions, in which the fluorescence of the probes was quenched to different degrees by different metal ions [20]. Huang and co-workers [21] have built a pH-regulated paper-based sensor array for quantitative identification of antibiotics. Sun et al. [22] reported a carbon dots-based fluorescent sensor array for phosphate detection and discrimination. In summary, fluorescent sensor arrays have broad application prospects in identifying and discriminating multiple analytes. In the past two decades, due to strong photoluminescence, a large Stokes shift, low toxicity, good photostability and biocompatibility [23,24,25], metal nanoclusters [26], such as gold nanoclusters (AuNCs), have become one of the most ideal luminescent materials in the field of sensing and imaging [27,28,29]. Many AuNCs-based sensor arrays have been developed to identify different proteins and bacteria [30], three nitrophenol isomers [31], various amino acids [32], seven heavy metal ions [33], etc.
In this study, a simple and efficient fluorescent sensor array using the three MUA-AuNCs-rare earth ions (MUA-AuNCs-Re3+) as sensing elements was successfully developed and employed to discriminate six different antibiotics. Specifically, highly fluorescent AuNCs with 11-mercaptoundecanoic acid as the ligands (MUA-AuNCs) were synthesized according to the reported method [34]. The fluorescence of MUA-AuNCs can be enhanced by Re3+. As shown in Scheme 1, in the presence of antibiotics, the fluorescence intensities changed according to the competitive absorption and coordination between antibiotics and MUA-AuNCs-Re3+. Thus, different fluorescence response patterns of the sensor array to various antibiotics was obtained. Combined with statistical analysis techniques, the proposed sensor array can be used to distinguish the multiple antibiotics.

2. Experiment

2.1. Reagents and Materials

Gold chloride trihydrate (HAuCl4·3H2O), 11-mercaptoundecanoic acid (MUA), oxytetracycline hydrochloride (OTC), Tris, cerous chloride (CeCl3), HEPES, chlorotetracycline hydrochloride (CTC), ascorbic acid (AA), tetracycline hydrochloride (TET), Glutathione (GSH), Cysteine (Cys), and chloramphenicol (CAP) were purchased from Aladdin (Shanghai, China). Gd(CH3CO2)3·xH2O and (CH3CO2)3Tm·xH2O were purchased from Sigma-Aldrich (USA). Vancomycin hydrochloride (VA), glutamic acid (Glu), and glycine (Gly) were purchased from Bide (Shanghai, China). Doxycycline hyclate (DOCX) was purchased from Macklin (Shanghai, China). Other routine reagents such as EtOH, FeSO4·7H2O, CaCl2·2H2O, MgCl2, Na2CO3, NH4F, and NaOH were of analytical reagent grade and were used without further purification. Ultrapure Millipore water (18.2 MΩ·cm) was used in all experiments. Tap water was collected from our laboratory. The 96-well opaque cell culture plates were purchased from Beyotime (Shanghai, China). All glassware were cleaned with fresh aqua regia before use.

2.2. Instrumentation

Transmission electron microscopy (TEM) was performed on a JEM-1400PLUS transmission electron microscope (Japan). Zeta potential and dynamic light scattering (DLS) were measured using a LitesizerTM 500 nanometer laser particle size analyzer (Anton, Austria). The absorption and fluorescence emission spectra were recorded by a SpectraMax M5 multi-function microplate reader. The pH values were adjusted with a pH meter (PB-10, Sartorius).

2.3. Synthesis of MUA-AuNCs

MUA-AuNCs were synthesized in aqueous solution following a previous report [34]. The specific synthesis procedure was as follows: 6.6 mg of MUA was dissolved in 10 mL of ultrapure water containing 0.5 mL of NaOH (1 M) with constant stirring. Then, 0.5 mL of HAuCl4 (1% by mass) was added, and the resultant mixture was stirred continuously for 5 h at room temperature. Finally, the solution was purified by adding 5 mL of EtOH into the aqueous solution (H2O:EtOH volume ratio = 2:1) and centrifuged at 10,000 rpm for 10 min to remove excess reactants containing the free MUA and gold ions. The precipitates were then resuspended readily in water. The as-obtained purified MUA-AuNCs solution was stored at 4 °C for further use.

2.4. Preparation of MUA-AuNCs-Re3+ Fluorescent Sensor Array

MUA-AuNCs stock solution was diluted 100 fold and stored in a centrifuge tube for later use. Then, the prepared Gd3+, Ce3+ and Tm3+ solutions were added to the three centrifuge tubes containing the MUA-AuNCs solution, respectively, to make the final concentration of rare earth ions to be 40 μM, and the three different sensors MUA-AuNCs-Re3+ (MUA-AuNCs-Gd3+, MUA-AuNCs-Ce3+ and MUA-AuNCs-Tm3+), which can be used for subsequent detection of different antibiotics, were formed by shaking and mixing well.

2.5. Experimental Procedure of MUA-AuNCs-Re3+ Fluorescent Sensor Array for the Discrimination and Quantification of Antibiotics

2.5.1. Use Sensor Array to Distinguish Different Antibiotics

In a transparent 96-well plate, 95 μL each of three different probes MUA-AuNCs-Gd3+, MUA-AuNCs-Ce3+ and MUA-AuNCs-Tm3+ were mixed with 5 μL of different antibiotics (OTC, TET, CTC, DOCX, VA and CAP) and incubated at room temperature for 1 min. The fluorescence responses of the sensor array were collected using a microplate reader at an excitation wavelength of 265 nm, and the fluorescence intensity values at the maximum emission wavelength of 610 nm in the fluorescence emission spectrum were recorded. The six antibiotics were reacted with 3 probes, respectively, and each sample was repeated 3 times to obtain a fluorescence response matrix of 3 probes × 6 antibiotics × 3 repeated samples. Finally, principal component analysis (PCA) and hierarchical clustering analysis (HCA) were applied to the experimentally obtained data matrix for further data processing and analysis.

2.5.2. Response of the Sensor Array to Different Interfering Substances

In the interference experiments, the concentrations of each antibiotic and interfering substance were set at 200 and 100 μM, respectively. The detection process of the sensor array for different interfering substances is the same as above (1). Specifically, 95 μL each of three different probes MUA-AuNCs-Gd3+, MUA-AuNCs-Ce3+ and MUA-AuNCs-Tm3+ were mixed with 5 μL of different interfering substances (Fe2+, Ca2+, Mg2+, NH4+, Na+, K+, Cl, F, CO32−, SO42−, GSH, AA, Cys, Glu, and Gly) and incubated at room temperature for 1 min. The fluorescence of each well was then measured using a microplate reader at an excitation wavelength of 265 nm, and the fluorescence emission spectra were recorded.

2.5.3. Quantitative Detection of Different Antibiotics by the Sensor Array

In a transparent 96-well plate, 95 μL each of the three different probes MUA-AuNCs-Gd3+, MUA-AuNCs-Ce3+ and MUA-AuNCs-Tm3+ were mixed with 5 μL of antibiotics at different concentrations (the final concentrations of antibiotics in a total volume of 100 μL were 0, 10, 20, 40, 80, 100, 150, 200, 250, 300 μM), and incubated for 1 min at room temperature. The fluorescence responses of the sensor array were collected using a microplate reader at an excitation wavelength of 265 nm, and the fluorescence intensities at the maximum emission wavelength of 610 nm were recorded simultaneously. Nine concentration gradients of each antibiotic were reacted with 3 probes, respectively, and each sample was repeated 3 times to obtain a fluorescence response matrix of 3 probes × 9 concentrations × 3 repeated samples. Finally, PCA was applied to the experimentally obtained data matrix for further data processing and analysis.

2.5.4. Discrimination of Antibiotic Binary Mixtures by the Sensor Array

To further explore the ability of the sensor array to recognize binary mixtures of antibiotics. Mixtures of OTC and CTC with different concentration ratios were prepared as standard samples (the total concentration of the mixture tested was 100 μM, and the OTC:CTC ratios were 10:0, 7.5:2.5, 5:5, 2.5:7.5, and 0:10, respectively). The specific detection steps were the same as (1) and (2) above.

2.5.5. Blind Sample Detection

Before the developed sensor array was able to be used to detect blind samples of unknown concentration, a concentration-dependent PCA plot needed to be obtained by processing and analyzing the experimental data. In the experiment, six concentration gradients of three antibiotics (OTC, VA and CAP) were selected to react with three probes, respectively. Specifically, in a transparent 96-well plate, 95 μL each of three different probes MUA-AuNCs-Gd3+, MUA-AuNCs-Ce3+ and MUA-AuNCs-Tm3+ were mixed with 5 μL of different concentrations of antibiotics (the final concentrations of antibiotics in a total volume of 100 μL were 80, 100, 150, 200, 250, and 300 μM, respectively) and incubated at room temperature for 1 min. The fluorescence emission spectra were recorded using a microplate reader at an excitation wavelength of 265 nm, resulting in the fluorescence response matrix for 3 probes × 6 concentrations × 3 antibiotics. Finally, PCA was applied to the experimentally obtained data matrix for further data processing and analysis, and a concentration-dependent PCA plot was gained.
Tap water samples with different antibiotic species and random concentrations were prepared. Specifically, OTC, VA, and CAP at concentrations of 120 and 240 μM, respectively, were labeled as samples 1–6. After measuring the responses of the sensor array to these sample solutions, the data were combined with the concentration-dependent PCA plot obtained above to perform qualitative and quantitative analysis of the blind samples.

2.6. Data Processing and Analysis

The fluorescence spectra data recorded by the microplate reader were normalized and analyzed in MetaboAnalyst 5.0 to obtain 2D and 3D PCA plots, HCA plot and heat map. The rest of the fluorescence spectra were drawn by using Origin 9.0.

3. Results and Discussion

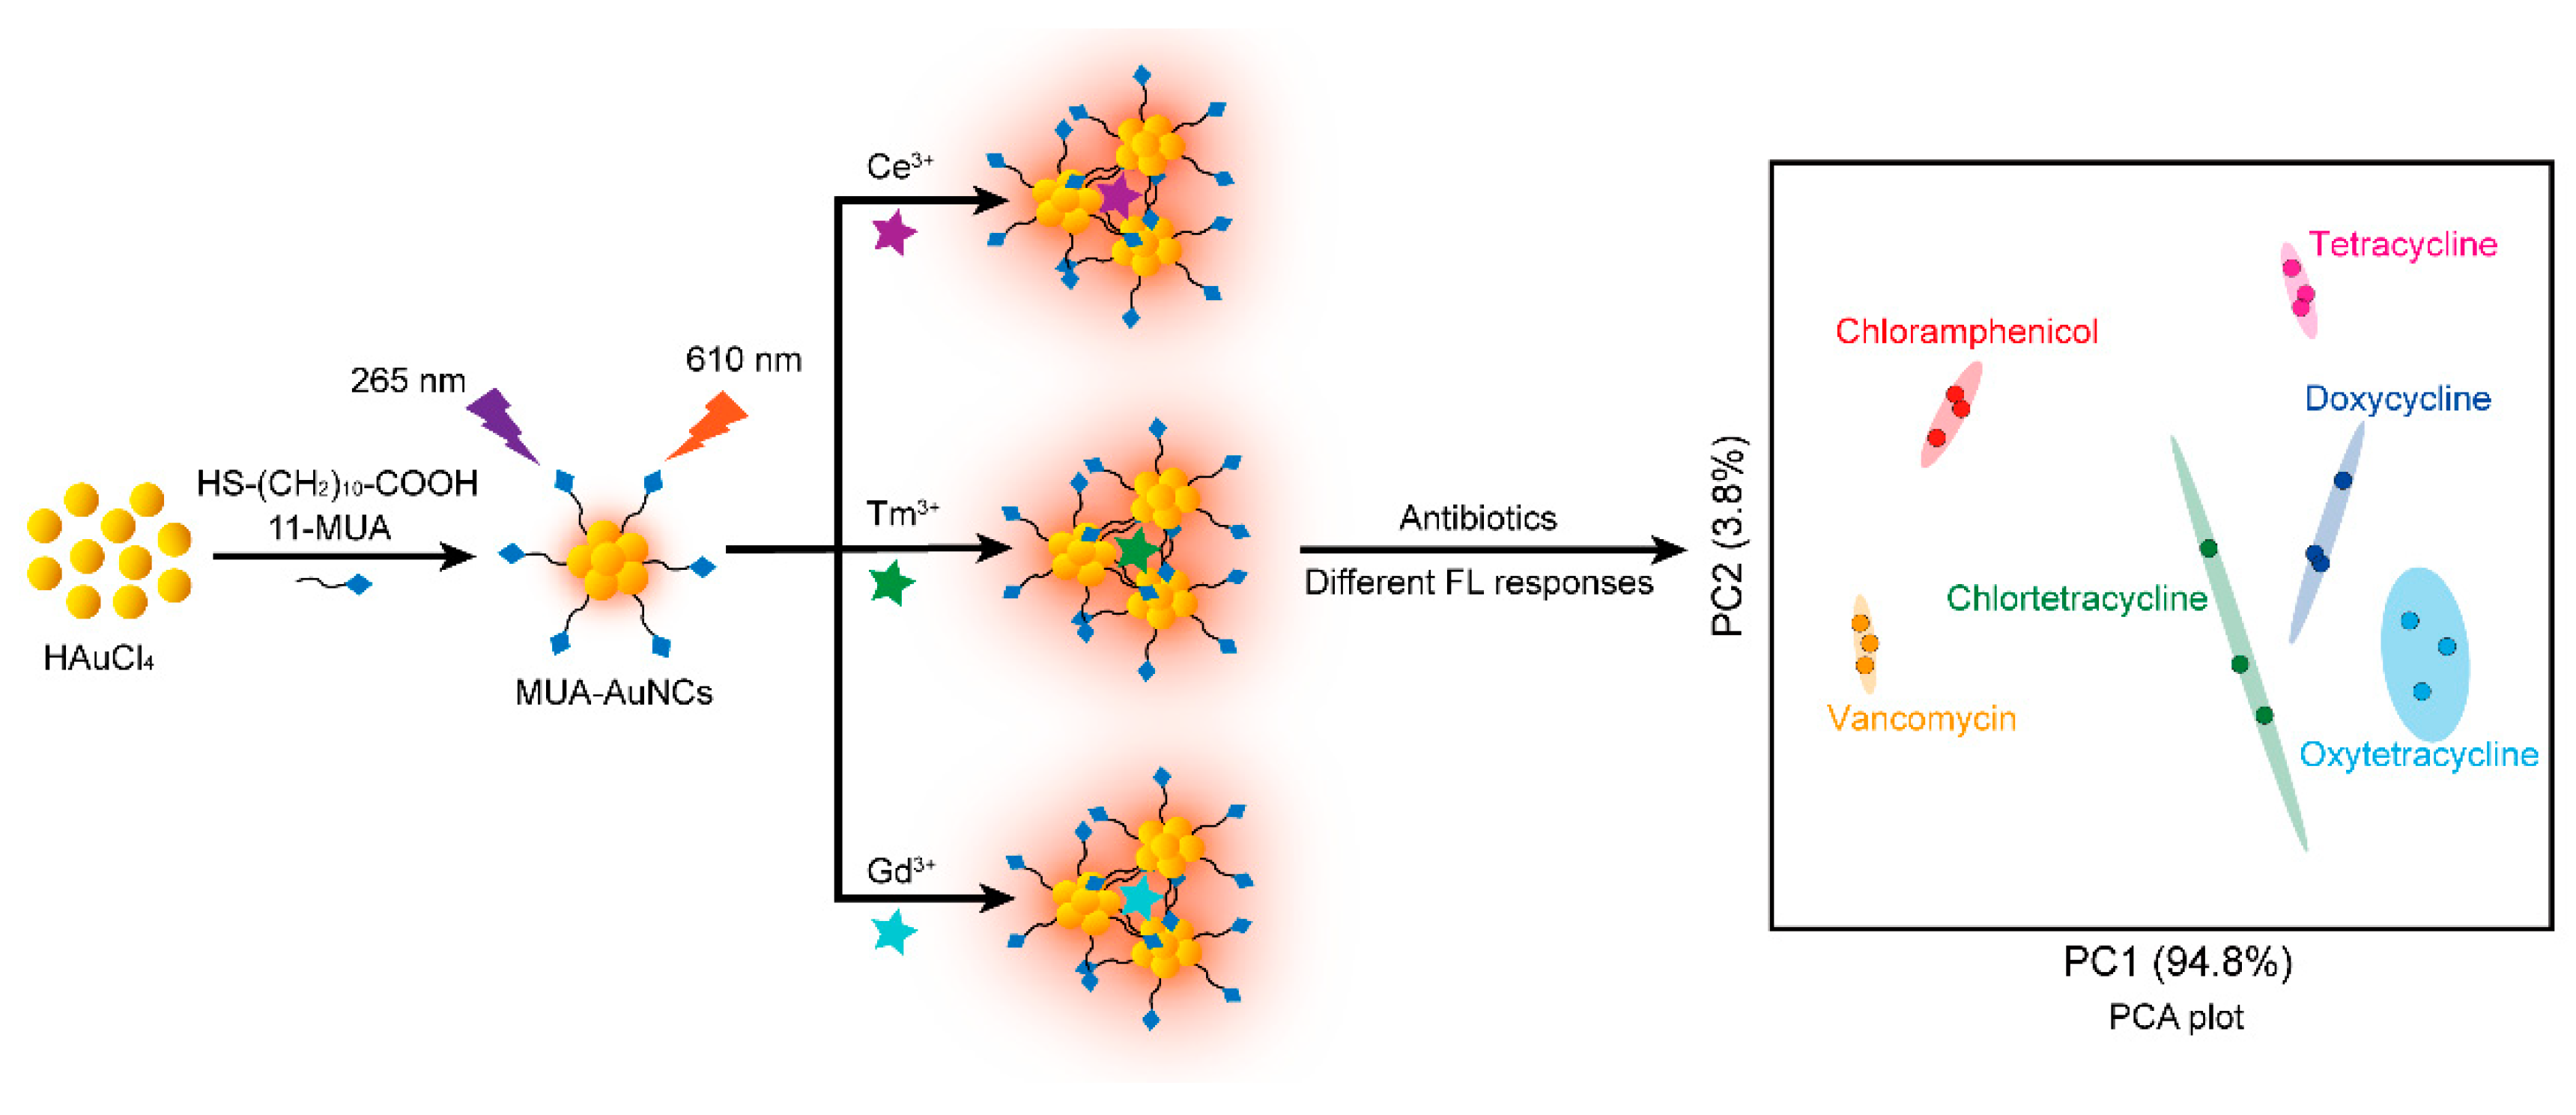
3.1. Design and Construction of MUA-AuNCs-Re3+ Fluorescent Sensor Arrays for the Detection of Antibiotics

In this study, fluorescent MUA-AuNCs were synthesized according the reported literature using 11-MUA as a reducing and protective agent through a one-pot method. The TEM image (Figure 1a) of MUA-AuNCs revealed that the nanoclusters were well-dispersed particles with an average size of 1.9 ± 0.4 nm. UV–Vis absorption and the fluorescence spectra (Figure 1b) of MUA-AuNCs show that there is an absorption peak at 250 nm and the maximum emission peak of MUA-AuNCs is locate at 610 nm (λex = 265 nm), with a large Stokes shift (approximately 350 nm). The as-prepared MUA-AuNCs were pale yellow under visible light while strong orange-red fluorescence was observable under the UV light with a wavelength of 254 nm by the naked eyes (the inset of Figure 1b). Meanwhile, the emission spectra of MUA-AuNCs under different excitation wavelengths were studied (Figure S1). The results showed that the fluorescence intensity reached the maximum when the excitation wavelength was 265 nm. Here, 265 nm was chosen as the excitation wavelength for all subsequent experiments.
It has been reported that thiolate-protected AuNCs exhibit remarkable aggregation-induced emission (AIE) properties [35,36], which can easily coordinate with rare earth ions to aggregate AuNCs and enhance their fluorescence. In this work, three different sensing elements, MUA-AuNCs-Gd3+, MUA-AuNCs-Ce3+ and MUA-AuNCs-Tm3+ were prepared by simple mixing AuNCs with Re3+. Additionally, as expected, these MUA-AuNCs-Re3+ sensors exhibited enhanced fluorescence emission compared to MUA-AUNCs (Figure 1c). Specifically, the fluorescence intensities of MUA-AuNCs increased by approximately 3.0, 2.1 and 1.7 fold, respectively, after 40 μM Gd3+, Ce3+ and Tm3+ were added. It was speculated that the -COOH groups on the surface of MUA-AuNCs coordinate with these rare earth ions and MUA-AuNCs aggregated, thus enhancing the fluorescence of AuNCs through the AIE effect.
Studies have shown [37] that the fluorescence of AgNCs could be quenched by tetracycline due to inner filter effect (IFE). Inspired by this, we hypothesized that the fluorescence of the developed MUA-AuNCs-Re3+ sensor array could also be quenched by TCs or even other antibiotics based on IFE. To verify our assumption, six antibiotics with UV absorption approximately 300 nm (including OTC, TET, CTC, DOCX, VA, and CAP) were selected for further research. Specifically, six antibiotics were added to three MUA-AuNCs-Re3+, and the corresponding fluorescence spectra were recorded. The results indicated that the six antibiotics (all at a concentration of 200 μM) had diverse degrees of quenching ability to the three MUA-AuNCs-Re3+ probes (Figure 1d–f), among which four TCs had stronger fluorescence quenching ability to the sensors than that of VA and CAP. The above results demonstrated the possibility of MUA-AuNCs-Re3+ as a multi-channel sensor array for antibiotic sensing. Then, the fluorescence responses of MUA-AuNCs-Re3+ to these six different antibiotics (0–300 μM) were studied in detail. The results showed the fluorescence quenching ability of the antibiotics on the three probes varied, among which TCs had the strongest fluorescence quenching ability (Figures S2–S7). Therefore, the fluorescent responses of the three probes to each antibiotic were analyzed by using pattern recognition methods (such as PCA and HCA) to generate unique recognition patterns that can ultimately distinguish multiple antibiotics.

3.2. Optimization of the Experimental Conditions

For the purpose of the identification of antibiotics under the suitable conditions, several factors affecting the fluorescence intensity of the MUA-AuNCs-Re3+ sensor array were optimized, such as the concentration of rare earth ions, buffer solution and reaction time. As illustrated in Figure S8, it can be distinctly observed that the fluorescence intensity of MUA-AuNCs was enhanced with the concentration of rare earth ions increased, and the trend of the fluorescence enhancement slowed down after 40 μM. In the following experiment, a concentration of 40 μM was selected to prepare the MUA-AuNCs-Re3+ sensor array. Further, taking OTC as an example, the responses of MUA-AuNCs-Gd3+ to OTC in different buffer solutions were studied. It can be seen that after the addition of the same concentration of Gd3+ and OTC, the fluorescence response of MUA-AuNCs in HEPES buffer solution (pH = 7.4) was the most sensitive (Figure S9). It was noted that rare earth ions will preferentially bind to PO43− in PBS since the binding force between rare earth ions and PO43− in PBS is greater than that between rare earth ions and -COOH groups on the surface ligands of MUA-AuNCs. In consequence, MUA-AUNcs-Gd3+ cannot be formed in PBS, which was not proper for the detection system. Next, we measured the stability of MUA-AuNCs and three different sensing elements MUA-AuNCs-Re3+ in pure aqueous solution. The results revealed that the fluorescence intensities of MUA-AuNCs and MUA-AuNCs-Re3+ remained basically unchanged within one week (Figure S10), proving that they all had good stability and were appropriate to construct the sensor array. Finally, we investigated the reaction time of the MUA-AuNCs-Re3+ sensor array in response to OTC. The results showed that the quenching process was quickly completed within 30 s (Figure S11), and kept stable at least for 1 h. In short, the good stability and fast response ability of the MUA-AuNCs-Re3+ sensor array were benefit to its detection and discrimination of various antibiotics in the water environment.

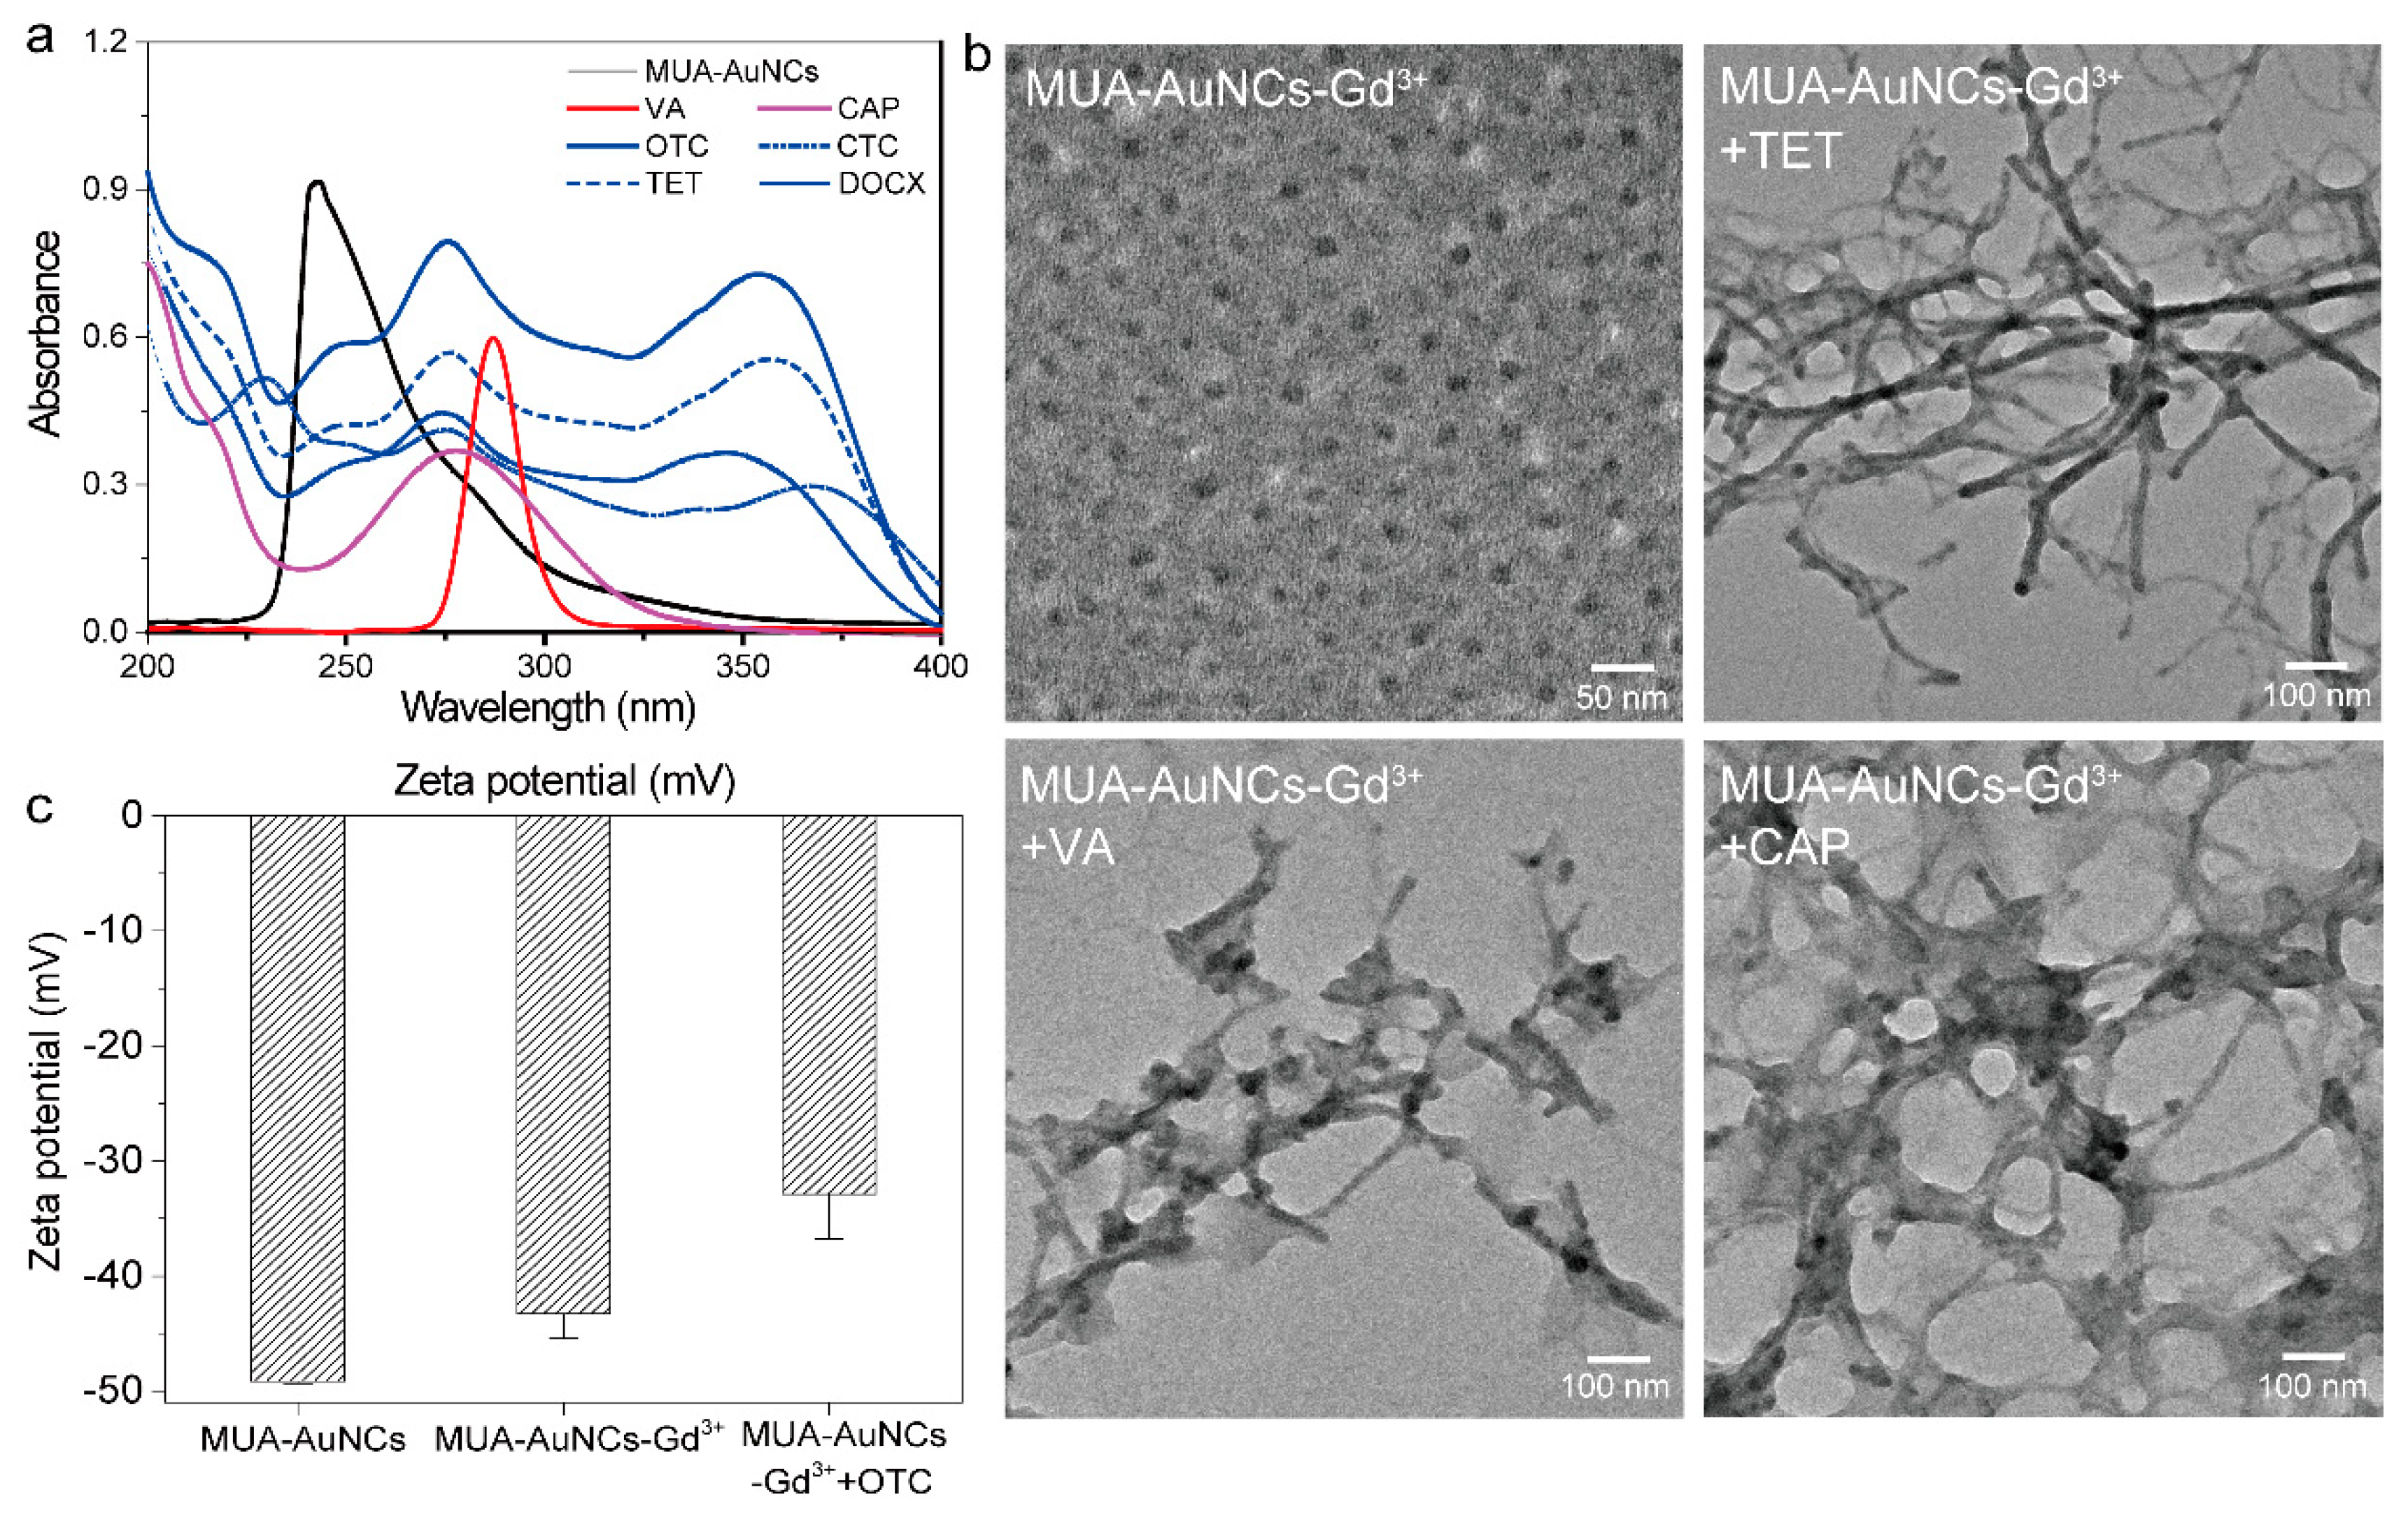
3.3. The Possible Mechanism of Sensor Array

To study the possible response mechanism of the sensor array, the UV–Vis absorption spectra of MUA-AuNCs and six antibiotics (OTC, TET, CTC, DOCX, VA, and CAP) were measured. The selected six antibiotics had various absorbance in the range of 200–400 nm (Figure 2a), thus we speculated that the competitive absorption of these antibiotics to the excitation light can effectively quench the emission of MUA-AuNCs, which meant that IFE was a possible detection mechanism of the sensor array. Specifically, the UV–Vis absorption of MUA-AuNCs was approximately 250 nm, the UV–Vis absorption of TCs was in the range of 200–400 nm, while VA and CAP have maximum UV absorption approximately 290 nm and 280 nm, respectively. Since the UV absorption curves of MUA-AuNCs and the antibiotics showed various degrees of overlap, it indicated that IFE was indeed the main reason for the weakening of the fluorescence of MUA-AuNCs-Re3+, which verified our previous conjecture. Moreover, we found that the UV–Vis absorption spectra of these antibiotics did not overlap with the previously measured fluorescence emission spectrum of MUA-AuNCs approximately 610 nm, so fluorescence resonance energy transfer (FRET) was not the sensing mechanism of this sensor array. Among them, the absorption bands of the four kinds of TCs and MUA-AuNCs overlap greatly, corresponding to the strongest fluorescence quenching efficiency of TCs.
Since the chemical structures of the selected 6 antibiotics (Figure S12) contain the structures (carboxyl, amide or β-diketone structures, etc.) that are easy to coordinate with rare earth ions, rare earth ions and these antibiotics may act as “bridges” to connect more MUA-AuNCs together. The aggregation degree of the nanoclusters varies because of the strength of coordination with rare earth ions and steric hindrance. The morphological changes in the nanoclusters before and after the addition of TET, VA and CAP were characterized by TEM (Figure 2b). After the addition of different antibiotics, the MUA-AuNCs-Gd3+ that were originally uniformly dispersed aggregated into larger clusters or formed different bridged network structures. It is considered that this may be another reason for the quench of the fluorescence of MUA-AuNCs-Re3+ by the antibiotics. Finally, the zeta potential of the detection system was measured, and the results showed that (Figure 2c and Figure S13) the MUA-AuNCs were negatively charged with approximately −49.1 mV due to the abundant -COOH groups on the surface ligands. With the addition of rare earth ions such as Gd3+, the zeta potential increased to −43.3 mV. The change in the surface charge of MUA-AuNCs-Gd3+ may be attributed to the reduction of exposed -COOH groups which coordinated with Gd3+. The zeta potential of MUA-AuNCs-Gd3+-OTC further increased to −32.9 mV, and this may be due to the different degrees of aggregation between nanoclusters, rare earth ions and antibiotics.
To sum up, the recognition mechanism includes two effects. First, the overlap between the absorbance bands of the six antibiotics and the MUA-AuNCs leads to the IFE, which partially quenched the fluorescence of the MUA-AuNCs (Figure 2a). Second, the antibiotics all contain carboxyl, amide or β-diketone groups that can easily coordinate with rare earth ions in the MUA-AuNCs-Gd3+ to trigger the aggregation of the nanoclusters and the formation of the bridged network structures (Figure 2b,c). As a result, the fluorescence was quenched. Due to the different quenching degree caused by the pairs of the antibiotics/rare earth ions, the discrimination of the antibiotics can be achieved by the sensor array.

3.4. Discrimination of Antibiotics by Sensor Array

To evaluate the ability of the MUA-AuNCs-Re3+ sensor array to recognize different antibiotics, the fluorescence responses of each sensor to the same concentration of six antibiotics (OTC, TET, CTC, DOCX, VA, and CAP, 200 μM) were recorded firstly. The normalized fluorescence intensity value of MUA-AuNCs-Re3+ at 610 nm was calculated for statistically analyzed. As displayed in Figure 3a, each antibiotic responded diversely to the three sensors, representing the three-channel fluorescence pattern recognition of the sensor array induced by various antibiotics. Statistical analysis was performed by PCA to convert the raw data matrix of fluorescence responses (3 probes × 6 antibiotics × 3 replicates) into 3D PCA plot (Figure 3b), in which the six antibiotics (including the 4 TCs, VA and CAP) were completely separated from each other without overlapping. Additionally, the differences in the responses of the six antibiotics to different MUA-AuNCs-Re3+ at the same concentration can also be clearly seen from the heat map (Figure 3c). Red represented high fluorescence intensity while blue corresponded to low fluorescence intensity, and the unique color distribution pattern of each antibiotic indicated the feasibility of the sensor array for the identification of the antibiotics. Discrimination of the antibiotics was also able to be implemented by HCA, which is a statistical classification method based on the Euclidean distance. Replicate samples corresponding to each antibiotic were correctly clustered and assigned to their respective groups with no cross effects in Figure 3d. Interestingly, the fluorescence responses of the four TCs to the sensor array were clustered into one broad category on account of their similar chemical structures and UV absorption spectra. Briefly, we demonstrated that the constructed sensor array combined with statistical methods was capable of achieving the discrimination of the multiple antibiotics.
We further investigated the ability of the MUA-AuNCs-Re3+ sensor array to discriminate against multiple antibiotics at other concentrations (ranging from 80 to –300 μM). As shown in Figure S14, the original data matrix (3 probes × 6 antibiotics × 3 replicate samples) of the fluorescence responses of the antibiotics at the concentrations of 40, 80, 150 and 300 μM was statistically analyzed by PCA, respectively. The two most important principal components (PC1 and PC2) were utilized to generate 2D PCA plots and it was found that all studied antibiotics still obtained good classification. Specifically, in the 2D plane, the six antibiotics were distinguished into six independent clusters without any overlap or misclassification, suggesting that the synthesized sensor array can accurately distinguish the six antibiotics in the concentration range of 40–300 μM. These experimental results above demonstrated that the sensor array based on MUA-AuNCs-Re3+ had excellent antibiotics recognition capability.

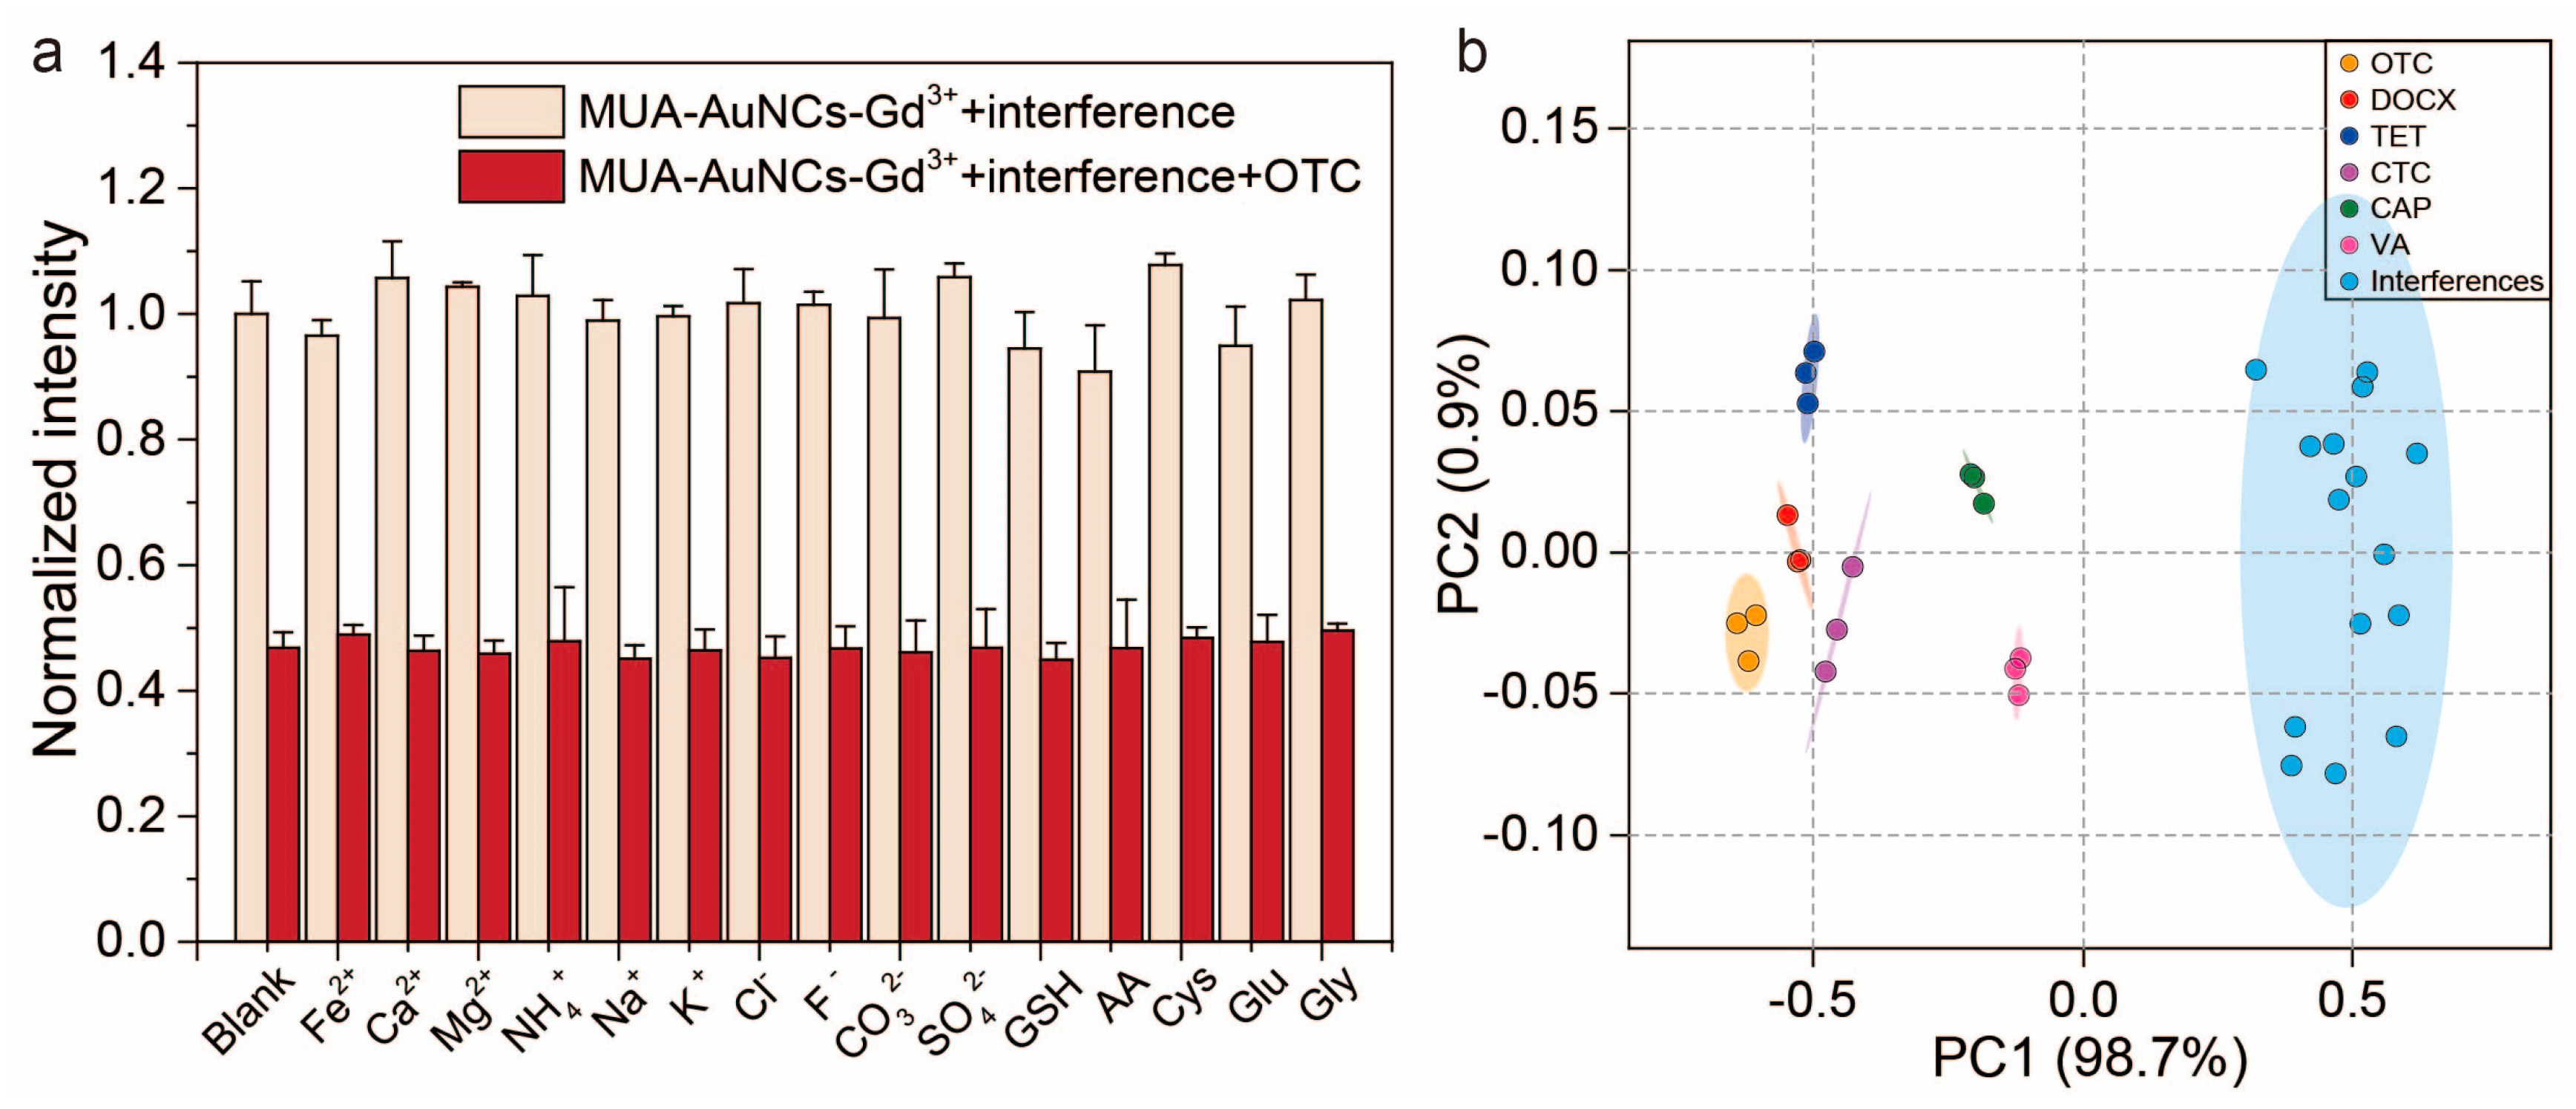
3.5. Response of Sensor Array to Interfering Substances

In order to investigate the selectivity and anti-interference capability of the developed sensor array, as summarized in Figure 4a, the fluorescence responses of the MUA-AuNCs-Re3+ sensor array to the possible interfering substances (Fe2+, Ca2+, Mg2+, NH4+, Na+, K+, Cl, F, CO32−, SO42−, GSH, AA, Cys, Glu, and Gly) were firstly recorded. Then, according to the different response modes of the sensor array to the antibiotics and interfering substances, a 2D PCA plot was obtained by PCA analysis and processing (Figure 4b). From the figure, we can see that even in the presence of the relatively high concentration (100 μM) of the interfering substance, the sensor array had no obvious response to the interfering substances and the interferences did not affect the response of the array to the antibiotics. In addition, the six antibiotics in the 2D PCA plot can still be clearly distinguished without any overlapping or being affected by interfering substances. The above results confirmed that this MUA-AuNCs-Re3+ sensor array had a satisfactory ability to identify multiple antibiotics with high accuracy and selectivity.

3.6. Quantitative Detection of Different Antibiotics by Sensor Array

More importantly, the ability of the MUA-AuNCs-Re3+ sensor array to discriminate individual antibiotics with different concentrations was investigated to validate their quantitative functions. The fluorescence responses of each sensing elements to various antibiotics at different concentrations (0, 10, 20, 40, 80, 100, 150, 200, 250 and 300 μM) were first measured and recorded, and then the raw data matrix of the fluorescence responses (3 probes × 9 concentrations × 3 replicate samples) was processed and analyzed by PCA. Eventually, 2D PCA plots in Figures S15–S20 showed that the antibiotics at different concentrations (ranging from 10 to 300 μM) were clearly differentiated without overlapping, confirming the discrimination ability of the MUA-AuNCs-Re3+ sensor array to the different concentrations of each antibiotic. It is worth noting that the elliptical confidence regions for each concentration are not randomly distributed but regularly arranged from left to right according to the concentrations. Moreover, both PC1 exceeded 95% while PC2 did not exceed 40%, so PC1 alone can be used to quantify individual antibiotics at different concentrations [38]. Specifically, the value of PC1 increased with the concentration (10–300 μM) of each antibiotic and good linear relationships in the concentration range of 100–300 μM were gained. The above results proved that the quantitative detection of the individual antibiotics can be achieved by using the MUA-AuNCs-Re3+ sensor array.

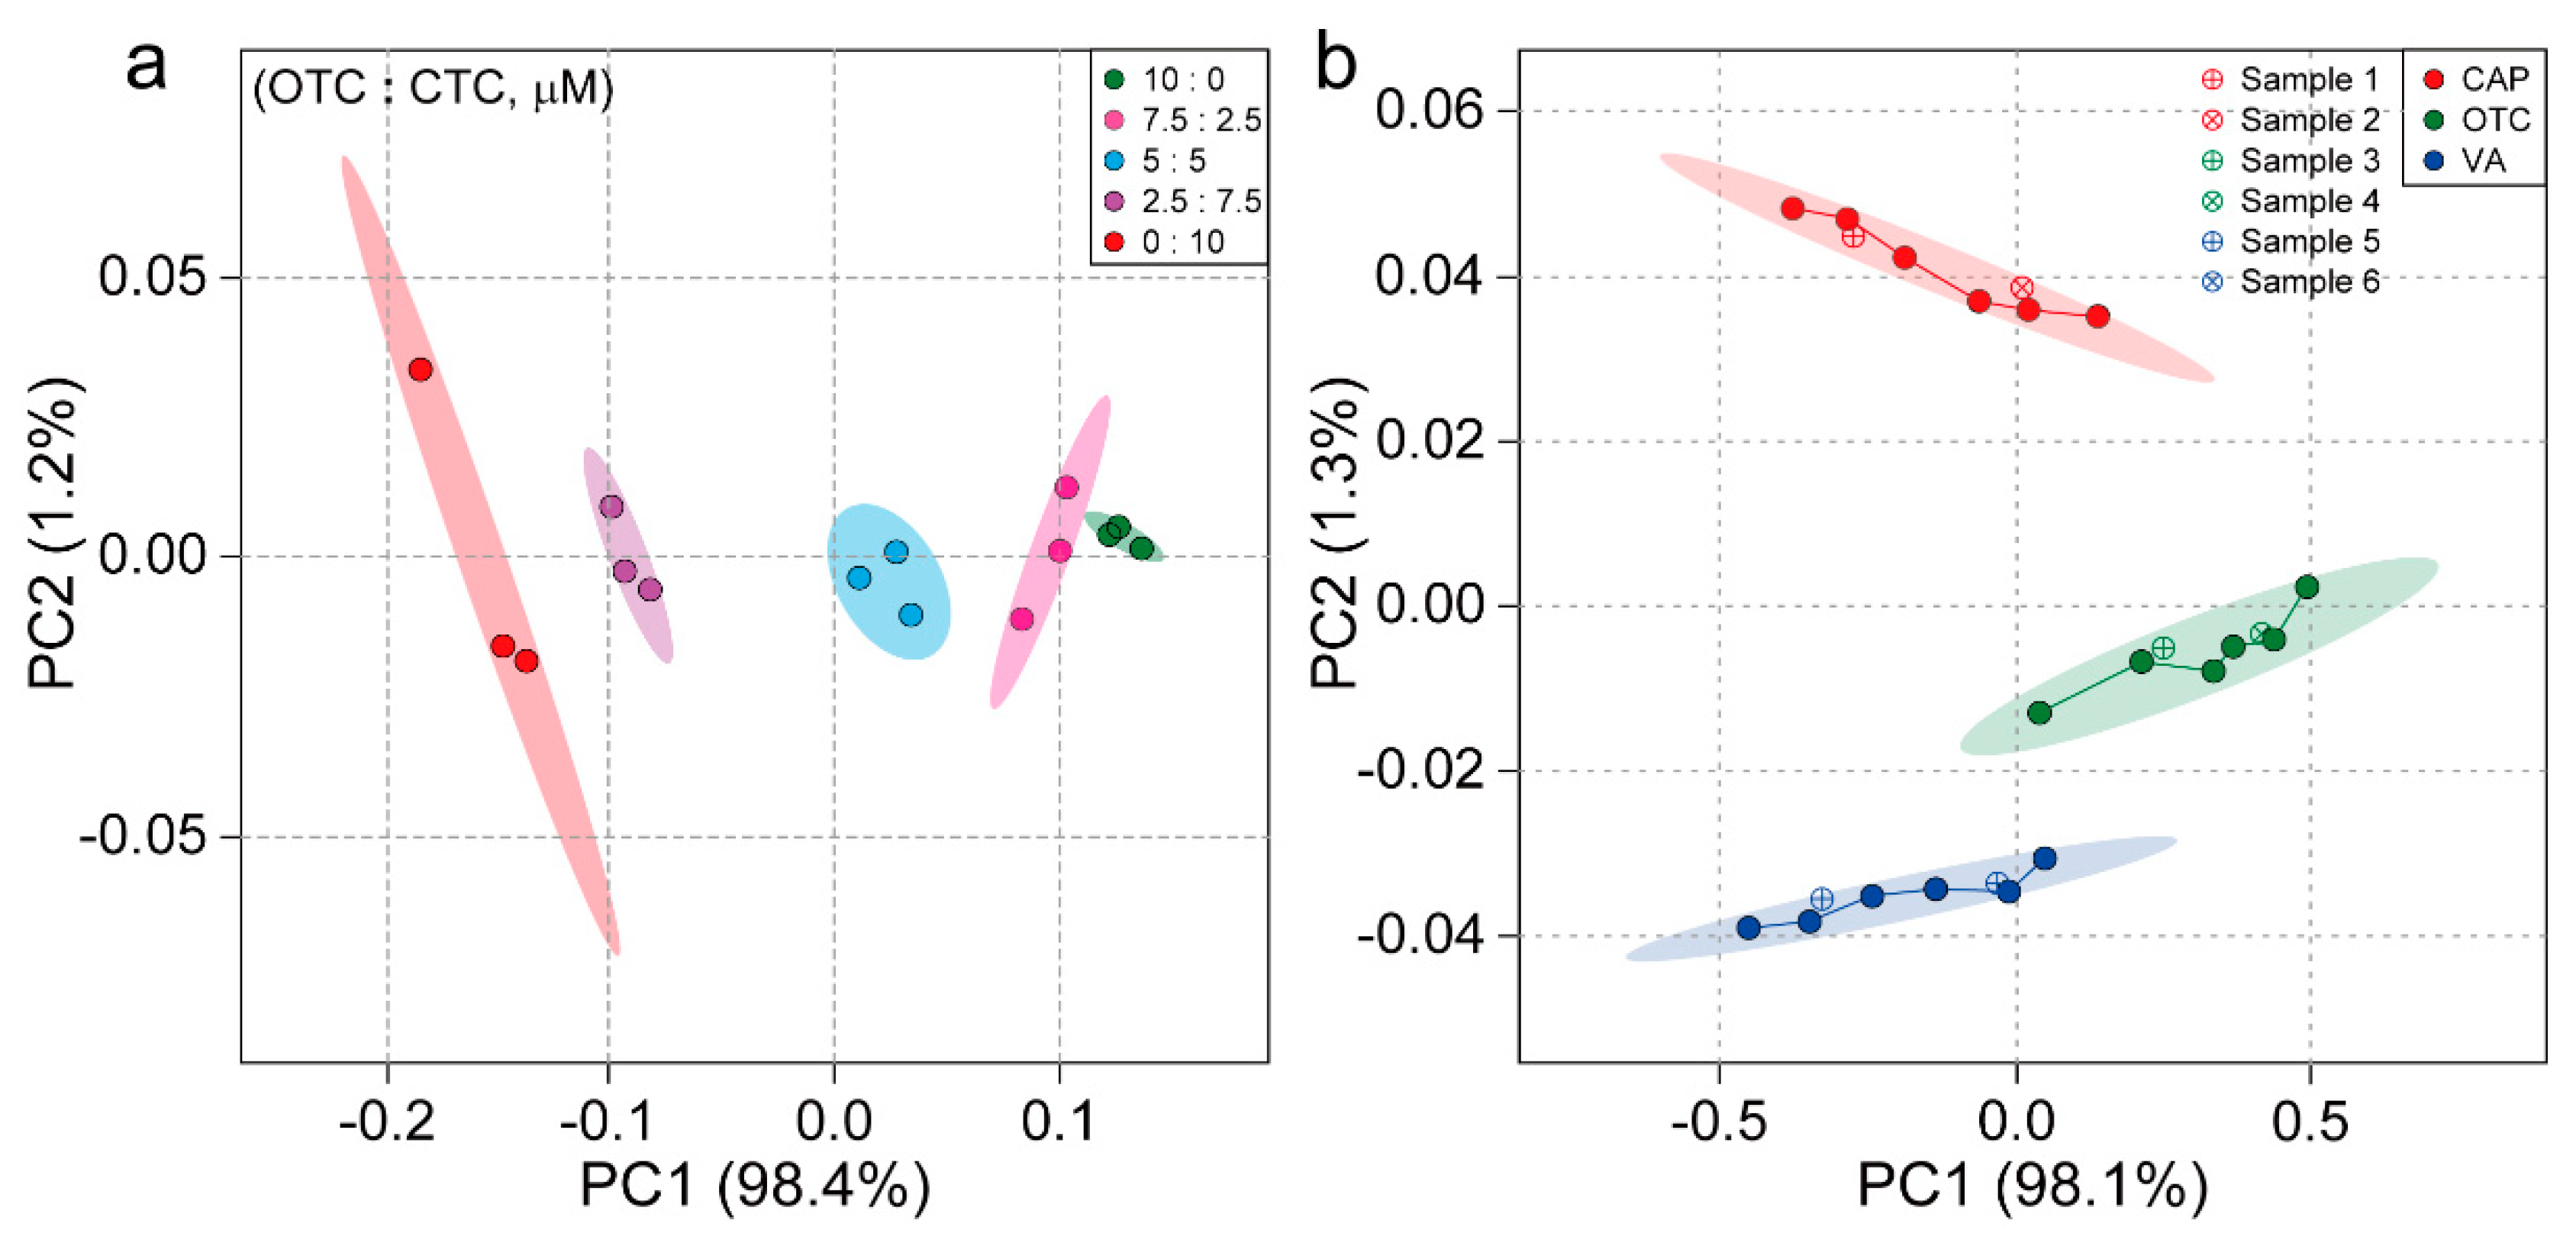
3.7. Discrimination of Antibiotic Binary Mixtures and Blind Samples by Sensor Arrays

To further explore the ability of the sensor array to discriminate the antibiotic mixtures, binary mixtures of OTC and CTC with different molar ratios (total concentration of 100 μM, OTC:CTC = 10:0, 7.5:2.5, 5:5, 2.5:7.5 and 0:10, respectively) were prepared as samples, and then the fluorescence responses of the sensor array towards these mixture samples were recorded and analyzed. As illustrated in Figure 5a, the mixtures of the binary antibiotics with different molar ratios were clustered in different groups in the 2D PCA plot, and a good distinction was obtained. It was obvious that the different elliptical confidence regions in the plot were arranged in accordance with the molar ratio. These results suggested that the MUA-AuNCs-Re3+ sensor array has the potential to distinguish antibiotics from complex components.
Finally, to further demonstrate the utility of the MUA-AuNCs-Re3+ sensor array, blind sample detection was performed. Before the developed sensor array was applied to the detection of the blind samples, first of all, we measured and recorded the fluorescence response of each sensor to CAP, OTC and VA in the concentration range of 80–300 μM. Then, the original data matrix of the fluorescence responses (3 probes × 6 concentrations × 3 antibiotics) was treated by PCA to draw a concentration-dependent PCA plot, in which the data points of each antibiotic were sorted in order of the concentration. Afterwards, standards with different antibiotic categories and concentrations in tap water samples were prepared and labeled as samples 1–6. After testing the fluorescence responses of the sensor array to these samples, the coordinate points of each sample were identified and analyzed in the established concentration-dependent 2D PCA plot by combining the data with the plot above (Figure 5b). The outcomes showed that samples 1 and 2 were within the range of CAP, and the approximate concentrations of 120 and 240 μM were calculated based on the distance of the line, which were consistent with the spiked concentrations. Satisfactory results were also acquired for water samples 3–6, with unknown samples being well discriminated and quantified with 100% accuracy. All in all, we successfully analyzed unknown antibiotics by using concentration-dependent 2D PCA plot, and the above results indicated that the MUA-AuNCs-Re3+ sensor array had great potential for the qualitative and semi-quantitative detection of the antibiotics in unknown tap water samples.

4. Conclusions

In summary, a MUA-AuNCs-Re3+-based fluorescent sensor array was designed and successfully applied to the discrimination of antibiotics. The mechanism of the array speculated the changes in the aggregation of MUA-AuNCs induced by Re3+ and antibiotics. The antibiotics response diversely to the MUA-AuNCs-Re3+. Combined with statistical methods such as PCA and HCA, the MUA-AuNCs-Re3+ sensor array could effectively distinguish six antibiotics in the concentration range of 40–300 μM, single antibiotics at different concentrations (10–300 μM) and binary antibiotic mixtures. Additionally, the sensor is also excellent in quantitative detection, allowing simple quantification of individual antibiotics at different concentrations via PC1. In addition to the above satisfactory capabilities, the potential capability of the array for practical applications was further validated based on the good performance of the sensor array in identifying and semi-quantitating antibiotic blind samples in tap water samples. Furthermore, considering the advantages of AuNCs such as the simple synthesis method and unique physicochemical properties, we believe AuNCs-based sensor arrays can provide opportunity for the analysis of other compounds by ingenious design.

Supplementary Materials

The following supporting information can be downloaded at: https://www.mdpi.com/article/10.3390/chemosensors11060330/s1, Figure S1: Fluorescence emission spectra of MUA-AuNCs at different excitation wavelengths; Figure S2: The fluorescence spectra of (A) MUA-AuNCs-Gd3+, (C) MUA-AuNCs-Ce3+ and (E) MUA-AuNCs-Tm3+ towards OTC (0–300 μM). The changes of the normalized fluorescence in-tensity of (B) MUA-AuNCs-Gd3+, (D) MUA-AuNCs-Ce3+ and (F) MUA-AuNCs-Tm3+ at 610 nm with the concentration of OTC (λex = 265 nm); Figure S3: The fluorescence spectra of (A) MUA-AuNCs-Gd3+, (C) MUA-AuNCs-Ce3+ and (E) MUA-AuNCs-Tm3+ towards TET (0–300 μM). The changes of the normalized fluorescence inten-sity of (B) MUA-AuNCs-Gd3+, (D) MUA-AuNCs-Ce3+ and (F) MUA-AuNCs-Tm3+ at 610 nm with the concentration of TET (λex = 265 nm); Figure S4: The fluorescence spectra of (A) MUA-AuNCs-Gd3+, (C) MUA-AuNCs-Ce3+ and (E) MUA-AuNCs-Tm3+ towards CTC (0–300 μM). The changes of the normalized fluorescence inten-sity of (B) MUA-AuNCs-Gd3+, (D) MUA-AuNCs-Ce3+ and (F) MUA-AuNCs-Tm3+ at 610 nm with the concentration of CTC (λex = 265 nm); Figure S5: The fluorescence spectra of (A) MUA-AuNCs-Gd3+, (C) MUA-AuNCs-Ce3+ and (E) MUA-AuNCs-Tm3+ towards DOCX (0–300 μM). The changes of the normalized fluorescence in-tensity of (B) MUA-AuNCs-Gd3+, (D) MUA-AuNCs-Ce3+ and (F) MUA-AuNCs-Tm3+ at 610 nm with the concentration of DOCX (λex = 265 nm); Figure S6: The fluorescence spectra of (A) MUA-AuNCs-Gd3+, (C) MUA-AuNCs-Ce3+ and (E) MUA-AuNCs-Tm3+ towards VA (0–300 μM). The changes of the normalized fluorescence intensity of (B) MUA-AuNCs-Gd3+, (D) MUA-AuNCs-Ce3+ and (F) MUA-AuNCs-Tm3+ at 610 nm with the concentration of VA (λex = 265 nm); Figure S7: The fluorescence spectra of (A) MUA-AuNCs-Gd3+, (C) MUA-AuNCs-Ce3+ and (E) MUA-AuNCs-Tm3+ towards CAP (0–300 μM). The changes of the normalized fluorescence in-tensity of (B) MUA-AuNCs-Gd3+, (D) MUA-AuNCs-Ce3+ and (F) MUA-AuNCs-Tm3+ at 610 nm with the concentration of CAP (λex = 265 nm); Figure S8: The effect of the concentration of the different rare earth ions on the fluorescence in-tensity of MUA-AuNCs. Fluorescence emission spectra of MUA-AuNCs after the addition of (A) Gd3+, (B) Ce3+ and (C) Tm3+ (0–50 μM) in the pure aqueous solution (pH = 7.2). (D) The effect of the rare earth ions (0–50 μM) on the fluorescence intensity of MUA-AuNCs at 610 nm. (λex = 265 nm); Figure S9: Fluorescence emission spectra of MUA-AuNCs-Gd3+ in different solutions in response to OTC. (A) Pure aqueous solution (pH = 7.2), (B) Tris-HCl solution (pH = 7.4), (C) HEPES buffer solution (pH = 7.4) and (D) PBS (pH = 7.4); Figure S10: Fluorescence stability of MUA-AuNCs and different MUA-AuNCs-Re3+ within one week; Figure S11: The effect of the response time with OTC on the fluorescence intensity of the MUA-AuNCs-Re3+ sensor array within 1 h (based on the normalized fluorescence intensity at 610 nm); Figure S12: Chemical formulae of different antibiotics; Figure S13: Zeta potential maps of (A) MUA-AuNCs, (B) MUA-AuNCs-Gd3+ and (C) MUA-AuNCs-Gd3++OTC. (D) Zeta potential of MUA-AuNCs after mixed with Gd3+ and OTC; Figure S14: 2D PCA plots for the distinguish of the multiple antibiotics at different concentrations (A) 40 μM, (B) 80 μM, (C) 150 μM, and (D) 300 μM. The ellipses in the figure are plotted with 95% confidence intervals; Figure S15: (A) 2D PCA plot of the MUA-AuNCs-Re3+ sensor array towards different concentra-tions of OTC (10–300 μM) (ellipses are drawn with 95% confidence). (B) PC1 of the sensor array plotted versus different concentrations of OTC. Inset: the linear relationship in the concentration of OTC from 100 to 300 μM (n = 3); Figure S16: (A) 2D PCA plot of the MUA-AuNCs-Re3+ sensor array towards different concentra-tions of TET (10–300 μM) (ellipses are drawn with 95% confidence). (B) PC1 of the sensor array plotted versus different concentrations of TET. Inset: the linear relationship in the concentration of TET from 100 to 300 μM (n = 3); Figure S17: (A) 2D PCA plot of the MUA-AuNCs-Re3+ sensor array towards different concentra-tions of CTC (10–300 μM) (ellipses are drawn with 95% confidence). (B) PC1 of the sensor array plotted versus different concentrations of CTC. Inset: the linear relationship in the concentration of CTC from 100 to 300 μM (n = 3); Figure S18: (A) 2D PCA plot of the MUA-AuNCs-Re3+ sensor array towards different concentra-tions of DOCX (10–300 μM) (ellipses are drawn with 95% confidence). (B) PC1 of the sensor array plotted versus different concentrations of DOCX. Inset: the linear relationship in the concentra-tion of DOCX from 100 to 300 μM (n = 3); Figure S19: (A) 2D PCA plot of the MUA-AuNCs-Re3+ sensor array towards different concentra-tions of VA (10–300 μM) (ellipses are drawn with 95% confidence). (B) PC1 of the sensor array plotted versus different concentrations of VA Inset: the linear relationship in the concentration of VA from 100 to 300 μM (n = 3); Figure S20: (A) 2D PCA plot of the MUA-AuNCs-Re3+ sensor array towards different concentra-tions of CAP (10–300 μM) (ellipses are drawn with 95% confidence). (B) PC1 of the sensor array plotted versus different concentrations of CAP. Inset: the linear relationship in the concentration of CAP from 100 to 300 μM (n = 3).

Author Contributions

Conceptualization, Y.L., J.P. and L.Z.; methodology, H.Y.; validation, J.Z.; formal analysis, M.M. and J.W.; investigation, M.M. and J.Z.; data curation, J.Z. and J.W. writing—original draft preparation, M.M., H.Y., J.Z. and J.W.; writing—review and editing, Y.L., J.P. and L.Z. supervision, J.P. and L.Z.; funding acquisition, Y.L., J.P. and L.Z. All authors have read and agreed to the published version of the manuscript.

Funding

We sincerely acknowledge the financial support of the National Natural Science Foundation of China (81701766), the Program for Science and Technology Development of Wenzhou (Y20210226) and the Scientific Research Fund of Zhejiang Provincial Education Department (Y202250265).

Institutional Review Board Statement

Not applicable.

Informed Consent Statement

Not applicable.

Data Availability Statement

The data presented in this study are available on request from the corresponding author.

Conflicts of Interest

The authors declare no conflict of interest.

References

  1. Michalova, E.; Novotna, P.; Schlegelova, J. Tetracyclines in veterinary medicine and bacterial resistance to them. Vet. Med. 2004, 49, 79–100. [Google Scholar] [CrossRef] [Green Version]
  2. Bahrami, F.; Morris, D.L.; Pourgholami, M.H. Tetracyclines: Drugs with huge therapeutic potential. Mini Rev. Med. Chem. 2012, 12, 44–52. [Google Scholar] [CrossRef] [PubMed]
  3. Sun, Y.F.; Wei, T.T.; Jiang, M.D.; Xu, L.H.; Xu, Z.X. Voltammetric sensor for chloramphenicol determination based on a dual signal enhancement strategy with ordered mesoporous carbon@polydopamine and beta-cyclodextrin. Sens. Actuat. B Chem. 2018, 255, 2155–2162. [Google Scholar] [CrossRef]
  4. Mu, F.Y.; He, J.Q.; Fan, F.; Shi, G.Y. Dual-emission fluorescence biosensing of vancomycin based on AIEgen-peptide conjugates and aptamer-modified Au nanoclusters. Anal. Chim. Acta 2021, 1150, 238177. [Google Scholar] [CrossRef]
  5. Qiao, M.; Ying, G.G.; Singer, A.C.; Zhu, Y.G. Review of antibiotic resistance in China and its environment. Environ. Int. 2018, 110, 160–172. [Google Scholar] [CrossRef] [Green Version]
  6. Tuc, D.Q.; Alliot, F.; Moreau-Guigon, E.; Eurin, J.; Chevreuil, M.; Labadie, P. Measurement of trace levels of antibiotics in river water using on-line enrichment and triple-quadrupole LC-MS/MS. Talanta 2011, 85, 1238–1245. [Google Scholar]
  7. Verlicchi, P.; Al Aukidy, M.; Jelic, A.; Petrovic, M.; Barcelo, D. Comparison of measured and predicted concentrations of selected pharmaceuticals in wastewater and surface water: A case study of a catchment area in the Po Valley (Italy). Sci. Total Environ. 2014, 470, 844–854. [Google Scholar] [CrossRef]
  8. Gao, H.; Zhang, L.X.; Lu, Z.H.; He, C.M.; Li, Q.W.; Na, G.S. Complex migration of antibiotic resistance in natural aquatic environments. Environ. Pollut. 2018, 232, 1–9. [Google Scholar] [CrossRef]
  9. Zhang, Y.J.; Hu, H.W.; Gou, M.; Wang, J.T.; Chen, D.L.; He, J.Z. Temporal succession of soil antibiotic resistance genes following application of swine. cattle and poultry manures spiked with or without antibiotics. Environ. Pollut. 2017, 231, 1621–1632. [Google Scholar] [CrossRef]
  10. Wright, G.D. Antibiotic resistance in the environment: A link to the clinic? Curr. Opin. Microbiol. 2010, 13, 589–594. [Google Scholar] [CrossRef]
  11. Ben, Y.J.; Fu, C.X.; Hu, M.; Liu, L.; Wong, M.H.; Zheng, C.M. Human health risk assessment of antibiotic resistance associated with antibiotic residues in the environment: A review. Environ. Res. 2019, 169, 483–493. [Google Scholar] [CrossRef] [PubMed]
  12. Chang, H.H.; Lv, J.; Zhang, H.C.; Zhang, B.; Wei, W.L.; Qiao, Y. Photoresponsive colorimetric immunoassay based on chitosan modified AgI/TiO2 heterojunction for highly sensitive chloramphenicol detection. Biosens. Bioelectron. 2017, 87, 579–586. [Google Scholar] [CrossRef] [PubMed]
  13. Kargin, I.D.; Sokolova, L.S.; Pirogov, A.V.; Shpigun, O.A. HPLC determination of tetracycline antibiotics in milk with post-column derivatization and fluorescence detection. Inorg. Mater. 2016, 52, 1365–1369. [Google Scholar] [CrossRef]
  14. Bol, D.S.; Amelin, V.G.; Nikeshina, T.B. Determination of antibiotics in drugs and biological fluids using capillary electrophoresis. J. Anal. Chem. 2016, 71, 215–233. [Google Scholar]
  15. Shen, L.; Chen, J.; Li, N.; He, P.L.; Li, Z. Rapid colorimetric sensing of tetracycline antibiotics with in situ growth of gold nanoparticles. Anal. Chim. Acta 2014, 839, 83–90. [Google Scholar] [CrossRef] [PubMed]
  16. Chafer-Pericas, C.; Maquicira, A.; Puchades, R.; Company, B.; Miralles, J.; Moreno, A. Multiresidue determination of antibiotics in aquaculture fish samples by HPLC-MS/MS. Aquac. Res. 2010, 41, e217–e225. [Google Scholar] [CrossRef]
  17. Jia, Q.; Liu, Y.; Duan, Y.; Zhou, J. Interfere-free detection of hydroxyl radical and arthritis diagnosis by rare-earth nanoprobe utilizing SWIR emission as reference. Anal. Chem. 2019, 97, 11433–11439. [Google Scholar] [CrossRef]
  18. Jia, Q.; Ma, L.; Zhai, X.; Fu, W.; Liu, Y.; Liao, X.; Zhou, J. Orthogonal NIR-II imaging enables spatially distinguishing tissues based on lanthanide-doped nanoprobes. Anal. Chem. 2020, 92, 14762–14768. [Google Scholar] [CrossRef]
  19. Liu, Y.; Jia, Q.; Zhai, X.; Mao, F.; Jiang, A.; Zhou, J. Rationally Designed Pure-inorganic Upconversion Nanoprobes for Ultra-highly Selective Hydrogen Sulfide Imaging and Elimination In Vivo. Chem. Sci. 2019, 10, 1193–1200. [Google Scholar] [CrossRef] [Green Version]
  20. Zhou, X.; Wang, T.L.; Zhao, M.Y.; Wang, P.X.; Hao, Z.; Lin, X.D.; Wang, S.; Liu, Y.Q. Chemical-tongue sensor array for determination of multiple metal ions based on trichromatic lanthanide-based nanomaterials. Sens. Actuators B Chem. 2021, 343, 130107. [Google Scholar] [CrossRef]
  21. Huang, C.Y.; Luo, Y.X.; Li, J.C.; Liu, C.; Zhou, T.S.; Deng, J.J. pH-regulated H4TCPE@Eu/AMP ICP sensor array and its fingerprinting on test papers: Toward point-of-use systematic analysis of environmental antibiotics. Anal. Chem. 2021, 93, 9183–9192. [Google Scholar] [CrossRef] [PubMed]
  22. Sun, S.; Jiang, K.; Qian, S.H.; Wang, Y.H.; Lin, H.W. Applying carbon dots-metal ions ensembles as a multichannel fluorescent sensor array: Detection and discrimination of phosphate anions. Anal. Chem. 2017, 89, 5542–5548. [Google Scholar] [CrossRef] [PubMed]
  23. Jin, R.C. Quantum sized. thiolate-protected gold nanoclusters. Nanoscale 2010, 2, 343–362. [Google Scholar] [CrossRef] [PubMed]
  24. Kim, A.; Zeng, C.J.; Zhou, M.; Jin, R.C. Surface engineering of Au36(SR)24 nanoclusters for photoluminescence enhancement. Part. Part. Syst. Charact. 2017, 34, 1600388. [Google Scholar] [CrossRef] [Green Version]
  25. Yuan, X.; Luo, Z.T.; Yu, Y.; Yao, Q.F.; Xie, J.P. Luminescent noble metal nanoclusters as an emerging optical probe for sensor development. Chem. Asian J. 2013, 8, 858–871. [Google Scholar] [CrossRef]
  26. Tan, X.P.; Zhang, Z.; Cao, T.W.; Zeng, W.J.; Huang, T.; Zhao, G.F. Control Assembly of Pillar[6]arene-Modified Ag Nanoparticles on Covalent Organic Framework Surface for Enhanced Sensing Performance toward Paraquat. ACS Sustain. Chem. Eng. 2020, 7, 20051–20059. [Google Scholar] [CrossRef]
  27. Wang, H.H.; Lin, C.A.; Lee, C.H.; Lin, Y.C.; Tseng, Y.M.; Hsieh, C.L.; Chen, C.H.; Tsai, C.H.; Hsieh, C.T.; Shen, J.L.; et al. Fluorescent gold nanoclusters as a biocompatible marker for in vitro and in vivo tracking of endothelial cells. ACS Nano 2011, 5, 4337–4344. [Google Scholar] [CrossRef]
  28. Cantelli, A.; Battistelli, G.; Guidetti, G.; Manzi, J.; Di Giosia, M.; Montalti, M. Luminescent gold nanoclusters as biocompatible probes for optical imaging and theranostics. Dyes Pigments 2016, 135, 64–79. [Google Scholar] [CrossRef]
  29. Tao, Y.; Li, M.Q.; Ren, J.S.; Qu, X.G. Metal nanoclusters: Novel probes for diagnostic and therapeutic applications. Chem. Soc. Rev. 2015, 44, 8636–8663. [Google Scholar] [CrossRef]
  30. Wu, Y.Y.; Wang, B.; Wang, K.; Yan, P. Identification of proteins and bacteria based on a metal ion-gold nanocluster sensor array. Anal. Methods 2018, 10, 3939–3944. [Google Scholar] [CrossRef]
  31. Yang, H.W.; Lu, F.N.; Sun, Y.; Yuan, Z.Q.; Lu, C. Fluorescent gold nanocluster-based sensor array for nitrophenol isomer discrimination via an integration of host-guest interaction and inner filter effect. Anal. Chem. 2018, 90, 12846–12853. [Google Scholar] [CrossRef] [PubMed]
  32. Wang, M.; Mei, Q.S.; Zhang, K.; Zhang, Z.P. Protein-gold nanoclusters for identification of amino acids by metal ions modulated ratiometric fluorescence. Analyst 2012, 137, 1618–1623. [Google Scholar] [CrossRef] [PubMed]
  33. Kang, H.Z.; Lin, L.P.; Rong, M.C.; Chen, X. A cross-reactive sensor array for the fluorescence qualitative analysis of heavy metal ions. Talanta 2014, 129, 296–302. [Google Scholar] [CrossRef] [PubMed]
  34. Ding, S.N.; Li, C.M.; Gao, B.H.; Kargbo, O.; Wan, N.; Chen, X.; Zhou, C. Probing phosphate ion via the europium(III)-modulated fluorescence of gold nanoclusters. Microchim. Acta 2014, 181, 1957–1963. [Google Scholar] [CrossRef]
  35. Wang, J.X.; Lin, X.F.; Shu, T.; Su, L.; Liang, F.; Zhang, X.J. Self-assembly of metal nanoclusters for aggregation-induced emission. Int. J. Mol. Sci. 2019, 20, 1891. [Google Scholar] [CrossRef] [Green Version]
  36. Shu, T.; Wang, J.X.; Su, L.; Zhang, X.J. Luminescent organometallic nanomaterials with aggregation-induced emission. Crit. Rev. Anal. Chem. 2018, 48, 330–336. [Google Scholar] [CrossRef]
  37. Zhang, Y.; Lv, M.; Gao, P.F.; Zhang, G.M.; Shi, L.H.; Yuan, M.J.; Shuang, S.M. The synthesis of high bright silver nanoclusters with aggregation-induced emission for detection of tetracycline. Sens. Actuators B Chem. 2021, 326, 129009. [Google Scholar] [CrossRef]
  38. Chen, B.N.; Yang, Z.S.; Qu, X.L.; Zheng, S.R.; Yin, D.Q.; Fu, H.Y. Screening and discrimination of perfluoroalkyl substances in aqueous solution using a luminescent metal-organic framework sensor array. ACS Appl. Mater. Interfaces 2021, 13, 47706–47716. [Google Scholar] [CrossRef]
Scheme 1. Schematic illustration of MUA-AuNCs-Re3+-based fluorescent sensor array for the identification of antibiotics.
Chemosensors 11 00330 sch001
Figure 1. (a) TEM image of MUA-AuNCs. (b) Absorption spectrum (black) and fluorescence emission spectrum (blue) of MUA-AuNCs (λex = 265 nm), the inset includes photographs of MUA-AuNCs under the visible light and 254 nm UV light. (c) Fluorescence spectra of MUA-AuNCs before and after adding 40 μM Gd3+, Ce3+ and Tm3+. Fluorescence responses of (d) MUA-AuNCs-Gd3+, (e) MUA-AuNCs-Ce3+ and (f) MUA-AuNCs-Tm3+ to six antibiotics (OTC, TET, CTC, DOCX, VA, and CAP, 200 μM).
Chemosensors 11 00330 g001
Figure 2. (a) UV-Vis absorption spectra of MUA-AuNCs and six antibiotics (OTC, TET, CTC, DOCX, VA and CAP). (b) TEM of MUA-AuNCs-Gd3+, and after the addition of TET, VA and CAP, respectively. (c) Zeta potential of MUA-AuNCs after mixed with Gd3+ and OTC.
Chemosensors 11 00330 g002
Figure 3. (a) Bar graphs of the fluorescence response patterns of the MUA-AuNCs-Re3+ sensor array to the six antibiotics (200 μM, n = 3). Corresponding (b) 3D PCA plot, (c) heat map, and (d) HCA plot of the fluorescence sensor array derived from the fluorescence response pattern (a).
Chemosensors 11 00330 g003
Figure 4. (a) The normalized fluorescence intensity of MUA-AuNCs-Gd3+ before and after addition of 200 μM OTC in the presence of various interfering substances (Fe2+, Ca2+, Mg2+, NH4+, Na+, K+, Cl, F, CO32−, SO42−, GSH, AA, Cys, Glu, and Gly, 100 μM). The normalization standard is the fluorescence intensity value at 610 nm before adding OTC. (b) 2D PCA plot for differentiating multiple antibiotics in the presence of interfering substances (where the concentrations of the antibiotics and interfering substances were 200 and 100 μM, respectively).
Chemosensors 11 00330 g004
Figure 5. (a) A 2D PCA plot derived from the fluorescence response of MUA-AuNCs-Re3+ sensor array to different molar ratios of binary antibiotic mixtures (total concentration of 100 μM, OTC:CTC = 10:0, 7.5:2.5, 5:5, 2.5:7.5 and 0:10). (b) Concentration-dependent 2D PCA plot derived from the fluorescence responses of MUA-AuNCs-Re3+ sensor array towards CAP, OTC, and VA (80–300 μM). Samples 1–6 were randomly prepared for blind sample test with 120 and 240 μM of CAP, OTC and VA, respectively. Ellipses are drawn with 95% confidence.
Chemosensors 11 00330 g005
Disclaimer/Publisher’s Note: The statements, opinions and data contained in all publications are solely those of the individual author(s) and contributor(s) and not of MDPI and/or the editor(s). MDPI and/or the editor(s) disclaim responsibility for any injury to people or property resulting from any ideas, methods, instructions or products referred to in the content.

