Article

Detection of Water Vapor by Chemiluminescence

1
Division of Applied Chemistry, Faculty of Engineering, Hokkaido University, Kita 13 Nishi 8, Kita-ku, Sapporo 060-8628, Japan
2
MORESCO Corporation, 5-5-3 Minatojimaminamimachi, Chuo-ku, Kobe 650-0047, Japan
*
Author to whom correspondence should be addressed.
Chemosensors 2023, 11(5), 284; https://doi.org/10.3390/chemosensors11050284
Submission received: 4 April 2023 / Revised: 2 May 2023 / Accepted: 4 May 2023 / Published: 9 May 2023

Abstract

:
We examined the possibility of detecting water vapor by chemiluminescence using the reaction of popular “chemical light” (bis(2,4,5-trichlorophenyl-6-carbopentoxyphenyl)oxalate with H2O2). H2O2 is released from sodium percarbonate exposed to water molecules as in the oxygen bleach. The release of H2O2 by water vapor was confirmed by mass spectrometry in a vacuum. The chemiluminescence from the mixed reagents was observed when exposed to water vapor. This method opens the way to locally detect the faulty points of water barrier films and observe the real-time failure of the barrier films during bending tests of flexible packing materials. A molecular dynamics simulation was performed to study the diffusion of H2O2 molecules in polymers.

1. Introduction

Water vapor barrier performance is a very important property for the implementation of various devices, including organic light-emitting diodes (OLEDs) [1], thin film transistors (TFTs), and liquid crystal displays (LCDs) [2], organic or perovskite solar cells [3], and lithium-ion batteries [4]. The criterion for the water vapor barrier is very severe in OLEDs (10−6 g m−2 day−1 level) [1], while they are less severe in other thin film devices (TFTs and solar cells) and thick film devices (LCDs and batteries). There are various methods to detect water vapor transmission rate (WVTR) for film substrate materials and coatings: the calcium test method [5,6,7], differential pressure measurement [8], mass spectrometry [9], mass spectroscopy with a cold trap [10,11,12], electrochemical detection [13], highly sensitive optical absorption using cavity ringdown [8,14], etc. We have found that the adsorption of water molecules on the instrumental wall gives the deviating background by temperature fluctuation [12], and a method that uses chemical reactions, such as the calcium test, has an advantage for reducing the instrument sizes and, thus, the effect of wall outgasses.
There are two directions to improve the WVTR measurement. First, it has been practically impossible to detect WVTR locally. Since the major problem is the permeation of water vapor from cracks in the barrier coatings or pinholes formed during manufacturing, it is desirable to develop a position-sensitive technique of WVTR measurement. This local detection has been only achievable by using the calcium test in combination with optical microscopy [15]. However, the ordinary calcium test only sees the change in the appearance of the calcium metal after the reaction with water, in which the metallic luster of calcium becomes white/transparent Ca(OH)2. It takes a very long time (e.g., weeks and months) to see the change for high-barrier films or coatings [5,6,7,15]. Although there are proposals to use electrical detection of the degradation of calcium to shorten the measurement time [16], it is not possible to locally detect the water vapor transmission in a pixel-wise manner. Second, all of the measurement methods so far are designed for static measurement of the whole sample, in which the sample is fixed to a rigid sample holder and cannot move. It is desirable to measure flexible films and their coatings in real time in motion, for example, during repeating bending tests to reduce the testing time. However, there is a high possibility of making a mistake in the handling, i.e., detaching the sample from the bending test machine and setting it to the WVTR measurement instrument repeatedly.
This paper describes the attempt toward the WVTR measurements with position sensitivity and for an unrigid measurement setup which will enable the local and real-time monitoring of WVTR properties in motion. It involves chemiluminescence initiated by water molecules. Luminescence is used in analytical chemistry and related areas [17,18], but no chemiluminescence was used in WVTR measurement. There are various types of chemiluminescence [19], such as involving firefly luciferin [20], Vargula luciferin [21], aequorin [22], luminol [23], 1,2-dioxcetane [24], etc. Cyalume chemiluminescence [25,26] (Figure 1) is one of them. There are various mechanisms specific to each chemiluminescence, for example, twisted intramolecular charge transfer, chemically induced electron exchange luminescence, etc. The luminol reaction and luciferin chemiluminescence are caused by the reaction with oxygen with a catalyst or an enzyme. The Cyalume chemiluminescence involving peroxyoxalate is initiated by the decomposition of bis(2,4,5-trichlorophenyl-6-carbopentoxyphenyl)oxalate (TCPO) or its derivative by H2O2 to yield C2O4 (peroxyoxalate) in the excited state. The Cyalume reaction is used as chemical lights with various colors, in which excitation of C2O4 is transferred to fluorescent dye molecules with various colors. Some substances release H2O2 in the existence of water. One of them is sodium percarbonate (Na2CO3·1.5H2O2) which is the main ingredient of oxygen bleach [27]. Here, we did experiments to show the possibility of using Cyalume chemiluminescence in combination with sodium percarbonate to detect water molecules. We demonstrated that the detection of water vapor is possible and examined the sensitivity. We discuss whether the expected sensitivity is high enough for the local WVTR detection of high-barrier coatings, and the remaining issues for practical applications. Additionaly, we studied the effect of organic solvents on the diffusion of an H2O2 molecule in a polymer matrix which has been encountered in the experiment.

2. Materials and Methods

2.1. Materials

TCPO, sodium percarbonate, polymethylmethacrylate (PMMA), and rubrene were purchased from Sigma-Aldrich Japan and used as purchased. Methyl acetate and chloroform (Sigma-Aldrich Japan, Tokyo, Japan) were completely dried by immersing vacuum-heated (300 °C) zeolite 4 A before use. The water level was checked by the Karl Fischer method (Kyoto Electronics Manufacturing Co. Ltd., Kyoto, Japan) to be undetectable (<5 ppm).

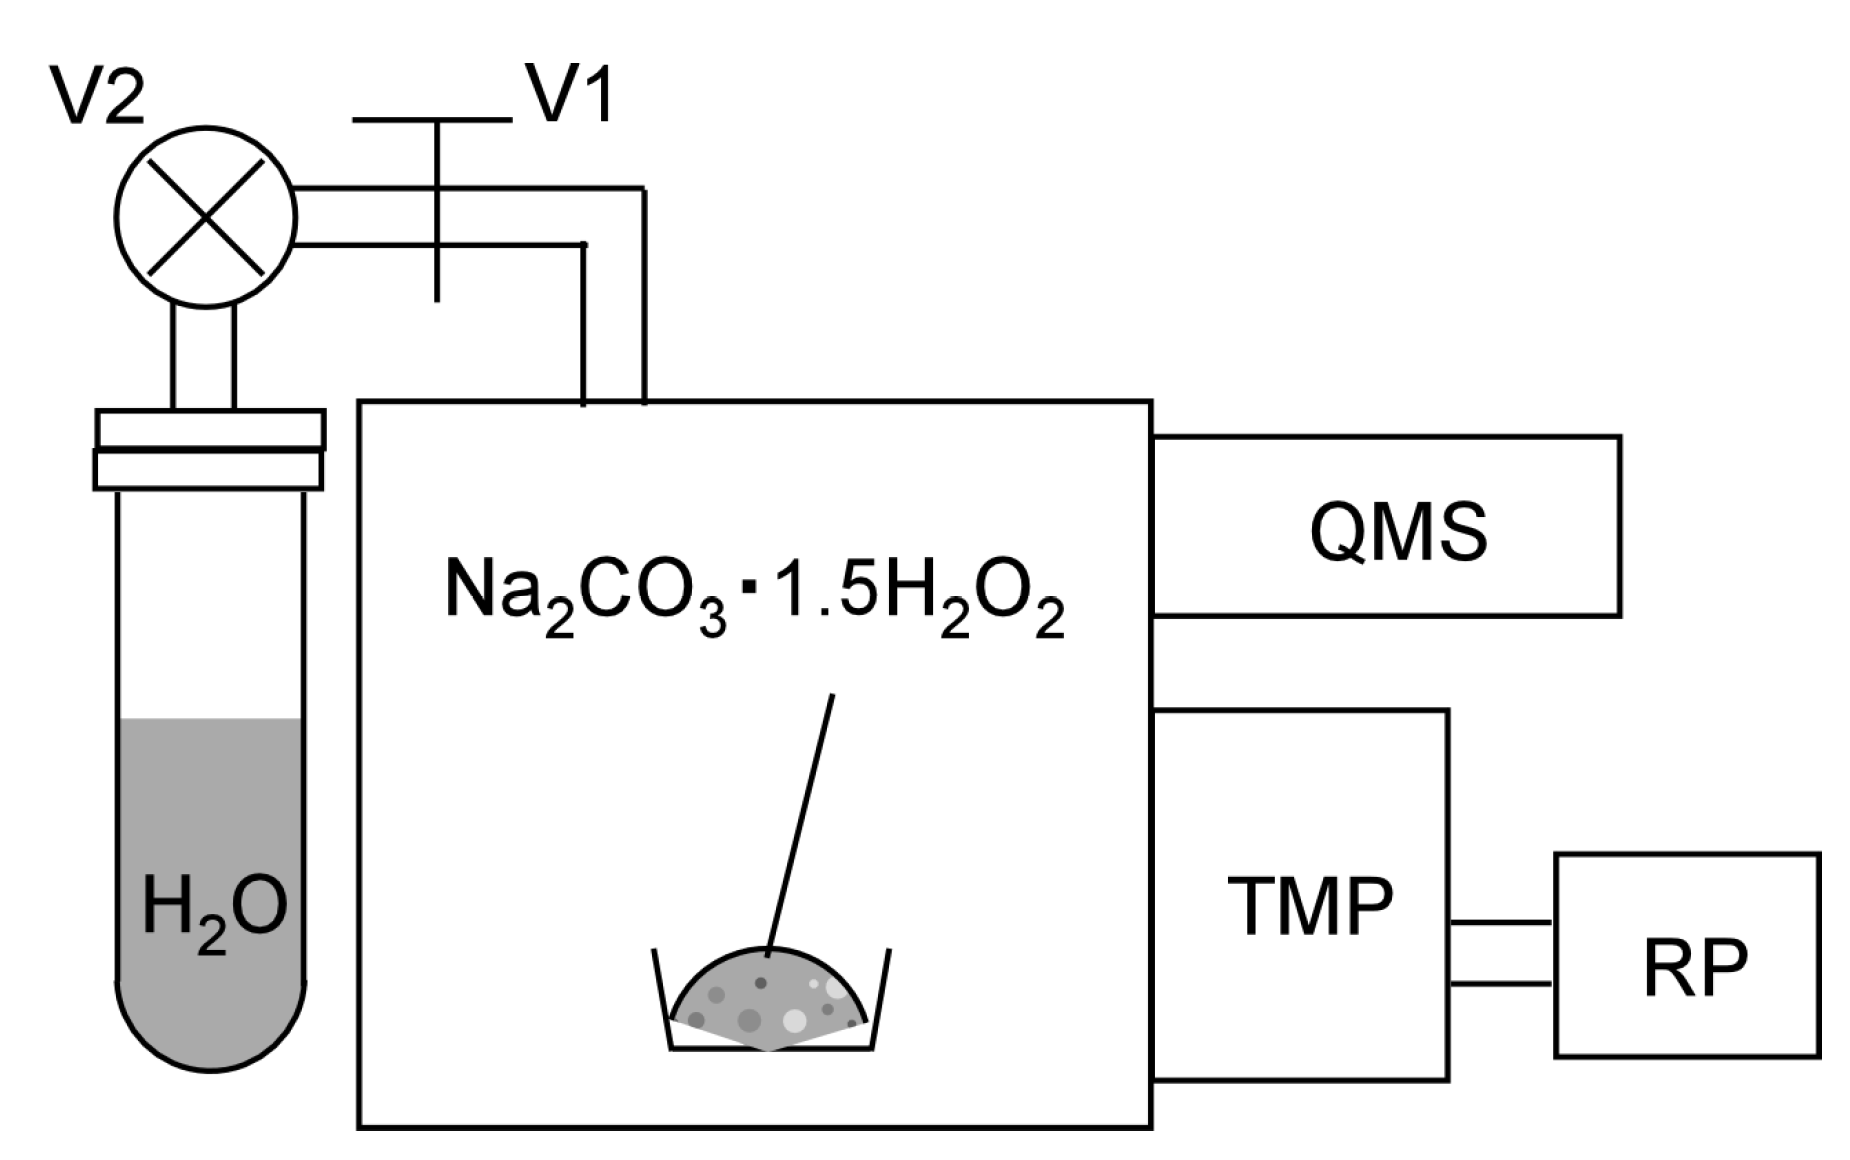
2.2. Emission of H2O2 from Sodium Percarbonate

Gas emission analysis was performed using a lab-made vacuum system (Figure 2) equipped with a turbo-molecular pump (base pressure < 1 × 10⁻⁵ Pa without baking) and quadrupole mass spectrometer (QMS; QIG-066, Canon Anelva, Kawasaki, Japan) to detect the emission of H2O2 (34 AMU). Water vapor was supplied through a variable leak valve and a stop valve. Distilled water was put in a glass tube welded to the ICF-34 flange and the stop valve was purified by the repeated suck–thaw procedure. A total of 200 mg of sodium percarbonate powder was put in the vacuum chamber.

2.3. Luminescence Initiated by Water Vapor in the Ambient

The chemiluminescent sheet was prepared from TCPO and rubrene mixed in a PMMA matrix coated with sodium percarbonate. The procedure was as follows: (1) TCPO 10 mg and rubrene 5 mg were dissolved in methyl acetate 5 mL. (2) PMMA 30 mg was dissolved in chloroform 10 mL. (3) Solutions (1) and (2) were thoroughly mixed and cast on a glass plate. It was dried by heating at 70 °C in an oven until the PMMA-based film started showing surface adhesion. (4) Finely grounded sodium percarbonate powder was bar coated on the sticky surface of the film (3). Solutions (5) and (4) were vacuum-dried by rotary pumping.
Light emission was measured by a spectrometer equipped with 1800/cm grating with a cooled CCD detector (DV-401, ANDOR Technology, Belfast, Great Britain). Green laser (semiconductor laser excited Nd: YVO4, 532nm, 5 mW) was used to excite rubrene for reference. The measurements were performed at room temperature.

2.4. Demonstration of Local Detection

We demonstrated local detection by making a sensor sheet with a transparent barrier and a star-shaped opening. TCPO 10 mg, rubrene 5 mg, and sodium percarbonate 30 mg were dispersed in dry methyl acetate 5 mL by sonication. It was coated on filter paper (ADVANTEC No. 2, 260 μm-thick) and completely dried in a vacuum desiccator. The filter paper was laminated with a polyolefine sheet (200 μm-thick) using a non-water-base glue from both sides. One side has an opening with a star shape of about 8 mm. The optical image in the dark was recorded with a color CMOS camera (Sony, Tokyo, Japan).

2.5. Molecular Dynamics Simulations

It is necessary to make H2O2 molecules diffuse into the materials containing TCPO and rubrene to initiate chemiluminescence. We performed molecular dynamics simulations to examine the diffusion of an H2O2 molecule in PMMA to see the effect of solvent methyl acetate that is observed experimentally. For the calculation, we used LAMMPS (Large-scale Atomic/Molecular Massively Parallel Simulator, version 2022) [28] using 63 parallel processors. A total of 1.3–1.6 × 10⁵ atoms were treated in the simulations. Sixteen PMMA 100-mer chains and an H2O2 molecule were mixed in a cubic unit cell and the cell volume was diminished under NVT (constant number-volume-temperature) conditions to achieve 5 atm pressure. For the “with-the-solvent” simulation, 1920 methyl acetate molecules were premixed with the polymer. The simulation employed a generalized AMBER force field (GAFF) [29]. The LAMMPS data file was prepared by moltemplate [30] and antechamber [31] with the atomic charges calculated by Gaussian 16 W [32] at the B3LYP/6-31G+ level of theory. The simulation step was 0.1 fs, and the temperature was set to 1000 K to mix the system for 100 ps and then kept at 300 K for 100 ps using a Nosé–Hoover thermostat with 1 atm barostat. The trajectory was recorded after thermal equilibrium was achieved. The trajectory of the H2O2 molecule was visualized by OVITO visualization software [33].

3. Results and Discussion

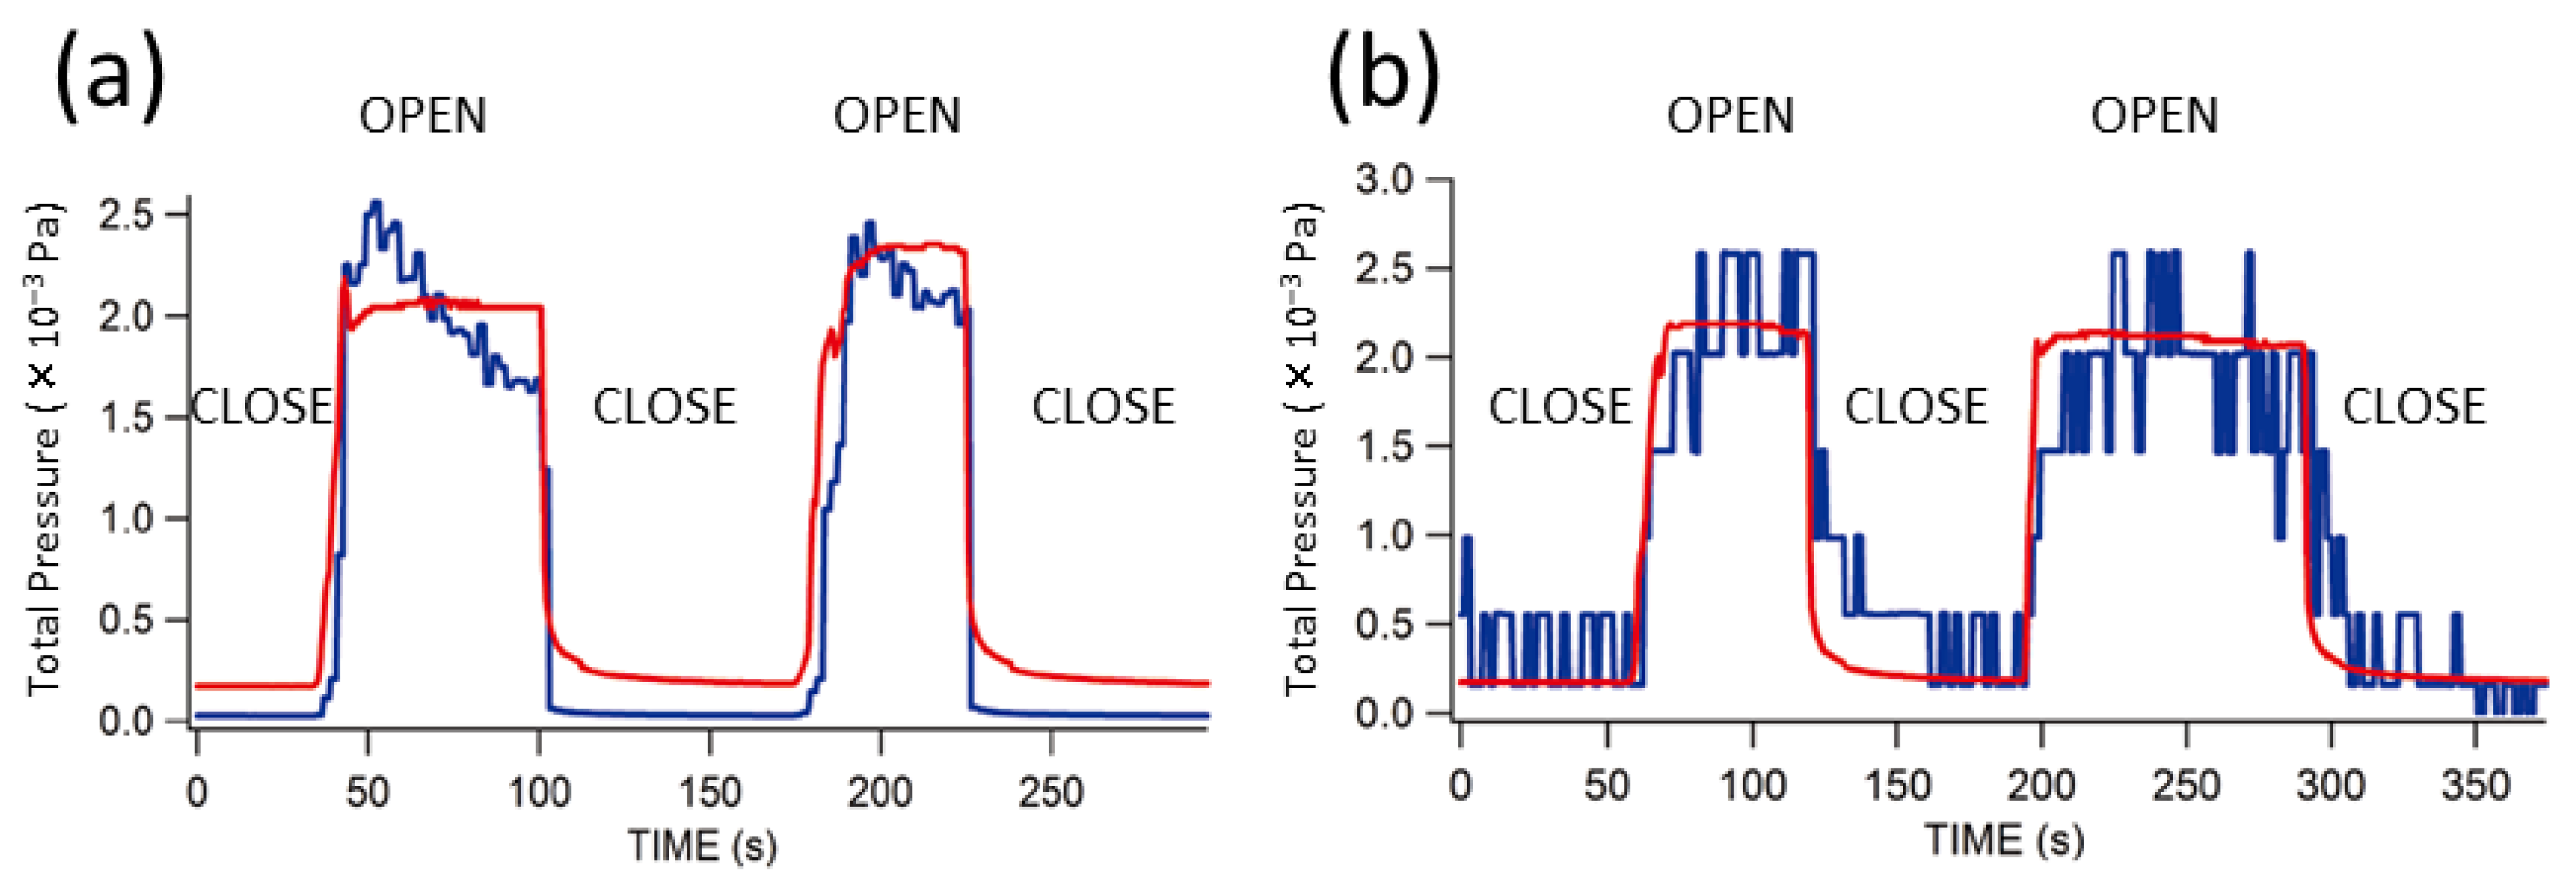
3.1. Emission of H2O2 from Sodium Percarbonate When Exposed to Water Vapor

It is established in the literature that (1) the chemiluminescence occurs from the TCPO-fluorescent dye system when H2O2 is present, and (2) H2O2 is released by the reaction between sodium percarbonate and a bulk liquid H2O. For water vapor detection by combining (1) and (2), the critical question is whether a small amount of H2O molecules can release H2O2 molecules quantitatively. To examine this point, we set 200 mg of sodium percarbonate in a vacuum chamber and exposed it to a controlled amount of H2O gas, while the released H2O2 was detected by QMS. Figure 3 shows the result. Figure 3a indicates the detection of supplied water (18 AMU) along with the total pressure when the variable leak valve V1 was set to introduce 2 × 10⁻³ Pa as the total pressure. The V2 valve was open and closed at the timing as seen in the change of the total pressure. Figure 3b shows the emission of H2O2 (34 AMU) using the same opening of the V1. It is noted that the detected signal intensity in Figure 3b is very stable, and it is confirmed that the H2O2 is emitted from sodium percarbonate quantitatively as the introduction of H2O2 vapors. The instability of the QMS signal of H2O (18 AMU) is due to the adsorption of water molecules on or around the components of the ionization chamber of QMS [12,34].
No 34 AMU signal was at background level (1 step fluctuation in Figure 3b) when sodium percarbonate powder was not placed in the vacuum chamber.

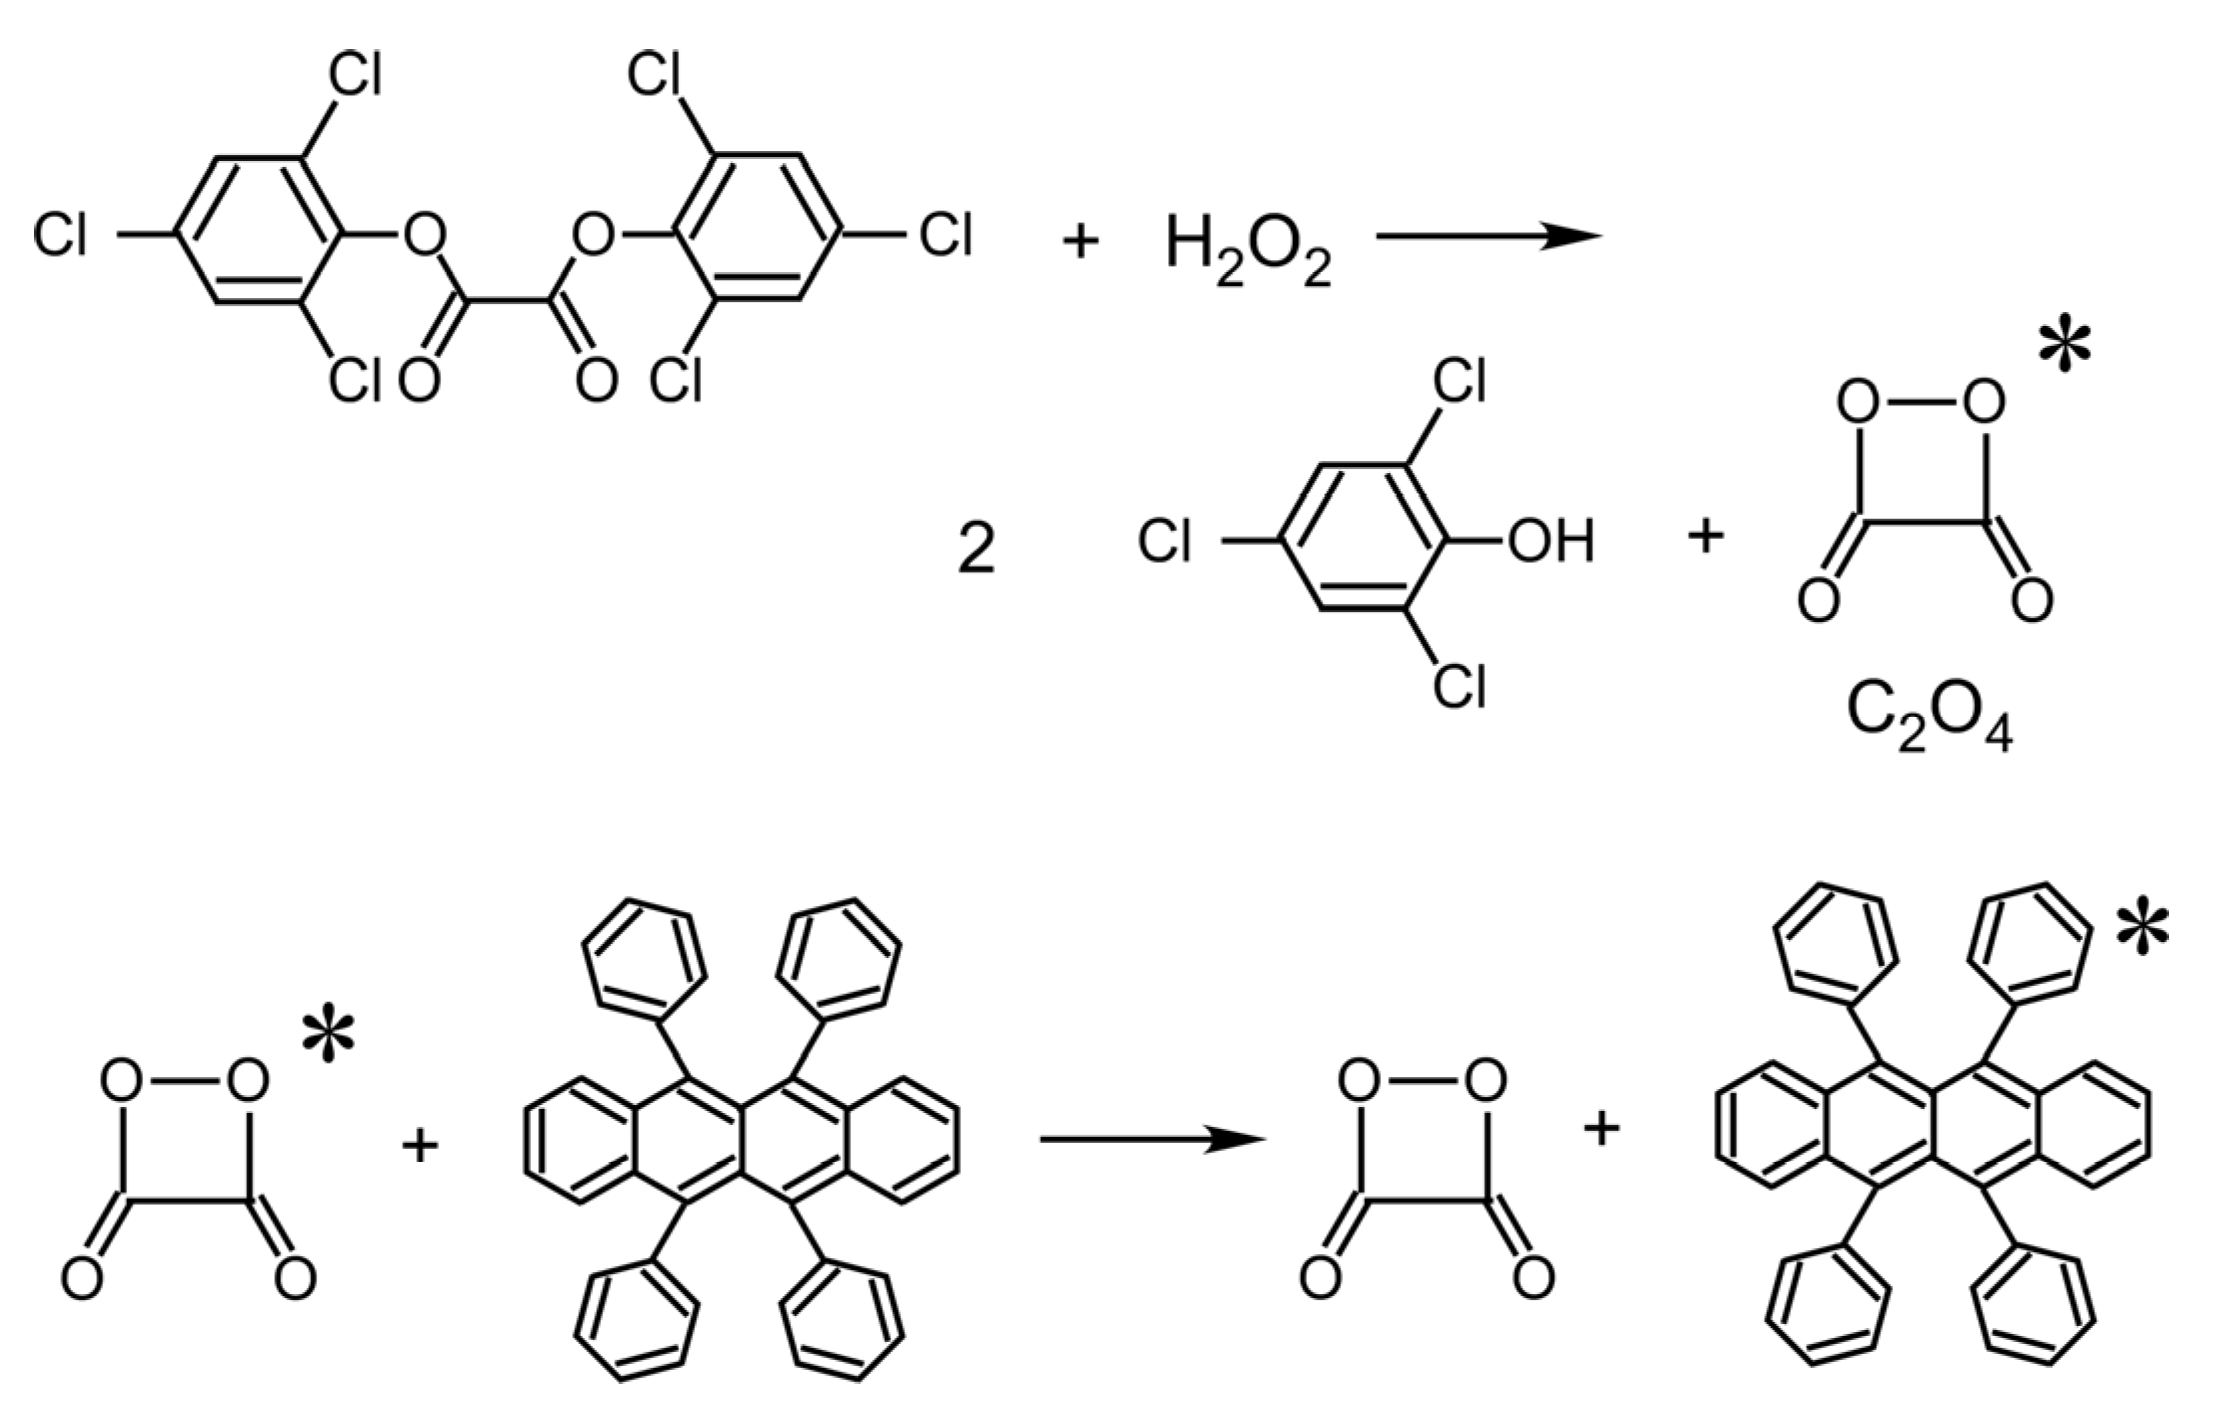
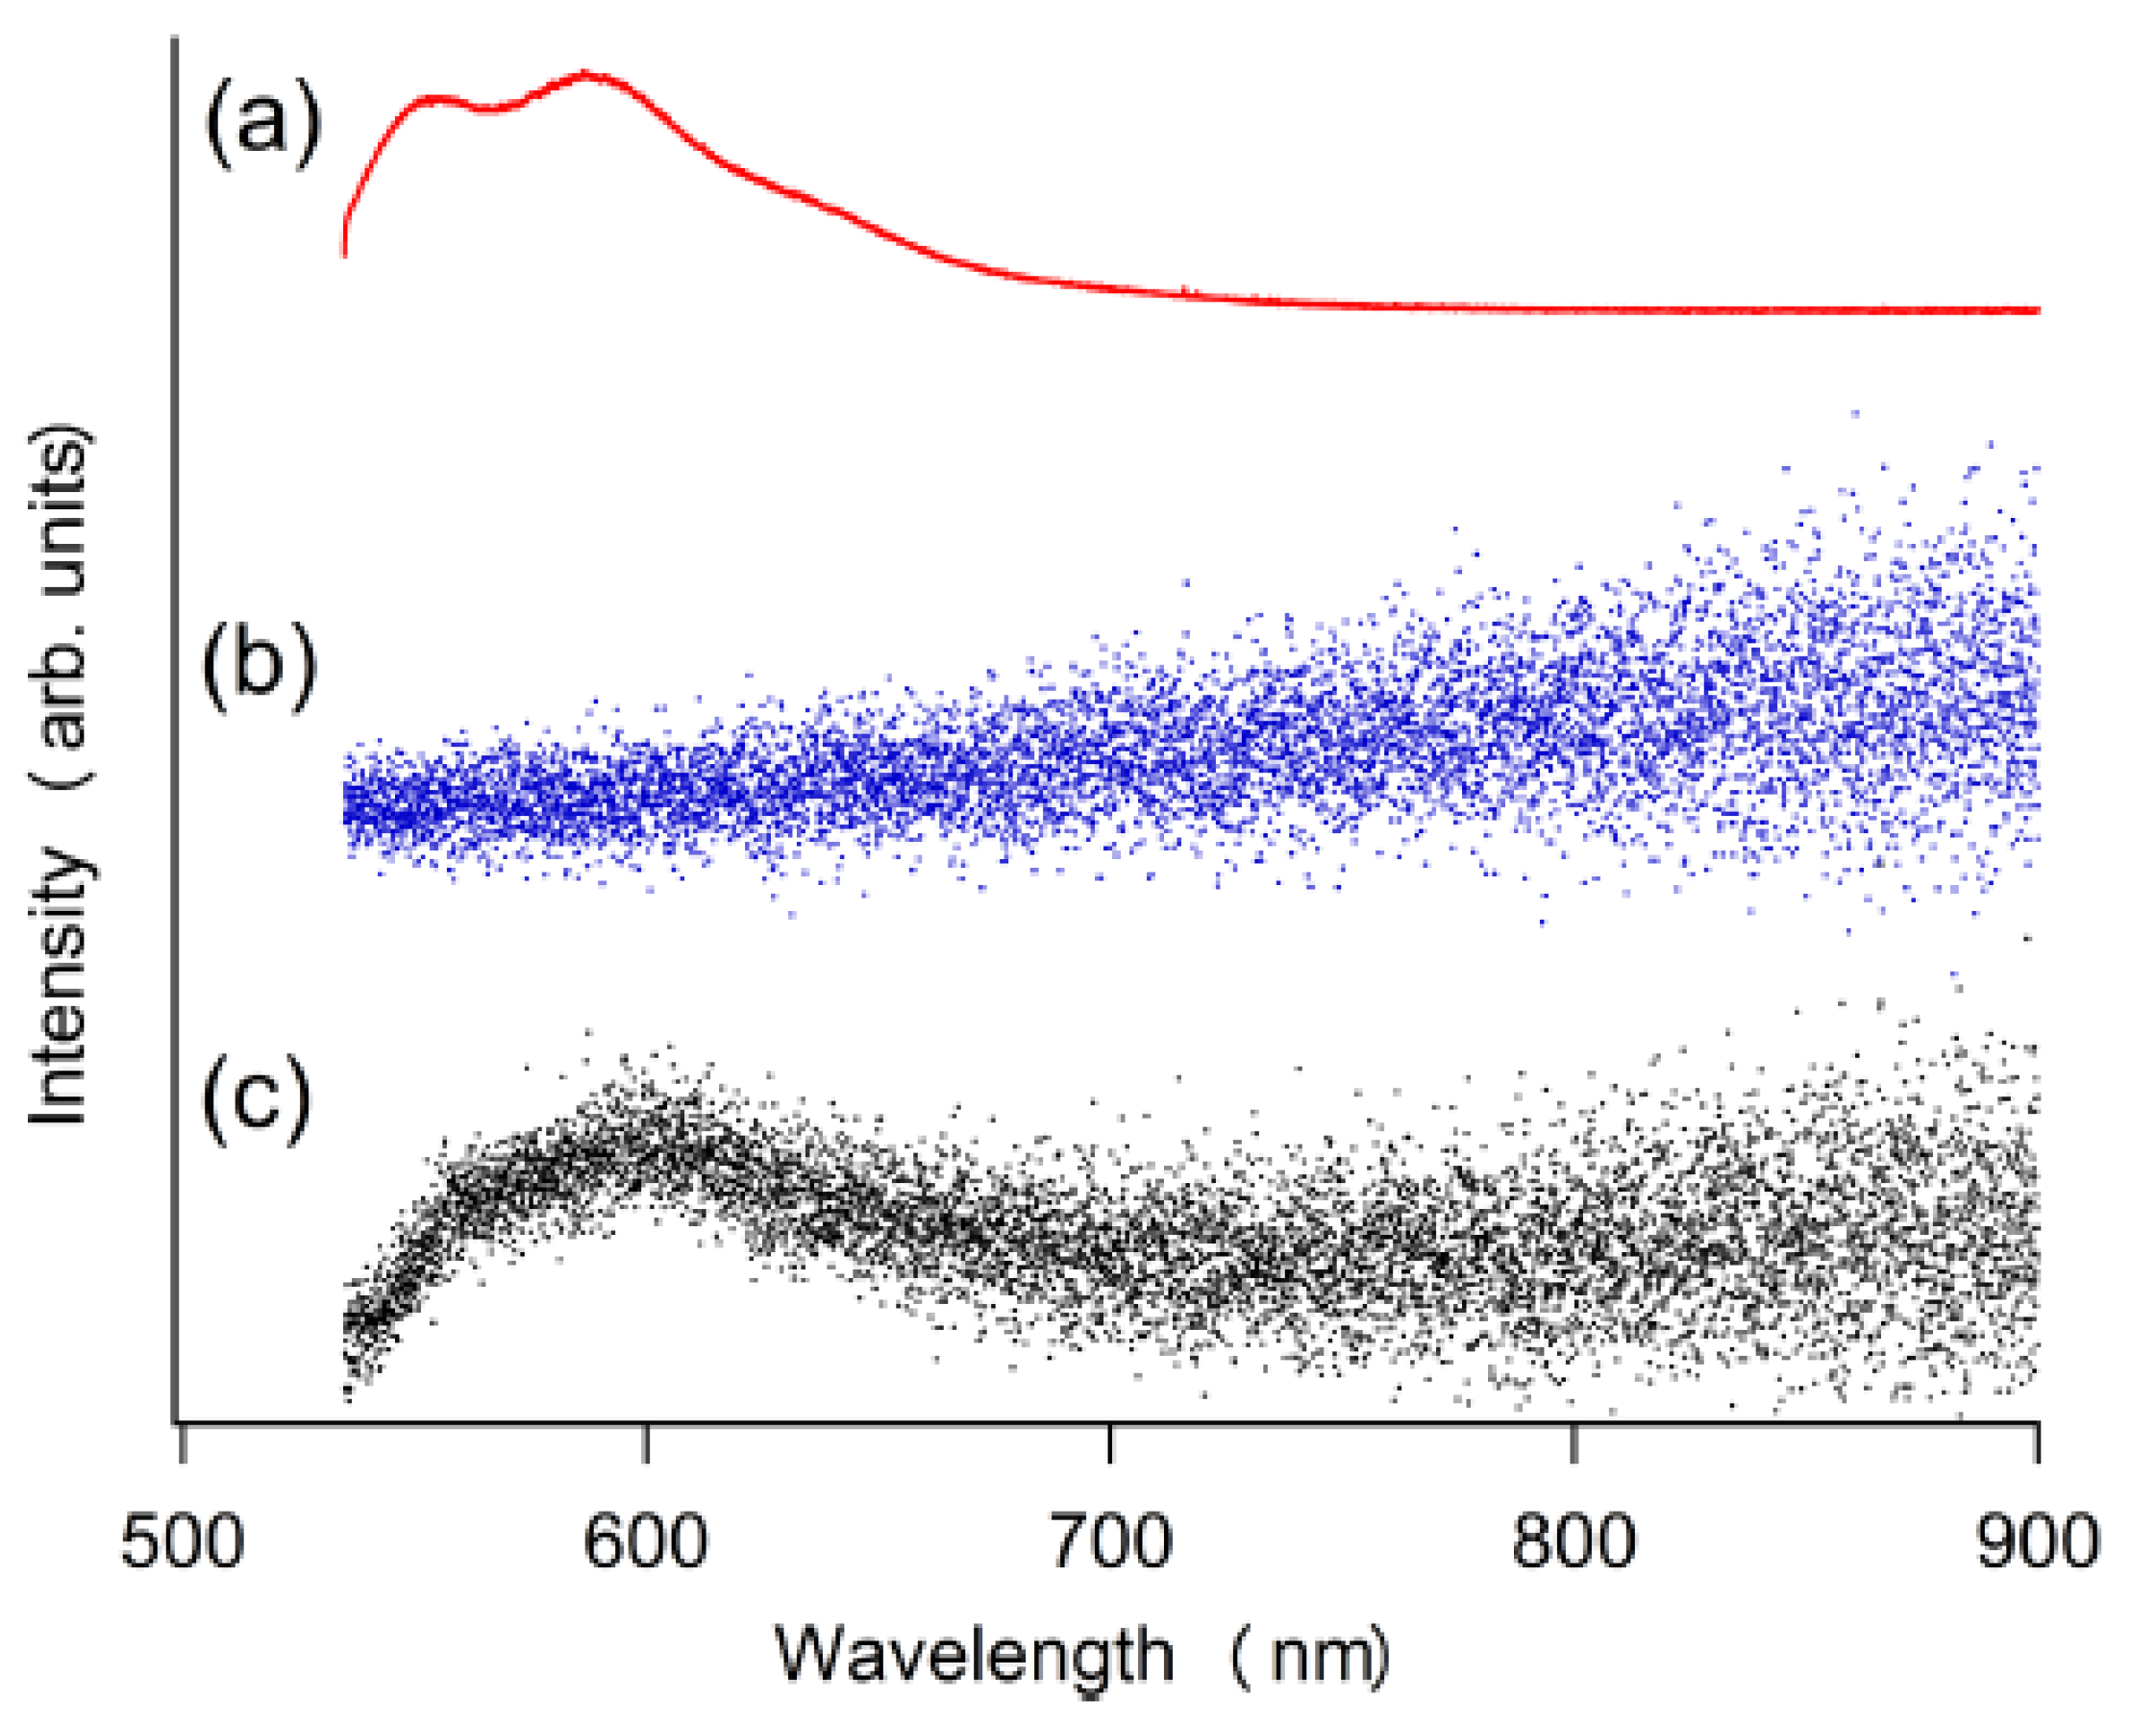
3.2. Chemiluminescence from a Polymer Composite Induced by Water in the Air

Since it is now established that the water vapor can release H2O2 molecules in a quantitative and repeatable manner from sodium percarbonate powder in a vacuum, we fabricated a chemiluminescence detection sheet composed of TCPO and rubrene mixed in PMMA and sodium percarbonate.
Figure 4 shows the optical emission spectrum from the sheet. Figure 4a shows the photoluminescence of rubrene in the sheet as irradiated by the green laser (532 nm), showing the luminescence of rubrene. Figure 4b shows the sheet exposed to the ambient air (23 °C, RH 35%) from which no signal was detected. Figure 4c shows the emission spectrum from the sheet when it was exposed to the vapor of dry methyl carbonate in the ambient air. The luminescence of rubrene was observed. This result indicates that the chemiluminescence does not occur only with exposing the sheet to the water in the ambient atmosphere but becomes observable when the solvent of the polymer coexisted. We consider that the migration of H2O2 to TCPO or excited C2O4 species to rubrene is necessary to induce chemiluminescence. Thus, it is desirable to develop a polymer matrix material that allows the migration of those species for practical measurement by this technique. In Section 3.4, the molecular dynamics simulation results are discussed whether the methyl acetate molecule really enhances the migration of H2O2.

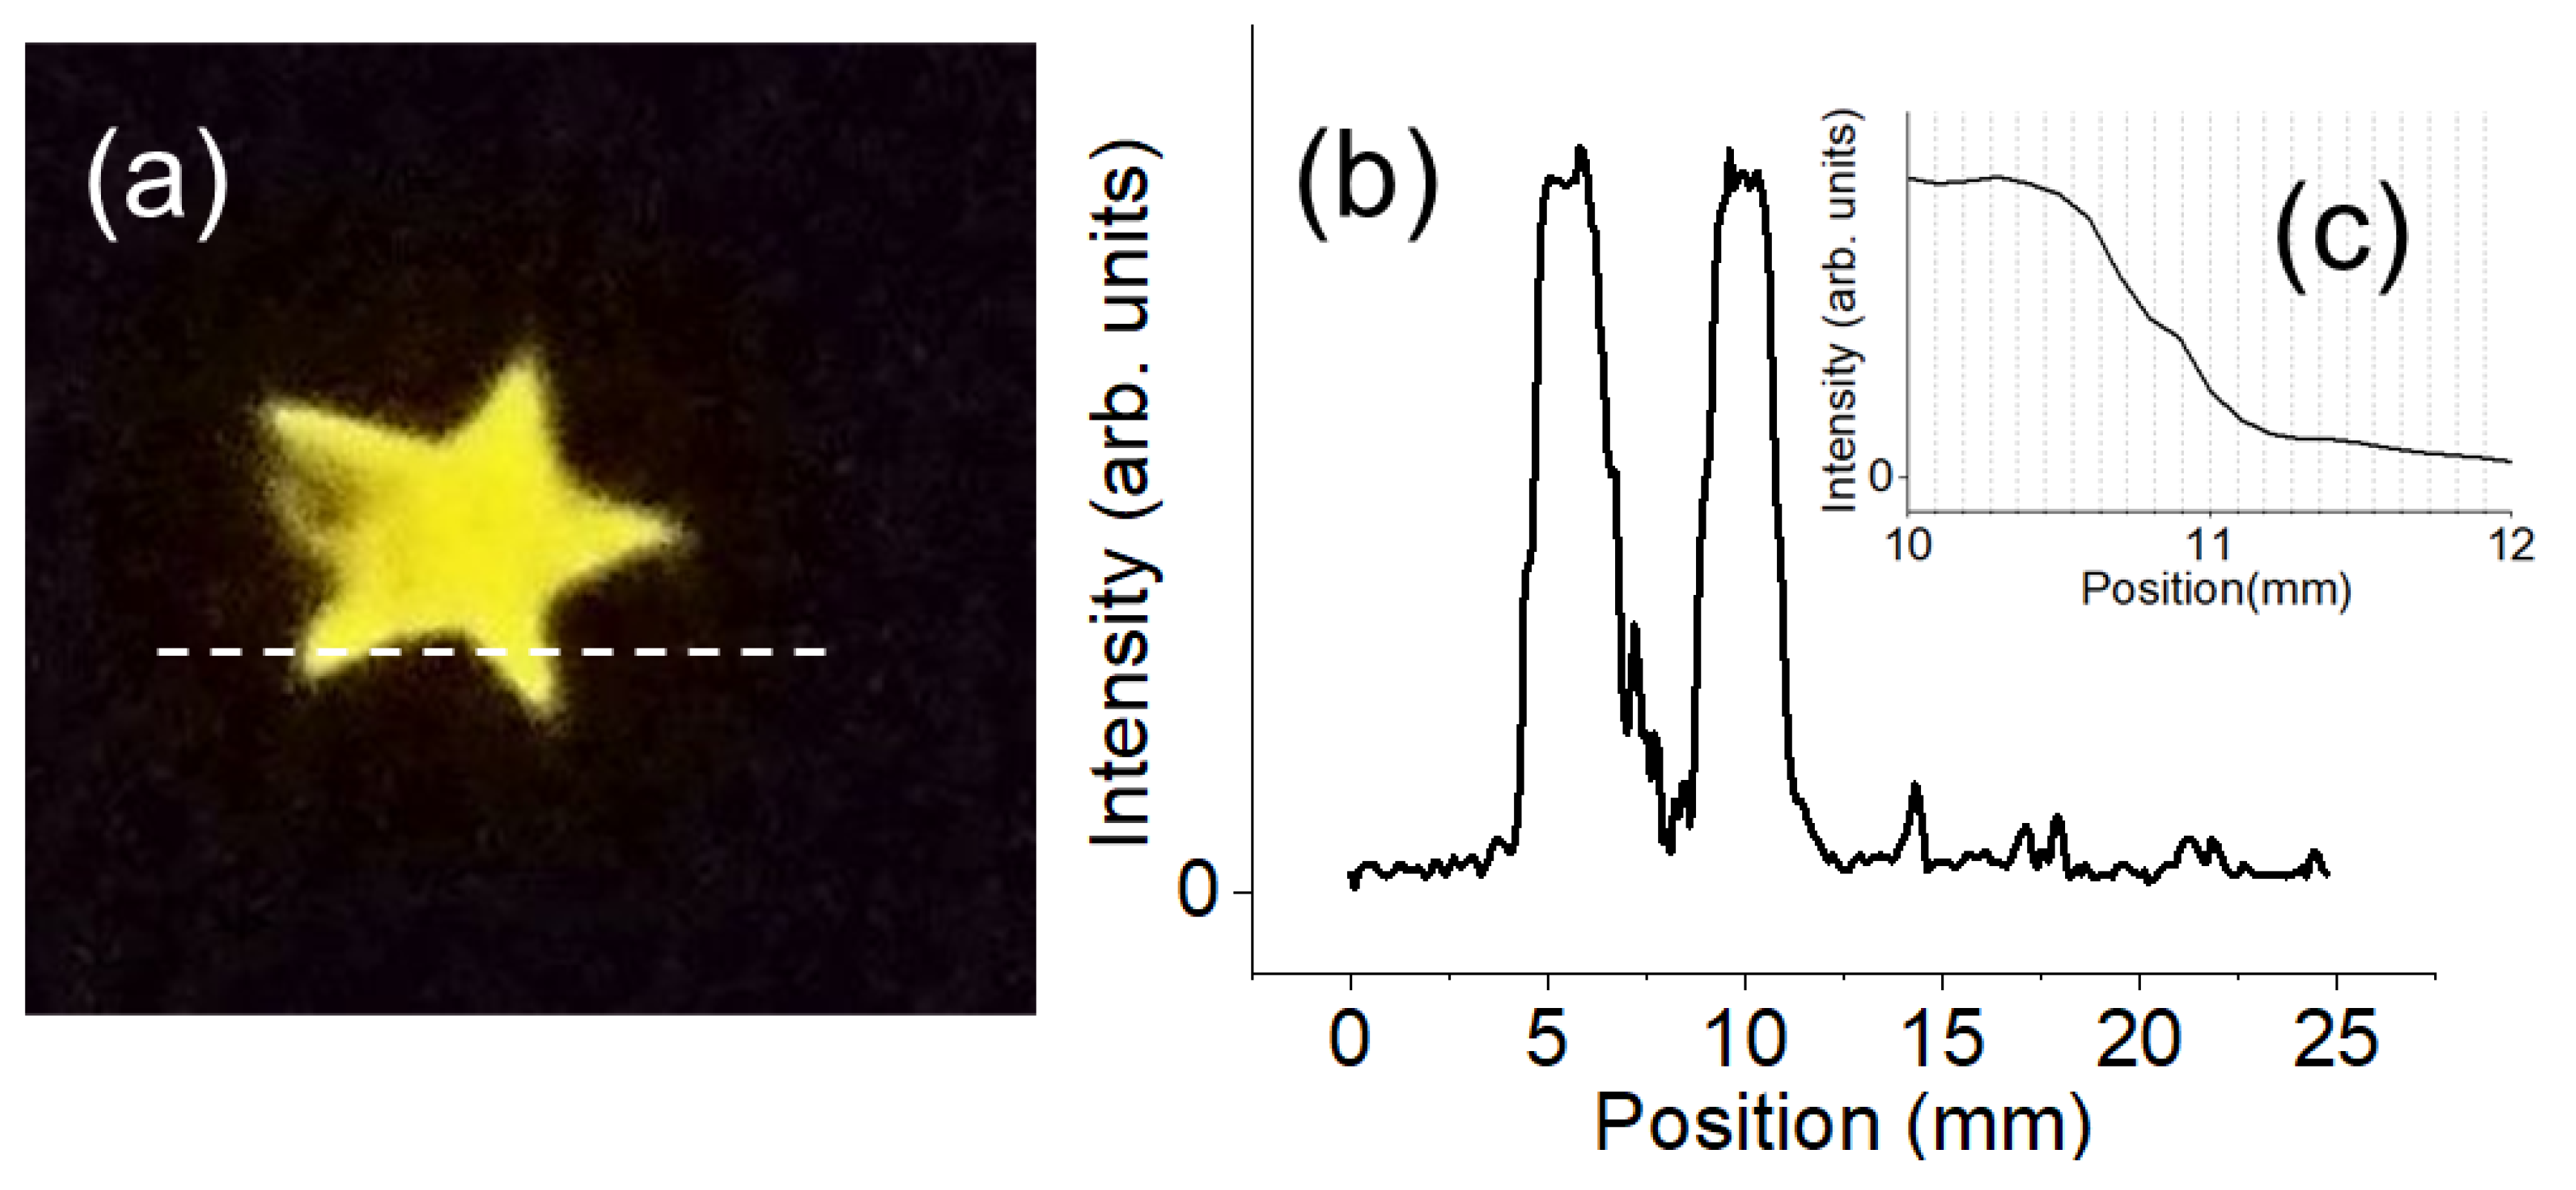
3.3. Demonstration of Position-Sensitive Detection of Water Vapor

The advantage of using optical imaging of chemiluminescence is the ability to position-sensitive detection of failure points/areas of WVTR coatings. We demonstrated it by making a sensor sheet with a transparent barrier and a star-shaped opening. The sensor sheet with the opening was prepared as described in the Section 2.4. The sample was exposed to moisture (40 °C, RH 90%) in the dark while the optical image was recorded with a CMOS camera. Figure 5a shows the image of chemiluminescence caused by moisture. The intensity of the chemiluminescence was strong enough to be observable by the naked eye. The spatial resolution of the water-induced chemiluminescence is ~300 μm as shown in Figure 5b,c. The broadening of the signal probably comes from water molecules diffusing through the thickness of the filter paper substrate (260 μm-thick) which can be improved by designing thinner detection layers.
The difference from the previous section is the use of filter paper and high-water vapor pressure in this experiment. The high concentration of water molecules adsorbed on the filter paper probably mediated the migration of the chemical species involved so that chemiluminescence was easily observed.

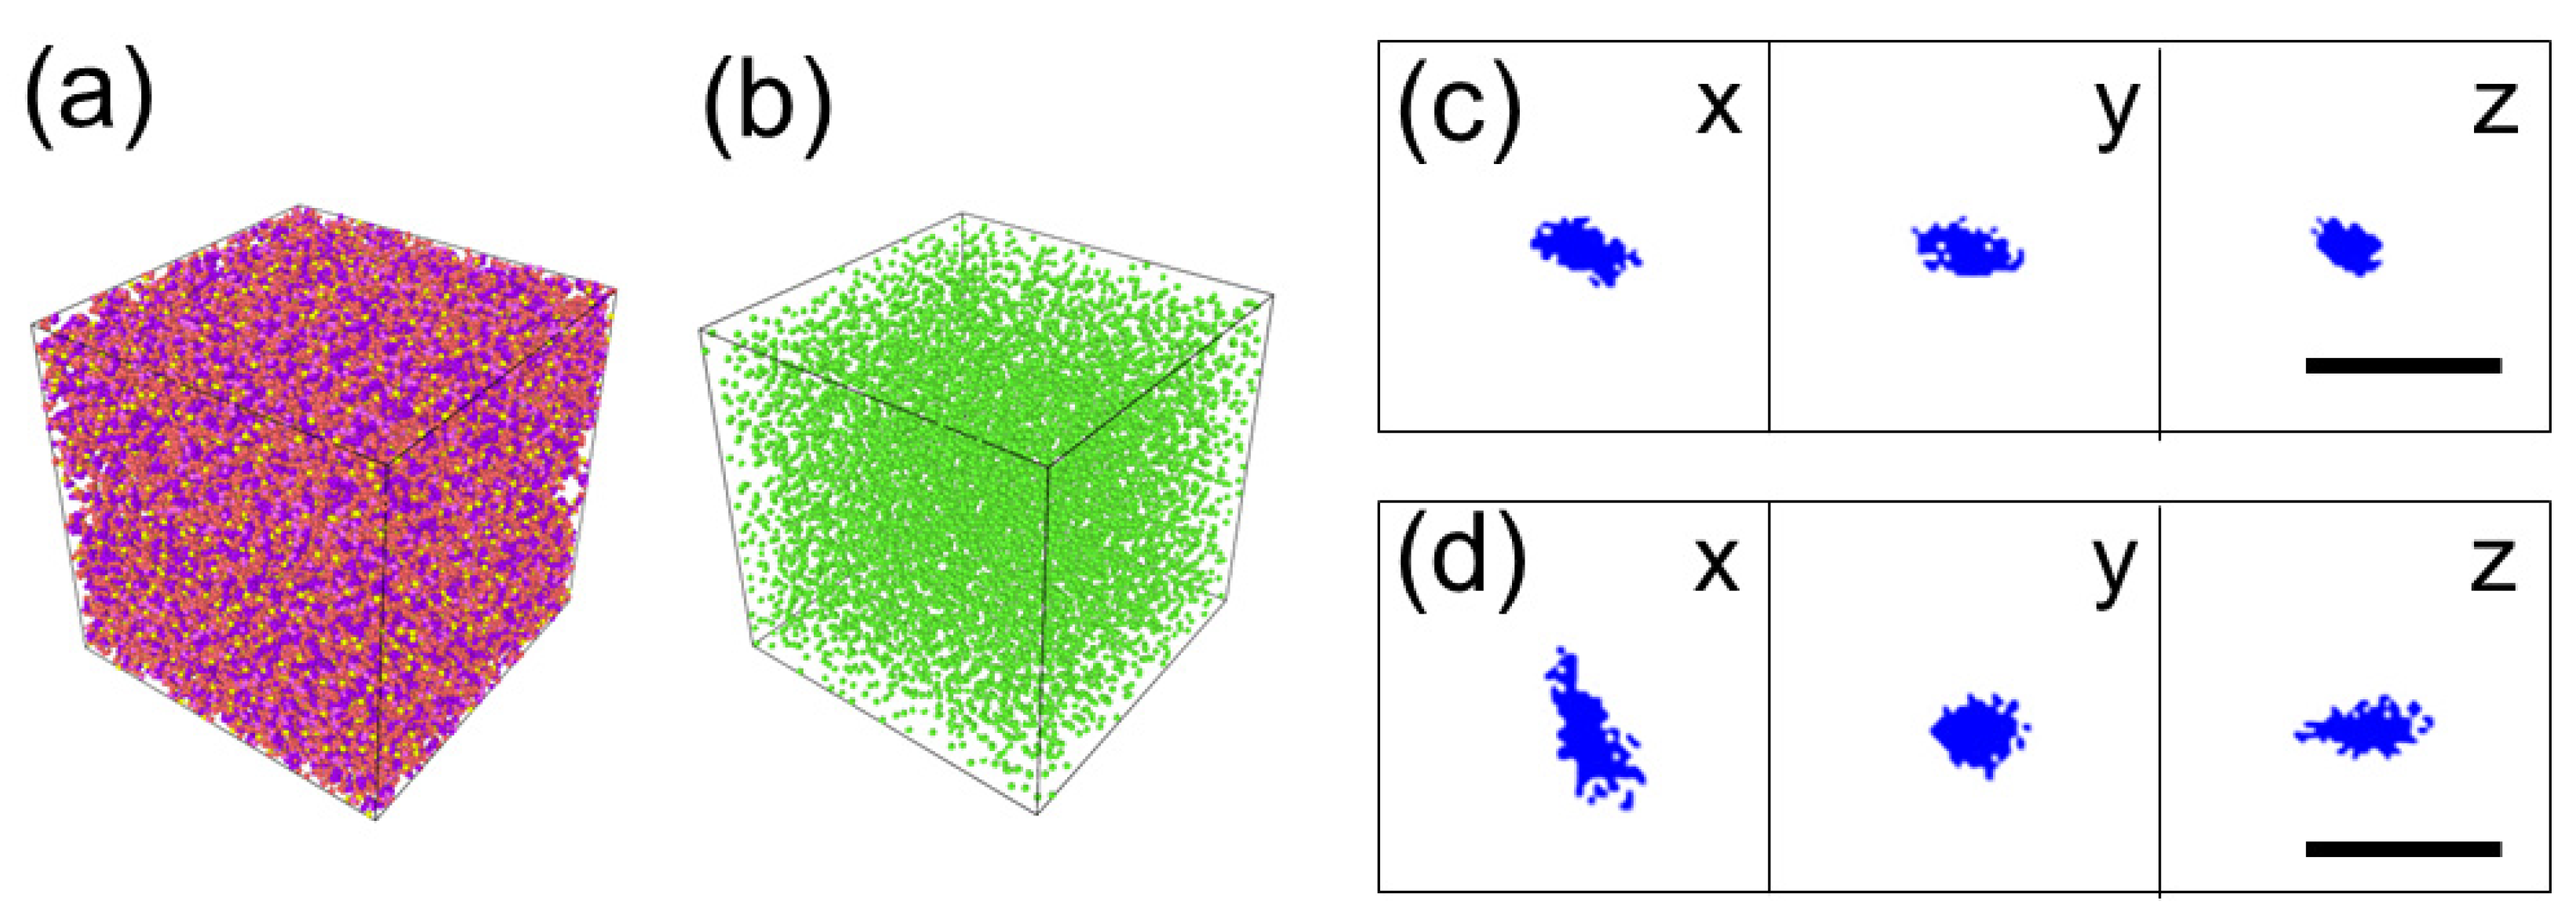
3.4. Molecular Dynamics Simulation

Figure 6 shows the result of molecule dynamics simulations to see the diffusion of an H2O2 molecule in the polymer matrix at 300 K and 1 atm. Figure 6a shows the atomistic particle image of the simulation cell. The size of the cell is 115 Å and 134 Å for the PMMA without and with methyl acetate, respectively. Figure 6b shows the distribution of methyl acetate molecules after equilibration. It indicates that the methyl acetate molecules distribute uniformly. Figure 6c,d show the trajectories of the H2O2 molecule for 30 ps. It is easily seen that the volume containing the trajectory is different. From the calculation, they are 3.0 × 10² Å3 and 9.9 × 10² Å3 for Figure 6c,d, respectively. It indicates that diffusion is enhanced when methyl acetate is mixed. The estimation of the diffusion constant will be given in the Section 3.

4. Discussion

4.1. Discussion on the Experimental Results

In the previous section, we demonstrated the following things. (1) Sodium percarbonate releases H2O2 molecules in a repeated and constant manner when H2O molecules are supplied from the gas phase with a very small pressure of 2 × 10⁻³ Pa that is 1/50,000,000 of atmospheric pressure. This result is promising for highly sensitive detection of WVTR of the gas barrier films. (2) Chemiluminescence can be initiated by water vapor in the environment when the TCPO-rubrene is fixed in PMMA film and sodium percarbonate is attached. The completely cured polymer film does not emit chemiluminescence which indicates the migration of the involved species is necessary. (3) Position-sensitive chemiluminescence induced by exposure to water vapor is possible. Although there are still many hurdles before the practical use, including the shelf life of the prepared detection films, the use of chemiluminescence for water vapor detection will open a way to enable local failure analysis of the gas barrier films, and, in addition, during motion.

4.2. Discussion on the Molecular Dynamics Simulation

As shown in Section 3.4, molecular dynamics simulation has revealed that the addition of the methyl acetate molecules to PMMA enhances the diffusion of H2O2 in the matrix. This is by the experimental observation in Figure 4, in which the chemiluminescence was only observed under the exposure of the sample to the methyl acetate in addition to the moisture in the air. Here, we quantitatively evaluate the effect of methyl acetate in the simulation. From Figure 6c,d, the migration volumes of H2O2 in 30 ps (=t) are calculated to be 3.0 × 10² Å3 (Figure 6c = Vc) and 9.9 × 10² Å3 (Figure 6d = Vd), respectively. If we regard these volumes (V) can be approximated by spheres, the radius (r) of the spheres can be calculated from V = 4πr3/3. The radius corresponding to Vc and Vd are rc = 4.15 Å and rd = 6.18Å, respectively. The concentration of the diffusing particles at the radius of r at time t (C(r,t)) is
C ( r , t ) = 1 ( 4 π D t ) 3 / 2 exp ( r 2 4 D t ) .
If we take C ( r , t ) = 1 / 2 as a contour of the diffusing particle distribution, D can be determined by using r = rc or rd and t = 30 ps mentioned above. The results are Dc = 2.05 × 10⁻¹¹ m2s−1 and Dd = 4.62 × 10⁻¹¹ m2 s−1 for without and with methyl acetate, respectively. These are rather reasonable values as compared with the self-diffusion constants of liquid (D~10−9 m2 s−1 [35]). The question is whether the difference in the diffusion constants is not as large as appearing in the experiment, in which chemiluminescence was not observed without methyl acetate. We consider this point can be explained by considering that our simulation used only 100-mer of PMMA, while the actual PMMA polymer is much longer (>103) which hinders the motion of the molecule. Here, we have confirmed that the molecular dynamics simulation is useful to evaluate the diffusion of H2O2 in polymers and will be effective to search the polymer matrix for making the detection sheet.

4.3. Expected Sensitivity

We have so far confirmed that the chemiluminescence can be initiated by water molecules using the TCPO-rubrene system. It is necessary to examine how high the sensitivity can be using this method and whether it is enough to detect water vapor transmission locally. We make some assumptions: (1) A water molecule initiates the reaction that emits one photon. (2) A pinhole or crack will make a 1 × 10⁻⁵ level increase in WVTR in a sample. (3) The sample size is 63.6 cm2 (9 cm diameter circle). With these assumptions, the photons emitted from the pinhole or crack will be 2.5 × 10¹⁰ photons s−1. There are various types of highly sensitive imaging photodetectors developed for biological [36] or astronomical [37] research. For example, various types of image intensifiers including amorphous semiconductors [38] and microchannel plates (MCP) [39] have been developed to amplify the image signal with high spatial resolution. Photodetectors have been improved to suppress the dark counts down to 0.05 counts/pixel/s [40] and with high sensitivity to other advantages [41,42,43]. The noise has been suppressed by cooling the system containing detectors [37] and used a statistical algorithm [44]. Even their combination in a single device has been developed [45]. The overall sensitivity of a state-of-the-art detector is, for example, 50% quantum yield, conversion of one photon to one electric pulse (photon counting), with 0.05–3 counts/pixel/s noises with 30 mm resolutions or very wide apertures. Therefore, it is rather easy to detect 2.5 × 10¹⁰ photons s−1 of chemiluminescence from a pinhole/crack area with mm or μm scales with a state-of-the-art camera even without an image intensifier. It is, thus, concluded that the present technique will be useful to locally detect the water permeation of a gas barrier film or coatings. If the detection sheet is prepared as a flexible film and closely attached to the sample film, it will be possible to detect water vapor permeation during the bending test. In this work, we have not examined the proportionality of the chemiluminescence intensity and the WVTR values because it is strongly influenced by the distribution of the sodium percarbonate that was used as powders. However, it is safely said that this technique has the advantage of locally detecting the water permeation with high sensitivity which is very important in the practical application of barrier materials.

4.4. Comparison with Currently Available WVTR Measurement Techniques

There are various techniques available for WVTR measurement as explained in the introduction section, and some of them have come to use in industry. The sensitivity is 10−5–10−6 g m−2 day−1 and the acquisition time for one data with enough signal-to-noise ratio is c.a. 1 h which is far from the real-time measurement. It should be noted that this is even after the improvement from classical calcium test or electrochemical detection which required much more time for the measurement or was absolutely impossible for this high-sensitivity measurement.
In the previous section, we have made many assumptions and reached the conclusion that it is possible to locally detect a crack or a pinhole corresponding to 1 × 10⁻⁶ g m−2 day permeation of the water molecules which emits 2.5 × 10⁹ photons s−1. It should be emphasized that the detection can be real time for 2.5 × 10⁹ photons s−1 with a state-of-the-art camera (noise level 0.5 photons pixel−1 s−1). The present chemiluminescence approach surpasses the sensitivity of the techniques currently available by orders of magnitudes. If the water vapor permeation is uniform over the sample, the detection becomes more difficult than in the case of cracks or pinholes. Still, it is possible to evaluate the WVTR with the great difference between the signal and noise (2.5 × 10⁹ and 0.05 photons pixel−1 s−1, respectively) when photodetection is only involved.
With the experience obtained during the current experiments, we have learned that the intensity of chemiluminescence strongly depends on the history of the raw material, especially sodium percarbonate. If the sodium percarbonate has been exposed to ambient conditions for a long time (e.g., one day), water vapor in the air reacts with sodium percarbonate, and H2O2 emission continues for a while. This will make a large background of chemiluminescence. Moreover, the temperature can be a problem because sodium percarbonate releases H2O2 at high temperatures. If we can avoid these problems, the sensitivity of the present technique is much better than other techniques currently available.

4.5. Problems and Challenges

We have found several problems in the application of this method to practical water vapor sensors. One is the need for migration of involved chemical species in the detector film. The migration PMMA polymer-based system without methyl acetate in the ambient condition was not enough (Section 3.2). This problem can be solved by using gel-type matrix material to make the detection sheet which can be screened out by computational search by the molecular dynamics simulations as shown in Section 3.4. Another problem is the short shelf life. The filter paper-type detector (Section 3.3) loses its function in several days even when it is kept in a nitrogen glove box (dew point −20 °C). We consider this to be due to the trace amount of water in the environment, causing the spontaneous chemiluminescence and degradation of the material. Additionally, since it is reported that sodium percarbonate starts decomposition by heating [46,47], spontaneous thermal decomposition to release background H2O2 may be the problem. For the water, tightly sealing from the environment is one way to solve this problem, but it is rather difficult to prevent the effect of the thermal release of H2O2. There are various peroxysolvates [46,47] which contain H2O2 as a crystal solvent. The solution for the latter will be using other peroxosolvates that have higher thermal stability. It is noted that this method uses irreversible chemical reactions and, thus, the device is not reusable. The running costs may become problems.

5. Conclusions

We examined the possibility of detecting water vapor by chemiluminescence. The luminescence from the mixed reagents was observed when exposed to water vapor. We have demonstrated that this technique can be used for the evaluation of water permeation with a spatial resolution, and the sensitivity can be high enough to detect cracks or pinholes causing 10−6 g m−1 day−1 level WVTR. This method opens the way to locally detect the faulty points of water barrier films and observe the failure of barrier films during bending tests.

6. Patents

We have applied for a patent for the present technique.

Author Contributions

Conceptualization, T.S. and Y.N.; experiments, H.N., Y.N. and H.H.; writing, T.S. and H.I. All authors have read and agreed to the published version of the manuscript.

Funding

This research received no external funding.

Institutional Review Board Statement

Not applicable.

Informed Consent Statement

Not applicable.

Data Availability Statement

Not applicable.

Acknowledgments

The molecular dynamics simulation was performed using Research Center for Computational Science, Okazaki, Japan (Project: using a 22-IMS-C088).

Conflicts of Interest

The authors declare no conflict of interest.

References

  1. Burrows, P.E.; Graff, G.L.; Gross, M.E.; Martin, P.M.; Hall, M.; Mast, E.; Bonham, C.C.; Bennett, W.D.; Michalski, L.A.; Weaver, M.S.; et al. Gas permeation and lifetime tests on polymer-based barrier coatings. Proc. SPIE 2001, 4105, 75. [Google Scholar] [CrossRef]
  2. Choi, M.C.; Kim, Y.; Ha, C.S. Polymers for flexible displays: From material selection to device applications. Polym. Sci. 2008, 33, 581. [Google Scholar] [CrossRef]
  3. Jinno, H.; Fukuda, K.; Xu, X.M.; Park, S.; Suzuki, Y.; Koizumi, M.; Yokota, T.; Soaka, I.; Takimiya, K.; Someya, T. Stretchable and waterproof elastomer-coated organic photovoltaics for washable electronic textile applications. Nat. Energy 2017, 2, 780–785. [Google Scholar] [CrossRef]
  4. Mackanic, D.G.; Kao, M.; Bao, Z. Enabling deformable and stretchable batteries. Adv. Energy Mater. 2010, 10, 2001424. [Google Scholar] [CrossRef]
  5. Paetzold, R.; Winnacker, A.; Henseler, D.; Cesari, V.; Heuser, K. Permeation rate measurements by electrical analysis of calcium corrosion. Rev. Sci. Instrum. 2003, 74, 5147–5150. [Google Scholar] [CrossRef]
  6. Carcia, P.F.; McLean, R.S.; Reilly, M.H.; Groner, M.D.; George, S.M. Ca test of Al2O3 gas diffusion barriers grown by atomic layer deposition on polymers. Appl. Phys. Lett. 2006, 89, 031915. [Google Scholar] [CrossRef]
  7. Klumbies, H.; Müller-Meskamp, L.; Mönch, T.; Schubert, S.; Leo, K. The influence of laterally inhomogeneous corrosion on electrical and optical calcium moisture barrier characterization. Rev. Sci. Instrum. 2013, 84, 024103. [Google Scholar] [CrossRef]
  8. Suzuki, A.; Takahagi, H.; Uehigashi, A.; Hara, S. Development of reliable technique for evaluating the properties of water vapor barriers. AIP Adv. 2015, 5, 117204. [Google Scholar] [CrossRef]
  9. Nörenberg, H.; Miyamoto, T.; Tsukahara, Y.; Smith, G.D.W.; Briggs, G.A.D. Mass spectrometric estimation of gas permeation coefficients for thin polymer membrane. Rev. Sci. Intstum. 1999, 70, 2414–2420. [Google Scholar] [CrossRef]
  10. Shimada, T.; Takahashi, Y.; Kanno, T. Highly sensitive and rapid measurement of gas barrier properties of flexible films and sealing resins based on a low temperature trap and mass spectroscopy. Appl. Phys. Exp. 2010, 3, 021701. [Google Scholar] [CrossRef]
  11. Shimada, T.; Yanase, T.; Nagahama, T.; Kanno, T. Estimation of Gas Permeation Characteristics of Ultrahigh Barrier Edge Sealing Materials from Asymptotic Solution of Diffusion Equation. Jpn. J. Appl. Phys. 2013, 52, 05DA12. [Google Scholar] [CrossRef]
  12. Nakano, Y.; Yanase, T.; Nagahama, T.; Yoshida, H.; Shimada, T. Accurate and stable equal-pressure measurements of water vapor transmission rate reaching the 10−6 g m−2 day−1 range. Sci. Rep. 2016, 6, 35408. [Google Scholar] [CrossRef] [PubMed]
  13. Keidel, F.A. Determination of water by direct amperometric measurement. Anal. Chem. 1959, 31, 2043–2048. [Google Scholar] [CrossRef]
  14. O’Keefe, A.; Deacon, D.A.G. Cavity ring-down optical spectrometer for absorption measurements using pulsed laser sources. Rev. Sci. Instrum. 1988, 59, 2544. [Google Scholar] [CrossRef]
  15. Kim, H.; Singh, A.K.; Wang, C.Y.; Fuentes-Hernandez, C.; Kippelen, B.; Graham, S. Experimental investigation of defect-assisted and intrinsic water vapor permeation through ultrabarrier films. Rev. Sci. Instrum. 2016, 87, 033902. [Google Scholar] [CrossRef]
  16. Reese, M.O.; Dameron, A.A.; Kempe, M.D. Quantitative calcium resistivity based method for accurate and scalable water vapor transmission rate measurement. Rev. Sci. Instrum. 2011, 82, 085101. [Google Scholar] [CrossRef]
  17. Bhaskar, S.; Singh, A.K.; Das, P.; Jana, P.; Kanvah, S.; Bhaktha, B.N.S.; Ramamurthy, S.S. Superior resonant nanocavities engineering on the photonic crystal-coupled emission platform for the detection of femtomolar iodide and zeptomolar cortisol. ACS Appl. Mater. Interfaces 2020, 12, 34323. [Google Scholar] [CrossRef]
  18. Xiong, Y.; Shepherd, S.; Tibbs, J.; Bacon, J.; Liu, W.; Akin, L.D.; Ayupova, T.; Bashkar, S.; Cunningham, B.T. Photonic crystal enhanced fluorescence: A review on design strategies and applications. Miromachines 2023, 14, 668. [Google Scholar] [CrossRef]
  19. Hirano, T. Basic chemistry of chemiluminscence and bioluminescence. Chem. Educ. 2016, 64, 376–379. (In Japanese) [Google Scholar]
  20. Nakatsu, T.; Ichiyama, S.; Hiratake, J.; Saldanha, A.; Kobashi, N.; Sakata, K.; Kato, H. Structural basis for the spectral difference in luciferase bioluminescence. Nature 2006, 440, 372–376. [Google Scholar] [CrossRef]
  21. Kaskova, Z.M.; Tsarkova, A.S.; Yampolsky, I.V. 1001 lights: Luciferins, luciferases, their mechanisms of action and applications in chemical analysis, biology and medicine. Chem. Soc. Rev. 2016, 45, 6048–6077. [Google Scholar] [CrossRef] [PubMed]
  22. Inouye, S.; Tsuji, F.I. Aequorea green fluorescent protein-expression of the gene and fluorescence characteristics of the recombinant protein. FeBS Lett. 1994, 341, 277–280. [Google Scholar] [CrossRef] [PubMed]
  23. Albrecht, H.O. Über die Chemiluminescenz des Aminophthalsäurehydrazids. Z. Für Phys. Chem. 1928, 136, 321–330. [Google Scholar] [CrossRef]
  24. Chen, Y.L.; Spiering, A.J.H.; Karthikeyan, S.; Peters, G.W.M.; Meijer, E.W.; Sijbesma, R.P. Mechanically induced chemiluminescence from polymers incorporating a 1,2-dioxetane unit in the main chain. Nat. Chem. 2012, 4, 559–562. [Google Scholar] [CrossRef] [PubMed]
  25. Stevani, C.V.; Silva, S.M.; Baader, W.J. Studies on the mechanism of the excitation step in peroxyoxalate chemiluminescence. Eur. J. Org. Chem. 2000, 24, 4037–4046. [Google Scholar] [CrossRef]
  26. Dodeigne, C.; Thunus, L.; Lejeune, R. Chemiluminescence as diagnostic tool. A review. Talanta 2000, 51, 415–439. [Google Scholar] [CrossRef]
  27. Tanatar, S. Percarbonate. Ber. Dtsch. Chem. Ges. 1899, 32, 1544–1546. [Google Scholar] [CrossRef]
  28. Thompson, A.P.; Aktulga, H.M.; Berger, R.; Bolintineanu, D.S.; Brown, W.M.; Crozier, P.S.; in’t Veld, P.J.; Kohlmeyer, A.; Moore, S.G.; Nguyen, T.D.; et al. LAMMPS-a flexible simulation tool for particle-based materials modeling at the atomic, meso, and continuum scales. Comp. Phys. Comm. 2022, 271, 10817. [Google Scholar] [CrossRef]
  29. Wang, J.; Wolf, R.M.; Caldwell, J.M.; Kollman, P.A.; Case, D.A. Development and testing of a general AMBER force field. J. Comput. Chem. 2004, 25, 1157–1174. [Google Scholar] [CrossRef]
  30. Jewett, A.I.; Stelter, D.; Lambert, J.; Saladi, S.M.; Roscioni, O.M.; Ricci, M.; Autin, L.; Maritan, M.; Bashusqeh, S.M.; Keyes, T.; et al. Moltemplate: A Tool for Coarse-Grained Modeling of Complex Biological Matter and Soft Condensed Matter Physics. J. Mol. Biol. 2021, 433, 166841. [Google Scholar] [CrossRef]
  31. Wang, J.; Wang, W.; Kollman, P.A.; Case, D.A. Automatic atom type and bond type perception in molecular mechanical calculations. J. Mol. Graph. Model. 2006, 25, 247260. [Google Scholar] [CrossRef] [PubMed]
  32. Gaussian 16. Available online: https://www.gaussian.com (accessed on 31 March 2023).
  33. Stukowski, A. Visualization and analysis of atomistic simulation data with OVITO-the Open Visualization Tool. Model. Simul. Mater. Sci. Eng. 2010, 18, 015012. [Google Scholar] [CrossRef]
  34. Ishihara, Y.; Kurihara, S.; Ishihara, S.; Toda, M.; Ohmi, T. Trace moisture adsorption onto various stainless steel surfaces-investigation of adsorption heat and adsorption isotherms. J. Surf. Sci. Jpn. 1997, 18, 557–563. [Google Scholar] [CrossRef]
  35. Weaver, J.H.; Frederikse, H.P.R. CRC Handbook for Chemistry and Physics, 91st ed.; CRC Press: Boca Raton, FL, USA, 2010. [Google Scholar]
  36. Lichtman, J.W.; Conchello, J.A. Fluorescence microscopy. Nat. Methods 2005, 2, 910–919. [Google Scholar] [CrossRef]
  37. Flaugher, B.; Diehl, H.T.; Honscheid, K.; Abbott, T.M.C.; Alvarez, O.; Angstadt, R.; Annis, J.T.; Antonik, M.; Ballester, O.; Beaufore, L.; et al. (The DES collaboration). The Dark Energy Camera. Astron. J. 2015, 150, 150. [Google Scholar] [CrossRef]
  38. Tanioka, K.; Matsubara, T.; Ohkawa, Y.; Miyakawa, K.; Suzuki, S.; Takahata, T.; Egami, N.; Ogusu, K.; Kobayashi, A.; Hirai, T.; et al. Ultra-high-sensitivity new super-HAPR pickup tube and its camera. IEICE Trans. Electron. 2003, E86C, 1790–1795. [Google Scholar]
  39. Sams, B.J. The effect of microchannel plate gain depression on PAPA photon counting cameras. Rev. Sci. Instrum. 1991, 62, 595. [Google Scholar] [CrossRef]
  40. Sinclair, A.G.; Kasevich, M.A. Detector for spatial and temporal imaging of single photons. Rev. Sci. Instrum. 1997, 68, 1657. [Google Scholar] [CrossRef]
  41. Scarcella, C.; Tosi, A.; Villa, F.; Tisa, S.; Zappa, F. Low-noise low-jitter 32-pixels CMOS single-photon avalanche diodes array for single-photon counting from 300 nm to 900 nm. Rev. Sci. Instrum. 2013, 84, 123112. [Google Scholar] [CrossRef]
  42. Arikawa, Y.; Matsubara, S.; Kishimoto, H.; Abe, H.; Sakata, S.; Morace, A.; Mizutani, R.; Nishibata, J.; Yogo, A.; Nakai, M.; et al. A large-aperture high-sensitivity avalanche image intensifier panel. Rev. Sci. Instrum. 2018, 89, 10I128. [Google Scholar] [CrossRef]
  43. Lewis, L.; Baker, S.; Corredor, A.; Fegenbush, L.; Fitzpatrick, Z.; Jones, M.; O’Flarity, K.; Walters, K.; Claus, L.; Sanchez, M. New design yields robust large-area framing camera. Rev. Sci. Instrum. 2021, 92, 083103. [Google Scholar] [CrossRef] [PubMed]
  44. Peter, C.; Johnsen, P.C.; Ryan, S.A.; Gentry, C.; Grafov, A.; Kapteyn, H.; Murnane, M. A beamline for ultrafast extreme ultraviolet magneto-optical spectroscopy in reflection near the shot noise limit. Rev. Sci. Instrum. 2023, 94, 033001. [Google Scholar] [CrossRef]
  45. D’Andrea, V.; Biondi, R.; Ferrari, C.; Ferella, A.D.; Mahlstedt, J.; Pieramico, G. The ABALONE photosensor. J. Instrum. 2022, 17, C01038. [Google Scholar] [CrossRef]
  46. Chernyshov, I.Y.; Vener, M.V.; Prikhodchenko, P.V.; Medvedev, A.G.; Lev, O.; Churakov, A.V. Peroxosolvates: Formation criteria, H2O2 hydrogen bonding, and isomorphism with the corresponding hydrates. Cryst. Growth Des. 2018, 17, 214–220. [Google Scholar] [CrossRef]
  47. Medvedev, A.G.; Churakov, A.V.; Prikhodchenko, P.V.; Lev, O.; Vener, M.V. Crystalline Peroxosolvates: Nature of the Conformer, Hydrogen-Bonded Networks and Clusters, Intermolecular Interactions. Molecules 2021, 26, 26. [Google Scholar] [CrossRef] [PubMed]
Figure 1. Chemiluminescence from TCPO initiated by H2O2. Rubrene is added to make the visible light (orange color) emission. Asterisk indicates that the species are in excited states.
Chemosensors 11 00284 g001
Figure 2. Experimental setup for measuring the release of H2O2 molecules from sodium percarbonate by water exposure. V1: Variable leak valve. V2: Stop valve. QMS: Quadrupole mass spectrometer. TMP: Turbomolecular pump. RP: Rotary pump.
Chemosensors 11 00284 g002
Figure 3. Total pressure (red, left axis) and QMS reading (blue, arbitrary units) of (a) H2O (18 AMU) and (b) H2O2 (34 AMU). QMS reading is scaled to compare with the total pressure. “OPEN” and “CLOSE” indicate the status of the stop valve V2. The opening of the variable leak valve V1 was adjusted in advance and kept constant.
Chemosensors 11 00284 g003
Figure 4. Luminescence of TCPO-rubrene in PMMA sheet coated with sodium percarbonate. (a) Fluorescence of rubrene excited by a 532 nm laser. (b) sheet exposed to ambient air (23 °C, RH 35%). (c) sheet exposed to dry methyl acetate vapor in the ambient air (23 °C, RH 35%). RH stands for relative humidity.
Chemosensors 11 00284 g004
Figure 5. (a) Optical image of moisture-induced chemiluminescence at the star-shaped opening of the detection sheet. Dashed line indicates the line for intensity profile. (b) Line profile (dashed line in (a)) of the luminescence intensity. (c) Magnification of (b). The half-width of the decay length is ~0.3 mm.
Chemosensors 11 00284 g005
Figure 6. Results of molecular dynamics simulation of one H2O2 molecule in PMMA without or with methyl acetate. (a) Atomistic image of simulation cell with periodic boundary condition. The cell contains 1.3–1.6 × 10⁵ atoms. The unit cell size is (115–134 A)3. (b) Distribution of methyl acetate molecules when they are mixed. (c) The trajectory of the H2 O2 molecule without methyl acetate for 30ps seen from the x, y, and z directions. (d) The trajectory of the H2O2 molecule with methyl acetate for the 30 ps seen from the x, y, and z directions.
Chemosensors 11 00284 g006
Disclaimer/Publisher’s Note: The statements, opinions and data contained in all publications are solely those of the individual author(s) and contributor(s) and not of MDPI and/or the editor(s). MDPI and/or the editor(s) disclaim responsibility for any injury to people or property resulting from any ideas, methods, instructions or products referred to in the content.

