Article

3D-Printed Hydrodynamic Focusing Lab-on-a-Chip Device for Impedance Flow Particle Analysis

Nanobioelectronics Laboratory, Department of Biomedical Engineering, Ilse Katz Institute of Nanoscale Science and Technology, Ben-Gurion University of the Negev, Beer-Sheva 8410501, Israel
*
Author to whom correspondence should be addressed.
Chemosensors 2023, 11(5), 283; https://doi.org/10.3390/chemosensors11050283
Submission received: 13 March 2023 / Revised: 27 April 2023 / Accepted: 6 May 2023 / Published: 8 May 2023
(This article belongs to the Special Issue Electrochemical Impedance Spectroscopy (EIS): Biosensing Applications)

Abstract

:
Particles analysis, such as cell counting and differentiation, are widely used for the diagnosis and monitoring of several medical conditions, such as during inflammation. Three-dimensional-printed lab-on-a-chip (LOC) devices, which can utilize one of the cell counting methods, can bring this technology to remote locations through its cost-efficient advantages and easy handling. We present a three-dimensional-printed LOC device with integrated electrodes. To overcome the limited resolution of a 3D printer, we utilized a flow-focusing design. We modeled and simulated the mass transfer and flow dynamics in the LOC by incorporating a flow-focusing design and reached an optimal channel diameter of 0.5 mm, resulting in a flow-focusing distance of <60 µm. We also used electrochemical impedance spectroscopy to enable the dependence of the electrode–solution interface on the flow-focusing properties. Finally, we highlighted the proof-of-concept detection of microspheres (6 µm diameter), which model biological cells that flow in the channel, by recording the electrochemical impedance at 10 kHz, thus showing the potential of a future point-of-care (POC) device.

1. Introduction

Impedance cytometry is widely used in cell counting and differentiation due to its noninvasive and label-free properties. This method is easy to use and enables flexibility in its design and fabrication. By applying an alternating current (AC) impedance to a known volume with a different frequency of the applied potential, cells can be differentiated by size and type [1,2]. For example, Berkel et al. [3] proposed a microfluidic LOC based on a flow cytometry technique that enables the counting and differentiation of three types of white blood cells (WBCs). Furthermore, Hassan et al. [4] proposed an LOC for T-cell counting at POC by targeting raw whole blood samples. An interesting addition to this technology is to utilize hydrodynamic focusing, which can be used to control the aperture size while maintaining the larger physical channel diameter, thus avoiding clogging, as well as increasing the sensitivity [2]. Importantly, hydrodynamic-focusing-based impedance flow cytometry with LOC provides a promising advancement in translating benchtop methods to the POC [5]. Chien et al. analyzed the single-cell dielectric properties at microwave frequencies [6] and Liang et al. demonstrated microfluidic platforms integrated with optical, acoustic, or magnetic forces for cell counting and detecting methods using optofluidics and acoustofluidics [7,8]. Several reviews discussed the advantages of microfluidic flow cytometry: Cheung et al. [9] reviewed microfluidic impedance-based flow cytometry for analyzing cells and particles, Yan et al. [10] reviewed the continuous microfluidic 3D focusing devices on microflow cytometry for single-cell analysis, and Honrado et al. [11] reviewed the recent updates on single-cell microfluidic impedance cytometry by explaining the generation of raw signals to cell phenotypes using data analytics. Unfortunately, manufacturing these miniaturized devices requires expensive materials and tools (such as glass wafers, photoresists, and metal evaporators) [12], making it costly to import prepared devices or to manufacture devices locally; hence, such an advancement is usually unrealistic for use in developing countries.
However, low-cost three-dimensional (3D) printing (such as fused filament fabrication—FFF) has emerged as a powerful tool for research by enabling rapid and low-cost automatic manufacturing. Moreover, this new technology can overcome the current limitations of the LOC systems in developing countries because they are based on a low-cost, one-step manufacturing process [12,13], making this technology optimal for rapid and low-cost manufacturing in these countries. The most established technologies for 3D printing are fused deposition modeling (FDM), stereolithography (SLA), and selective laser sintering (SLS). Among these technologies, FDM is the most widely used form of 3D printing at the consumer level, fueled by the emergence of hobbyist 3D printers. FDM works with a wide range of standard thermoplastics, such as ABS, PLA, and their various combinations. The technique is well suited for basic proof-of-concept models, as well as quick and low-cost prototyping of simple parts, such as parts that might typically be machined. The drawback of SLA technology lies in its average build volume and sensitivity to long exposure to UV light; for SLS, its rough surface finish and limited material options are disadvantages. FDM technology is the most cost-effective technology in terms of instrument cost (the instrument price starts at USD 2000, USD 3500, and USD 10,000 for FDM, SLA, and SLS, respectively) as well as material cost (USD 50–100 per kg for FDM, USD 149–200 per L for SLA, and USD 100 per L for SLS) [14]. Recently, Mir et al. [15] developed a low-cost capillary-based flow cell for flow cytometry, which costs USD 100.
Three-dimensional printing using low-cost technologies has been used to fabricate LOC systems for biological material manipulation and analysis. For example, Jue et al. built and validated a 3D-printed device to accurately meter and lyse human urine samples for use in downstream nucleic acid amplification [16]. The results confirmed that there was no statistically significant difference between samples metered and mixed using the standard protocol and those prepared with the meter–mix device. This indicates that the 3D-printed device could accurately meter, mix, and dispense a human urine sample without the loss of nucleic acids. However, 3D-printing technology has its limitations, primarily its limited resolution and the need to optimize it before using it in biological applications [12]. Several examples for utilizing 3D printing for cell analysis include the following: Bishop et al. devised a 3D-printed fluidic device using stereolithography (SLA) technology and incorporated electrodes for electrochemiluminescence-based detection [17], Hampson et al. demonstrated a 3D-printed flow-focusing-based fluidic device using SLA technology for optical detection of particles [18], Durate et al. fabricated a 3D-printed fluidic device using FDM technology for contactless detection of bacteria in oil–water phase droplets [19], de C. Costa et al. revealed an SLA-based 3D-printed fluidic device for electrochemical detection [20], and Wang et al. analyzed micrometer-sized particles and manipulated mammalian cells [21]. Despite these works, a low-cost FDM 3D-printed fluidic device integrated with electrodes for label-free electrochemical impedance analysis of particles that is integrated with flow-focusing module has not yet been demonstrated.
Here, a low-cost impedance flow cytometry device was developed by manufacturing it with FDM. Moreover, to overcome the resolution limitation, the device was integrated with a hydrodynamic flow-focusing module [22] that can control and focus the cells into a micrometer-wide stream (Figure 1). Furthermore, a microfluidic device with three channels was simulated. Here, the channels consisted of a main channel to contain the measured analyte and two side channels that create a sheath flow to focus the main channel flow. From the simulation analysis, the required channel diameter was 0.5 mm, to reach the set goal of <60 µm. Regarding the simulation results, the design was created, and it 3D-printed a microfluidic device that incorporates three 0.5 mm diameter channels. The results were validated with a colored solution; the main channel flow color width was 59.5 µm, thus confirming the results of the device and the simulation. Furthermore, electrochemical impedance spectroscopy (EIS) of the device was measured; the results indicated that the frequencies that were expected to be influenced by the passing of spheres were higher. These results showed the potential of easy-to-produce, inexpensive, and fast microfluidic devices that can be brought to the POC in developing countries by adjusting them to the local demands.

2. Materials and Methods

2.1. Chemicals and Materials

The following chemicals were used without further extra purification steps: disodium hydrogen phosphate dihydrate (≥99.5% purity, Merck, Darmstadt, Germany), sodium chloride (≥99.5% purity, Merck, Darmstadt, Germany), potassium hexacyanoferrate(II) trihydrate (“Ferrocyanide,” 99.0–102.0% purity, Merck, Darmstadt, Germany), potassium hexacyanoferrate(III) (“Ferricyanide,” ≥99.0% purity, Merck, Darmstadt, Germany), potassium chloride (99.0–100.5%, Alfa Aesar, Hyderabad, India), potassium dihydrogen phosphate (≥98% purity, Alfa Aesar, Yehud, Israel), polystyrene spheres 6.0 µm (2.5% solids w/v, 2.10 × 10⁸ particles/mL, Polysciences, Inc., Warrington, PA, USA), red food coloring liquid (water, propylene glycol, sodium benzoate, Ponceau 4R, ALEH CANDIES, Israel), blue food coloring liquid (water, propylene glycol, sodium benzoate, and Brilliant Blue FCF, ALEH CANDIES, Beit Shemesh, Israel). Ultrapure (>18 MΩ) deionized water (DI) was obtained from a Super Q water system (Millipore system, Thermo Scientific, Waltham, MA, USA).

2.2. Model and Simulation of the Hydrodynamic Flow-Focusing Cytometry Device

Hydrodynamic focusing relies on laminar flow in microfluidics, wherein a sample flow (Qs) is focused by introducing additional sheath flow (Qf). For impedance cytometry, its potential utility becomes apparent when considering nonelectrochemically active sheath fluids. The sheath flow decreases the effective electrical interaction volume by providing a virtual aperture (VA). Decreasing the diameter of the aperture improves sensitivity in the impedance signal ( Δ Z ) in cases of sphere flow, since it can limit the number of objects exceeding the interaction volume. Furthermore, the VA is inherently more versatile, since it can be adjusted by changing the ratio between Qs and Qf. Additionally, a virtual, rather than a physical, aperture limits the danger of clogging [23]. We created a numerical model (COMSOL™ Multiphysics, version 5.3, COMSOL, Stockholm, Sweden), as shown in Figure 2A. The mesh is a 2D model consisting of 1 main channel and 2 side channels that are joined to form a single channel. The Naiver–Stokes equation (Equation (1)) [24] was used to solve the model:
ρ u t + u u = p + · μ u + u T 2 3 μ u I + F
where u (m/s) is the fluid velocity, p (Pa) is the fluid pressure, ρ (kg/m3) is the fluid density, μ (Pa/s) is the fluid dynamic viscosity, and F (N) is the external forces applied to the fluid. The simulation consisted of the main channel, which focused on two side channels; the focused flow goal value was set to 60 μm, since it is equivalent to three times the size of the largest white blood cell type (monocyte) [25]. The required constants for the simulation equations were chosen according to known values from the literature; they are ρ = 1000 kg/m3, μ = 0.003 Pa/s, T = 293.15 K, and D = 1.21 × 10⁻¹⁴ m2/s. We calculated the diffusion coefficient (D) according to the Stokes–Einstein equation (Equation (2)):
D = k T 6 π μ r
where k is the Boltzmann constant and r is the radius of the particles, which was set to 6 μm. The radius was chosen according to the available microspheres that will simulate the WBC. The simulation was conducted in a two-dimensional model by removing the redundant Z-axis (initial conditions: pout = 0 Pa; Qin = 9 µL/min). The general mesh structure of the model is shown in Figure 2A. The main channel was set up to contain a 1 mol/m3 concentration of a diluted species, whereas the side channels were set up to have a 0 mol/m3 concentration. The mesh size of the model was set up to have a maximum size of 0.05 mm, and its minimal element size was set to 8 × 10⁻⁴ mm. The simulation was applied with a 9 µL/min flow rate in all the channels. We simulated different channel (center and side channels) diameters (5, 1, and 0.5 mm) and calculated 95% of the maximum concentration values to calculate the focusing width.

2.3. 3D-Printing and Assembly of the Hydrodynamic Flow-Focusing, Impedance Cytometry Device

SOLIDWORKS 2018 (Dassault Systèmes SolidWorks Corporation, Waltham, MA, USA) software was used to draw the design of the hydrodynamic flow-focusing cytometer (Figure 3A). The device’s general size (length, width, and thickness) was designed to match the microfluidic connector (4-way Linear Connector, Dolomite Ltd., London, UK). The schematic diagram that illustrates the manufacturing of the 3D-printed chip is shown in Figure 2. The designed device was 3D-printed (Fluidic Factory, Dolomite Ltd., London, UK, Figure 2B) with a cyclic olefin copolymer (COC, Dolomite Ltd.) and the following parameters: The nozzle temperature affects the liquidity of the extracted filament and a higher temperature yields better resolution; however, a temperature that is too high can cause dripping. The temperature was set to 225 °C. The bed temperature affects the adhesiveness between the printed layers and was set to 80 °C. The printing speed affects the layer thickness; fast printing results in thicker layers (fewer layers per print) and slow (“fine”) printing results in thinner layers (more layers per print). Both printing speeds were tested with the same printing model and were moved to the next step using the fast-printing method, since it resulted in better optical clarity due to a lower number of layers, which will decrease the positioning variance of each layer (Figure 2C). To enable measuring electrochemical signals in the 3D-printed device, two conductive metal rods were inserted into the designated sockets and were sealed using epoxy glue. The cost for fabricating one chip costs USD 12, which is lower compared with the commercially available chips [26] and the already existing technologies [15,27].

2.4. Optical Validation of the Flow-Focusing Function in the 3D-Printed Device

The flow-focusing function in the 3D-printed device was tested by using a syringe pump (model number 55-2316, Harvard Apparatus Ltd., Holliston, MA, USA) to flow (9 μL/min) different food coloring liquids, and an optical microscope (SMZ-1000 Nikon microscope (Tokyo, Japan)) and Invenio 5SIII camera (Reading, UK) was used to record the flow in the channel. The images were captured (resolution: 2560 × 1922 pixels, size: 2.2 µm × 2.2 µm) and processed using MATLAB R2017a (pixel intensity tools) to determine its channel concentration. The image process was as follows: two pictures of the same location were taken by the microscope: one before the colored fluid flow to act as a background image and one during the experiment. The background image was subtracted from the experiment’s image to reduce background effects. Then, an area of interest was cut from the image and transformed into a grayscale image. Next, the contrast was adjusted, and the adjusted area of interest was then averaged horizontally to reduce noise. This resulted in a single column data line that contained the average profile over the area of interest. The data were normalized, smoothed, and the 95% maximum pixel intensity was calculated, along with the vertical distance between the two data points. The distance is the focus width that corresponds to the simulation. By examining the pixel intensity values of the main channel’s color, the 95% highest pixel intensity was compared with the 95% highest concentration to determine the focused flow width.

2.5. Electrochemical Impedance Spectroscopy Characterization

The signals were measured and recorded with a VSP300 potentiostat, Bio-Logic Ltd., Seyssinet-Pariset, France and EC-Lab software 11.31, where the “potentio electrochemical impedance spectroscopy” (PEIS) technique was chosen. The parameters of the PEIS technique were as follows: amplitude = 25 mV, finitial = 2 MHz, ffinal = 100 mHz, Erange = −10 V to 10 V, Na (measures per frequency) = 4. A 10 mM phosphate buffer saline (PBS) solution containing 5 mM ferrocyanide and 5 mM ferricyanide was flowed in the main channel and a 10 mM PBS solution at pH 7.4 was flowed in the focusing channels. The main channel velocity (Vin) was set to 1, 3, 5, 7, or 9 μL/min, and the focusing channels (Vout) remained at 1 μL/min. To fit an electrical model to the Nyquist plot, the Z-fit tool in EC-Lab 11.31 software was used. The fitting was inspired by a Randles cell and was modified according to the lowest standard deviation of each component and the whole model.
To record the electrochemical signals generated from microspheres flowing in the 3D-printed device, the main channel was flowed with a PBS solution containing 10.9% (w/v) sucrose and 6 µm microspheres, and the focusing channels were flowed with a PBS solution containing 10.9% (w/v) sucrose. The flow rate was set to 9 µL/min for both the center and the side channels. The electrochemical signals were measured using the technique “potentio electrochemical impedance spectroscopy wait” (PEISW) with the following parameters: amplitude = 25 mV, f = 10 kHz, Erange = −10 V to 10 V, Na (measures per frequency) = 4, and time = 3600 s.
As a control measurement, the main channel was flowed with a PBS solution containing 10.9% (w/v) sucrose without microspheres. Since the control measurements had higher impedance signals, the results were normalized as follows: the mean was subtracted and then each measurement was divided by its own maximum value, and then fit to a quadratic equation to flatten the signal.

3. Results and Discussion

3.1. Simulated Concentration Profiles in the 3D-Printed LOC

The relationship between the concentration of the particles and the location across the channel for three different channel widths (i.e., 0.5, 1, and 5 mm) was simulated. The cross-sectional concentration profiles for each channel width at the location x = 29 mm along the channel are shown in Figure 3. Figure 3C–E shows that the species concentration, denoted in red, originates from the main channel as expected. Moreover, a laminar flow continues after the intersection with the stream without the species in the side channels (denoted in blue). In Figure 3F–H, the species concentration profile is represented by 95% concentration points and the determined focused flow accordingly. The simulation resulted in 95% focused flow values of 1196, 136, and 59.5 µm for 5, 1, and 0.5 mm width channels, respectively. From these results, the focused flow aperture decreases as the channel diameter decreases. Furthermore, the concentration profile curves are Gaussian shaped due to the existing diffusion process [28]. The Reynold’s number (Re) was also calculated for the channel cross-section and Re < 10−3 was found for all the channels, indicating a laminar flow as expected [29].
A linear regression analysis was performed to calculate the relationship between the flow-focusing aperture and the channel width (Figure 4A). This analysis resulted in a linear fit with a relationship coefficient of 257 ± 10.6 µm/mm (R2 = 0.997). However, although the simulation resulted in ideal flow conditions, the 3D-printed prototype can still show a saturation effect for smaller channel diameters because the diffusion will overcome the laminarity for specific parameters, namely, the flow rate and diffusion coefficient. By using the simulation results, a channel width of 0.5 mm, which will produce a 50 µm focusing aperture, was used. Unfortunately, the horizontal filament lines could not have been avoided entirely and, as a result, they may have disrupted the image processing due to a slight change in the transparency. Nonetheless, the tested flow focusing corresponded well with the simulation flow-focusing results and can support our approximation of the image-processing method to the main channel particle concentration.

3.2. Flow-Focusing Validation in the 3D-Printed LOC

The flow-focusing LOC was 3D-printed with a 0.5 mm wide center channel to test the simulation results. The flow-focusing function was tested by flowing two different colored fluids: red for the center channel and blue for the side channels (Figure 4B,C). Although the horizontal lines resulting from the printing direction interfere with the clarity of the image at specific locations, a clear focusing effect can be observed by the narrow-centered red flow due to the two blue side flows. A clear two-phase interface between the two-colored flows indicates the presence of a laminar flow. The captured images were processed to extract the cross-sectional red intensity profile across the middle channel (Figure 4D). The 95% intensity width, calculated from the image, was 59.5 μm, which is 9.5 µm wider than the corresponding simulation (the main channel diameter is 0.5 mm) results (50 μm). Such similarity demonstrated the ability of the model to simulate the flow-focusing function in the 3D-printed LOC.

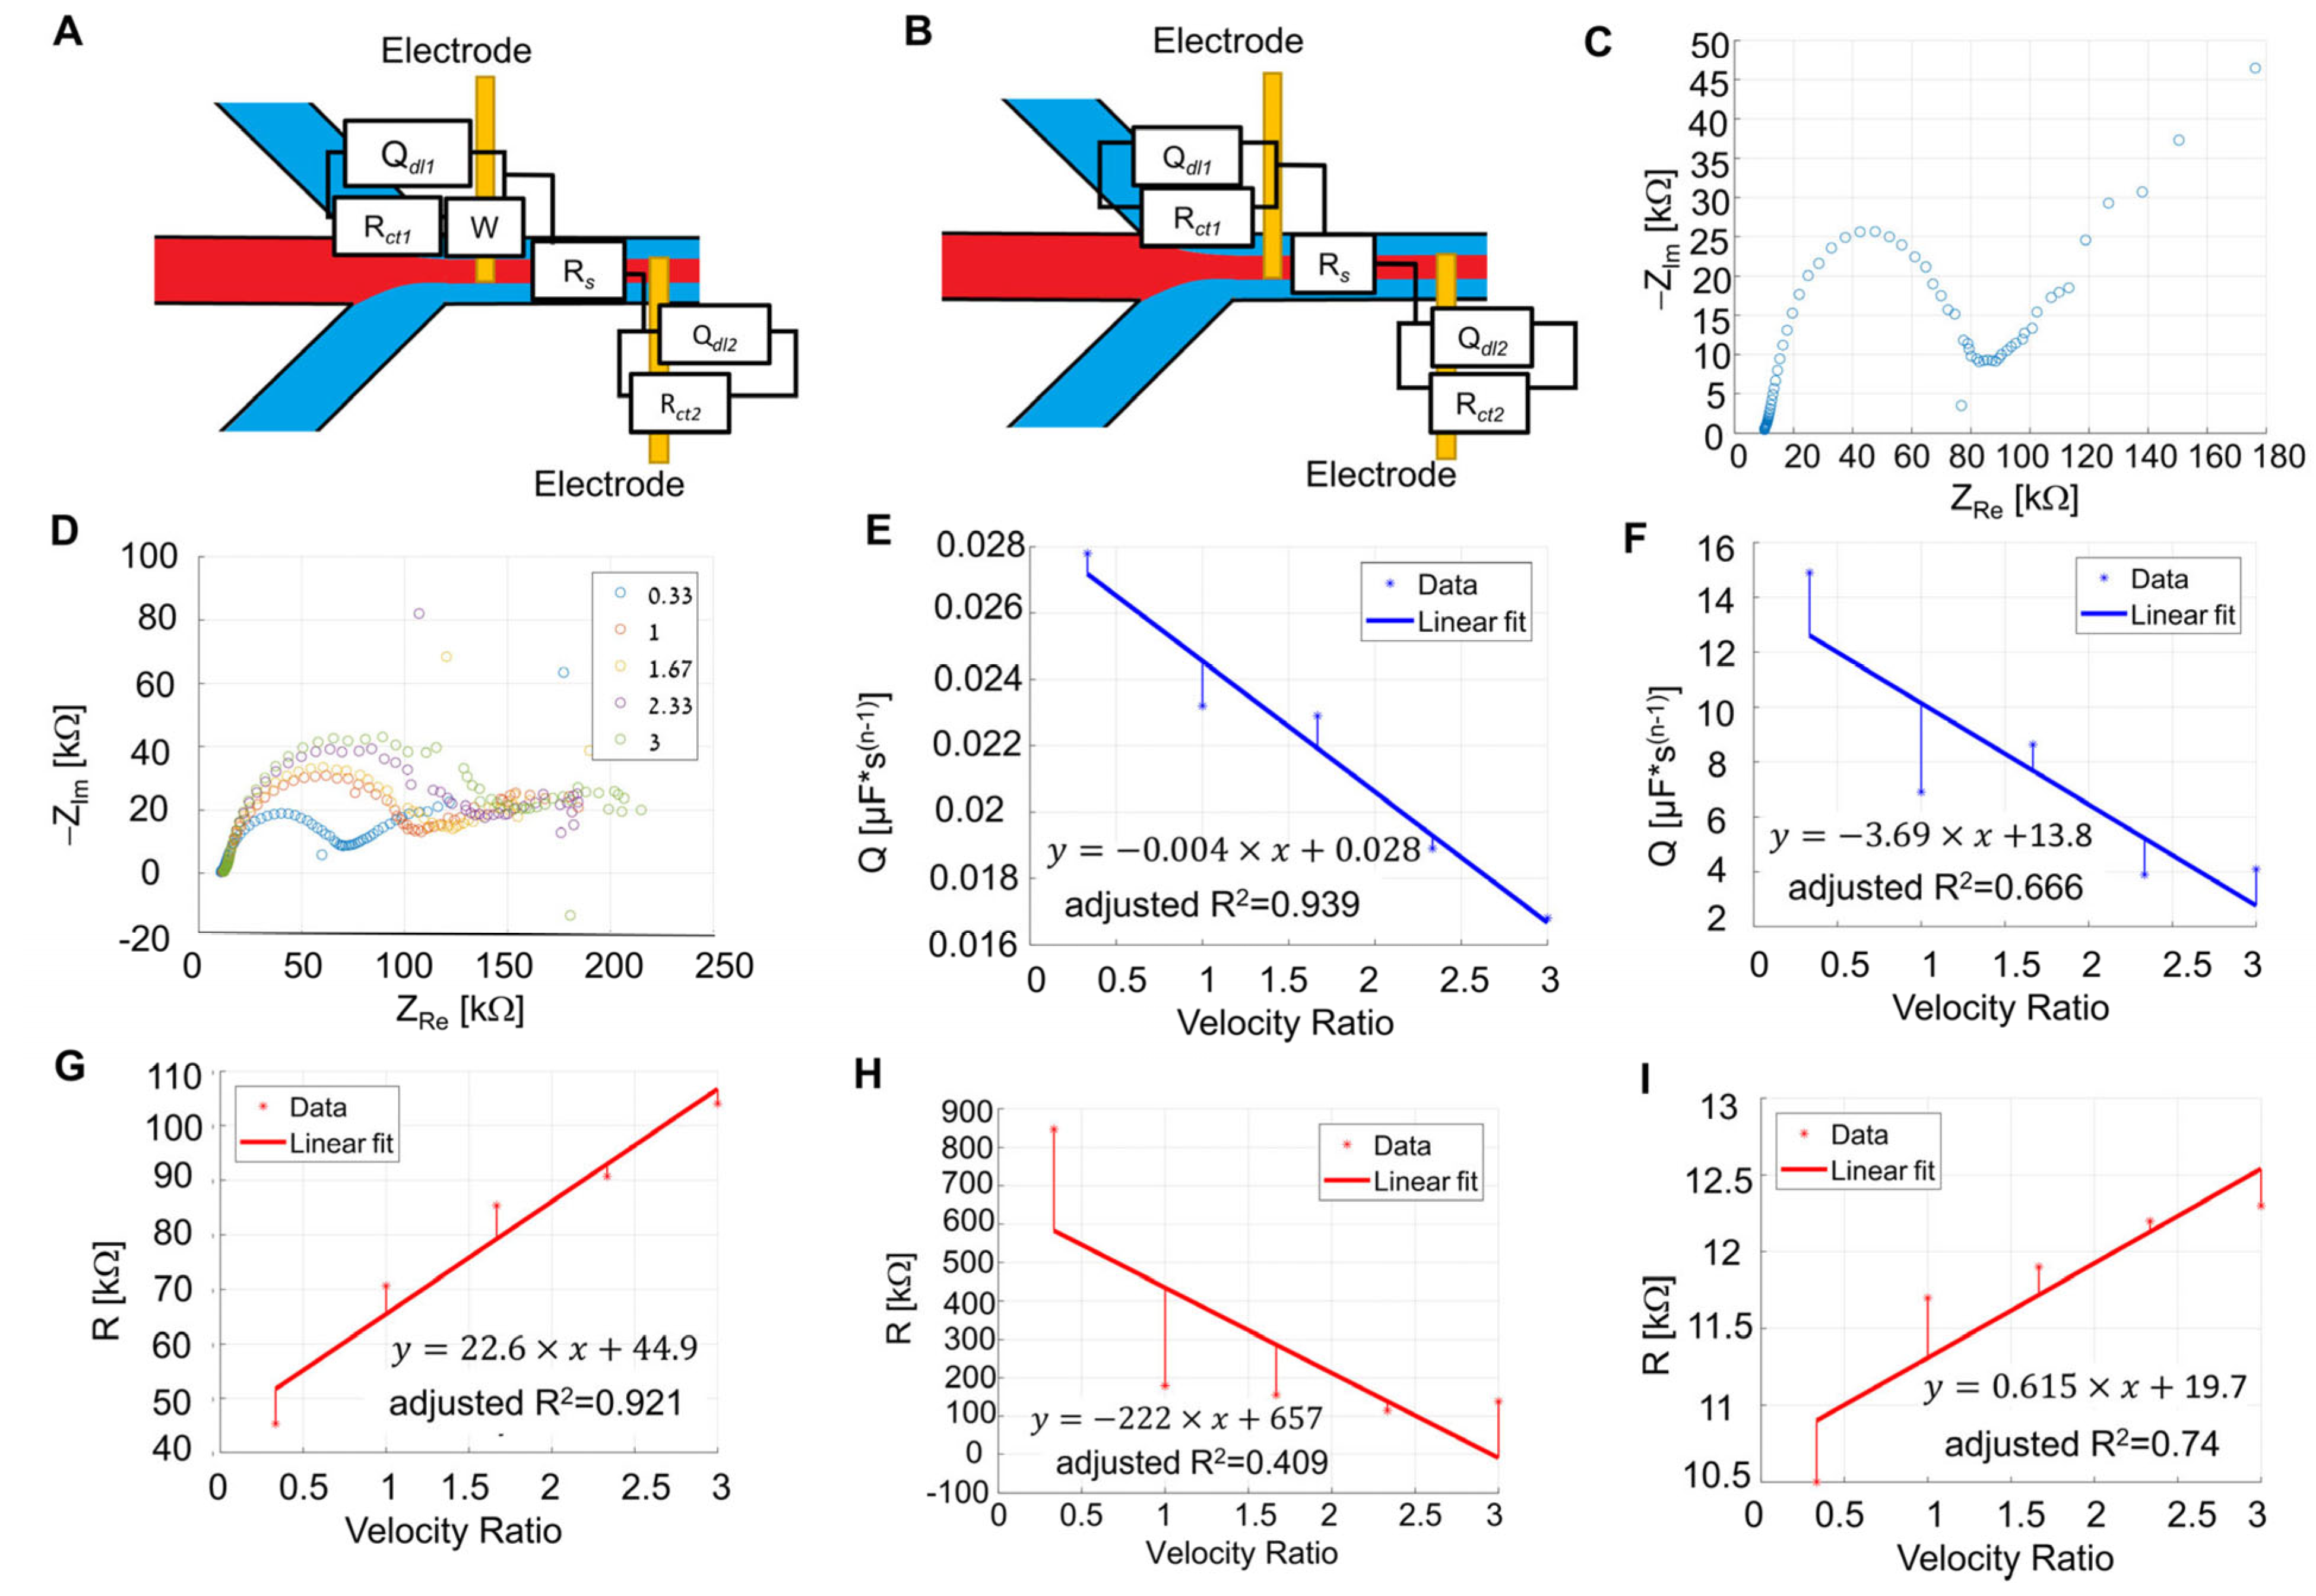
3.3. Influence of the Flow Ratio on the Electrochemical System Properties

The effect of the flow ratio was tested in the channels, and the physicochemical properties of the electrochemical system were measured using EIS. First, the physicochemical properties of the system were characterized by the absence of flow. The physicochemical model of the stationary (Figure 5A) and the flow dynamic (Figure 5B) electrochemical system is based on the modified Randles cell [30] for each electrode and the solution resistance in between; Rct1 and Rct2 are the charge transfer resistances of each electrode, Rs is the solution resistance (Equation (3)), Qdl1 and Qdl2 are the constant phase elements (CPEs) representing the electrical double-layer behavior (Equation (4)), and W is the Warburg semi-infinite diffusion element (Equation (5)).
Z R = R  
Z Q = 1 Q j ω a
W = s ω 1 / 2 j s ω 1 / 2
The measured impedance values showed the expected semicircle characteristics and the diffusion effect at low frequencies (Figure 5C). By fitting the resulting impedance values to the equivalent electrical circuit, we calculated the values of the circuit’s components (Table 1).
We characterized the physicochemical properties of the 3D-printed LOC under different flow conditions. Since limited mass transfer effect is expected, W was omitted from the equivalent electrical circuit (Figure 5B). The LOC flow ratios of 0.33, 1, 1.67, 2.33, and 3 were streamed and the corresponding electrochemical impedance spectrograms were measured. The measured spectrograms (Figure 5D) showed two semicircle characteristics (visible at low and high frequencies) that can be related to the double layers of both electrodes. The presence of the second semicircle at low frequencies can be due to the negligible effect of diffusion, making the effect of both electrodes visible, as opposed to the single semicircle characteristic observed in a stationary state. Moreover, higher ratio values resulted in spectrograms with bigger semicircles.
The vertical lines in Figure 5E–I indicate the deviation of the measured data from the fitted linear regression line. Figure 5E,F show negative linear relationships (between the flow ratios and the constant phase element magnitude of both electrodes, where y = 0.004 ± 0.0001 x + 0.0028 ± 0.0001 ,     R 2 = 0.939 ;   y = 3.69 ± 1.23 x + 13.8 ± 5.86 ,   and   R 2 = 0.666 , respectively). Figure 5G shows that positive linear relationships exist between the flow ratios and the charge transfer resistance values of both electrodes ( y = 22.6 ± 2.99 x + 44.9 ± 5.73 ,   R 2 = 0.921 ). This relationship can also be attributed to changes in the surface areas of the electrodes. Since the charge transfer resistance can be described as multiple resistors connected in parallel, for high ratios, the surface areas decrease and the number of resistors decreases accordingly, resulting in high resistance. Figure 5H shows a poor linear fitting that can be assumed to be due to the higher turbulence effect from the rough channel walls at small velocity ratios that increase the recorded electrochemical noise ( y = 222 ± 115 x + 657 ± 219 ,   R 2 = 0.409 ). The positive relationship between the flow ratio and the solution resistance in Figure 5I ( y = 0.615 ± 0.174 x + 10.7 ± 0.336 ,   R 2 = 0.740 ) can be attributed to a smaller focusing aperture that exposes the electrodes to a higher volume of PBS solution and to a lower volume of the electroactive species, resulting in a solution with higher resistance.

3.4. Proof-of-Concept of the Impedimetric Detection of Flowing Microspheres

The impedimetric signals of microspheres flowing in the 3D-printed LOC were recorded (Figure 6A). The impedance values recorded in the presence of flowing microspheres resulted in a more perturbated signal than did the recorded control solution. Fast Fourier transform analysis of the signal, recorded in the presence of microspheres (Figure 6B), revealed a noise signal that was higher than in the control solution. The expected perturbation time between flowing microspheres passing the electrodes was calculated, and was in a range of 15.7   s   to   18.9   s , equivalent to the range of 0.053   Hz   to   0.064   Hz . As shown in Figure 6B, fourfold higher power values are observed with the expected range compared to the control solution, demonstrating the feasibility of detecting flowing microspheres in the 3D-printed LOC.

4. Conclusions

Three-dimensional-printed LOC devices for cell counting can improve the diagnosis and monitoring at the POC. Here, we showed the design, simulation, development, and performance of a low-cost 3D-printed device that can be used for accurate cell counting in remote locations. Validation experiments supported our simulation results and showed an optimal focusing aperture of 50 µm in a 0.5 mm channel. Although the hydraulic focused flow is negatively dependent on the flow ratio between the middle and side channels, the focusing effect in 3D-printed LOCs can be prone to turbulences at lower ratios due to rough channel walls, in comparison to conventional microfabrication methods. Electrochemical impedance spectroscopy analysis revealed a positive and a negative dependence of the CPE element and the charge transfer resistance, respectively, on the flow ratio. Furthermore, the recorded impedance signals detected microspheres flowing in the channel. As a proof of concept, impedance flow cytometry analysis of the microbeads (6 µm diameter, similar to typical cell sizes) that flowed through the developed 3D-printed hydrodynamic focusing LOC device was used. By providing an alternative approach to manufacturing low-cost rapid prototyping flow cytometry devices, accurate health assessment can be adapted in developing settings.

Author Contributions

Conceptualization, H.B.-Y.; methodology, H.B.-Y., S.K. and T.Z.; software, T.Z.; validation, S.K. and T.Z.; formal analysis, S.K. and T.Z.; investigation, S.K., T.Z. and H.B.-Y.; resources, H.B.-Y.; data curation, S.K., T.Z., D.D. and H.B.-Y.; writing—original draft preparation, S.K., T.Z. and D.D.; writing—review and editing, D.D. and H.B.-Y.; visualization, D.D. and H.B.-Y.; supervision, H.B.-Y.; funding acquisition, H.B.-Y. All authors have read and agreed to the published version of the manuscript.

Funding

This research received no external funding.

Institutional Review Board Statement

Not applicable.

Informed Consent Statement

Not applicable.

Data Availability Statement

The data used to develop all the figures and table are not available to share publicly.

Acknowledgments

We wish to thank Meytal Nachmani, Sigal Steinberg, Shir Shwartz, Daniel Bahar, Guy Keret, and Shahar Sender for their reports and discussions in their final BME undergraduate projects.

Conflicts of Interest

The authors declare no conflict of interest.

References

  1. Xu, Y.; Xie, X.; Duan, Y.; Wang, L.; Cheng, Z.; Cheng, J. A Review of Impedance Measurements of Whole Cells. Biosens. Bioelectron. 2016, 77, 824–836. [Google Scholar] [CrossRef] [PubMed]
  2. Chen, J.; Xue, C.; Zhao, Y.; Chen, D.; Wu, M.-H.; Wang, J. Microfluidic Impedance Flow Cytometry Enabling High-Throughput Single-Cell Electrical Property Characterization. Int. J. Mol. Sci. 2015, 16, 9804–9830. [Google Scholar] [CrossRef] [PubMed]
  3. Van Berkel, C.; Gwyer, J.D.; Deane, S.; Green, N.; Holloway, J.; Hollis, V.; Morgan, H. Integrated Systems for Rapid Point of Care (PoC) Blood Cell Analysis. Lab. Chip 2011, 11, 1249–1255. [Google Scholar] [CrossRef]
  4. Hassan, U.; Bashir, R. Electrical Cell Counting Process Characterization in a Microfluidic Impedance Cytometer. Biomed. Microdevices 2014, 16, 697–704. [Google Scholar] [CrossRef] [PubMed]
  5. Ateya, D.A.; Erickson, J.S.; Howell, P.B.; Hilliard, L.R.; Golden, J.P.; Ligler, F.S. The Good, the Bad, and the Tiny: A Review of Microflow Cytometry. Anal. Bioanal. Chem. 2008, 391, 1485–1498. [Google Scholar] [CrossRef] [PubMed]
  6. Chien, J.-C.; Ameri, A.; Yeh, E.-C.; Killilea, A.N.; Anwar, M.; Niknejad, A.M. A High-Throughput Flow Cytometry-on-a-CMOS Platform for Single-Cell Dielectric Spectroscopy at Microwave Frequencies. Lab. Chip 2018, 18, 2065–2076. [Google Scholar] [CrossRef] [PubMed]
  7. Liang, L.; Zuo, Y.F.; Wu, W.; Zhu, X.Q.; Yang, Y. Optofluidic Restricted Imaging, Spectroscopy and Counting of Nanoparticles by Evanescent Wave Using Immiscible Liquids. Lab. Chip 2016, 16, 3007–3014. [Google Scholar] [CrossRef]
  8. Hu, X.J.; Liu, H.L.; Jin, Y.X.; Liang, L.; Zhu, D.M.; Zhu, X.Q.; Guo, S.S.; Zhou, F.L.; Yang, Y. Precise Label-Free Leukocyte Subpopulation Separation Using Hybrid Acoustic-Optical Chip. Lab. Chip 2018, 18, 3405–3412. [Google Scholar] [CrossRef] [PubMed]
  9. Cheung, K.C.; Di Berardino, M.; Schade-Kampmann, G.; Hebeisen, M.; Pierzchalski, A.; Bocsi, J.; Mittag, A.; Tárnok, A. Microfluidic Impedance-Based Flow Cytometry. Cytometry A 2010, 77, 648–666. [Google Scholar] [CrossRef]
  10. Yan, S.; Yuan, D. Continuous Microfluidic 3D Focusing Enabling Microflow Cytometry for Single-Cell Analysis. Talanta 2021, 221, 121401. [Google Scholar] [CrossRef]
  11. Honrado, C.; Bisegna, P.; Swami, N.S.; Caselli, F. Single-Cell Microfluidic Impedance Cytometry: From Raw Signals to Cell Phenotypes Using Data Analytics. Lab. Chip 2021, 21, 22–54. [Google Scholar] [CrossRef] [PubMed]
  12. Benjamin Ho, C.M.; Huan Ng, S.; Holden Li, K.H.; Yoon, Y.-J. 3D Printed Microfluidics for Biological Applications. Lab. Chip 2015, 15, 3627–3637. [Google Scholar] [CrossRef]
  13. Zarei, M. Advances in Point-of-Care Technologies for Molecular Diagnostics. Biosens. Bioelectron. 2017, 98, 494–506. [Google Scholar] [CrossRef] [PubMed]
  14. Systematics. Solutions at Works. Available online: https://www.systematics.co.il/en/ (accessed on 22 April 2023).
  15. Mir, M.A.; Tirumkudulu, M.S. A Low-Cost Flow Cell for Flow Cytometry. Biosens. Bioelectron. 2022, 211, 114334. [Google Scholar] [CrossRef] [PubMed]
  16. Jue, E.; Schoepp, N.G.; Witters, D.; Ismagilov, R.F. Evaluating 3D Printing to Solve the Sample-to-Device Interface for LRS and POC Diagnostics: Example of an Interlock Meter-Mix Device for Metering and Lysing Clinical Urine Samples. Lab. Chip 2016, 16, 1852–1860. [Google Scholar] [CrossRef] [PubMed]
  17. Bishop, G.W.; Satterwhite-Warden, J.E.; Bist, I.; Chen, E.; Rusling, J.F. Electrochemiluminescence at Bare and DNA-Coated Graphite Electrodes in 3D-Printed Fluidic Devices. ACS Sens. 2016, 1, 197–202. [Google Scholar] [CrossRef] [PubMed]
  18. Hampson, S.M.; Rowe, W.; Christie, S.D.R.; Platt, M. 3D Printed Microfluidic Device with Integrated Optical Sensing for Particle Analysis. Sens. Actuators B Chem. 2018, 256, 1030–1037. [Google Scholar] [CrossRef]
  19. Duarte, L.C.; Figueredo, F.; Ribeiro, L.E.B.; Cortón, E.; Coltro, W.K.T. Label-Free Counting of Escherichia Coli Cells in Nanoliter Droplets Using 3D Printed Microfluidic Devices with Integrated Contactless Conductivity Detection. Anal. Chim. Acta 2019, 1071, 36–43. [Google Scholar] [CrossRef]
  20. Costa, B.M.d.C.; Griveau, S.; Bedioui, F.; Orlye, F.D.; da Silva, J.A.F.; Varenne, A. Stereolithography Based 3D-Printed Microfluidic Device with Integrated Electrochemical Detection. Electrochim. Acta 2022, 407, 139888. [Google Scholar] [CrossRef]
  21. Wang, H.; Enders, A.; Preuss, J.-A.; Bahnemann, J.; Heisterkamp, A.; Torres-Mapa, M.L. 3D Printed Microfluidic Lab-on-a-Chip Device for Fiber-Based Dual Beam Optical Manipulation. Sci. Rep. 2021, 11, 14584. [Google Scholar] [CrossRef] [PubMed]
  22. Tang, W.; Tang, D.; Ni, Z.; Xiang, N.; Yi, H. Microfluidic Impedance Cytometer with Inertial Focusing and Liquid Electrodes for High-Throughput Cell Counting and Discrimination. Anal. Chem. 2017, 89, 3154–3161. [Google Scholar] [CrossRef] [PubMed]
  23. Prinyakupt, J.; Pluempitiwiriyawej, C. Segmentation of White Blood Cells and Comparison of Cell Morphology by Linear and Naïve Bayes Classifiers. Biomed. Eng. Online 2015, 14, 63. [Google Scholar] [CrossRef] [PubMed]
  24. Winkler, T.E.; Ben-Yoav, H.; Ghodssi, R. Hydrodynamic Focusing for Microfluidic Impedance Cytometry: A System Integration Study. Microfluid. Nanofluid. 2016, 20, 134. [Google Scholar] [CrossRef]
  25. King, M.R. Chapter 7—Biomedical Applications of Microchannel Flows. In Heat Transfer and Fluid Flow in Minichannels and Microchannels; Kandlikar, S.G., Garimella, S., Li, D., Colin, S., King, M.R., Eds.; Elsevier Science Ltd.: Oxford, UK, 2006; pp. 409–442. ISBN 978-0-08-044527-4. [Google Scholar]
  26. Dolomite. 3D Flow Focusing Chip. Available online: https://www.dolomite-microfluidics.com/product/3d-flow-focusing-chip/ (accessed on 23 April 2023).
  27. Dieujuste, D.; Qiang, Y.; Du, E. A Portable Impedance Microflow Cytometer for Measuring Cellular Response to Hypoxia. Biotechnol. Bioeng. 2021, 118, 4041–4051. [Google Scholar] [CrossRef] [PubMed]
  28. Hunt, B. Diffusion in Laminar Pipe Flow. Int. J. Heat Mass Transf. 1977, 20, 393–401. [Google Scholar] [CrossRef]
  29. Rapp, B.E. Chapter 9—Fluids. In Microfluidics: Modelling, Mechanics and Mathematics; Rapp, B.E., Ed.; Micro and Nano Technologies; Elsevier: Oxford, UK, 2017; pp. 243–263. ISBN 978-1-4557-3141-1. [Google Scholar]
  30. Randviir, E.P.; Banks, C.E. Electrochemical Impedance Spectroscopy: An Overview of Bioanalytical Applications. Anal. Methods 2013, 5, 1098–1115. [Google Scholar] [CrossRef]
Figure 1. Proposed approach for rapid manufacturing of low-cost hydrodynamic focusing-integrated impedance flow cytometry devices.
Chemosensors 11 00283 g001
Figure 2. Schematic diagram to illustrate the manufacturing of the 3D-printed chip. (A) Design of the chip based on simulation results. (B) Fluidic Factory 3D printer from Dolamite Ltd., London, UK. (C) Multiflux connector, interface, and the 3D-fabricated chip.
Chemosensors 11 00283 g002
Figure 3. Simulation results for different channel diameters. (A) 3D-printed microfluidic device with two conductive metal pins connected to the designated connector (B). A 5 mm simulation (C) and its species concentration profile (F), 1 mm simulation (D) and its species concentration profile (G), and 0.5 mm simulation (E) and its species concentration profile (H).
Chemosensors 11 00283 g003
Figure 4. Simulation linear fit of the focused flow to the diameter of the channel (A), the color fluid validation experiment (B), a channel close-up (C), and 95% focused flow results (D).
Chemosensors 11 00283 g004
Figure 5. Electrochemical impedance spectroscopy characterization of the physicochemical properties of the LOC in the presence and the absence of flow. The scheme of the equivalent electrical circuit in the absence of flow (A) and in the presence of flow (B). A Nyquist plot of the measured LOC in either the absence (C) or the presence (D) of flow. The influence of the flow ratio on the constant phase element of electrode 1 (Qdl1) (E), the constant phase element of electrode 2 (Qdl2) (F), and the charge transfer resistance of electrode 1 (Rct1) (G), the charge transfer resistance of electrode 2 (Rct2) (H), and the solution resistance (Rs) (I). Vertical lines represent the deviation of the data points from the linear regression line.
Chemosensors 11 00283 g005
Figure 6. Impedimetric detection of microspheres flowing in the 3D-printed LOC. Recorded impedance at a frequency of 10 kHz as a function of time (A), fast Fourier transform of the recorded impedance (B), and close-up image at the frequency range of 0.04 to 0.08 Hz (C).
Chemosensors 11 00283 g006
Table 1. Influence of the flow ratio on the electrochemical system properties.
Flow Ratio a 2 Q d l 2   F · s a 1   ×   10 7 R c t 2 Ω R s   Ω a 1 Q d l 1   F · s a 1   ×   10 10 R c t 1   Ω s 1 Ω · s 1 2
No   flow 0.258 ± 0.5 202 ± 0.06 5.13 × 10 6 ± 3.43 · 10 6 9500 ± 1.55 0.876 ± 0.5 159 ± 0.15 58 , 200 ± 2.87 13 , 500 ± 240
0.33 0.301 ± 0.5 149 ± 0.02 847 , 000 ± 247 10 , 500 ± 0.394 0.814 ± 0.5 278 ± 0.1 45 , 300 ± 2.81 -
1 0.378 ± 0.5 69 ± 0.004 179 , 000 ± 59.0 11 , 700 ± 0.464 0.828 ± 0.5 232 ± 0.07 70 , 700 ± 6.67 -
1.67 0.372 ± 0.5 86.3 ± 0.006 155 , 000 ± 51.4 11 , 900 ± 0.480 0.822 ± 0.5 229 ± 0.06 85 , 400 ± 6.77 -
2.33 0.427 ± 0.5 38.9 ± 0.004 114 , 000 ± 20.2 12 , 200 ± 0.487 0.846 ± 0.5 189 ± 0.07 90 , 700 ± 11.6 -
3 0.424 ± 0.5 41 ± 0.0002 138 , 000 ± 23.4 12 , 300 ± 0.484 0.856 ± 0.5 168 ± 0.05 104 , 000 ± 10.7 -
Disclaimer/Publisher’s Note: The statements, opinions and data contained in all publications are solely those of the individual author(s) and contributor(s) and not of MDPI and/or the editor(s). MDPI and/or the editor(s) disclaim responsibility for any injury to people or property resulting from any ideas, methods, instructions or products referred to in the content.

