Article

Electrochemical Sensing of Vitamin D3: A Comparative Use of Glassy Carbon and Unmodified Screen-Printed Carbon Electrodes

by
Fátima Daniela Gonçalves
,
José António Rodrigues
and
Rui Miguel Ramos
*
LAQV-REQUIMTE, Departamento de Química e Bioquímica, Faculdade de Ciências, Universidade do Porto, Rua do Campo Alegre, s/n, 4169-007 Porto, Portugal
*
Author to whom correspondence should be addressed.
Chemosensors 2023, 11(12), 575; https://doi.org/10.3390/chemosensors11120575
Submission received: 29 October 2023 / Revised: 1 December 2023 / Accepted: 4 December 2023 / Published: 6 December 2023

Abstract

:
This work presents the electrochemical determination of cholecalciferol (Vitamin D3) in water-organic mixtures using a glassy carbon electrode (GCE) and commercial screen-printed carbon electrodes (SPCEs). The electrocatalytic behavior of Vitamin D3 on the surface of the working electrode produced a well-defined oxidation peak at +0.95 V (vs. Ag|AgCl, 3.0 mol L−1) and +0.7 V (vs. Ag-SPCE pseudo-reference electrode) for the GCE and SPCE, respectively, in 0.1 M LiClO4 prepared in 50% ethanol. The nature of the organic solvent needed for the solubilization of Vitamin D3 was evaluated, together with the concentration of the supporting electrolyte, the ratio of the water-organic mixture, the voltametric parameters for the cyclic voltammetry (CV), and square-wave voltammetry (SWV) analyses. Under the optimized conditions, a linear correlation between the anodic peak current and the concentration of Vitamin D3 was obtained over the range of 0.47 to 123 µmol L−1 and 59.4 to 1651 µmol L−1 for the GCE and SPCE, respectively. The determined limits of detection (LOD) were 0.17 (GCE) and 19.4 µmol L−1 (SPCE). The methodology was successfully applied to commercial supplement tablets of Vitamin D3. Additionally, this work shows the possibility of using non-modified GCE and SPCE for routine analysis of Vitamin D3.

1. Introduction

Vitamin D, a fat-soluble vitamin, exists predominantly in two major forms, i.e., Vitamin D2 (ergocalciferol) and Vitamin D3 (cholecalciferol) (Figure 1). Their structure is very similar, apart from Vitamin D2 containing a double bond and an additional methyl group. While both forms can be naturally produced after exposure to sunlight through the precursors ergosterol and 7-dehydrocholesterol, to Vitamin D2 and D3, respectively, they can also be obtained through the ingestion of foods and supplements [1,2,3]. Several studies have reported that, in a state of avitaminosis, Vitamin D deficiency has implications for the absorption of calcium and phosphorus, together with several other health problems, such as cardiovascular diseases, hypertension, cancer, and others [4,5,6,7]. Nowadays, due to modern lifestyle habits with an increase in time spent indoors, resulting in less exposure to natural sun radiation, which is more problematic in countries with low annual solar radiation, a large portion of the global population has a deficiency in Vitamin D [8,9]. Therefore, besides the consumption of foods containing Vitamin D, which includes fish oils, mushrooms, eggs, and other dairy products, the fortification of foods and the active use of supplements have become a common practice in many countries [10,11]. Between the two forms of vitamin D, i.e., ergocalciferol and cholecalciferol, different studies suggested an advantage of cholecalciferol supplementation with respect to the more effective improvement of Vitamin D in the body [12]. Nowadays, Vitamin D3 is the most commonly used source of Vitamin D supplementation.
The analytical determination of Vitamin D3 can be a complex task due to the low concentration found in foods and supplements, chemical instability, and complexity of the matrices. Analytical methods for the determination of Vitamin D3 need to be sensitive, accurate, and robust. Most of the methods reported in the literature use high-performance liquid chromatography (HPLC) coupled with ultraviolet (UV) [13,14,15] or mass spectrometry (MS) detection [16,17,18], electrochemiluminescence [2,19], and different immunoassays [19,20,21]. An alternative is the use of electrochemical methods, which, in general, are simpler and faster, besides providing high sensitivity, selectivity, and cost-efficiency [22,23]. Moreover, they can be easily miniaturized and used in locations outside a laboratory facility [24]. In the literature, it is possible to find different electroanalytical methods developed for the analysis of Vitamin D3, using solid [25,26,27] or modified working electrodes [28,29,30], as well as different sensors based on modifications of screen-printed electrodes [10,31,32], and others [33,34,35]. Screen-printed electrodes are valuable alternatives to traditional solid electrodes since they are relatively inexpensive, offer high reproducibility and portability, and are ideal for in situ analysis.
In this work, we developed a method for the determination of Vitamin D3 in water-organic mixtures by employing square-wave voltammetry (SWV) using both unmodified glassy carbon electrodes (GCE) and screen-printed carbon electrodes (SPCEs). A comparison of the efficiency of both methods to determine the content of Vitamin D3 in water-organic model solutions was performed, together with the application of the method to commercial supplement tablets of Vitamin D3. To the best of our knowledge, this is one of the first reports on the use of unmodified SPCE for the electroanalysis of Vitamin D3.

2. Materials and Methods

2.1. Chemicals and Samples

Ultrapure water (resistivity > 18.2 MΩ cm) obtained from a Direct-Q 3UV system (Merck Millipore, Germany) was used for the preparation of all aqueous solutions.
Vitamin D3 (≥98%, Sigma-Aldrich, Darmstadt, Germany) stock solution (0.02 mol L−1) was prepared by accurately weighing the commercial reagent, dissolving it in ethanol (96%, Chem Lab, Zedelgem, Belgium), stored at 4 °C, and protected from light. Daily working solutions of Vitamin D3 were prepared by diluting the stock solution. The supporting electrolyte solution, 0.1 mol L−1 LiClO4 (≥95%, Sigma-Aldrich, Germany), was prepared by dissolving the commercial reagent in the organic solvent of choice. All organic solvents used (ethanol, methanol, propanol, and acetonitrile) were of analytical grade and were obtained from Chem Lab.
Commercial supplements of Vitamin D3 (15 µg, 25 µg, and 100 µg) were purchased from local stores (Porto, Portugal).

2.2. Equipment

The instrument used for all the voltametric analysis was a PalmSens 4 potentiostat (PalmSens BV, Houten, The Netherlands) driven by the software PSTrace (version 5.7.2001). For the conventional three-electrode system cell, a glassy carbon working electrode (3 mm diameter), an Ag|AgCl (3.0 mol L−1) reference electrode, and a platinum wire as the auxiliary electrode was used. The SPCEs, ref. DRP-110, (Metrohm DropSens, Oviedo, Spain) consists of a 3.3 × 1.0 × 0.05 cm ceramic substrate composed of a carbon working electrode (4 mm diameter), a carbon auxiliary electrode, and a silver pseudo-reference electrode.
The voltametric measurements were accomplished at normal laboratory temperatures.
The GCE was initially polished using 1.0 μm aluminum oxide on polishing pads, thoroughly rinsed with ultrapure water, and dried. Prior to electrochemical measurements, the GCE surface was conditioned in a solution of 0.5 mol L−1 H2SO4 by performing 15 scans of cyclic voltammetry (CV) in a potential range from −1.5 to 1.5 V. After each set of measurements with the same electrolyte solution, the GCE surface was cleaned with a H2O:MeOH (50:50) solution and gently dried with paper.
The SPCE was conditioned in a solution of 0.5 mol L−1 H2SO4 by performing 15 scans of CV from potential −1.5 to 1.5 V. After each measurement, the surface of the SPCE was cleaned with ultrapure water and dried under nitrogen.

2.3. Measurement Procedure

The electrochemical measurements were performed without the removal of oxygen since no interference was found in the anodic potential direction. CV and SWV parameters were individually optimized for both the GCE and SPCEs. CV was carried out in a potential range between 0.0 and +1.5 V, with a step potential of 10 mV, and a scan rate (v) of 50 mV s−1. SWV analysis was performed in a potential range from 0.0 to +1.5 V, frequency of 50 Hz, wave amplitude of 50 mV, step potential of 5 mV, and equilibration time of 10 s. For the conventional three-electrode cell, 10 mL of a Vitamin D3 standard solution/sample in the supporting electrolyte was added to the cell; for the SPCEs, only 55 µL was used, which was enough volume to completely cover the surface of all three electrodes.

2.4. Sample Preparation

The supplement products used in this work were tablets (25 µg) and capsules (15 µg and 100 µg) containing Vitamin D3 as the active ingredient. The tablets were ground into a powder and then added to a glass flask along with the supporting electrolyte, while capsules were opened, and their total content was transferred with the supporting electrolyte to a 10 mL glass flask. A single tablet/capsule was used for each analysis. After sonication for 10 min and filtration, 10 mL were transferred to the electrochemical cell for measurements with the GCE, while, as mentioned before, 55 µL were used for the SPCEs. All measurements were performed at least in triplicate, and results are reported as mean ± standard deviation.

3. Results

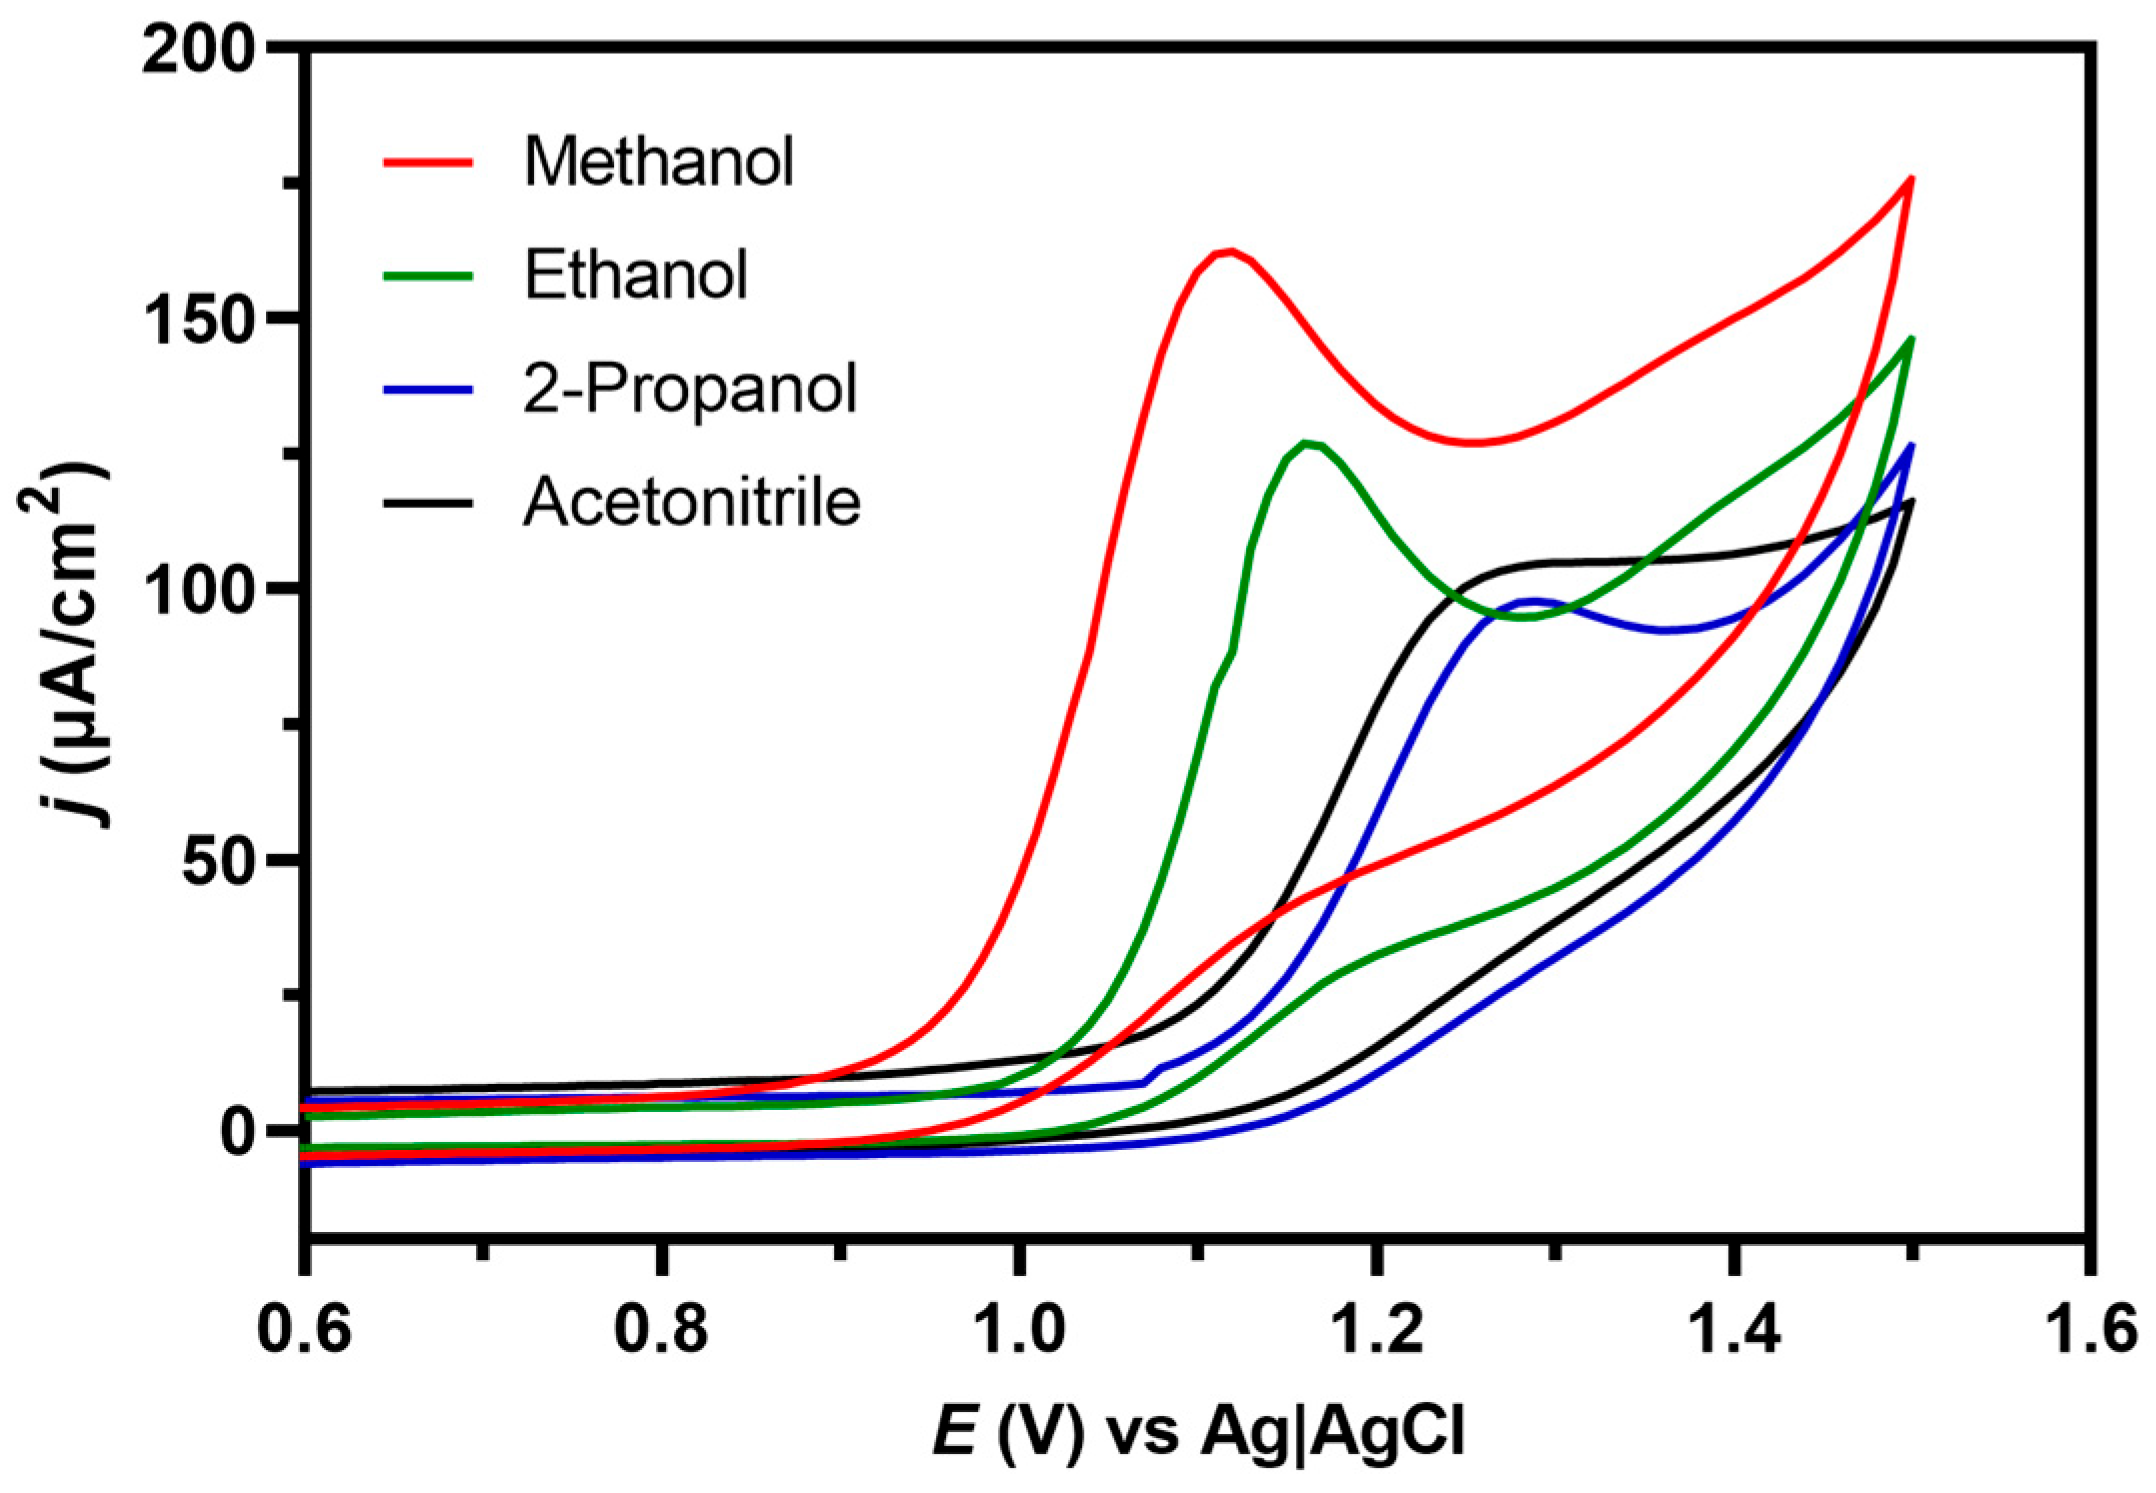
3.1. Electrooxidation of Vitamin D3 in Different Organic Solvents

The mechanism of electrochemical oxidation of Vitamin D3 is still uncertain. Generally, it is assumed that the oxidation of the triene moiety is responsible for the electroactivity of Vitamin D3. Some authors point to hydroxylation happening at C7 and C8 [25,29,36,37], while others propose hydroxylation at C10 and C19 [38]. A representation of these two mechanisms can be found in Figure S1.
In the literature, there are reports in which the oxidation of Vitamin D3 was studied for different working electrodes and different mixtures of organic solvents. Hart et al. [26] performed CVs using a GCE in a 90% methanol solution containing acetate buffer and obtained a single anodic peak at approximately +1.1 V (vs. Ag|AgCl). Chan et al. [27] recorded CVs of Vitamin D3 in acetonitrile and dichloromethane, using Pt and GC electrodes and 0.2 M n-Bu4NPF6 as the supporting electrolyte. For both solvents, one anodic oxidation peak was obtained at +0.8 V (vs. Fc/Fc+). Đurović et al. [29] found a single oxidation peak at around +1.03 V (vs. Ag|AgCl) using a boron-doped diamond electrode in a 0.02 M Britton-Robinson buffer prepared in 50% ethanol.
Herein, the electrooxidation of Vitamin D3 at the GCE was evaluated using different organic solvents (methanol, ethanol, 2-propanol, and acetonitrile) by CV in a potential range of 0 to +1.5 V using 0.1 mol L−1 lithium perchlorate as the supporting electrolyte and a solution of 1.0 mmol L−1 of Vitamin D3 (Figure 2). A single anodic oxidation peak was found at potentials of 1.12 V, 1.16 V, 1.28 V, and 1.29 V, for methanol, ethanol, 2-propanol, and acetonitrile, respectively. Furthermore, there is a noticeable shift towards more positive potentials as the polarity of the organic solvent decreases. The absence of a reduction peak seems to indicate that Vitamin D3 undergoes a chemically irreversible voltametric oxidation process that, under a short CV measurement, is not able to convert the formed compounds to the initial ones.
Considering the shape of the CVs shown in Figure 2, the oxidation potential of Vitamin D3, peak intensity, and the overall hazardousness of the four organic solvents, ethanol was chosen for the optimization of the supporting electrolyte composition.

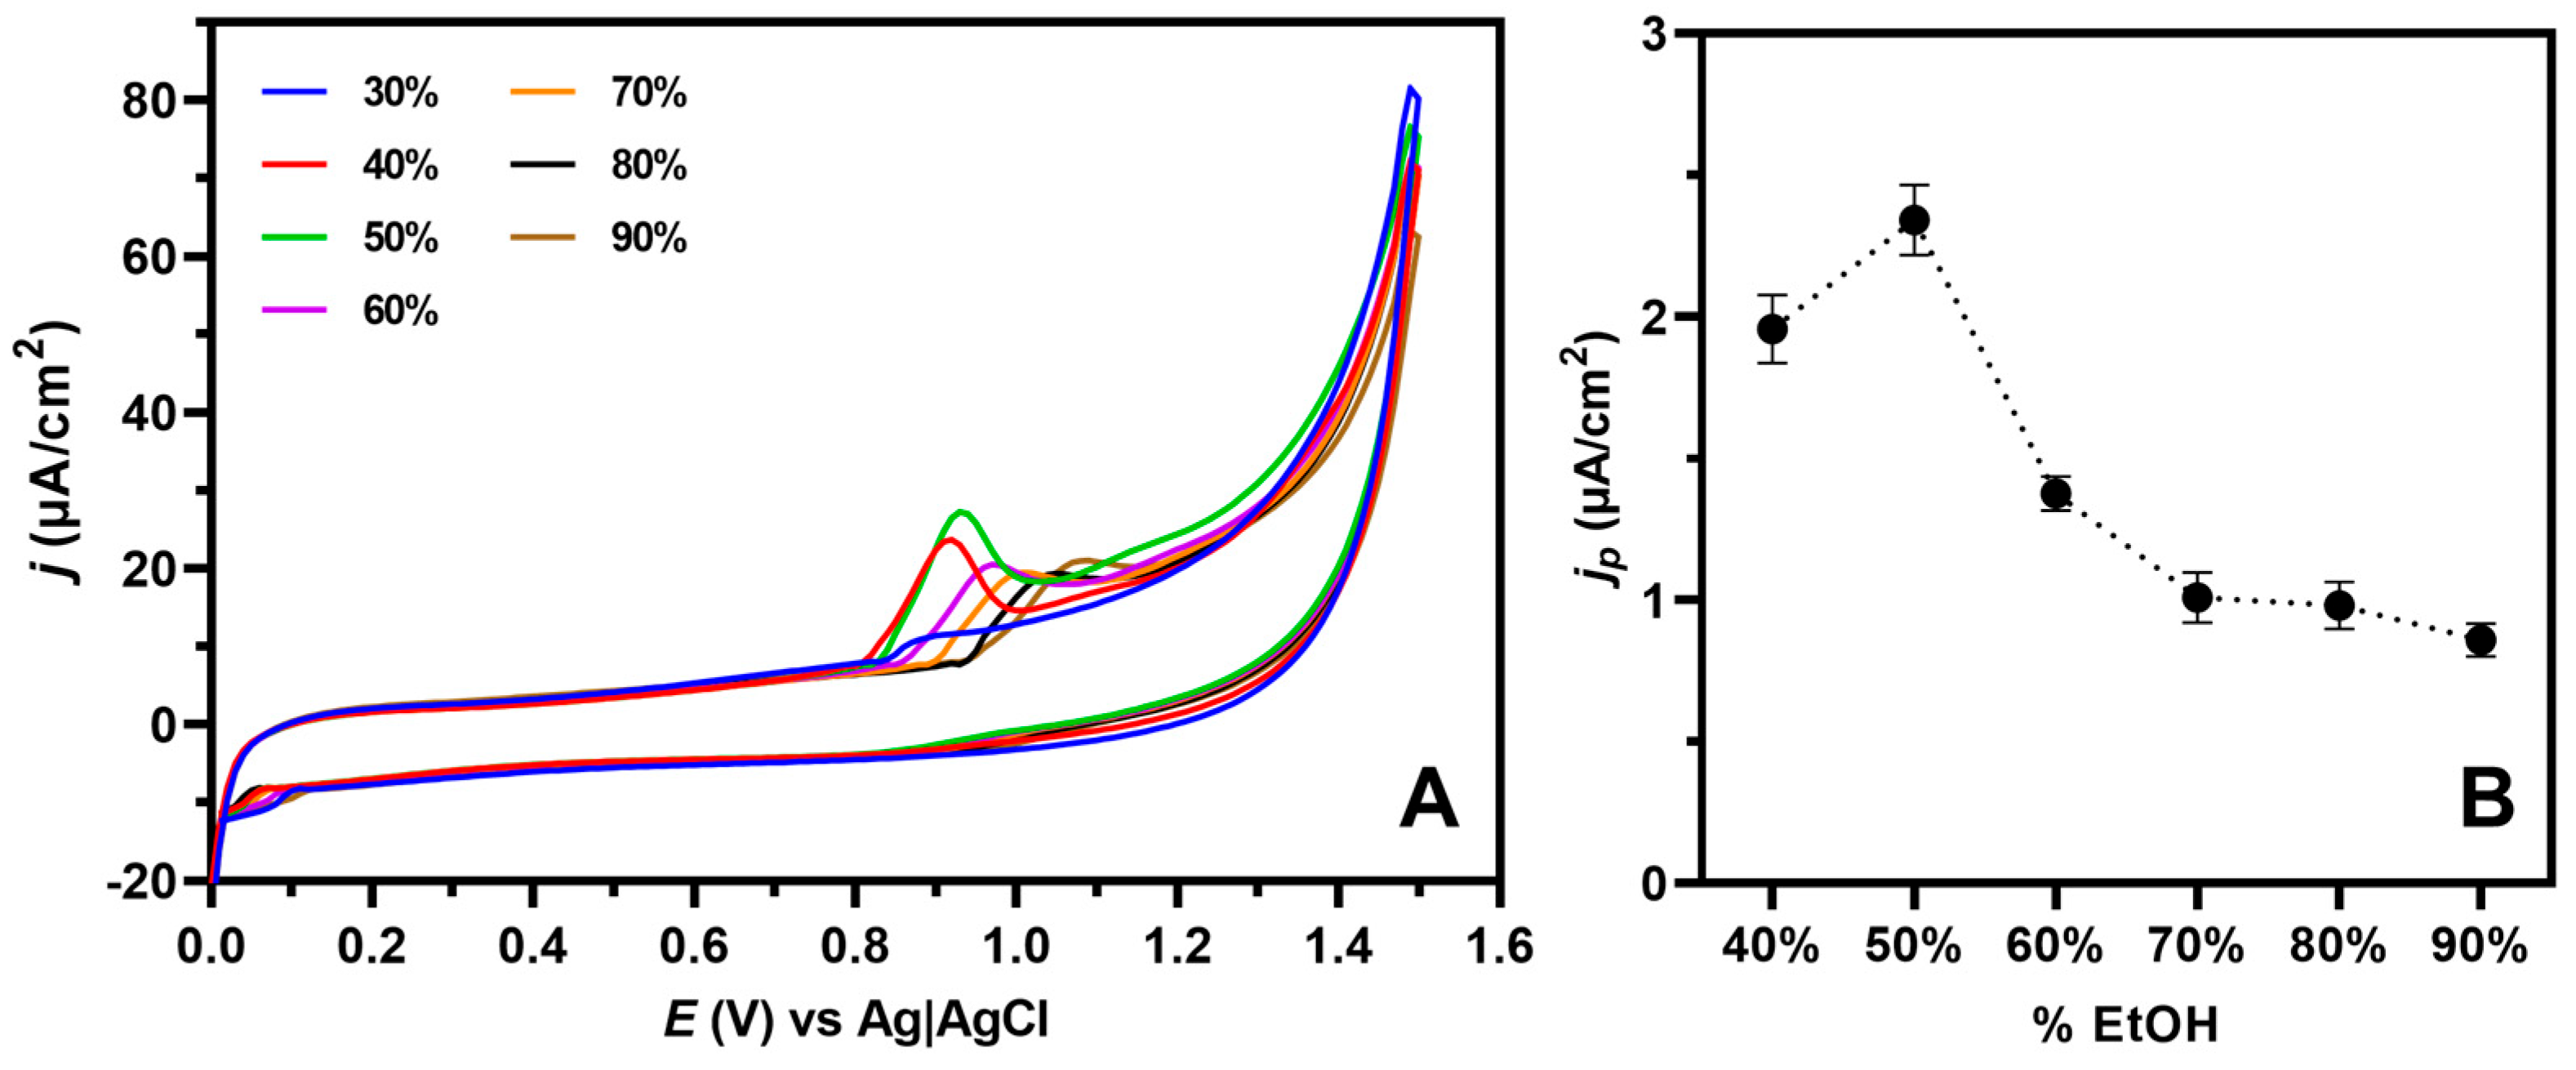
3.2. Optimization of the Supporting Electrolyte Composition

The composition of the supporting electrolyte might influence the electrochemical reactions, and in this case, the electrooxidation of Vitamin D3, on the working electrode surface. Lithium perchlorate has been previously used as a supporting electrolyte in the electroanalysis of Vitamin D2 and Vitamin D3 with good results [29,39]. Considering that high percentages of organic solvents can damage the surface of the SPCE and that, given the lipophilic nature of Vitamin D3, it is not suitable in aqueous solutions, it was mandatory to find the best compromise between ethanol and water and the most adequate concentration of lithium perchlorate in order to enhance the electrochemical signal.
Different proportions of ethanol/water were studied for both the GCE (Figure 3) and SPCE (Figure S2). The results showed a shift to more positive potentials with increasing contents of ethanol in the supporting electrolyte solution. Furthermore, with ethanol contents below 40%, the electrochemical signal of Vitamin D3 could not be detected. The signal reached its maximum with 50% ethanol and it subsequently decreased with increasing ethanol content on the supporting electrolyte. Therefore, the proportion 50/50 (ethanol/water) was chosen as the optimum medium and was used in the following experiments. Under these conditions, a single oxidation peak of Vitamin D3 was obtained at +0.95 V for the GCE and at +0.7 V for the unmodified SPCE.
The concentration of lithium perchlorate in the supporting electrolyte solution was briefly studied in the GCE system since the salt content in the solution can affect its ionic strength and change the solubility of the lipophilic Vitamin D3 in the ethanol/water mixture. The dependence of the peak current on the concentration of lithium perchlorate was followed from 0 to 0.2 mol L−1 on a 50/50 ethanol/water solution (Figure S3). From these experimental results, it was possible to verify that the signal increased until a concentration of 0.1 mol L−1 of lithium perchlorate was reached, and after it remained stable. Therefore, 0.1 mol L−1 of lithium perchlorate was chosen as the optimum condition.

3.3. Optimization of the Electrochemical Conditions

The electrochemical conditions used for the analysis of Vitamin D3 were briefly optimized for both CV and SWV in the GCE and SPCE systems. Firstly, for the GCE, the scan rate and the step potential were evaluated over a 0.1 mmol L−1 Vitamin D3 in 0.1 M LiClO4 prepared in a 50% ethanol solution. The scan rate was studied between 20–250 mV s−1, between 0 V and +1.5 V, with a step potential of 10 mV (Figure 4A). It was observed that there was a shift towards more positive potentials with the increase in the scan rate, which is characteristic of irreversible processes. The scan rate dependence can be used to distinguish between surface and diffusion-controlled voltametric processes. A direct dependence on the scan rate corresponds to a surface-controlled process, while a square-root dependence indicates a diffusion-controlled voltametric process. By evaluating the relation between the logarithm of the peak current (ln (Ip)) versus the logarithm of the scan rate (ln (v)), it is possible to determine if we are in the presence of an electrochemical diffusional (slope of 0.5) or adsorptive process (slope of 1.0) [40,41]. As seen in the inset of Figure 4A, a slope of 0.99 suggests the existence of an adsorptive process. The best compromise between peak height, curve shape, and total run time was attained for a scan rate of 50 mV s−1. The step potential was studied from 1 to 100 mV for a scan rate of 50 mV s−1. An increase in the step potential led to a decrease in the peak height; therefore, a step potential of 10 mV was chosen. The same study was performed on the SPCE to confirm if the results would be similar to the ones obtained for the GCE (Figure 4B). A similar behaviour was obtained, and the parameters were kept the same.
The square-wave parameters were also swiftly optimized. During these experiments, each studied parameter was changed while keeping the other two constant. The optimum conditions were similar for both the GCE and the SPCE and were found to be as follows: a frequency of 50 Hz, an amplitude of 50 mV, and a step potential of 5 mV.

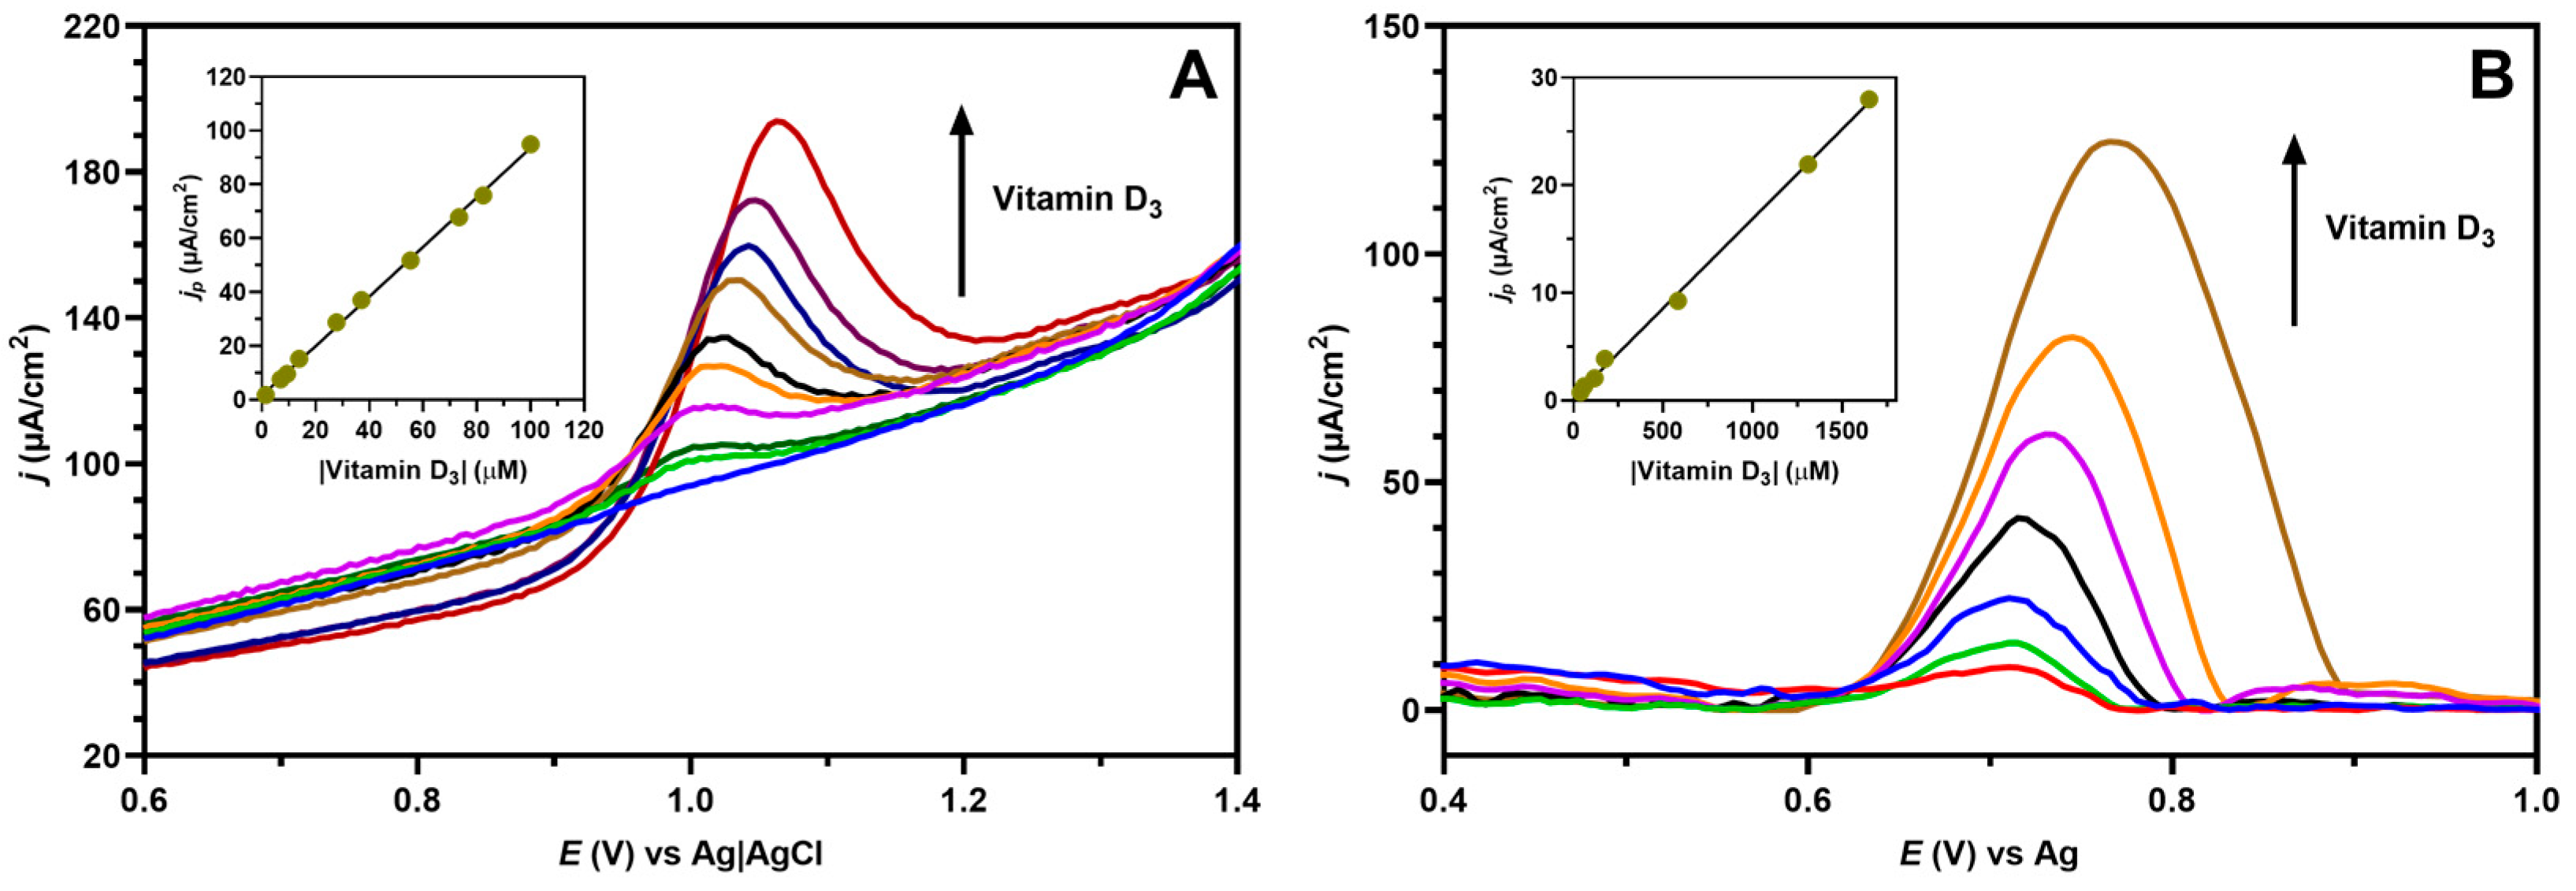
3.4. Method Performance

The suggested method’s performance was investigated using the optimized conditions in Vitamin D3 standard solutions. Calibration curves (jp (µA/cm2) = (1.06 ± 0.01) [D3] (in µmol L−1) + (0.27 ± 0.05) for GCE and jp (µA/cm2) = (0.016 ± 0.001) [D3] (in µmol L−1) + (0.26 ± 0.06) for SPCE) were produced by graphing the peak current versus the Vitamin D3 concentration, and after adjustment of the experimental data by a linear regression analysis, a good linearity was obtained (Figure 5). The limit of detection (LOD) and limit of quantification (LOQ) were calculated as three and ten times the standard deviation of the intercept divided by the slope, respectively [42]. The precision of the experimental procedure was evaluated by performing five replicate experiments on a spiked Vitamin D3 sample solution at three different concentration levels (5, 20, and 60 µmol L−1) for three consecutive days. The relative standard deviation (RSD) values for the repeatability and intermediate precision studies (below 8%) were considered appropriate for the present work. These results are summarized in Table 1.
The matrix effect was evaluated by comparing the slopes obtained while analysing samples spiked at different concentration levels with the slopes of calibration curves of blank samples. It was found that the slopes were statistically different (Student’s t-test, at a 99% confidence interval), which denotes the influence of the matrix on the measurements. Therefore, for the determination of the Vitamin D3 content in the samples, the standard addition method was used.
Overall, the analytical parameters obtained are perfectly adequate for the determination of Vitamin D3 in supplements. Moreover, the LOD, LOQ, and linear range obtained for the GCE are comparable to other works found in the literature using modified electrodes, while improving them against other unmodified GCE [25,29,36,43,44]. Understandably, these parameters were higher for the unmodified SPCE, which is expected considering the lower total electrode surface area, the lower volume of the sample, and their disposable nature.
SPCEs are produced and sold with the intent of being used one single time since they are able to provide high repeatability between each singular electrode. Nevertheless, some reports have suggested that the same electrode could be used for several measurements [22]. Moreover, the prospect of using a single electrode for more than one measurement reduces the generated waste and increases the greenness of the methodology. To test this hypothesis, the optimized SWV conditions were used on a Vitamin D3 0.90 mmol L−1 solution prepared in a 0.1 M LiClO4 50% ethanol solution. In the first study, ten consecutive measurements on a single droplet were performed, showing complete oxidation and the absence of the Vitamin D3 peak after the second measurement. After this, ten measurements were performed by renewing the droplet of Vitamin D3 between each measurement, with a simple cleaning of the electrode surface with water and gentle drying with paper. This procedure resulted in a repeatability of 4.6% (% RSD) for the ten measurements without any visible degradation of the electrode surface, showing the possibility of reusing the same electrode for multiple measurements.

3.5. Determination of Vitamin D3 in Real Samples

To evaluate the effectiveness of the developed methodology and the ability of both electrodes to work with real samples, it was decided to perform the determination of Vitamin D3 in different supplements using the standard addition method. A total of four Vitamin D3 standard additions were performed over the samples. Analyses of each sample were performed at least in triplicate. The measurements were performed using the optimized conditions and the extracts containing Vitamin D3 were analysed by SWV. The determined Vitamin D3 contents for all samples, measured using the GCE and SPCE, are presented in Table 2. Representative voltammograms of the analysed supplement samples are shown in Figure S4.
It is possible to conclude that there is a correspondence between the content declared on the box label and the determined amount using the developed method, considering the relative error obtained. Furthermore, no matrix components seem to interfere with the voltametric determination for Vitamin D3, which highlights the selectivity of the methodology.
However, it should be noted that the determination of Vitamin D3 using the SPCEs was only successful for the sample containing a declared amount of analyte of 100 µg per tablet. Under the current conditions, it was not possible to distinguish any measurable peak from the baseline for the two lower content samples.

3.6. Comparison between GCE and SPCEs

The electroanalytical analysis of Vitamin D3 has previously been conducted using different working electrodes, with and without modification of the electrode surface, and by using different sensors based on modifications to screen-printed electrodes [10,31,32]. One of the first reports on the electrochemical determination of Vitamin D3 in water-organic mixtures was made by Cincoto et al. using an unmodified GCE [39]. A comparison between the method used in this work with other methods for the analysis of Vitamin D3 is shown in Table 3.
Using the optimized method described in this work, it was possible to improve the LOD from those reported using unmodified GCEs without adding extra sample preparation steps or modifications to the electrode surface. Moreover, these results are comparable to others obtained using more complex working electrodes, like the boron-doped diamond electrode (BDDE). When compared to the unmodified SPCEs, the differences in terms of LOD are significant but expected. SPCEs provide great benefits for field analysis due to their compact size and workability, which is often a positive trade-off. Moreover, in this work, it was proved that, although being sold for single use, it is possible to reuse the same SPCE for multiple measurements without any significant loss in the sensitivity of the measurement. This is especially relevant considering the analysis of an extract that contained 50% of an organic solvent (ethanol), which did not seem to damage the ink printed on the ceramic substrate.

4. Conclusions

In this work, a comparative study of the use of unmodified GCE and SPCEs towards the determination of cholecalciferol, commonly known as Vitamin D3, in water-ethanol mixtures and supplement products is presented. CV and SWV were used to access the electrochemical oxidation of Vitamin D3 on an optimized supporting electrolyte consisting of 0.1 M LiClO4 prepared in a 50/50 ethanol/water mixture. Well-resolved voltametric peaks were obtained under these conditions, which, together with the simplicity and cost-effectiveness of the overall methodology, makes it a valuable alternative for routine control analysis. The GCE presented an overall better performance for the analysis, which was expected considering the disposable nature and cost-effective characteristics of the SPCEs. Additionally, it shows the value and usefulness of bare, unmodified GCE and SPCEs for the analysis of Vitamin D3, without the need to use more complex solid electrodes or modification of the electrode surface.

Supplementary Materials

The following supporting information can be downloaded at: https://www.mdpi.com/article/10.3390/chemosensors11120575/s1, Figure S1: Two possible oxidation mechanisms of Vitamin D3.; Figure S2: Cyclic voltammograms of 0.90 mmol L−1 Vitamin D3 in 0.1 M LiClO4 prepared in different proportions of ethanol/water. Voltammograms were measured between 0 V and +1.5 V; scan rate of 50 mV s−1; step potential of 10 mV.; Figure S3: Dependence of peak current on the concentration of lithium perchlorate in the supporting electrolyte solution, prepared in 50/50 ethanol/water. Measurements, in triplicate, were performed on the GCE system by SWV on a 0.1 mmol L−1 Vitamin D3 solution. Figure S4: Representative square-wave voltammograms on the GCE of the analysed Vitamin D3 samples, obtained in 50/50 ethanol/water solution. SWV was performed using the optimized electrochemical conditions.

Author Contributions

Conceptualization, R.M.R. and J.A.R.; methodology, R.M.R.; validation, F.D.G. and R.M.R.; formal analysis, F.D.G. and R.M.R.; investigation, F.D.G.; resources, J.A.R.; writing—original draft preparation, R.M.R.; writing—review and editing, F.D.G., J.A.R. and R.M.R.; supervision, R.M.R.; funding acquisition, J.A.R. All authors have read and agreed to the published version of the manuscript.

Funding

This work received financial support from PT national funds (FCT/MCTES, Fundação para a Ciência e Tecnologia and Ministério da Ciência, Tecnologia e Ensino Superior) through grant UIDB/50006/2020 and UIDP/5006/2020. RMR thanks FCT (Fundação para a Ciência e Tecnologia) for funding through program CEECIND/04259/2017.

Institutional Review Board Statement

Not applicable.

Data Availability Statement

All new data is contained within the article or Supplementary Material.

Conflicts of Interest

The authors declare no conflict of interest.

References

  1. Webster, R.D. Voltammetry of the liposoluble vitamins (A, D, e and K) in organic solvents. Chem. Rec. 2012, 12, 188–200. [Google Scholar] [CrossRef] [PubMed]
  2. Lai, Y.T.; Cerquinho, R.G.; Perez, M.M.; Alves, B.D.C.A.; Pereira, E.C.; Azzalis, L.A.; Junqueira, V.B.C.; Soares, L.R.; Fonseca, F.L.A. Determination of vitamin D in tears of healthy individuals by the electrochemiluminescence method. J. Clin. Lab. Anal. 2019, 33, e22830. [Google Scholar] [CrossRef] [PubMed]
  3. Tsiaras, W.G.; Weinstock, M.A. Factors influencing vitamin D status. Acta Derm.-Venereol. 2011, 91, 115–124. [Google Scholar] [CrossRef] [PubMed]
  4. Zittermann, A.; Börgermann, J.; Gummert, J.F.; Pilz, S. Future directions in vitamin D and cardiovascular research. Nutr. Metab. Cardiovasc. Dis. 2012, 22, 541–546. [Google Scholar] [CrossRef] [PubMed]
  5. Avenell, A.; Mak, J.C.S.; O’Connell, D. Vitamin D and vitamin D analogues for preventing fractures in post-menopausal women and older men. Cochrane Database Syst. Rev. 2014, 4, CD000227. [Google Scholar] [CrossRef]
  6. Lappe, J.M.; Travers-Gustafson, D.; Davies, K.M.; Recker, R.R.; Heaney, R.P. Vitamin D and calcium supplementation reduces cancer risk: Results of a randomized trial. Am. J. Clin. Nutr. 2007, 85, 1586–1591. [Google Scholar] [CrossRef] [PubMed]
  7. Yildirim, P.; Garip, Y.; Karci, A.A.; Guler, T. Dry eye in vitamin D deficiency: More than an incidental association. Int. J. Rheum. Dis. 2016, 19, 49–54. [Google Scholar] [CrossRef]
  8. Bilodeau, L.; Dufresne, G.; Deeks, J.; Clément, G.; Bertrand, J.; Turcotte, S.; Robichaud, A.; Beraldin, F.; Fouquet, A. Determination of vitamin D3 and 25-hydroxyvitamin D3 in foodstuffs by HPLC UV-DAD and LC-MS/MS. J. Food Compos. Anal. 2011, 24, 441–448. [Google Scholar] [CrossRef]
  9. Kaur, A.; Rana, S.; Bharti, A.; Chaudhary, G.R.; Prabhakar, N. Voltammetric detection of vitamin D employing Au-MoS2 hybrid as immunosensing platform. Microchim. Acta 2021, 188, 222. [Google Scholar] [CrossRef]
  10. Carlucci, L.; Favero, G.; Tortolini, C.; Di Fusco, M.; Romagnoli, E.; Minisola, S.; Mazzei, F. Several approaches for vitamin D determination by surface plasmon resonance and electrochemical affinity biosensors. Biosens. Bioelectron. 2013, 40, 350–355. [Google Scholar] [CrossRef]
  11. Perales, S.; Delgado, M.M.; Alegría, A.; Barberá, R.; Farré, R. Liquid chromatographic determination of Vitamin D3 in infant formulas and fortified milk. Anal. Chim. Acta 2005, 543, 58–63. [Google Scholar] [CrossRef]
  12. Tripkovic, L.; Lambert, H.; Hart, K.; Smith, C.P.; Bucca, G.; Penson, S.; Chope, G.; Hypponen, E.; Berry, J.; Vieth, R.; et al. Comparison of vitamin D2 and vitamin D3 supplementation in raising serum 25-hydroxyvitamin D status: A systematic review and meta-analysis. Am. J. Clin. Nutr. 2012, 95, 1357–1364. [Google Scholar] [CrossRef]
  13. Brunetto, M.R.; Obando, M.A.; Gallignani, M.; Alarcón, O.M.; Nieto, E.; Salinas, R.; Burguera, J.L.; Burguera, M. HPLC determination of Vitamin D3 and its metabolite in human plasma with on-line sample cleanup. Talanta 2004, 64, 1364–1370. [Google Scholar] [CrossRef]
  14. Temova, Z.; Roškar, R. Stability-Indicating HPLC-UV Method for Vitamin D3 Determination in Solutions, Nutritional Supplements and Pharmaceuticals. J. Chromatogr. Sci. 2016, 54, 1180–1186. [Google Scholar] [CrossRef]
  15. Kamankesh, M.; Shahdoostkhany, M.; Mohammadi, A.; Mollahosseini, A. Fast and sensitive low density solvent-based dispersive liquid-liquid microextraction method combined with high-performance liquid chromatography for determining cholecalciferol (vitamin D3) in milk and yogurt drink samples. Anal. Methods 2018, 10, 975–982. [Google Scholar] [CrossRef]
  16. Trenerry, V.C.; Plozza, T.; Caridi, D.; Murphy, S. The determination of vitamin D3 in bovine milk by liquid chromatography mass spectrometry. Food Chem. 2011, 125, 1314–1319. [Google Scholar] [CrossRef]
  17. Donnarumma, D.; Arena, A.; Trovato, E.; Rigano, F.; Zoccali, M.; Mondello, L. A miniaturized comprehensive approach for total lipidome analysis and vitamin D metabolite quantification in human serum. Anal. Bioanal. Chem. 2023, 415, 4579–4590. [Google Scholar] [CrossRef] [PubMed]
  18. Yin, S.; Yang, Y.; Wu, L.; Li, Y.; Sun, C. Recent advances in sample preparation and analysis methods for vitamin D and its analogues in different matrices. TrAC Trends Anal. Chem. 2019, 110, 204–220. [Google Scholar] [CrossRef]
  19. Jafri, L.; Khan, A.H.; Siddiqui, A.A.; Mushtaq, S.; Iqbal, R.; Ghani, F.; Siddiqui, I. Comparison of high performance liquid chromatography, radio immunoassay and electrochemiluminescence immunoassay for quantification of serum 25 hydroxy vitamin D. Clin. Biochem. 2011, 44, 864–868. [Google Scholar] [CrossRef]
  20. Le Goff, C.; Cavalier, E.; Souberbielle, J.C.; González-Antuña, A.; Delvin, E. Measurement of circulating 25-hydroxyvitamin D: A historical review. Pract. Lab. Med. 2015, 2, 1–14. [Google Scholar] [CrossRef] [PubMed]
  21. Van Helden, J.; Weiskirchen, R. Experience with the first fully automated chemiluminescence immunoassay for the quantification of 1α, 25-dihydroxy-vitamin D. Clin. Chem. Lab. Med. 2015, 53, 761–770. [Google Scholar] [CrossRef] [PubMed]
  22. Dvořák, P.; Ramos, R.M.; Vyskočil, V.; Rodrigues, J.A. A new electroanalytical methodology for the determination of formaldehyde in wood-based products. Talanta 2020, 217, 121068. [Google Scholar] [CrossRef] [PubMed]
  23. Ramos, R.M.; Brandão, P.F.; Gonçalves, L.M.; Vyskočil, V.; Rodrigues, J.A. Electrochemical sensing of total sulphites in beer using non-modified screen-printed carbon electrodes. J. Inst. Brew. 2017, 123, 45–48. [Google Scholar] [CrossRef]
  24. Pereira, D.F.; Santana, E.R.; Spinelli, A. Electrochemical paper-based analytical devices containing magnetite nanoparticles for the determination of vitamins B2 and B6. Microchem. J. 2022, 179, 107588. [Google Scholar] [CrossRef]
  25. Nallbani, A.; Holubová, J.; Sýs, M.; Arbneshi, T.; Vytřas, K. Voltammetric determination of cholecalciferol at glassy carbon electrode performed in water-ethanol mixture. Potravin. Slovak J. Food Sci. 2018, 12, 166–172. [Google Scholar] [CrossRef]
  26. Hart, J.P.; Norman, M.D.; Lacey, C.J. Voltammetric behaviour of vitamins D2 and D3 at a glassy carbon electrode and their determination in pharmaceutical products by using liquid chromatography with amperometric detection. Analyst 1992, 117, 1441–1445. [Google Scholar] [CrossRef]
  27. Chan, Y.Y.; Yue, Y.; Webster, R.D. Voltammetric studies on vitamins D2 and D3 in organic solvents. Electrochim. Acta 2014, 138, 400–409. [Google Scholar] [CrossRef]
  28. Prakasam, S.; Anthonysamy, E.; Krishnan, G.; Chinnathambi, S. Impact of boron doping on microporous carbon for enhancing the electrochemical sensitivity of vitamin D3. Mater. Chem. Phys. 2023, 296, 127353. [Google Scholar] [CrossRef]
  29. Đurović, A.; Stojanović, Z.; Kravić, S.; Kos, J.; Richtera, L. Electrochemical Determination of Vitamin D3 in Pharmaceutical Products by Using Boron Doped Diamond Electrode. Electroanalysis 2020, 32, 741–748. [Google Scholar] [CrossRef]
  30. Avan, A.A.; Filik, H. Simultaneous Determination of Fat-Soluble Vitamins by Using Modified Glassy Carbon Electrode. Russ. J. Electrochem. 2021, 57, 858–871. [Google Scholar] [CrossRef]
  31. Polli, F.; D’Agostino, C.; Zumpano, R.; De Martino, V.; Favero, G.; Colangelo, L.; Minisola, S.; Mazzei, F. ASu@MNPs-based electrochemical immunosensor for vitamin D3 serum samples analysis. Talanta 2023, 251, 123755. [Google Scholar] [CrossRef] [PubMed]
  32. Kia, S.; Bohlooli, S.; Bahar, S. A Novel Electrochemical Sensor Based on Plastic Antibodies for Vitamin D3 Detection in Real Samples. IEEE Sens. J. 2019, 19, 4752–4757. [Google Scholar] [CrossRef]
  33. Sarkar, T.; Bohidar, H.B.; Solanki, P.R. Carbon dots-modified chitosan based electrochemical biosensing platform for detection of vitamin D. Int. J. Biol. Macromol. 2018, 109, 687–697. [Google Scholar] [CrossRef] [PubMed]
  34. Chauhan, D.; Gupta, P.K.; Solanki, P.R. Electrochemical immunosensor based on magnetite nanoparticles incorporated electrospun polyacrylonitrile nanofibers for Vitamin-D3 detection. Mater. Sci. Eng. C 2018, 93, 145–156. [Google Scholar] [CrossRef] [PubMed]
  35. Chauhan, D.; Kumar, R.; Panda, A.K.; Solanki, P.R. An efficient electrochemical biosensor for Vitamin-D3 detection based on aspartic acid functionalized gadolinium oxide nanorods. J. Mater. Res. Technol. 2019, 8, 5490–5503. [Google Scholar] [CrossRef]
  36. Canevari, T.C.; Cincotto, F.H.; Landers, R.; Machado, S.A.S. Synthesis and characterization of α-nickel (II) hydroxide particles on organic-inorganic matrix and its application in a sensitive electrochemical sensor for vitamin D determination. Electrochim. Acta 2014, 147, 688–695. [Google Scholar] [CrossRef]
  37. Raymundo-Pereira, P.A.; Lima, A.R.F.; Machado, S.A.S. A nanostructured label-free platform based on an ultrathin film for ultrasensitive detection of a secosteroid hormone. RSC Adv. 2016, 6, 34458–34467. [Google Scholar] [CrossRef]
  38. Suarez, L.N.; Thein, S.; Kallinich, C.; Rohn, S. Electrochemical oxidation as a tool for generating vitamin D metabolites. Molecules 2019, 24, 2369. [Google Scholar] [CrossRef]
  39. Cincotto, F.H.; Canevari, T.C.; Machado, S.A.S. Highly sensitive electrochemical sensor for determination of vitamin D in mixtures of water-ethanol. Electroanalysis 2014, 26, 2783–2788. [Google Scholar] [CrossRef]
  40. Gonçalves, L.M.; Moreira, M.M.; Azevedo, C.F.; Valente, I.M.; Sousa, J.C.; Scanlan, T.S.; Compton, R.G.; Rodrigues, J.A. Proof of Concept of the Electrochemical Sensing of 3-Iodothyronamine (T1AM) and Thyronamine (T0AM). ChemElectroChem 2014, 1, 1623–1626. [Google Scholar] [CrossRef]
  41. Gonçalves, L.M.; Batchelor-Mcauley, C.; Barros, A.A.; Compton, R.G. Electrochemical oxidation of adenine: A mixed adsorption and diffusion response on an edge-plane pyrolytic graphite electrode. J. Phys. Chem. C 2010, 114, 14213–14219. [Google Scholar] [CrossRef]
  42. Miller, J.N.; Miller, J.C. Statistics and Chemometrics for Analytical Chemistry, 6th ed.; Pearson Education Limited: London, England, 2010. [Google Scholar]
  43. Méndez, J.H.; Pérez, A.S.; Zamarreño, M.D.; Garcia, M.L.H. Voltammetric determination of vitamin D3 with a rotating glassy carbon electrode. J. Pharm. Biomed. Anal. 1988, 6, 737–741. [Google Scholar] [CrossRef] [PubMed]
  44. Men, K.; Chen, Y.; Liu, J.; Wei, D. Electrochemical detection of vitamin D2 and D3 based on a AuPd modified glassy carbon electrode. Int. J. Electrochem. Sci. 2017, 12, 9555–9564. [Google Scholar] [CrossRef]
  45. Filik, H.; Avan, A.A. Simultaneous electrochemical determination of vitamin K1 and vitamin D3 by using poly (Alizarin red S)/multi-walled carbon nanotubes modified glassy electrode. Curr. Anal. Chem. 2017, 13, 350–360. [Google Scholar] [CrossRef]
  46. Anusha, T.; Bhavani, K.S.; Kumar, J.V.S.; Brahman, P.K. Designing and fabrication of electrochemical nanosensor employing fullerene-C60 and bimetallic nanoparticles composite film for the detection of vitamin D3 in blood samples. Diam. Relat. Mater. 2020, 104, 107761. [Google Scholar] [CrossRef]
Figure 1. Molecular structures of Vitamin D2 (ergocalciferol) and Vitamin D3 (cholecalciferol).
Chemosensors 11 00575 g001
Figure 2. Cyclic voltammograms of 1.0 mmol L−1 Vitamin D3 in 0.1 M LiClO4 prepared in methanol, ethanol, 2-propanol, and acetonitrile using the GCE. Voltammograms were measured between 0 V and +1.5 V; scan rate of 50 mV s−1; step potential of 10 mV.
Chemosensors 11 00575 g002
Figure 3. (A) Cyclic voltammograms of 0.1 mmol L−1 Vitamin D3 in 0.1 M LiClO4 prepared in different proportions of ethanol/water. Voltammograms were measured between 0 V and +1.5 V; scan rate of 50 mV s−1; step potential of 10 mV. (B) Peak current intensity variation with ethanol content. Three replicates were performed for each ethanol content.
Chemosensors 11 00575 g003
Figure 4. (A) Cyclic voltammograms of 0.1 mmol L−1 Vitamin D3 in 0.1 M LiClO4 prepared in 50% ethanol, measured on the GCE between 0 V and +1.5 V with a step potential of 10 mV. Inset A: logarithm of scan rate versus logarithm of peak current; (B) Cyclic voltammograms of 1.53 mmol L−1 Vitamin D3 in 0.1 M LiClO4 prepared in 50% ethanol, measured on the SPCE between 0 V and +1.2 V with a step potential of 10 mV. Inset B: logarithm of scan rate versus logarithm of peak current. The data shown in a solid red line represents the selected optimal parameter.
Chemosensors 11 00575 g004
Figure 5. Square-wave voltammograms obtained for different Vitamin D3 standard solutions using the GCE (A) and SPCE (B). Voltammograms were obtained in the range between 0 and +1.5 V for the GCE and between 0 and +1.2 V for the SPCE, using the optimized electrochemical conditions. For the SPCE square-wave voltammograms, a moving-average baseline correction was used.
Chemosensors 11 00575 g005
Table 1. Analytical parameters of the developed method, using the unmodified GCE and SPCE, for the SWV determination of Vitamin D3.
Parameters GCESPCE
Linear concentration range (µmol L−1) 0.47–12359.4–1651
r2 0.99810.9934
LOD (µmol L−1) 0.1719.4
LOQ (µmol L−1) 0.5664.7
Repeatability (% RSD)C14.95.2
C23.65.9
C34.15.0
Intermediate precision (% RSD)C15.57.1
C24.56.8
C34.96.2
Table 2. Determination of Vitamin D3 in supplements.
SampleVitamin D3 Content (µg Tablet−1) a,bDeclared Amount
(µg Tablet−1)
SWV-GCESWV-SPCE
117.19 ± 0.07 (15%)<LOD15
225.22 ± 0.10 (0.9%)<LOD25
397.8 ± 0.4 (2%)96.2 ± 12.3 (4%)100
a results are expressed as mean ± SD (relative error, %). b n = 3.
Table 3. Comparison of voltametric methods for the determination of Vitamin D3.
ElectrodeTechniqueLinearity
(µmol L−1)
LOD
(µmol L−1)
Ref.
GCEDirect current voltammetry2.0–4001.49[43]
GCEDPV5.0–500.12[39]
GCEDPV2.4–3500.8[25]
BDDESWV2–2000.17[29]
GCE-poly(ARS)MWCNTsSWV8.0–1605.0[45]
GCE-SiO2/GO/Ni(OH)2DPV0.25–2.50.003[36]
GCE-AuPdDPV5.0–500.18[44]
GCE-LaNiO3SWV0–260.83[37]
GCE-BMCAmperometry0.5–421.45[28]
GCE-CuNPs-NiNPs@reduced-fullerene-C60SWV1.25–4750.0025[46]
GCESWV0.47–1230.17This work
SPCESWV59.4–165119.4This work
GCE/poly(ARS)MWCNTs: GCE modified with poly (Alizarin red S)/multi-walled carbon nanotubes; GCE-SiO2/GO/Ni(OH)2: GCE modified with amorphous nickel (II) hydroxide particles on a hybrid material composed of silica and graphene oxide; GCE-BMC: GCE modified with boron-doped microporous carbon; GCE-CuNPs-NiNPs@reduced-fullerene-C60: GCE modified with copper and nickel bimetallic nanoparticles decorated on reduced-fullerene-C60 nanocomposite film.
Disclaimer/Publisher’s Note: The statements, opinions and data contained in all publications are solely those of the individual author(s) and contributor(s) and not of MDPI and/or the editor(s). MDPI and/or the editor(s) disclaim responsibility for any injury to people or property resulting from any ideas, methods, instructions or products referred to in the content.

