1. Introduction
Reactive oxygen species (ROS) in plants refer to a group of highly reactive molecules that contain oxygen and are involved in a variety of physiological processes, including plant growth, development, and responses to both biotic and abiotic stresses [
1,
2]. Plants produce several types of ROS, including superoxide radicals, hydrogen peroxide, singlet oxygen, and others [
3,
4,
5,
6]. These ROS molecules, when present at low levels, can serve as signaling molecules that regulate various facets of plant growth and development, encompassing cell division and differentiation [
1]. Furthermore, ROS can activate defense responses in plants, enabling them to combat biotic and abiotic stressors [
4]. However, an excessive accumulation of ROS can be detrimental to plants, causing oxidative stress and cellular damage [
3,
7]. Plant stress can affect the concentration of ROS in different ways depending on the type and intensity of the stressor. Generally, many abiotic and biotic stressors can lead to an increase in ROS production in plant cells [
1].
Abiotic stress factors, like high temperatures [
8], drought [
9], salinity [
10], exposure to herbicides, and heavy metals [
11], can disrupt the delicate equilibrium between ROS production and ROS scavenging in plants [
12]. This can result in an accumulation of ROS, which can lead to oxidative damage to cellular components and impaired plant growth and development. For example, drought and salt stress can lead to the accumulation of H
2O
2 and other ROS in plant cells, which can cause osmotic stress, membrane damage, reduced photosynthesis, and impaired plant growth.
Salt stress can induce the production of H
2O
2 through multiple mechanisms [
5,
13]. One mechanism is through the activation of nicotinamide adenine dinucleotide phosphate (NADPH) oxidases (NOXs), which produce superoxide radicals that can be converted to H
2O
2 by superoxide dismutase (SOD) [
14,
15]. Another mechanism is through the disruption of photosynthetic electron transport, which can lead to the production of excess electrons and the formation of H
2O
2 by the Mehler reaction [
16].
Biotic stressors, such as pathogen infection and herbivory [
17], can also stimulate an increase in ROS production in plants.
Hence, it is crucial for plants to maintain a balance between ROS production and scavenging to prevent excessive oxidative stress. Plants have developed various mechanisms to regulate ROS levels, including the synthesis of antioxidant enzymes like catalase, peroxidase, and superoxide dismutase [
18]. These enzymes effectively scavenge excess H
2O
2 and other ROS, mitigating oxidative stress and minimizing damage to plant cells [
19]. Understanding the regulation of ROS, particularly H
2O
2, in plants is an active area of research with significant implications for comprehending plant physiology, stress responses, and the development of strategies to enhance plant growth, productivity, and stress tolerance [
20,
21].
There are several methods available for determining the concentration of H
2O
2 in plants. Biochemical assays [
22,
23] involve extracting H
2O
2 from plant tissues and quantifying its concentration using a redox-sensitive dye such as titanium sulfate or leuco crystal violet [
24,
25]. The dye reacts with H
2O
2, producing a colored product that can be measured using spectrophotometry.
Fluorometric assays [
26] involve using fluorescent probes that selectively react with H
2O
2, generating a fluorescent signal that can be quantified with a fluorometer. A widely used fluorometric probe is 2′,7′-dichlorofluorescein diacetate (DCFH-DA), which is converted to the fluorescent compound DCF upon reaction with H
2O
2 [
27].
Spectrophotometric assays employ spectrophotometry to measure the absorption of a colored product resulting from the reaction between H
2O
2 and a specific substrate. Guaiacol is a typical substrate used in this method, reacting with H
2O
2 in the presence of peroxidase to produce a brown color that can be measured using spectrophotometry [
28,
29].
Electrochemical methods involve the use of electrodes capable of detecting changes in H
2O
2 concentration. Amperometric and potentiometric electrodes are commonly used to measure H
2O
2 concentration in plant tissues [
30,
31,
32].
Overall, the choice of method for H2O2 determination in plants depends on factors such as the sensitivity, specificity, and cost of the method, as well as the specific research question being addressed.
Electrochemical methods provide several advantages compared to other approaches for quantifying H
2O
2 concentration in plants. Electrochemical sensors demonstrate high sensitivity and are capable of detecting low H
2O
2 concentrations in the nanomolar or micromolar range [
33,
34]. Electrochemical methods allow for the real-time, non-destructive measurement of H
2O
2 levels in plant tissues [
10]. Electrochemical methods exhibit high selectivity for H
2O
2, enabling researchers to measure H
2O
2 concentrations in the presence of other ROS or interfering compounds. Electrochemical sensors can be miniaturized and integrated into portable devices, making them suitable for on-site or field-based measurements of H
2O
2 in plants [
35]. Furthermore, electrochemical sensors are cost-effective compared to other analytical methods, making them accessible to researchers with limited budgets and allowing for mass production.
Both enzymatic and non-enzymatic electrochemical sensors are utilized for H2O2 detection.
Enzymatic sensors employ the enzyme horseradish peroxidase (HRP) to catalyze the reduction of H
2O
2 [
36,
37,
38]. This reaction generates an electrical current proportional to the H
2O
2 concentration in the sample. Enzymatic sensors offer high selectivity for H
2O
2 and can detect nanomolar concentrations. However, due to the inherent instability of enzymes, such electrodes are susceptible to temperature and environmental influences and can be easily damaged.
Non-enzymatic sensors, on the other hand, utilize materials such as metal oxides [
39,
40], carbon materials [
41], or conducting polymers [
42] that exhibit sensitivity to H
2O
2. Non-enzymatic sensors operate based on a direct chemical reaction between the analyte and the electrode material’s surface. Manufacturing non-enzymatic sensors is more cost-effective, and they tend to be more stable and have a longer lifespan compared to enzymatic sensors. However, they may exhibit slightly lower sensitivity than enzyme sensors. To enhance the sensitivity of non-enzymatic sensors, smooth-film coatings can be replaced with nanostructured ones. Nanostructures increase the surface area of the working electrode, providing more reactive sites for H
2O
2 interaction [
43,
44]. Additionally, nanostructures can facilitate the electron transport between the sensor and H
2O
2 molecules, thereby improving detection accuracy and speed.
Some of the most common materials used for detecting hydrogen peroxide are metal oxides (CuO, Co
3O
4, TiO
2, etc.) [
45,
46]. When H
2O
2 comes into contact with metal-oxide nanostructures, several processes can occur [
46,
47]. During the adsorption process, H
2O
2 molecules are adsorbed onto the surface of metal-oxide nanostructures through hydrogen bonding or other interactions, which can affect the concentration and reactivity of H
2O
2. The adsorption process can be influenced by the surface charge and functional groups of the nanostructures. Also, along with other processes, electron transfer reactions take place: metal-oxide nanostructures undergo electron transfer with H
2O
2, leading to the generation of reactive oxygen species such as hydroxyl radicals (
●OH). This process is known as the Fenton reaction [
48] and can be enhanced by the presence of transition metal ions such as iron or copper. The second process is catalytic decomposition, where metal-oxide nanostructures act as catalysts for the breakdown of H
2O
2 into water and oxygen. The high surface area and active sites of the nanostructures accelerates this reaction.
Overall, the interaction between metal-oxide nanostructures and H2O2 can lead to changes in the electrical properties of the metal oxide surface, which can be measured by an electrochemical sensor to detect the presence and concentration of H2O2.
To enhance the performance of electrochemical sensors, a multisensor system can be employed, utilizing multiple electrodes modified with electroactive materials [
49,
50]. Incorporating multiple electrodes expands the possibilities for signal modeling, significantly enhances measurement accuracy, and provides additional information about the composition of the solution due to cross sensitivity and complementary electroactive properties of the electrodes made from different materials. This approach can improve sensor selectivity for the analyzed analyte and enable the detection of trace amounts. Moreover, a multisensor system enables the simultaneous detection of multiple analytes, which is crucial for monitoring complex compositions and tracing the concentration dependence of one component on another.
The purpose of this article is to study the influence of various stress factors on the growth and vital functions of rye seedlings and also to develop an electrochemical sensor based on nanostructured CuO and Co3O4 electrodes, which makes it possible to determine the amount of H2O2 released in plant tissues under the influence of oxidative stress in real samples of rye juice.
2. Materials and Methods
2.1. Materials
Ammonium persulfate ((NH4)2S2O8, CAS number: 7727-54-0), sodium hydroxide (NaOH, CAS number: 1310-73-2), cobalt(II) chloride hexahydrate, (CoCl2·6H2O, CAS number: 7791-13-1), urea NH2CONH2 (CAS number: 57-13-6), sodium chloride (NaCl, CAS number: 7647-14-5), potassium nitrate (KNO3, CAS number: 7757-79-1), glucose (C6H12O6, CAS number: 50-99-7) citric acid (HOC(COOH)(CH2COOH)2, CAS number: 77-92-9), ascorbic acid (C6H8O6 CAS number: 50-81-7), and hydrogen peroxide solution (H2O2, 30%, CAS number: 7722-84-1) were purchased from Merck. All reagents were ≥99.8% pure. Copper and iron wires of 2 mm thickness (99.9% purity) were purchased from Sigma-Aldrich. Ag/AgCl wire was purchased from A-M Systems, USA. Carbon rods (5 mm diameter) were purchased from Sigma-Aldrich. Rye seeds (Secale Cereale L. TORAF, batch PL81604335/27TDC/1) were purchased from a local store. Distilled water was obtained in the laboratory.
2.2. Synthesis of Nanostructured Samples
Electrodes coated with nanostructured CuO were obtained by a one-step chemical hydrothermal oxidation route. To accomplish this, copper wire was cut into 6 cm long pieces and thoroughly rinsed with both water and ethanol to eliminate any potential surface contamination. Subsequently, the cleaned wire segments were vertically affixed onto the surface of a petri dish using heat-resistant foam. To prepare the working solution, 10 mL of a 10 M NaOH solution and 5 mL of a 1 M (NH
4)
2S
2O
8 solution were combined with 26 mL of distilled water. The resulting solution was transferred into a heat-resistant glass beaker, and the wire samples were immersed in the solution. The petri dish was used to cover the beaker. The beaker, containing the solution and wire samples, was placed inside a preheated oven set at 90 °C for 3 h, followed by natural cooling. Afterward, the obtained samples, now coated with a nanostructured oxide layer, were thoroughly rinsed with distilled water to eliminate any residual reagents. Finally, they were dried in an oven at 90 °C for 3 h to remove any remaining moisture. To minimize environmental effects, the samples were stored in a vacuum desiccator until the moment of use. The synthesis process was described in more detail in publication [
51].
Electrodes coated with nanostructured Co3O4 were obtained using a hydrothermal synthesis method. Iron wire was used as a base for the nanostructured layer. Before the synthesis of the coating, the wire was treated with fine sandpaper and immersed in 0.1 M HCl to increase the roughness of the electrode surface and improve the adhesion of the nanostructures. The wire was then cut into 6 cm long pieces, rinsed with water and ethanol, and fixed in a glass beaker following the same procedure as the CuO samples mentioned above. For the synthesis, an equimolar aqueous solution of 0.1 M CoCl2·6H2O and NH2CONH2 was mixed in 80 mL of distilled water to form a growth solution. The solution was poured into glass beaker, and the pre-treated iron wire was placed in the beaker. The beaker with the solution and wire was then placed in a preheated oven. The growth of nanostructures took place 5 h at 95 °C, resulting in a dull pink Co(OH)2 coating. After cooling to room temperature, the wire electrodes were washed with distilled water several times to remove residual reagents and then dried at 90 °C for 3 h. Subsequently, the growth process was followed by thermal decomposition of Co(OH)2 for 1 h at 450 °C to obtain Co3O4. After annealing, a black and homogeneous Co3O4 coating was observed on the surface of the wire electrodes. The morphology of the CuO and Co3O4 nanostructures was studied by the Field Emission Scanning Electron Microscopy (FESEM) MAIA3 (Tescan Group, Brno-Kohoutovice, Czech Republic).
2.3. Rye Seedling Cultivation and Sample Preparation
To investigate the impact of stress factors, the samples were divided into four groups, with each group containing four containers: control, NaCl-treated, glyphosate-treated, and H2O2-treated. The seed germination process utilized a universal soil for indoor plants, and all samples were subjected to the same growth conditions, except for the composition of the watering solution.
During the seed germination and initial growth stages, all samples received a daily watering of 20 mL of deionized water per container for a period of 10 days. From day 11 onwards, the control group continued to receive 20 mL of water daily, while the other groups were watered with 20 mL of a 100 mM NaCl solution, 20 mL of a 100 μL/50 mL glyphosate solution, and 20 mL of a 1.5% H2O2 solution, respectively. This watering regimen was maintained for an additional 10 days. At the end of the 10-day period, morphological differences among the samples were assessed through control measurements. On day 11, rye samples were harvested to obtain an extract. The leaves were cut into small pieces, crushed using a mortar and pestle, and then placed in 96% ethanol for spectrometric measurements or NaOH supporting electrolyte for electrochemical measurements. For optical measurements, 250 mg of green mass per 5 mL of alcohol was used, while for electrochemical measurements, 10 g of green mass per 250 mL of supporting electrolyte was employed. The samples were left overnight in a cool, dark place to facilitate extraction. Prior to measurement, the solutions were filtered to remove solid particles.
2.4. Optical Mesurements
The amount of chlorophyll is one of the most important indicators of plant life, and its decrease is an important indicator for assessing the impact of stress factors. In this study, the chlorophyll content of photosystem II (PSII) and photosystem I (PSI) were analyzed by extracting chlorophyll from leaves of rye seedlings that were either untreated or treated with different stress factors.
To perform the analysis, a working solution was prepared as described in the previous section and poured into a 5 mL transparent cuvette for measurement. Five replicates were performed for each treatment group. The samples were analyzed using a UV-Visible two-beam spectrophotometer SHIMADZU UV-2550PC (Shimadzu Corporation, Kioto, Japan). The absorbance of each treatment sample was measured at wavelengths of 645 and 663 nm to determine the quantities of chlorophyll
a and
b, respectively. The measurement error was less than 2%. The estimation of chlorophyll content was conducted utilizing Arnon’s Equations (1) and (2) [
52,
53,
54]:
where V—volume of the extract in mL; W—weight of fresh leaves in mg; A663—solution absorbance at 663 nm; and A645—solution absorbance at 645 nm.
2.5. Electrochemical Measurements
The measurements were carried out using a custom device that allowed simultaneous measurements and data acquisition from two working electrodes with different chemical composition. To validate the accuracy of the setup, electrochemical measurements under absolutely identical conditions were carried out separately for each oxide using an electrochemical station Zahner Zennium X (Zahner-Elektrik GmbH & Co., Kronach, Germany). During the measurement, a three-electrode cell configuration was adopted. The working electrodes consisted of the nanostructure-coated wires. Additionally, a 2 mm diameter Ag/AgCl wire was employed as the reference electrode, while a 5 mm diameter carbon rod served as the counter electrode.
Cyclic voltammetry (CV) was performed within specific voltage ranges for each electrode. For the Co3O4 nanostructured electrode, the voltage range was set from −1.3 V to 0.5 V vs. Ag/AgCl, with Estart = 0 V and a scan rate of 100 mV·s−1. For the CuO electrode, the voltage range was −0.8 V to 0.1 V vs. Ag/AgCl, with Estart = 0 V and a scan rate of 100 mV·s−1. The supporting electrolyte used was 0.1 M NaOH, providing an optimal pH level of 13.
To assess the sensitivity of the electrodes, different concentrations of H2O2 ranging from 25 μM to 5 mM were added to the supporting electrolyte.
In the current response study, a constant voltage was applied to the cell, and the resulting current was measured. Precisely, a constant voltage of U = −1.23 V vs. Ag/AgCl was applied to the cell for the Co3O4-nanostructured electrode, and a constant voltage of U = −0.7 V vs. Ag/AgCl was applied for the CuO electrode. These potential values were taken from the left reduction peaks from CV graphs obtained at a scanning speed of 100 mV/s. The measurements were conducted in 0.1 M NaOH supporting electrolyte. The measurements were started in the supporting electrolyte without hydrogen peroxide, and after a stabilization period of 120 s, the first 25 µM portion of H2O2 was added. Subsequent portions were added every 120 s. The measurements were conducted with constant stirring using a magnetic stirrer in a water bath at a constant temperature of 25 °C.
To obtain a calibration curve, H2O2 concentrations from 25 µM to 7 mM were added. Interference studies were also conducted to ensure that there were no false-positive enhancements in the electrochemical response caused by interfering substances. To assess this, 100 µM portions of the most likely interferents, such as NaCl, KNO3, glucose, citric acid, and ascorbic acid, were added to the supporting electrolyte. In the process of testing the sensor, we used different ratios of H2O2 and interferents (including cases where the concentration of the interferent notably exceeded the concentration of the analyte). Since in the process it was found that the ratio between the concentrations of the analyte and interferents did not affect the result obtained, we decided to adhere to an equimolar ratio, as in most similar publications. In the study of real samples, a NaOH-based extract was used.
Since the amount of H2O2 released under the influence of stress factors is unknown, during the measurement process, a number of known concentrations were added to the extract and the chronoamperogram was taken. After the necessary calculations with reference to the calibration graph were obtained for the supporting electrolyte, the concentration of the found H2O2 was calculated. The amount of H2O2 released in the plants as a result of exposure to stress factors was taken to be the difference between the total amount of peroxide found and that added artificially during the measurement process.
The infusion of peroxide took place at a strictly defined time, and the current value was calculated as the average of the points on the chronoamperogram over a certain period of time. To obtain data on the found amount of peroxide indicated in Results and Discussion section, averaged data based on several batches of samples were used.
3. Results and Discussion
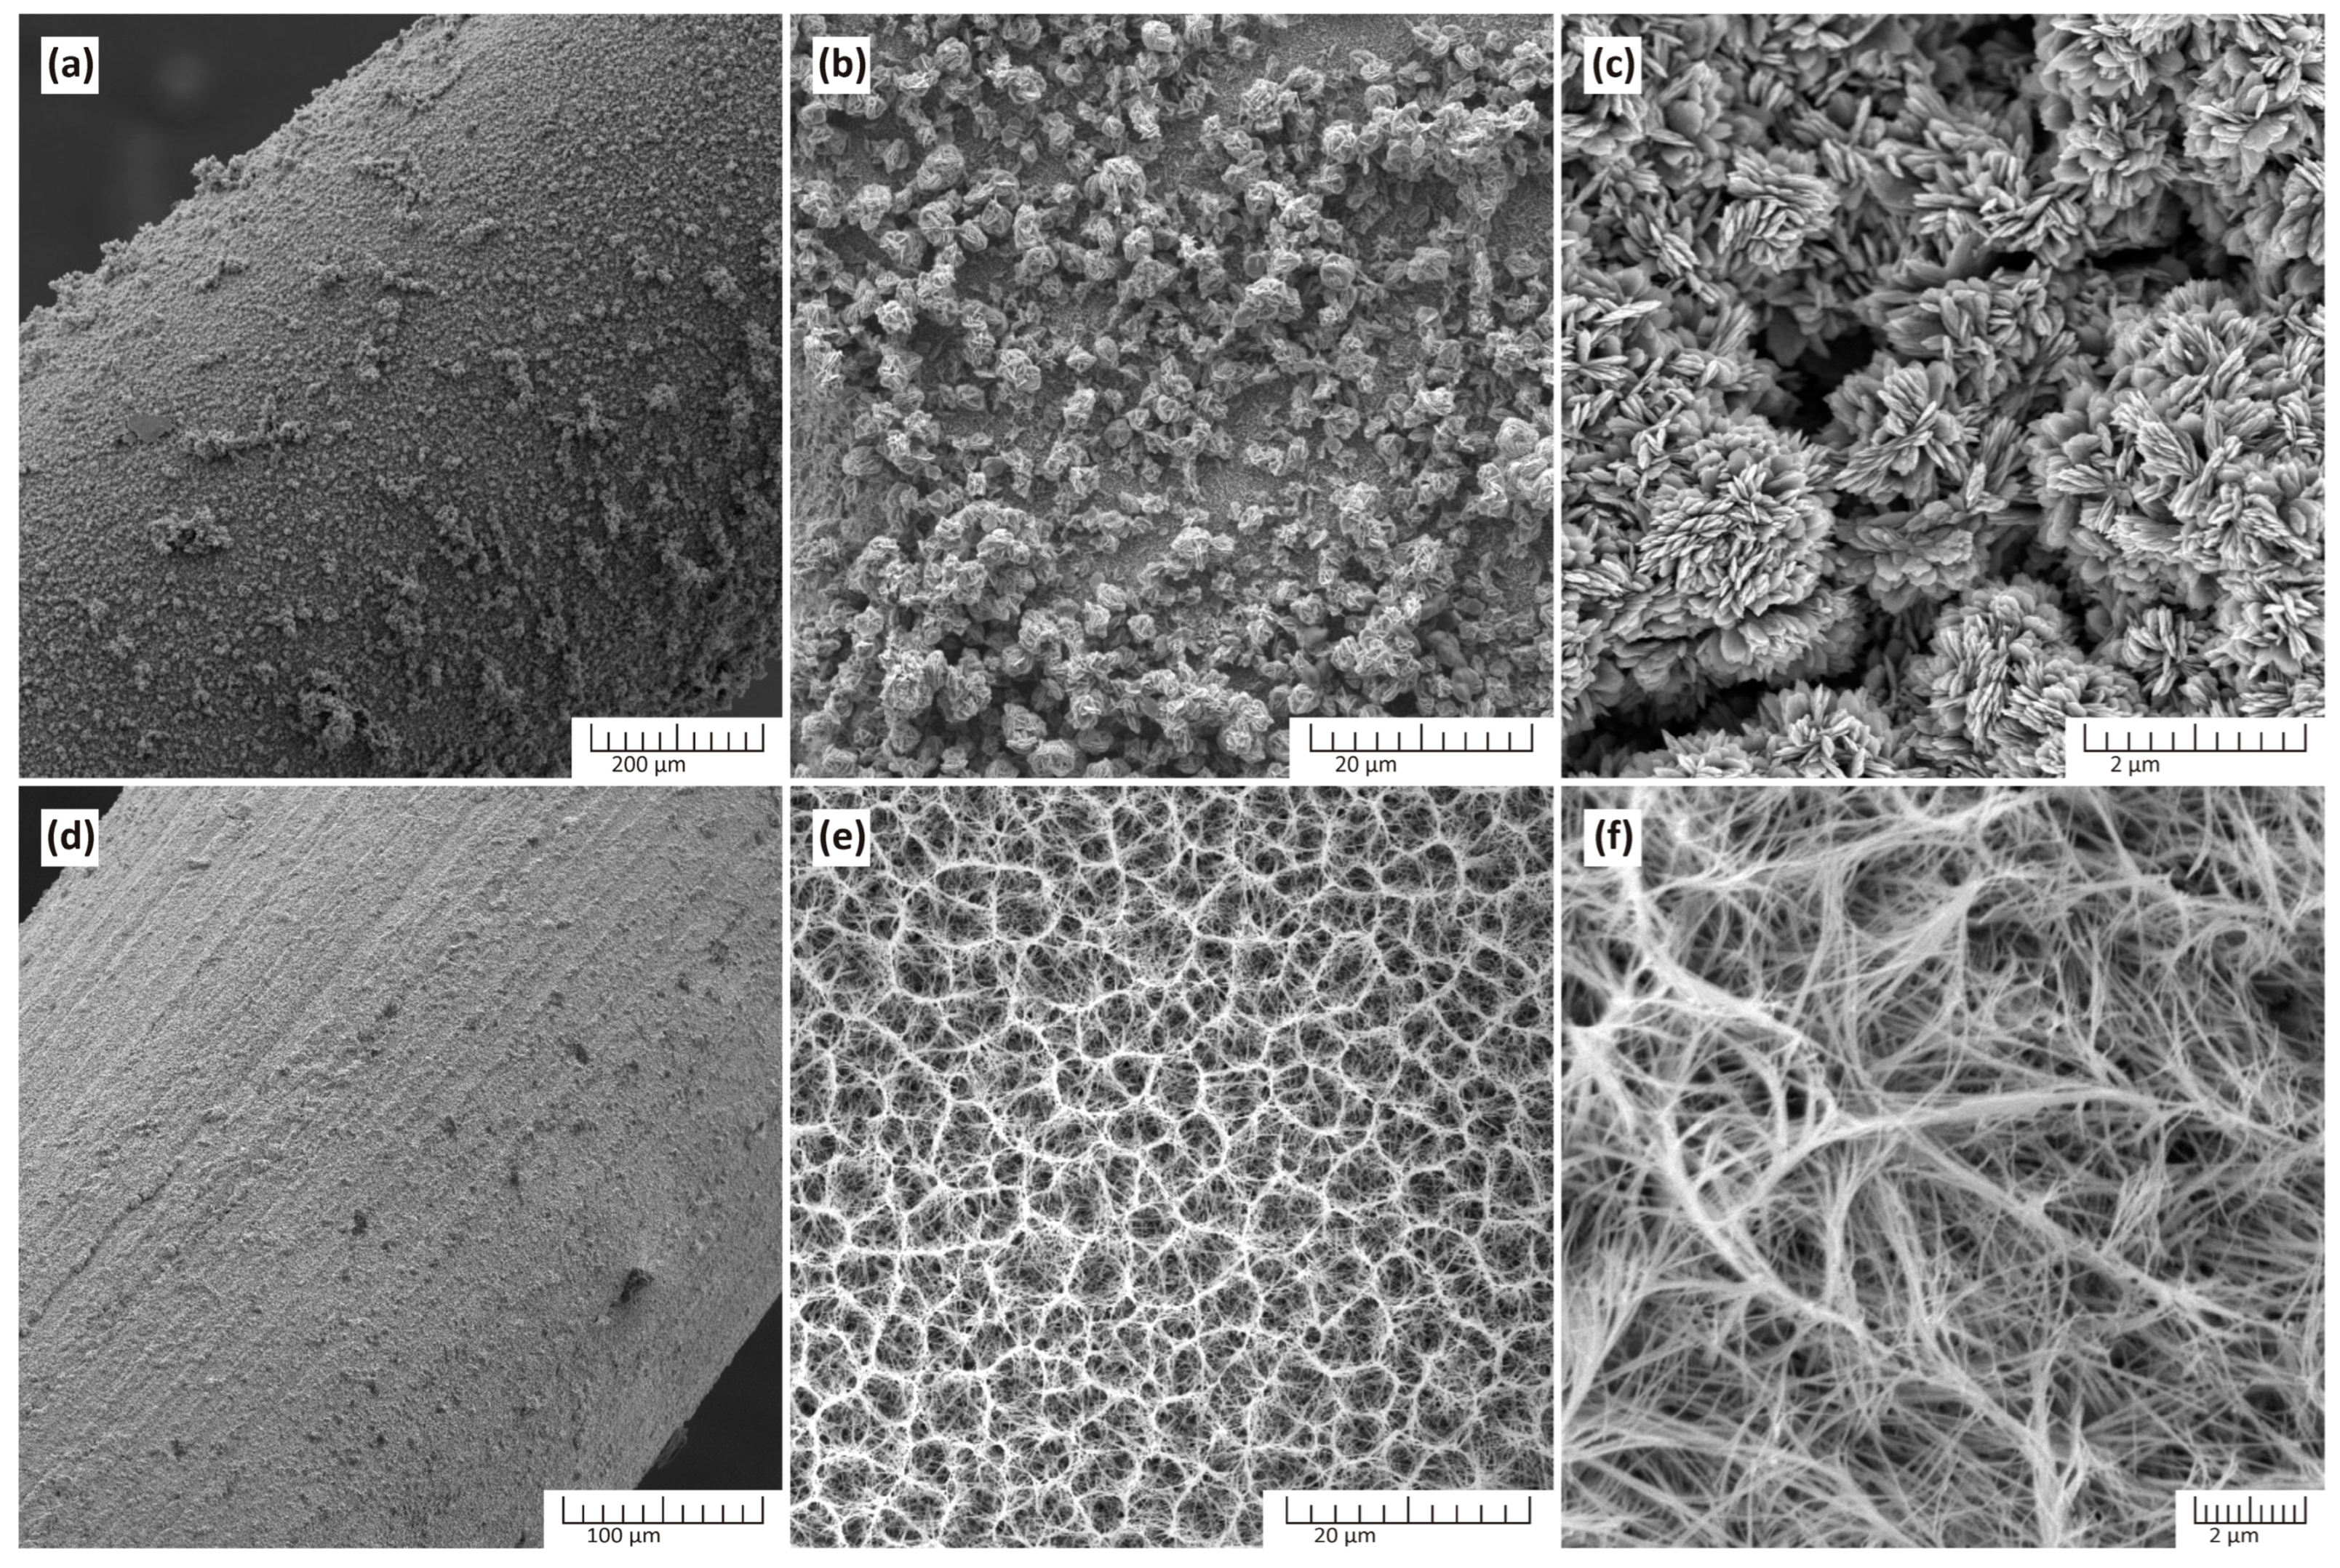
Figure 1a–c display the results of theFESEM analysis, showing the morphology of the CuO layer obtained through chemical hydrothermal oxidation. The black coating exhibited excellent uniformity (
Figure 1a), strong adhesion to the copper surface, and stability during post-processing. It consisted of a dense layer of nanopetals that were clustered together in 3D flower-like structures with a micrometer size (
Figure 1b,c). The growth mechanism of the nanostructures followed a series of chemical reactions outlined by Equations (3)–(5):
The addition of NaOH to the precursor solution containing (NH4)2S2O8 released Cu2+ ions from the copper, which interacted with the reagents according to Equation (3). However, when the concentration of NaOH was increased to 10–15 mM, the dissolution-secondary precipitation mechanism was activated. In this process, Cu(OH)2 reacted with OH- ions, forming the complex ion [Cu(OH)4]2− as illustrated in Equation (4). These complex ions decomposed to CuO, resulting in the loss of two hydroxyl ions and one water molecule, as depicted in Equation (5).
SEM images of the Co
3O
4 nanostructures are presented in
Figure 1d–f, revealing a uniform and porous network of long nanofibers covering the wire surface.
The typical reactions involved in the formation of the nanoporous Co
3O
4 nanostructure are summarized as follows:
The growth process included the hydrothermal synthesis of cobalt hydroxide (Equations (6)–(9)) and its thermal decomposition to cobalt oxide (Equation (10)).
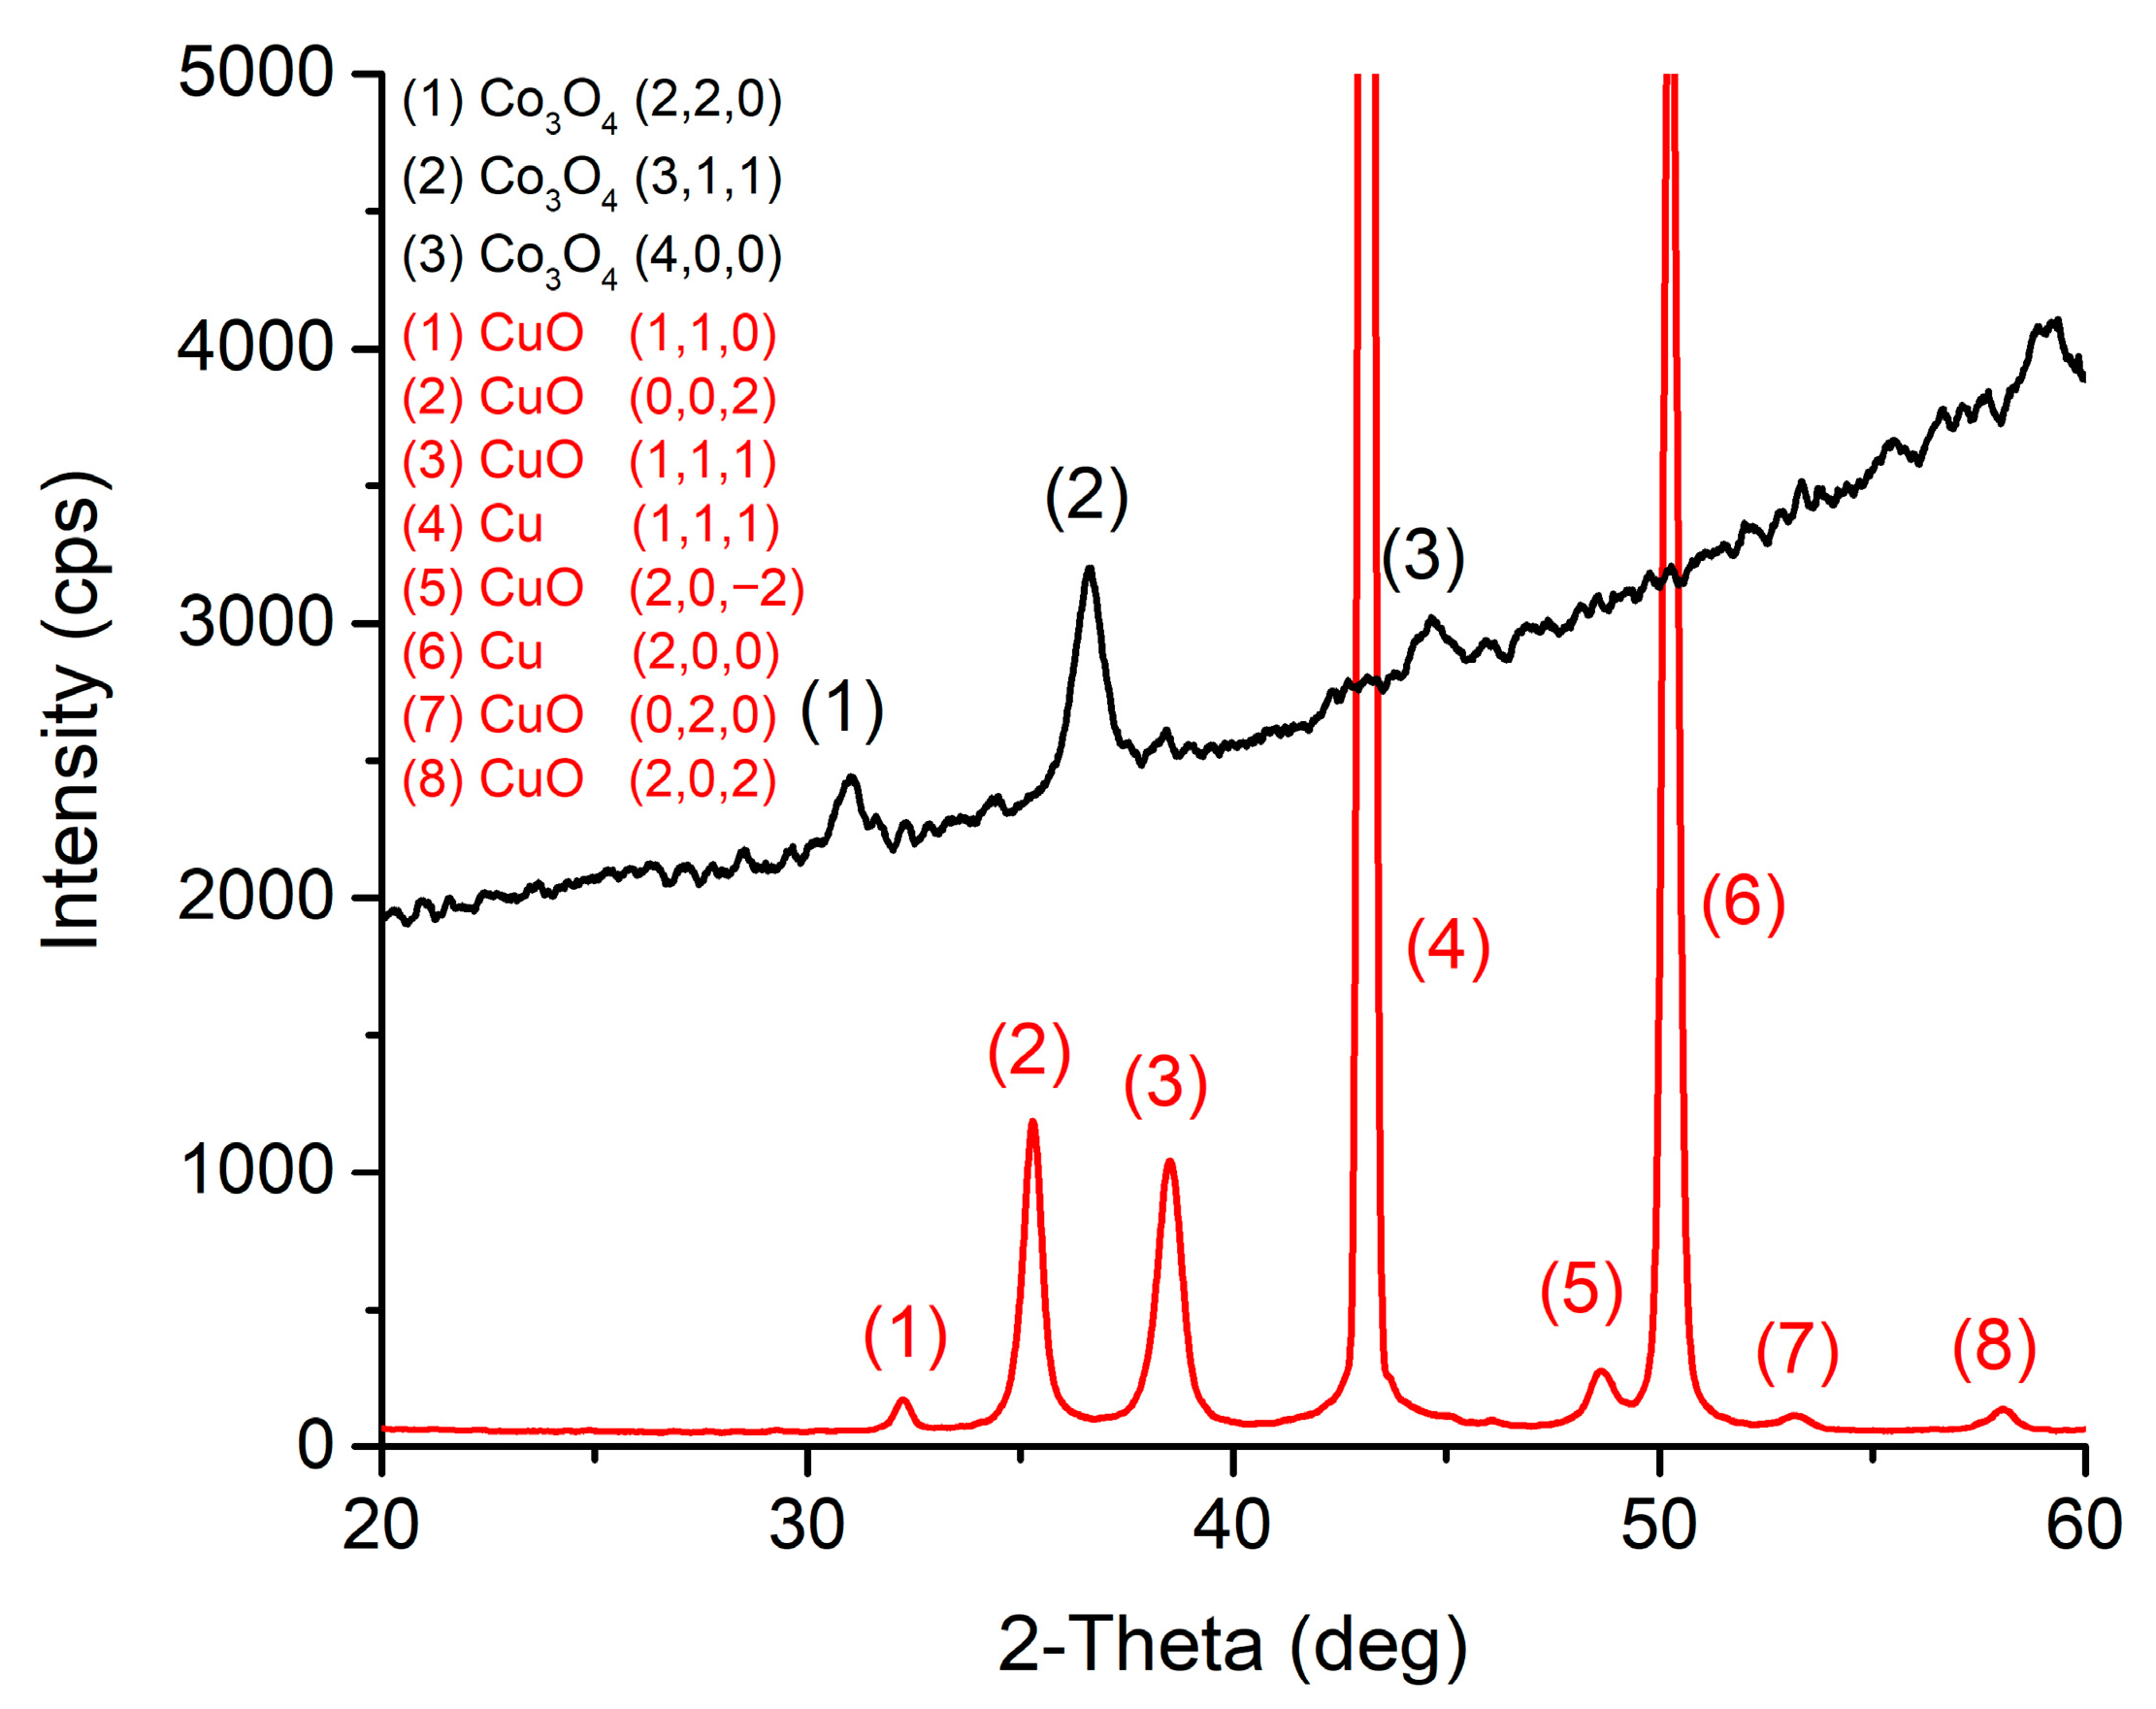
Figure 2 shows X-ray diffraction patterns of the obtained nanostructures. The patterns indicated the presence of only crystalline phases corresponding to CuO and Co
3O
4, confirming their high purity. No inclusions with other chemical compositions were observed. The samples exhibited a relatively high degree of crystallinity, although the intensity of characteristic peaks for Co
3O
4 was lower compared to CuO. This was probably due to the fine fibrous porous structure of the Co
3O
4 sample and to the peculiarities of the growth process and the fact that the copper oxide used the substrate material itself rather than the solution as a precursor source.
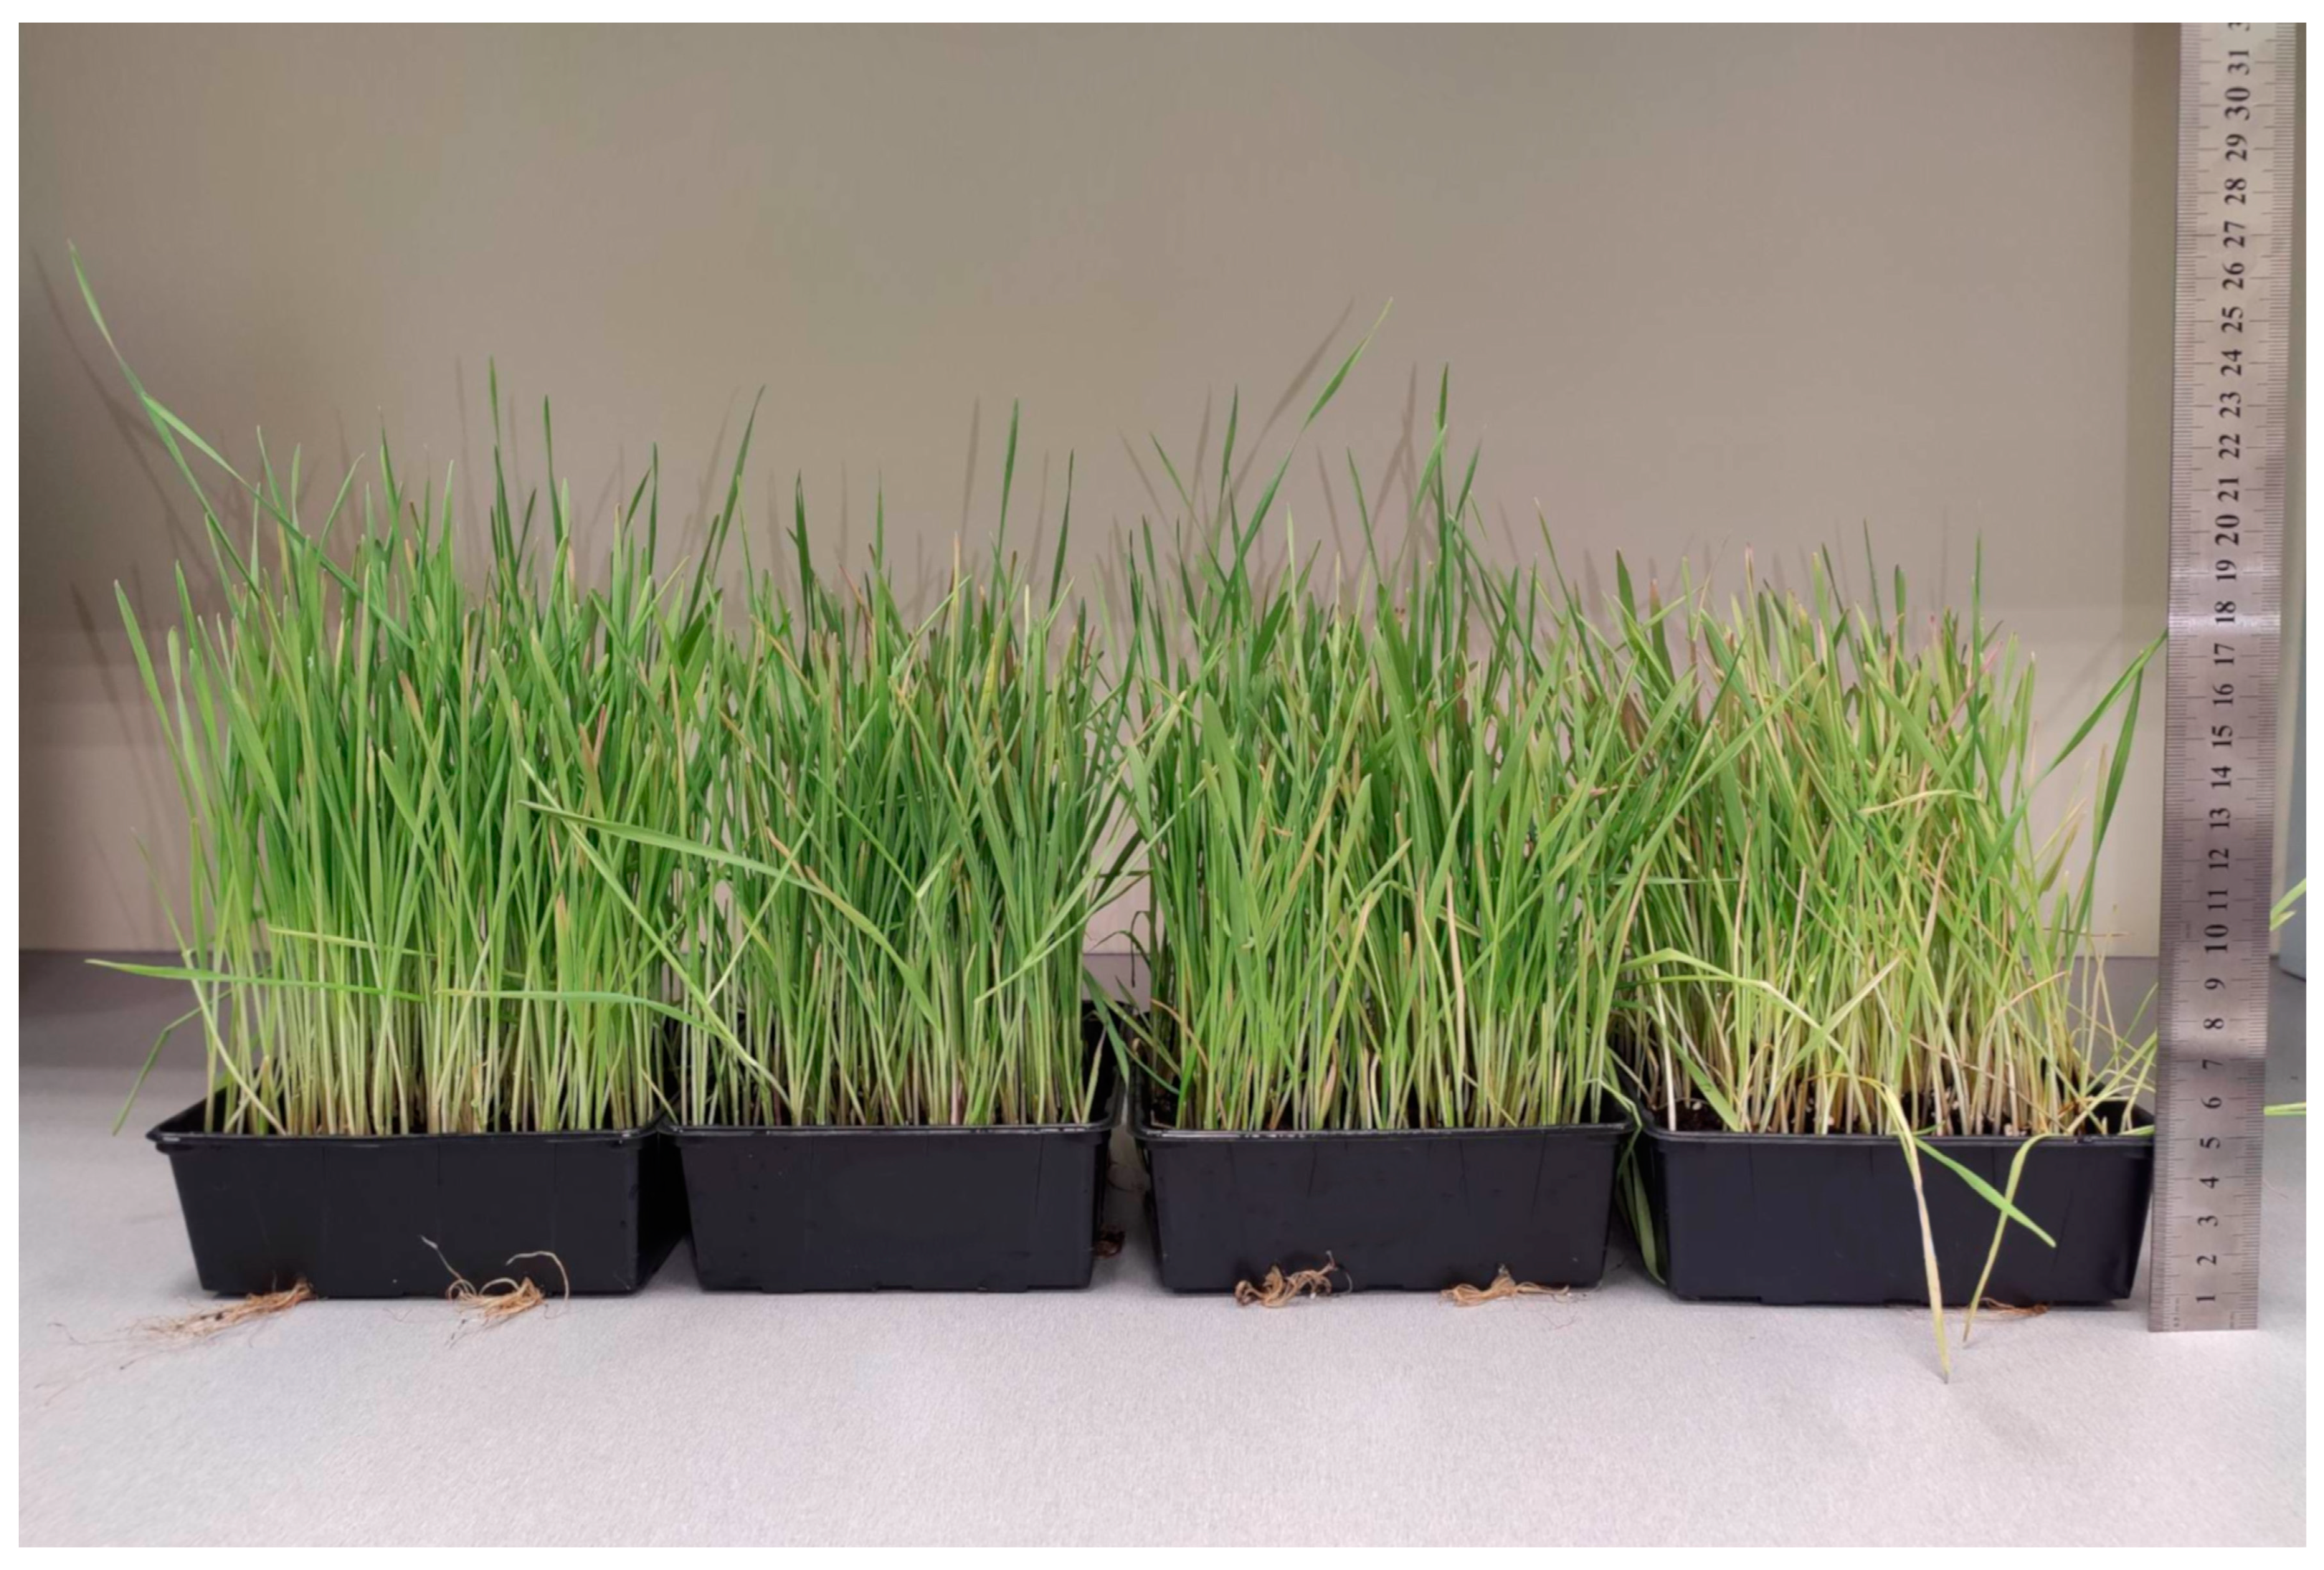
Figure 3 shows the rye samples at the time of cutting, arranged from left to right: control, NaCl-treated, H
2O
2-treated, and glyphosate-treated. After cutting and measuring the length of the seedlings, the following trend was observed: the control sample exhibited the longest seedling length (average 20 cm, maximum 23 cm), followed by the peroxide-treated sample (average 19 cm, maximum 23 cm), the NaCl-treated sample (average 17 cm, maximum 19 cm), and the glyphosate-treated sample with the shortest length (average 16 cm, maximum 19 cm). Furthermore, in the NaCl- and glyphosate-treated samples, an increased presence of mold was observed on the soil surface, indicating a suppression of plant resistance to fungal diseases under the influence of stress factors.
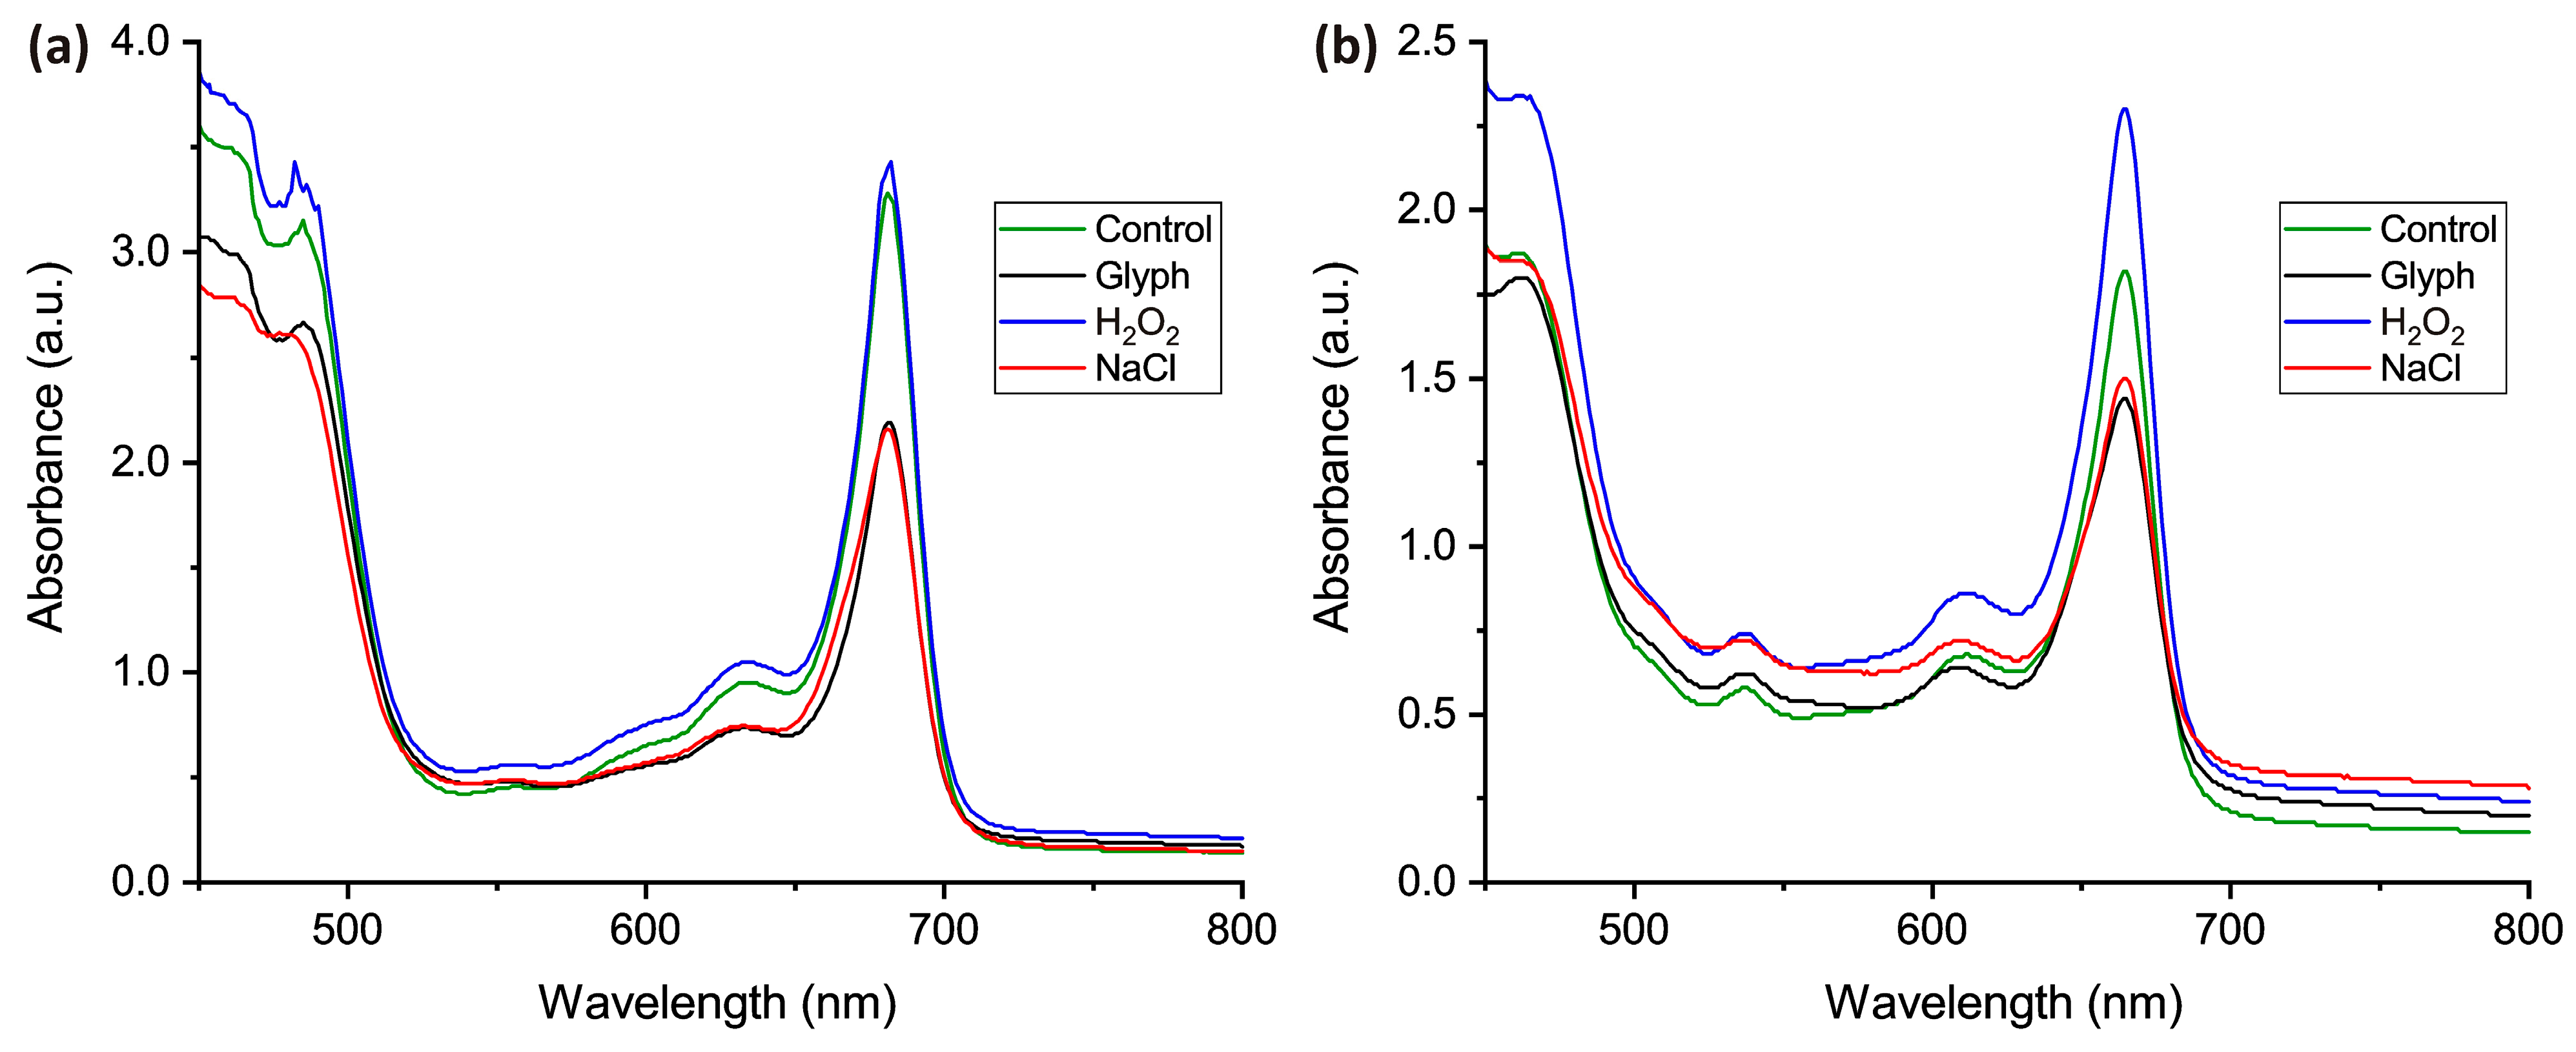
In
Figure 4, the absorption spectra of rye extracts are presented. It is noteworthy that the concentration of chlorophyll in the freshly prepared samples appeared to be higher in the case of H
2O
2 watering, even surpassing the control sample. This finding demonstrates that the addition of small concentrations of H
2O
2 to irrigation not only does not harm plants but actually has a positive impact. It can stimulate root growth, enhance nutrient absorption, and improve overall plant growth and development. H
2O
2 can assist in breaking down organic matter in the soil, thereby releasing essential nutrients needed for plant growth.
In contrast, the plants watered with glyphosate and NaCl exhibited a significantly lower concentration of chlorophyll
a and chlorophyll
b compared to the control samples. This observation suggests that plant vital functions decrease significantly under the influence of these stress factors. It is important to note that the effect of NaCl was comparable to that of glyphosate, a potent herbicide, confirming the harmful impact of increased soil salinity. After storing the samples in a dark and cold environment for a week, all the samples demonstrated a reduction in transmission, indicating a general decrease in chlorophyll concentration. However, there was a noticeable difference between the transmission of the watered samples with H
2O
2 and the control samples. Unlike the previous case where their peaks almost coincided, this suggests a slower process of chlorophyll decomposition in the H
2O
2-watered samples compared to the control samples. Regarding the watered samples with NaCl and glyphosate, the absorption peaks for chlorophyll
a were practically the same. For chlorophyll
b, there was a difference with an increase towards NaCl. The concentration of chlorophyll was calculated according to Equation 1 and 2, and the obtained data are summarized in
Table 1.
Table 1 presents notable variations in the chlorophyll concentration, particularly in chlorophyll
a. Upon analyzing the samples on the day of collection, the following relative changes were observed compared to the control: a decrease of 31.5% in the samples cultivated with NaCl, a decrease of 34.7% in the samples subjected to glyphosate, and a slight increase of 2.2% in the samples treated with hydrogen peroxide. After storing the samples in a dark and cool environment for a week and conducting repeated measurements, the corresponding values were obtained: a reduction in the concentration to 22.2% and 17.5% for the NaCl and glyphosate samples, respectively, and an increase of 28.1% in the H
2O
2-treated samples compared to the reference sample. These findings indicate that the decomposition of chlorophyll in the samples irrigated with water containing low concentrations of H
2O
2 significantly slowed down over time compared to the reference sample.
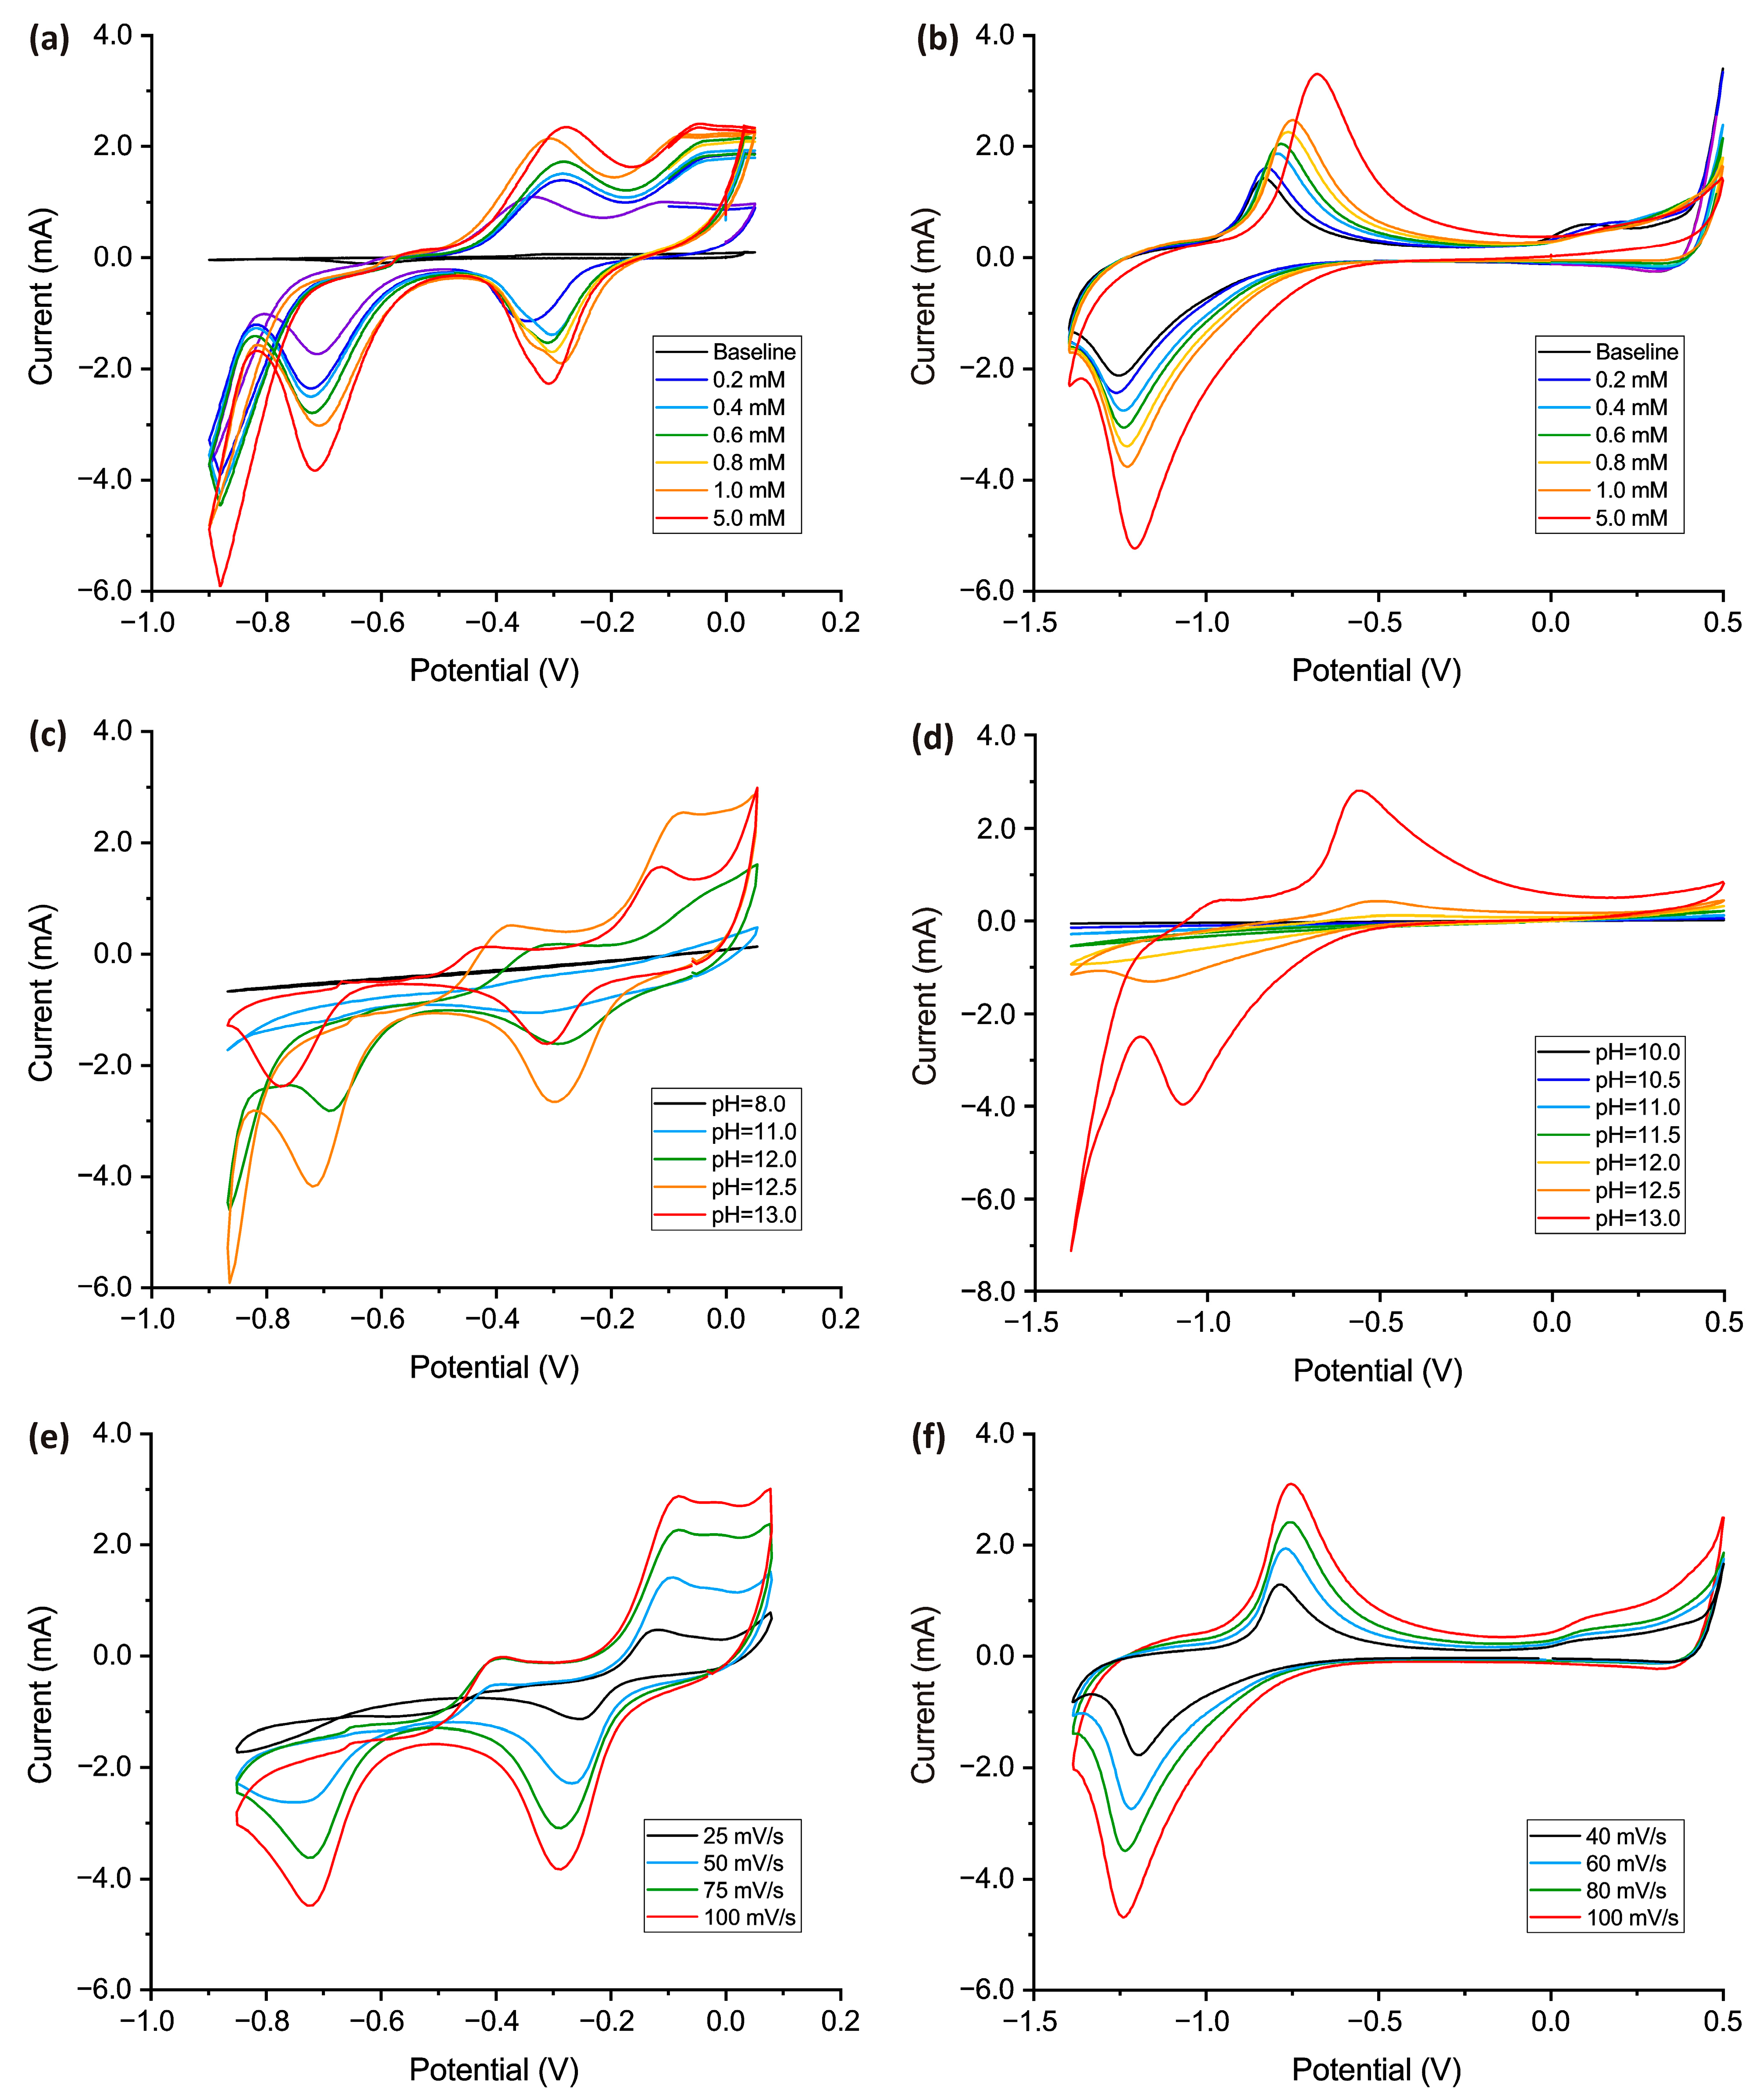
Figure 5 shows CV graphs for the CuO and Co
3O
4 electrodes performed in a 0.1 M NaOH supporting electrolyte to determine the electrochemical response of the electrodes to the addition of various H
2O
2 concentrations.
In previous studies, it was observed that for effective catalytic processes between H
2O
2 and CuO and Co
3O
4 nanostructures, an alkaline medium is necessary, with the best electrochemical response occurring at pH = 12.5–13 [
51]. This pH range can be achieved by using a 0.1 M solution of NaOH or KOH. According to the literature, this phenomenon is attributed to the generation of OH
− ions from oxyhydroxide products, which diffuse into the nanostructured layer and enhance its conductivity compared to hydroxide ions. As a result, there is an increased driving potential towards the wire substrate, enabling the successful detection of H
2O
2 when a negative applied potential activates the Co
3O
4 electrode in an alkaline solution. The CV curves obtained for different pH levels of the supporting electrolyte are shown in
Figure 5, where
Figure 5c shows the results for the nanostructured CuO electrode and
Figure 5d displays the results obtained for the Co
3O
4 nanostructured electrode.
Furthermore, it was determined that the scan rate significantly influenced the height of the oxidation and reduction peaks observed in CV graphs. It was found that the optimal scan rate was 100 mV/s. Increasing the scan rate beyond this value did not lead to a significant increase in the peak height, and in some cases, it even reduced the peak height. Therefore, a scan rate of 100 mV·s
−1 was determined to be the optimal parameter for the electrochemical measurements. Changes in the CV curves depending on the scanning speed are shown in
Figure 5e for the CuO electrode and in
Figure 5f for the Co
3O
4 electrode.
The CV graph of CuO (
Figure 5a) revealed the presence of two pairs of peaks representing the transitions from Cu
0/Cu
+ and Cu
+/Cu
2+ during the oxidation process. Additionally, there were a pair of reduction peaks indicating the Cu
2+/Cu
+ and Cu
+/Cu
0 transitions.
The Co
3O
4-modified electrode displayed two distinct pairs of well-defined redox peaks (
Figure 5b). The reversible transition between Co
3O
4 and CoOOH can be attributed to one pair of redox peaks, while the further conversion between CoOOH and CoO
2 can be associated with another pair of redox peaks.
The catalytic reactivity of both oxides was prominently observed upon the introduction of H2O2 into the solution, leading to a noticeable amplification in the peaks associated with oxidation and reduction processes on the CV graphs. Remarkably, even at low analyte concentrations, these peaks exhibited substantial enhancement, underscoring the high sensitivity exhibited by these materials.
The electron transfer mechanism at the modified CuO electrode can be described as follows: In this catalytic process, when H2O2 was reduced on the CuO surface, Cu2+ was electrochemically reduced to Cu+ while H2O2 was transformed into O2. Subsequently, the Cu+ on the electrode surface underwent electrooxidation back to Cu2+, initiating a repeated catalytic cycle.
In the case of the nanostructured Co3O4 electrode, the cobalt oxide acted as a catalyst, facilitating the decomposition of H2O2 into CoOOH and H2O. The Co3O4 surface provided active sites where the oxidation of H2O2 took place, leading to the formation of CoOOH.
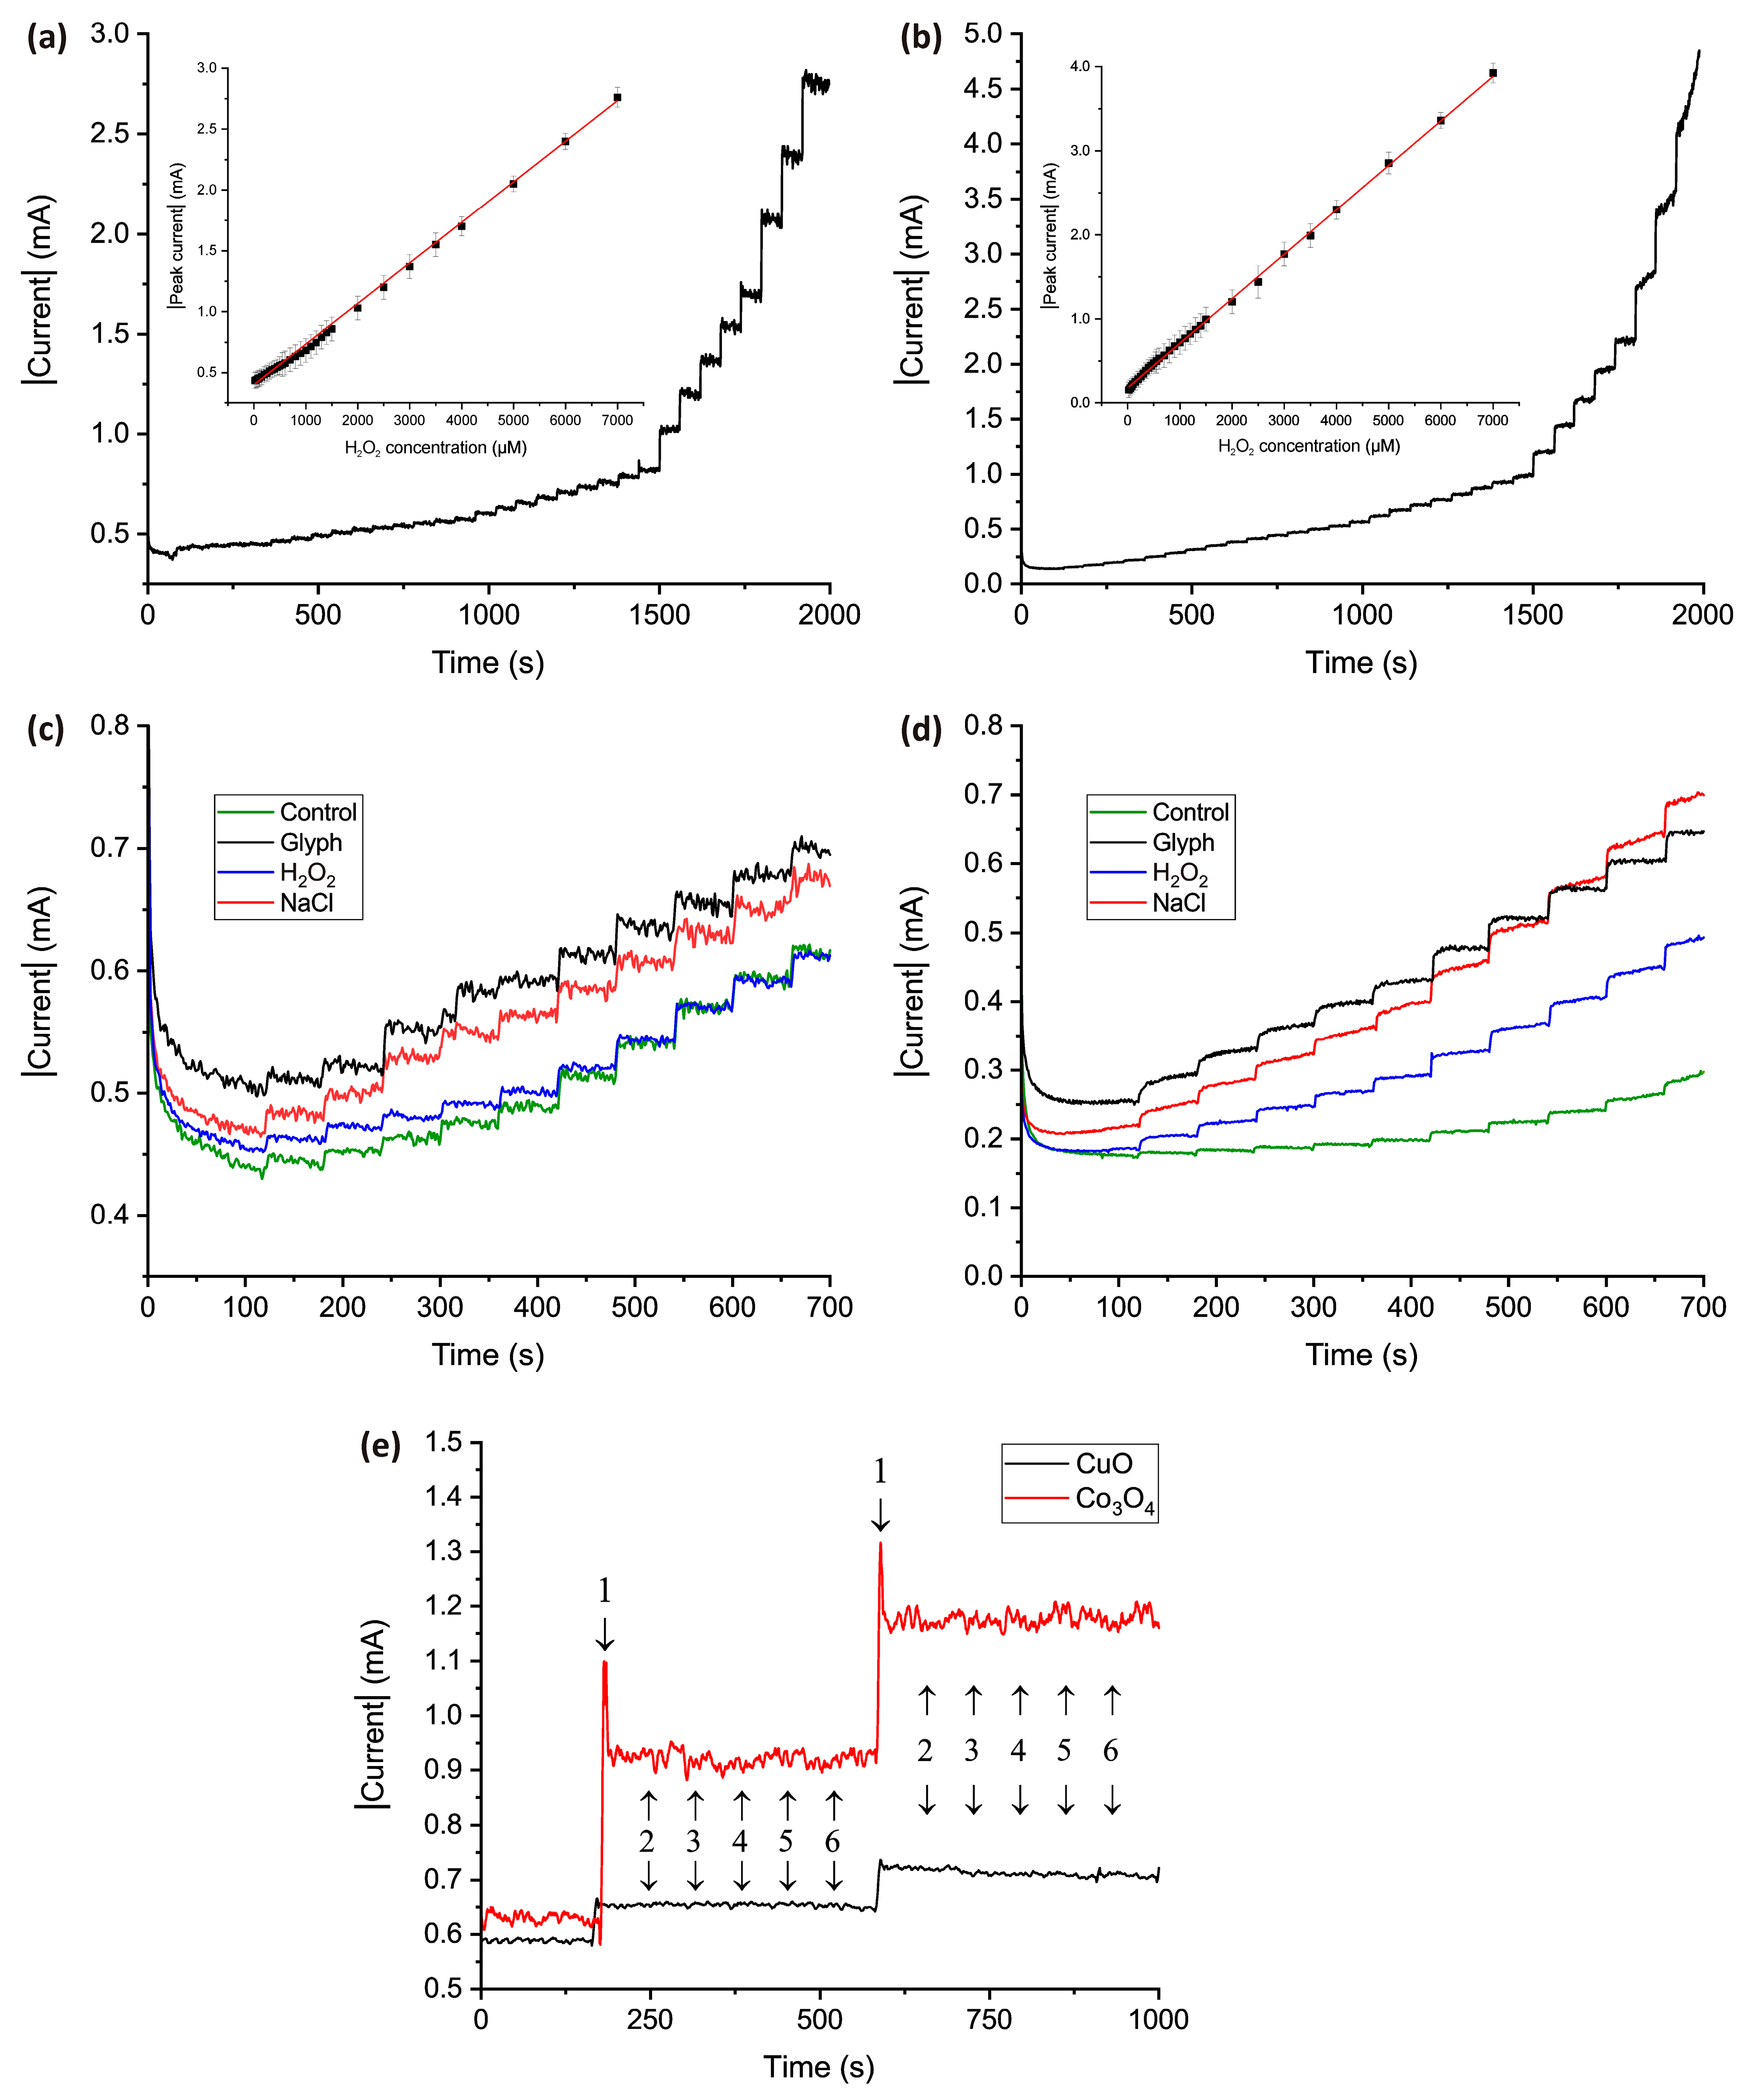
Figure 6 presents the chronoamperograms of the nanostructured CuO electrode (
Figure 6a) and the nanostructured Co
3O
4 electrode (
Figure 6b) upon the introduction of H
2O
2 at concentrations ranging from 20 µM to 7 mM. Both oxides exhibited a distinct and well-defined step in the plot upon the addition of even low concentrations of hydrogen peroxide, demonstrating the high sensitivity of the sensor and a clear response to the target analyte. Notably, the step quickly reached a plateau, indicating a rapid response and prompt stabilization of the electrode upon the introduction of the analyte. The calibration curve shows that both oxides exhibited a good linear dependence over the entire concentration range from 20 μM to 7 mM, which indicates that the sensors based on these structures could equally successfully be used to determine both low and relatively high concentrations of the analyte.
The sensitivity of the obtained CuO electrode was 439.19 μA·mM−1, and the calculated LOD was 1.34 μM, assuming a signal-to-noise ratio of 3. The sensitivity of Co3O4 electrode was 505.11 μA·mM−1, and, considering a signal-to-noise ratio of 3, the calculated LOD was found to be 1.05 μM.
Figure 6c,d show the chronoamperograms of the addition of 50 µM and 100 µM H
2O
2 in real rye juice samples for the CuO electrode (
Figure 6c) and the Co
3O
4 electrode (
Figure 6d). The curves obtained from the real samples exhibited lower stability compared to the similar curves generated in a supporting electrolyte with prescribed concentrations of hydrogen peroxide, which were used to construct the calibration graph. This disparity was likely attributed to the complexity of the plant juice as an analyte, which comprised a diverse matrix containing numerous organic and inorganic compounds, as well as solid plant tissue components. While these components may not have functioned as interferents, they appeared to have a detrimental impact on the system’s stability. To address this issue, we employed the methodology described in the
Section 2. We saw that despite the complex chemical composition of the analyzed solution, there was a fast and accurate electrochemical response to the addition of a portion of H
2O
2. This proves the possibility of the successful application of this sensor for the further implementation of the spike method for detecting low concentrations of H
2O
2 in these samples.
The dynamics of these graphs should be highlighted, as they reveal important insights. Notably, the control sample, which was not subjected to any stress factors during growth, exhibited the lowest electrochemical response. Following that, the sample exposed to low concentrations of H2O2 showed a slightly higher response. Remarkably, a significant margin separated the electrochemical response of the sample grown under salt stress, and even more pronounced was the response obtained for the plants grown under the influence of glyphosate. The response corresponding to salt stress closely resembled the response observed in plants exposed to herbicides. This dynamic trend was observed in both the CuO and Co3O4 electrodes.
Figure 6c,d show that both electrodes exhibited a consistent trend reflecting the H
2O
2 content, with the samples arranged in the following increasing order of released hydrogen peroxide: control, H
2O
2, NaCl, and glyphosate. However, it is worth noting that the Co
3O
4 electrode consistently displayed a higher electrochemical response across all samples compared to the CuO electrode. This discrepancy may, in part, be attributed to our approach, where we utilized results obtained from multiple batches of plant samples and calculated the average value. It is also worth noting that this phenomenon was exclusively observed in the rye samples subjected to stress, where a substantial amount of H
2O
2 was evidently released. The results obtained from both sensors on the control samples in this article, as well as the test measurements in the buffer solution and even the real milk samples described in our previous articles, aligned closely for both electrodes and matched the reference values on the calibration line. This led us to assume that under stress conditions, the plants released a specific substance, potentially another type of ROS, which reacted with the surface of the Co
3O
4 electrode, resulting in a false increase in the electrochemical response, while not eliciting a similar reaction with CuO.
Considering that a plant is an intricate chemical system with a complex composition, further investigation is needed to define this substance accurately. Nevertheless, this phenomenon can be further leveraged positively in the development of a multisensory system, where differences between signals obtained from CuO and Co3O4 electrodes can be analyzed mathematically and utilized as one of the parameters for determining H2O2 concentration in plants.
As mentioned earlier, plant juice is a matrix consisting of various components such as solid cellular structures, organic acids, sugars, and more. Therefore, when developing an electrochemical sensor to work with such analytes, it is crucial to eliminate the possibility of false increases in the electrochemical response caused by interfering substances. In order to achieve this, both electrodes underwent testing for interferences by introducing substances like NaCl, KNO
3, glucose, citric acid, and ascorbic acid, along with H
2O
2.
Figure 6e demonstrates that both electrodes exhibited excellent selectivity, as an electrochemical response was only observed when a 100 µM portion of H
2O
2 was introduced into the solution. The addition of interferents at the same concentration did not induce any change in the current higher than the level of noise.
To analyze the content of hydrogen peroxide in real samples using nanostructured CuO and Co
3O
4 electrodes, a recovery test was conducted, and the results are presented in
Table 2.
Here, the “added” column corresponds to the concentration of peroxide added to the sample during measurement, the “found” column corresponds to the total amount of H2O2 detected by the sensor, and the “excess” column corresponds to the amount of H2O2 that was released by the plant under the influence of stress factors.
It can be seen that in the case of both oxides for the baseline, the recovery practically coincided, and the amount of extra found H2O2 corresponding to the released peroxide was close to 0, which indicates the accurate operation of the sensor and the absence of additional hydrogen peroxide in the control sample.
In the case of the samples treated with H2O2 watering, in a number of spike concentrations, an excess of 100% was observed for both oxides, while the average amount of released H2O2 was 38.5 µM for CuO and 26.5 µM for Co3O4.
Much more significant changes were observed when the plants were exposed to salt and herbicide stress during growth. So, for NaCl, the average amount of excess H2O2 was determined as 113.6 µM in the case of CuO and 133.2 µM in the case of Co3O4. For the glyphosate-treated samples, the average amount of excess H2O2 was determined to be 163.02 µM for CuO and 223.03 µM for Co3O4.
The data obtained clearly indicate that a significant amount of H2O2 was released in the rye samples under the influence of salt stress and herbicide stress. Moreover, in terms of the amount of a certain peroxide, the effect of NaCl was just as detrimental to the plant as the effect of glyphosate, which, by definition, has a herbicidal (depressant) effect. This fact additionally confirms the damage caused to plants by increased soil salinity caused by technogenic factors and a deliberate neglect of the norms of recommended concentrations of applied fertilizers.
By examining the correlation between the concentration of H
2O
2 released in plants under stress factors (
Table 2) and the chlorophyll concentration in samples obtained under the same conditions using optical methods (
Table 1), a clear pattern emerged. As the released peroxide increased, there was a noticeable decrease in the chlorophyll concentration. Consequently, the samples subjected to salt and herbicide stress exhibited the lowest chlorophyll concentration and the highest H
2O
2 release concentration. This finding validates that elevated H
2O
2 concentrations in plants lead to a decline in vital functions, and conversely, an increase in H
2O
2 concentrations can serve as a qualitative and quantitative marker for assessing the impact of external stress on plants.
It can be observed that the relationship of the measured H2O2 aligned for both oxides and exhibited an increasing trend from the control sample to the sample exposed to herbicide stress. This consistency enhances the reliability of the findings and further, with appropriate mathematical analysis, facilitates the development of a multisensor system utilizing these two oxides. This system would enable simultaneous measurement and provide precise quantitative values for the concentration of released H2O2.

 ,
, 


