
Estimation of Human Mobility Patterns for Forecasting the Early Spread of Disease


Abstract
:1. Introduction
2. Materials and Methods
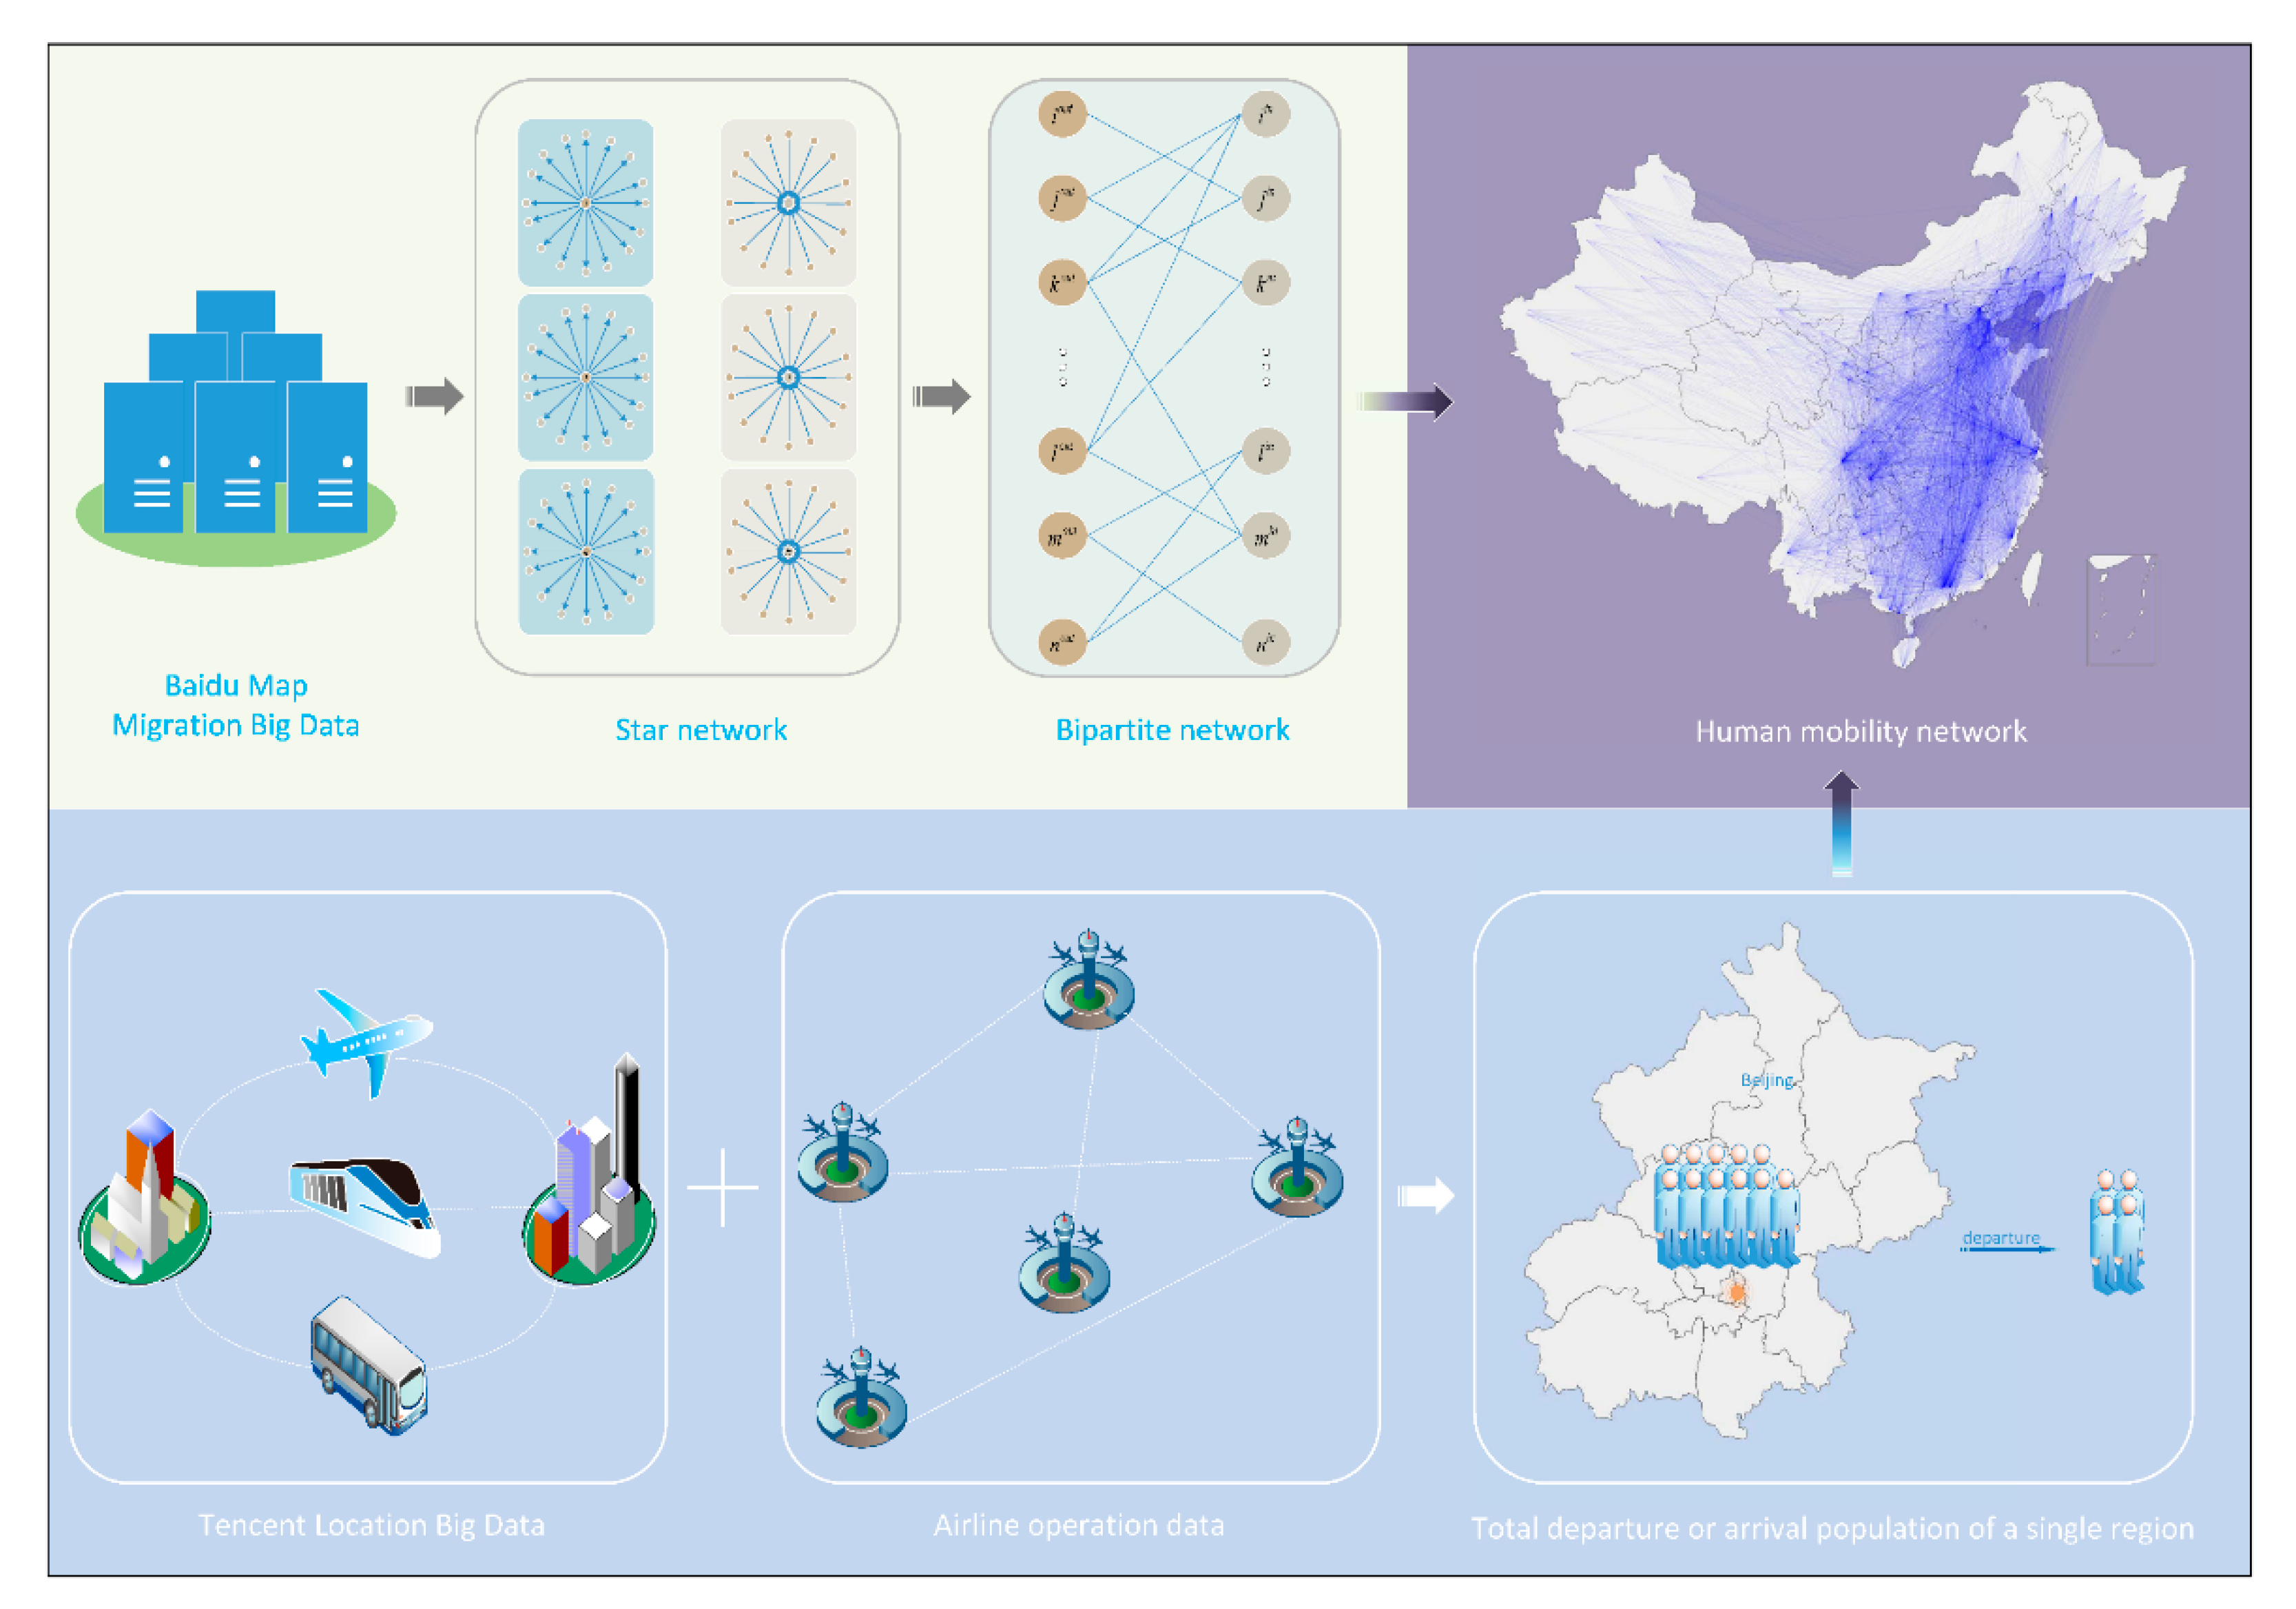
2.1. Data
2.2. Estimating Human Mobility Patterns in Mainland China
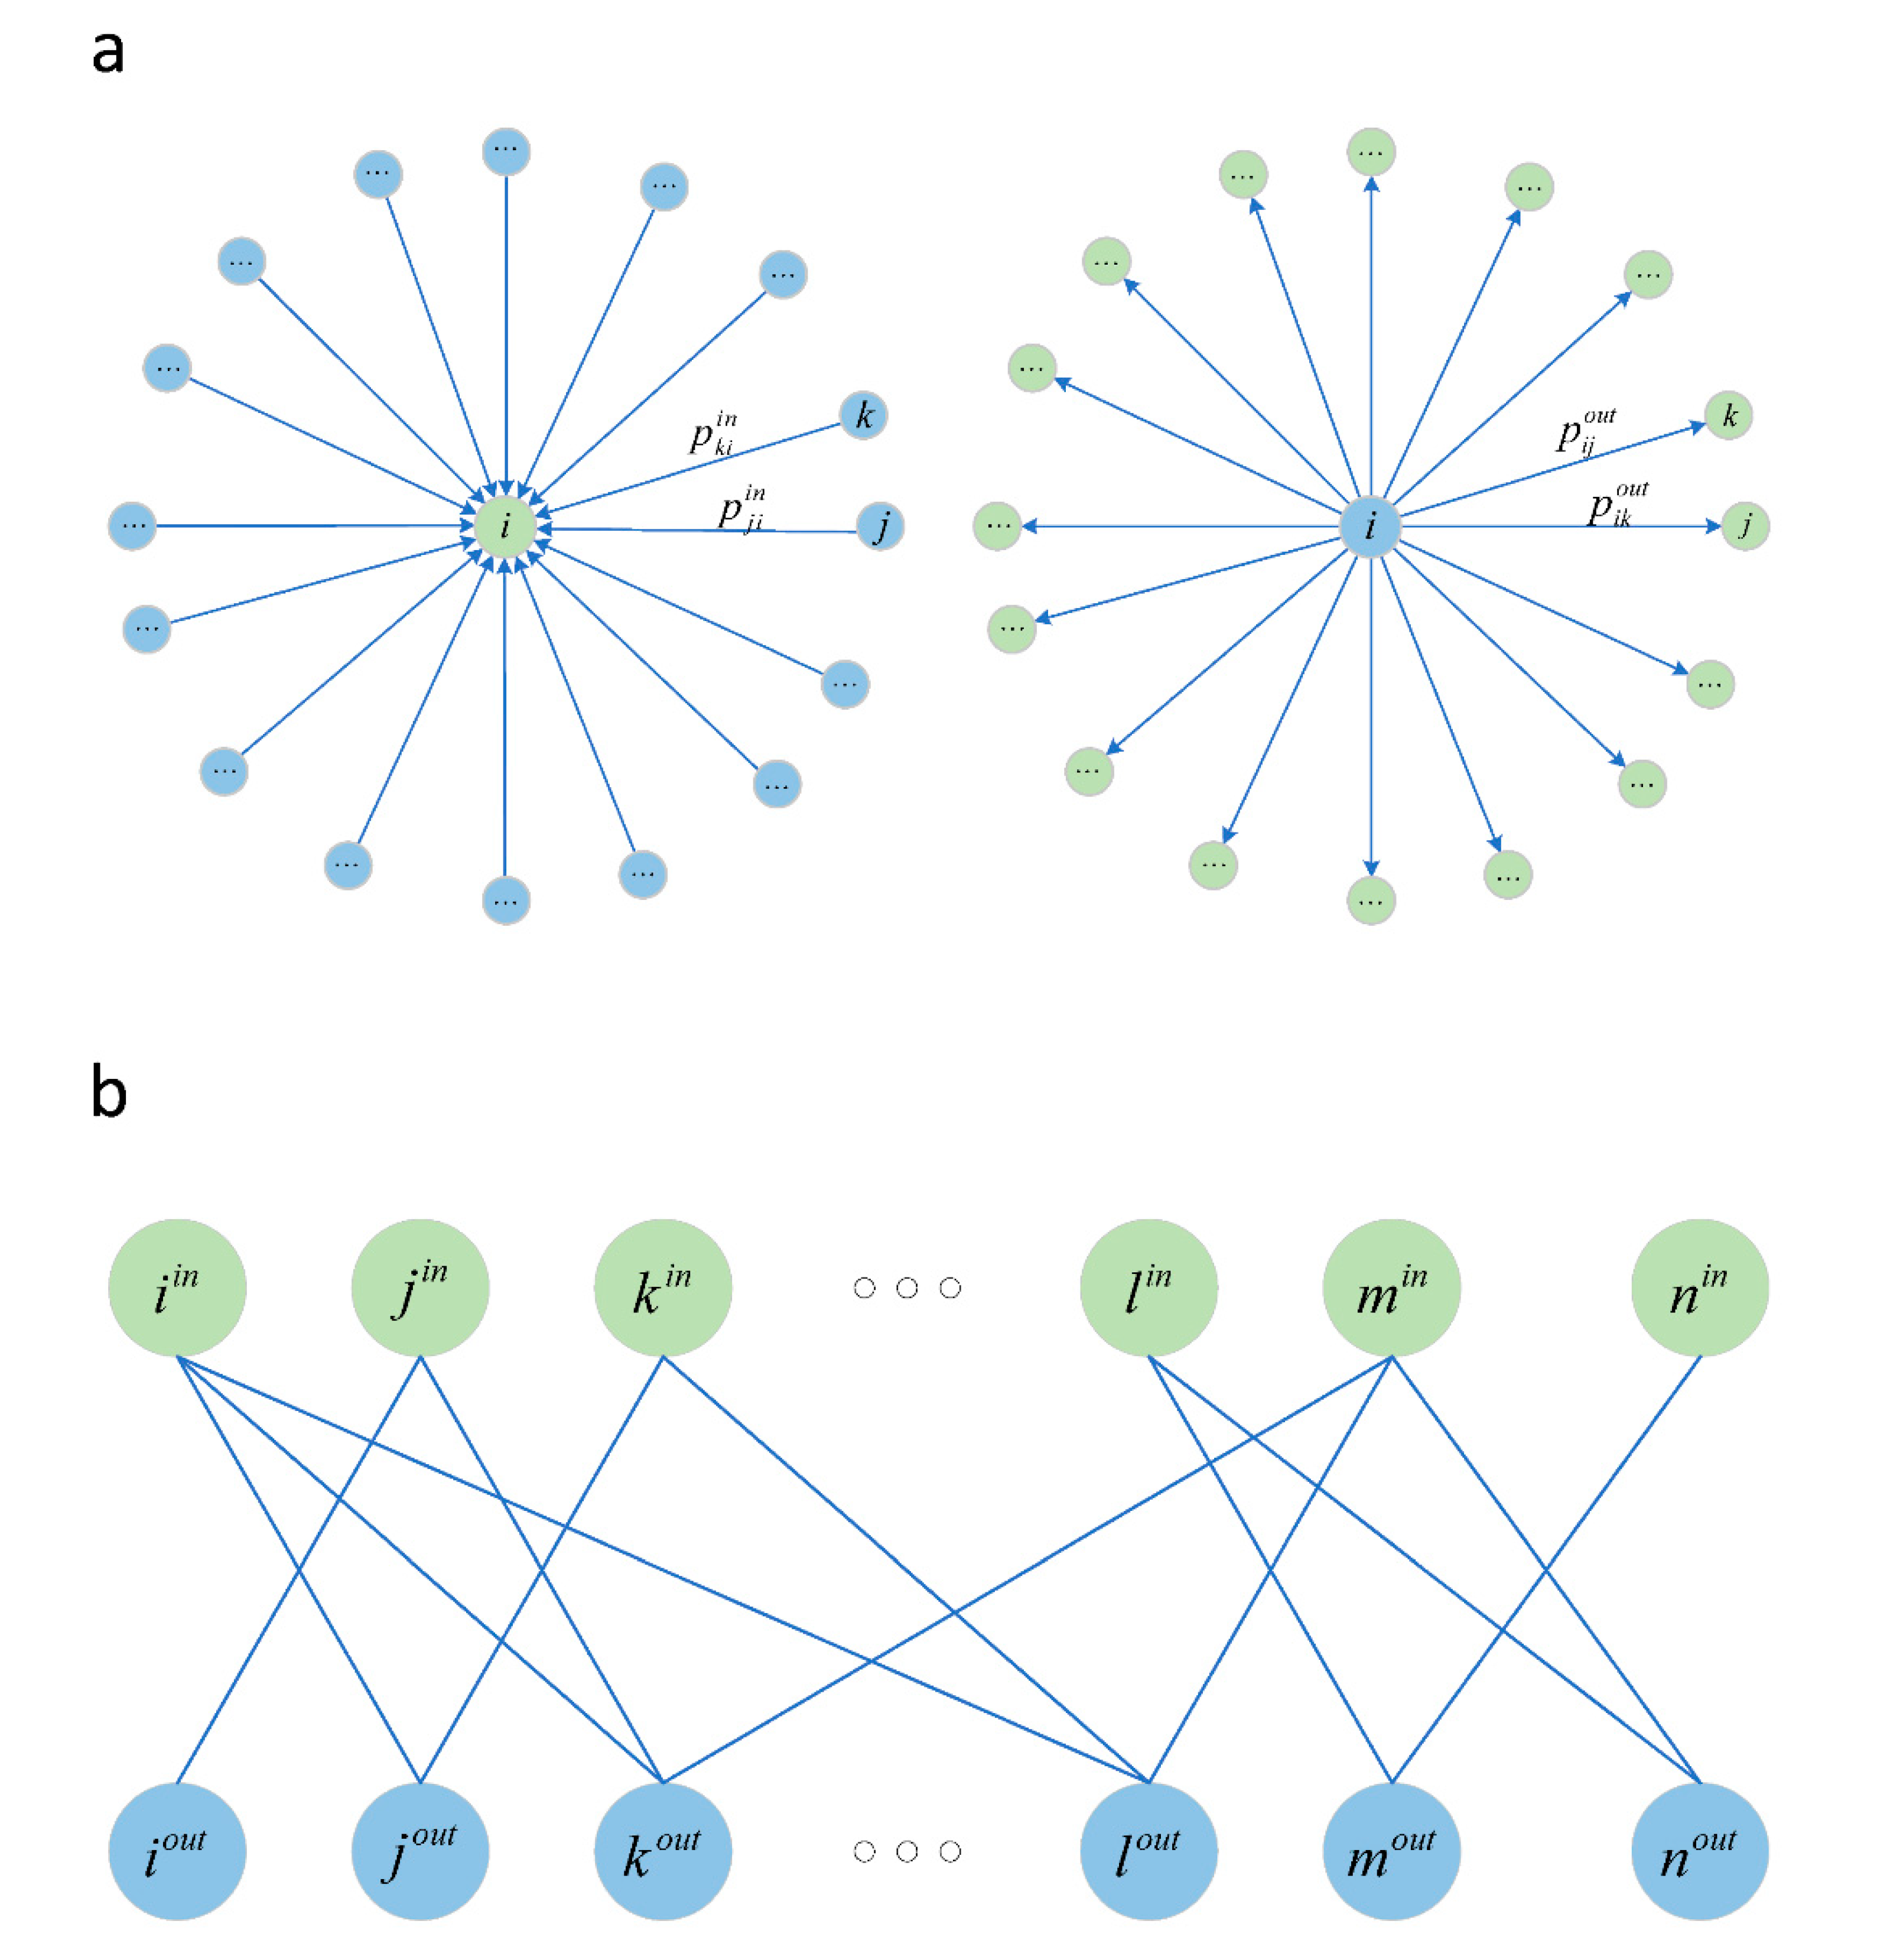
2.2.1. Overview of the Methodology
2.2.2. Model
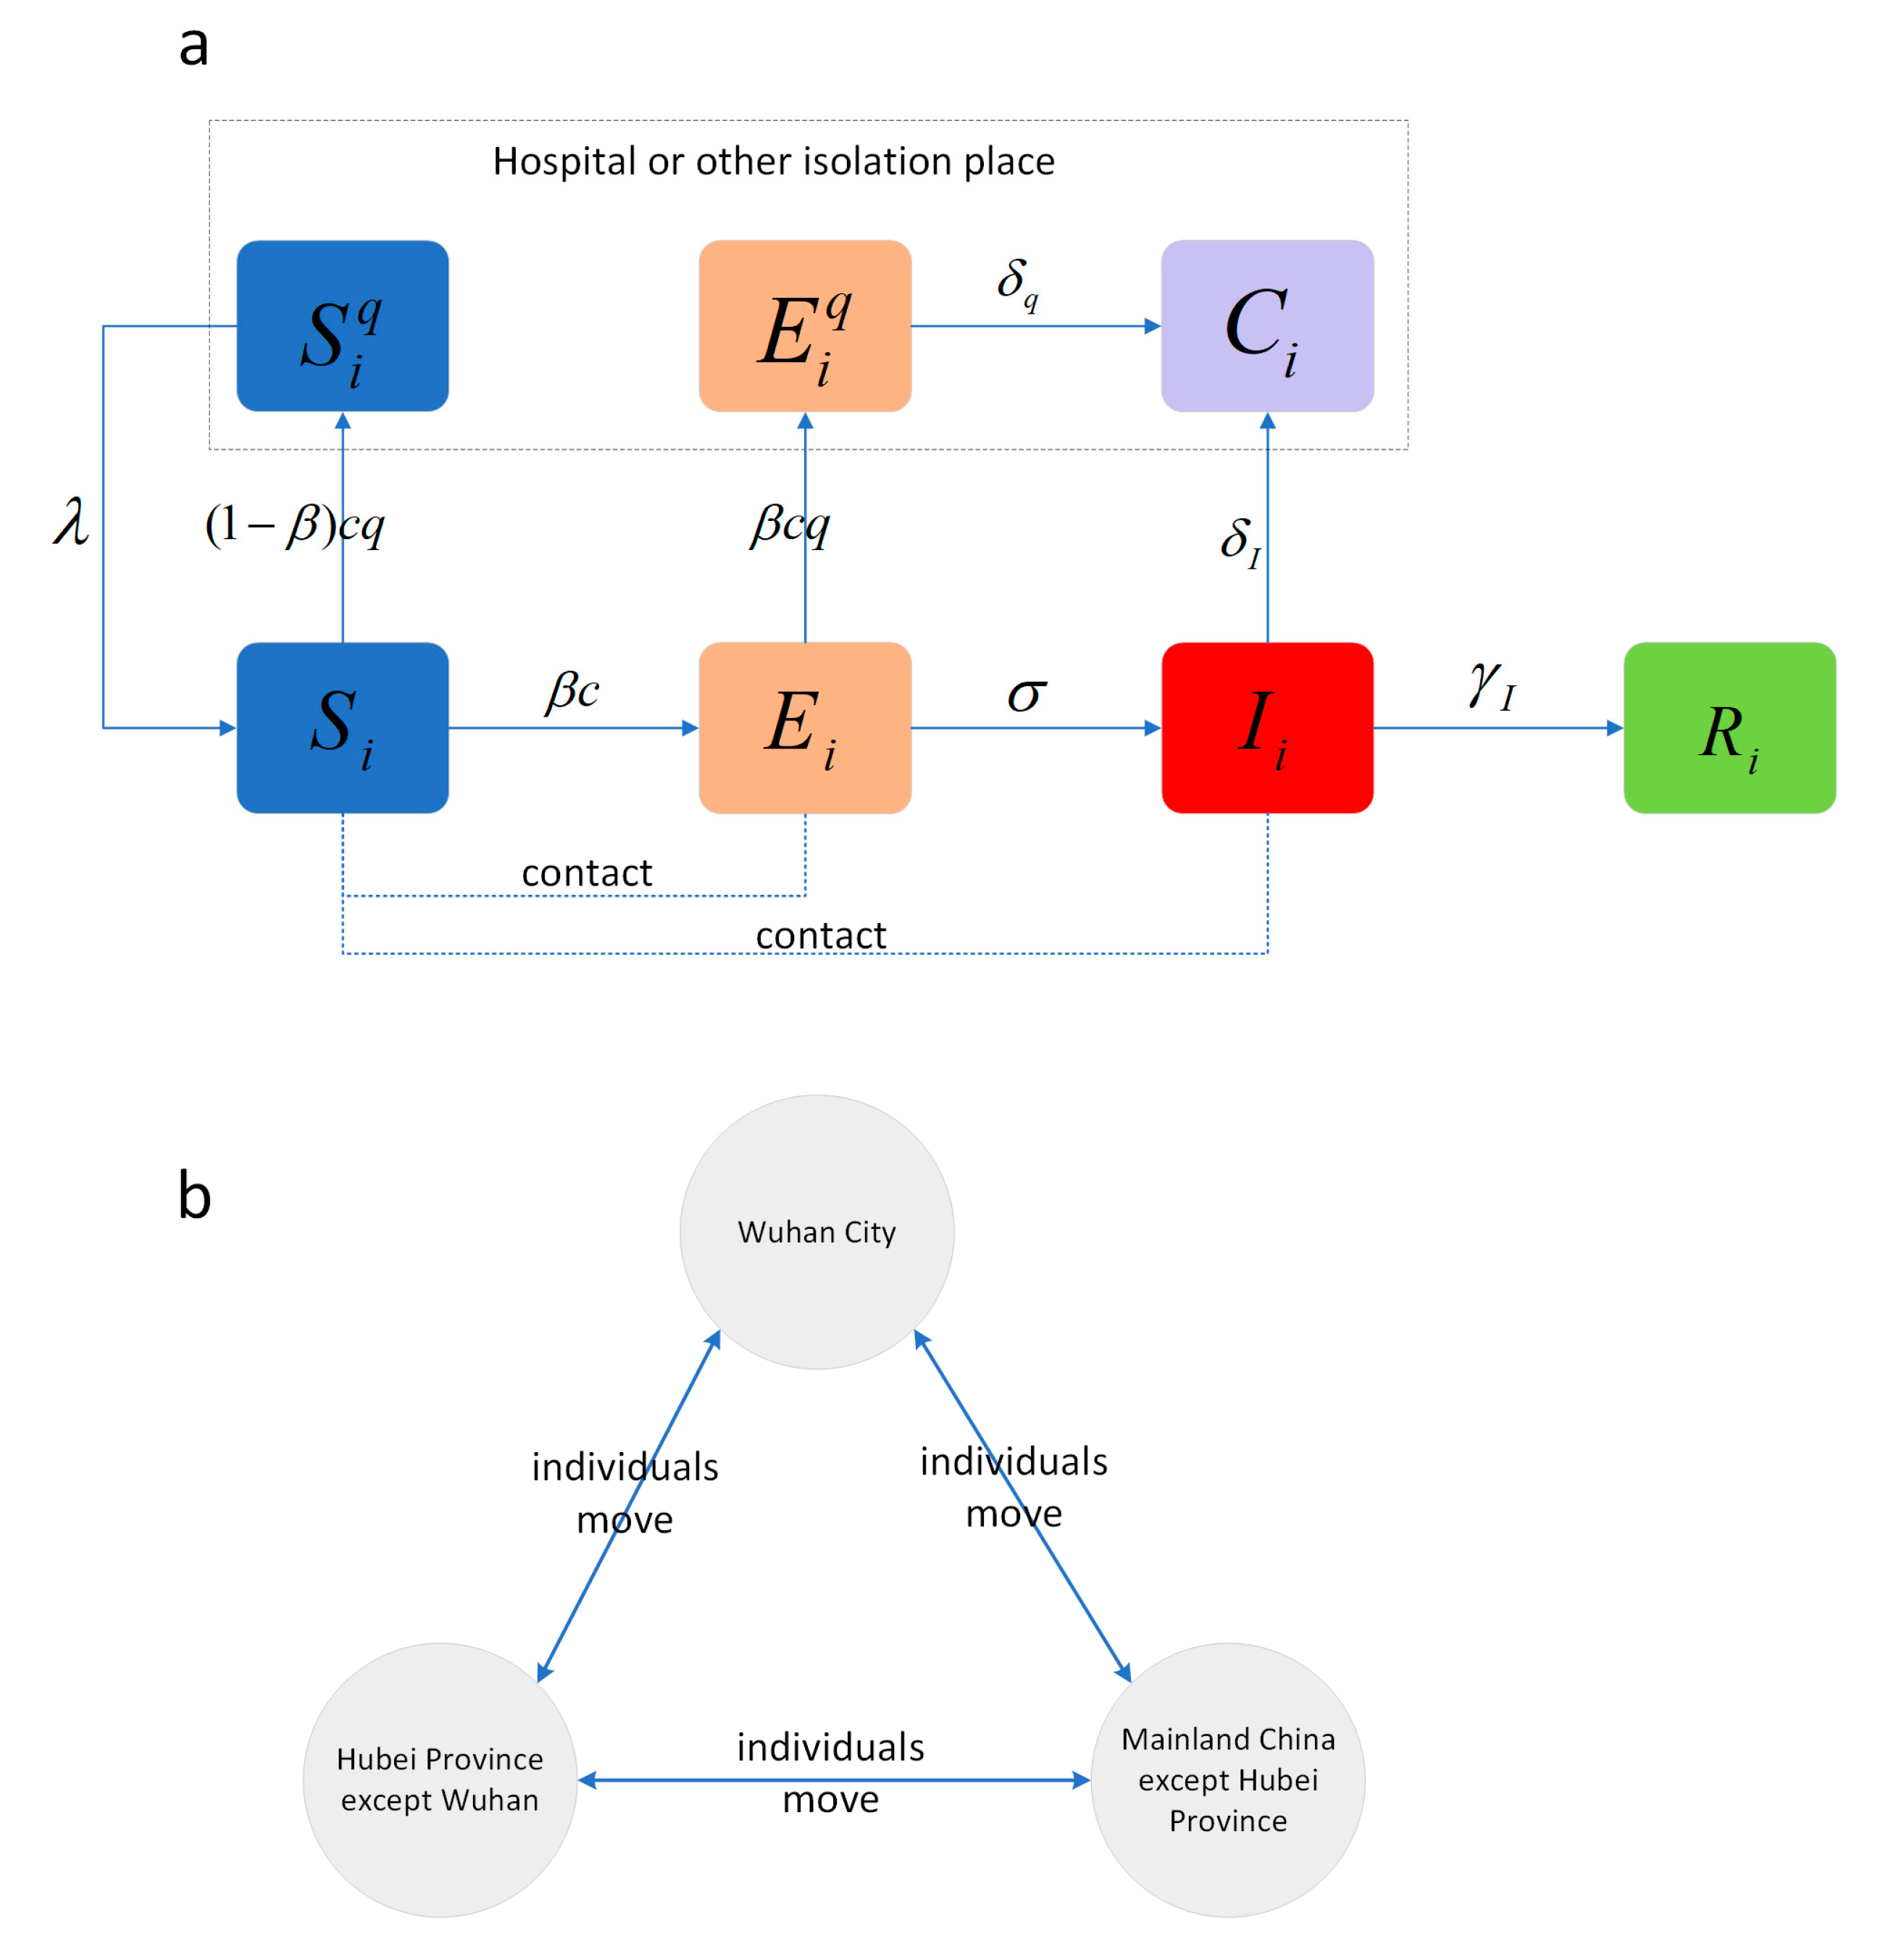
2.3. Modeling the Spread of Epidemics Using Human Mobility Data
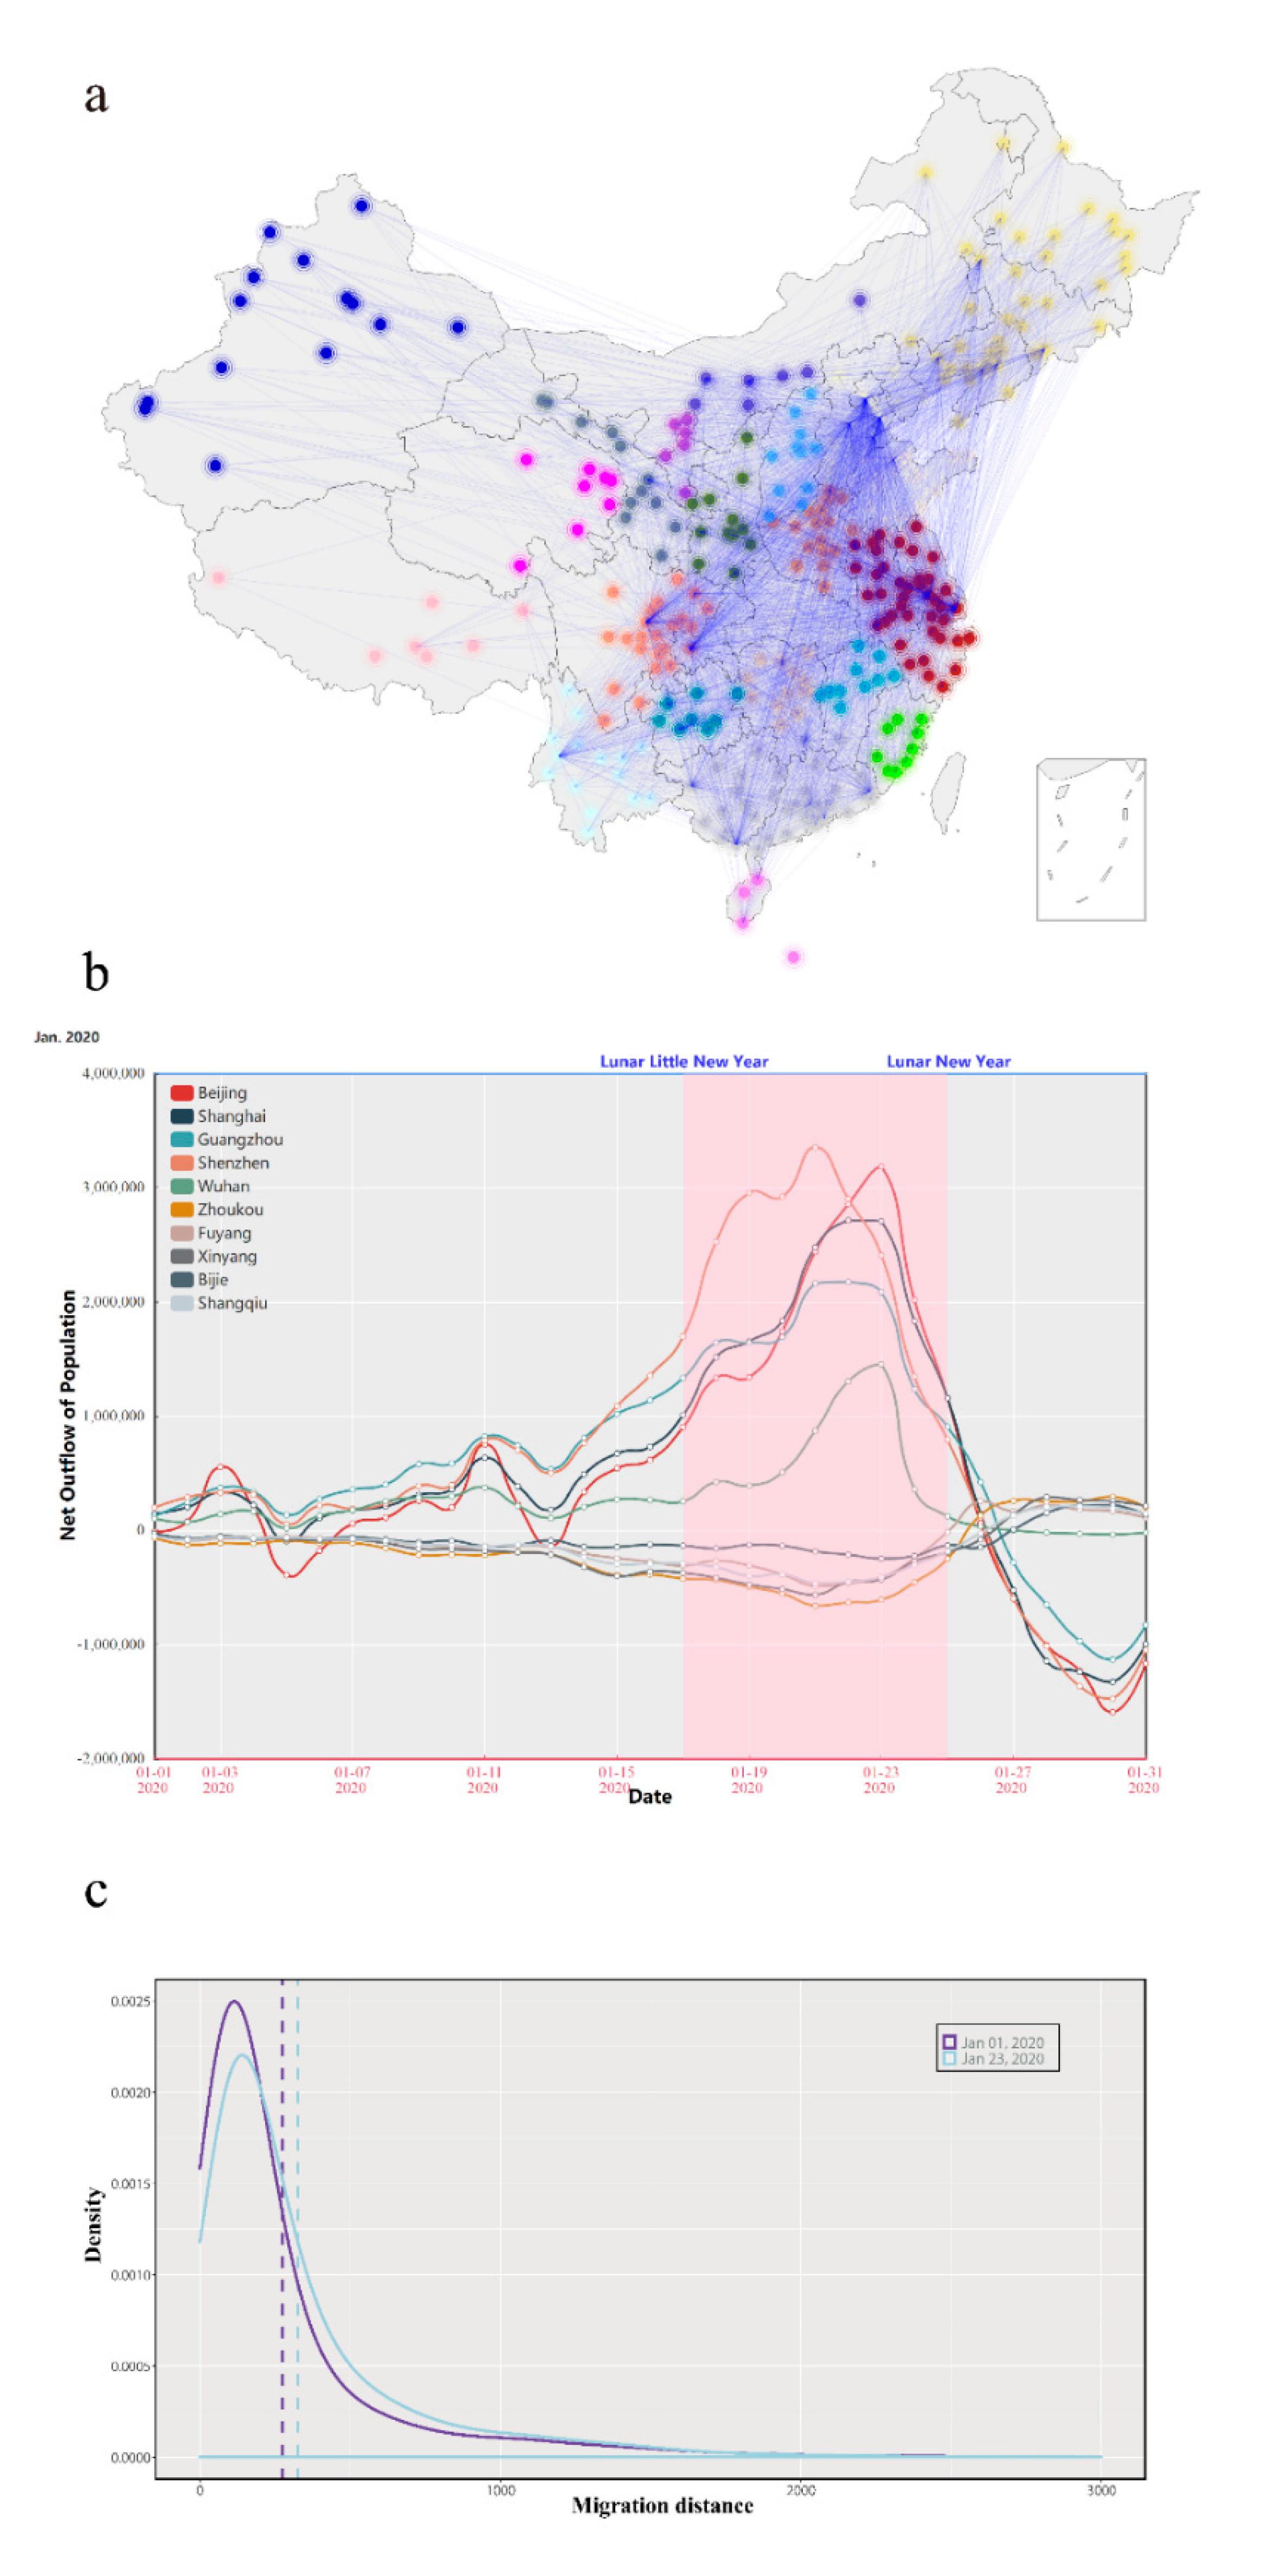
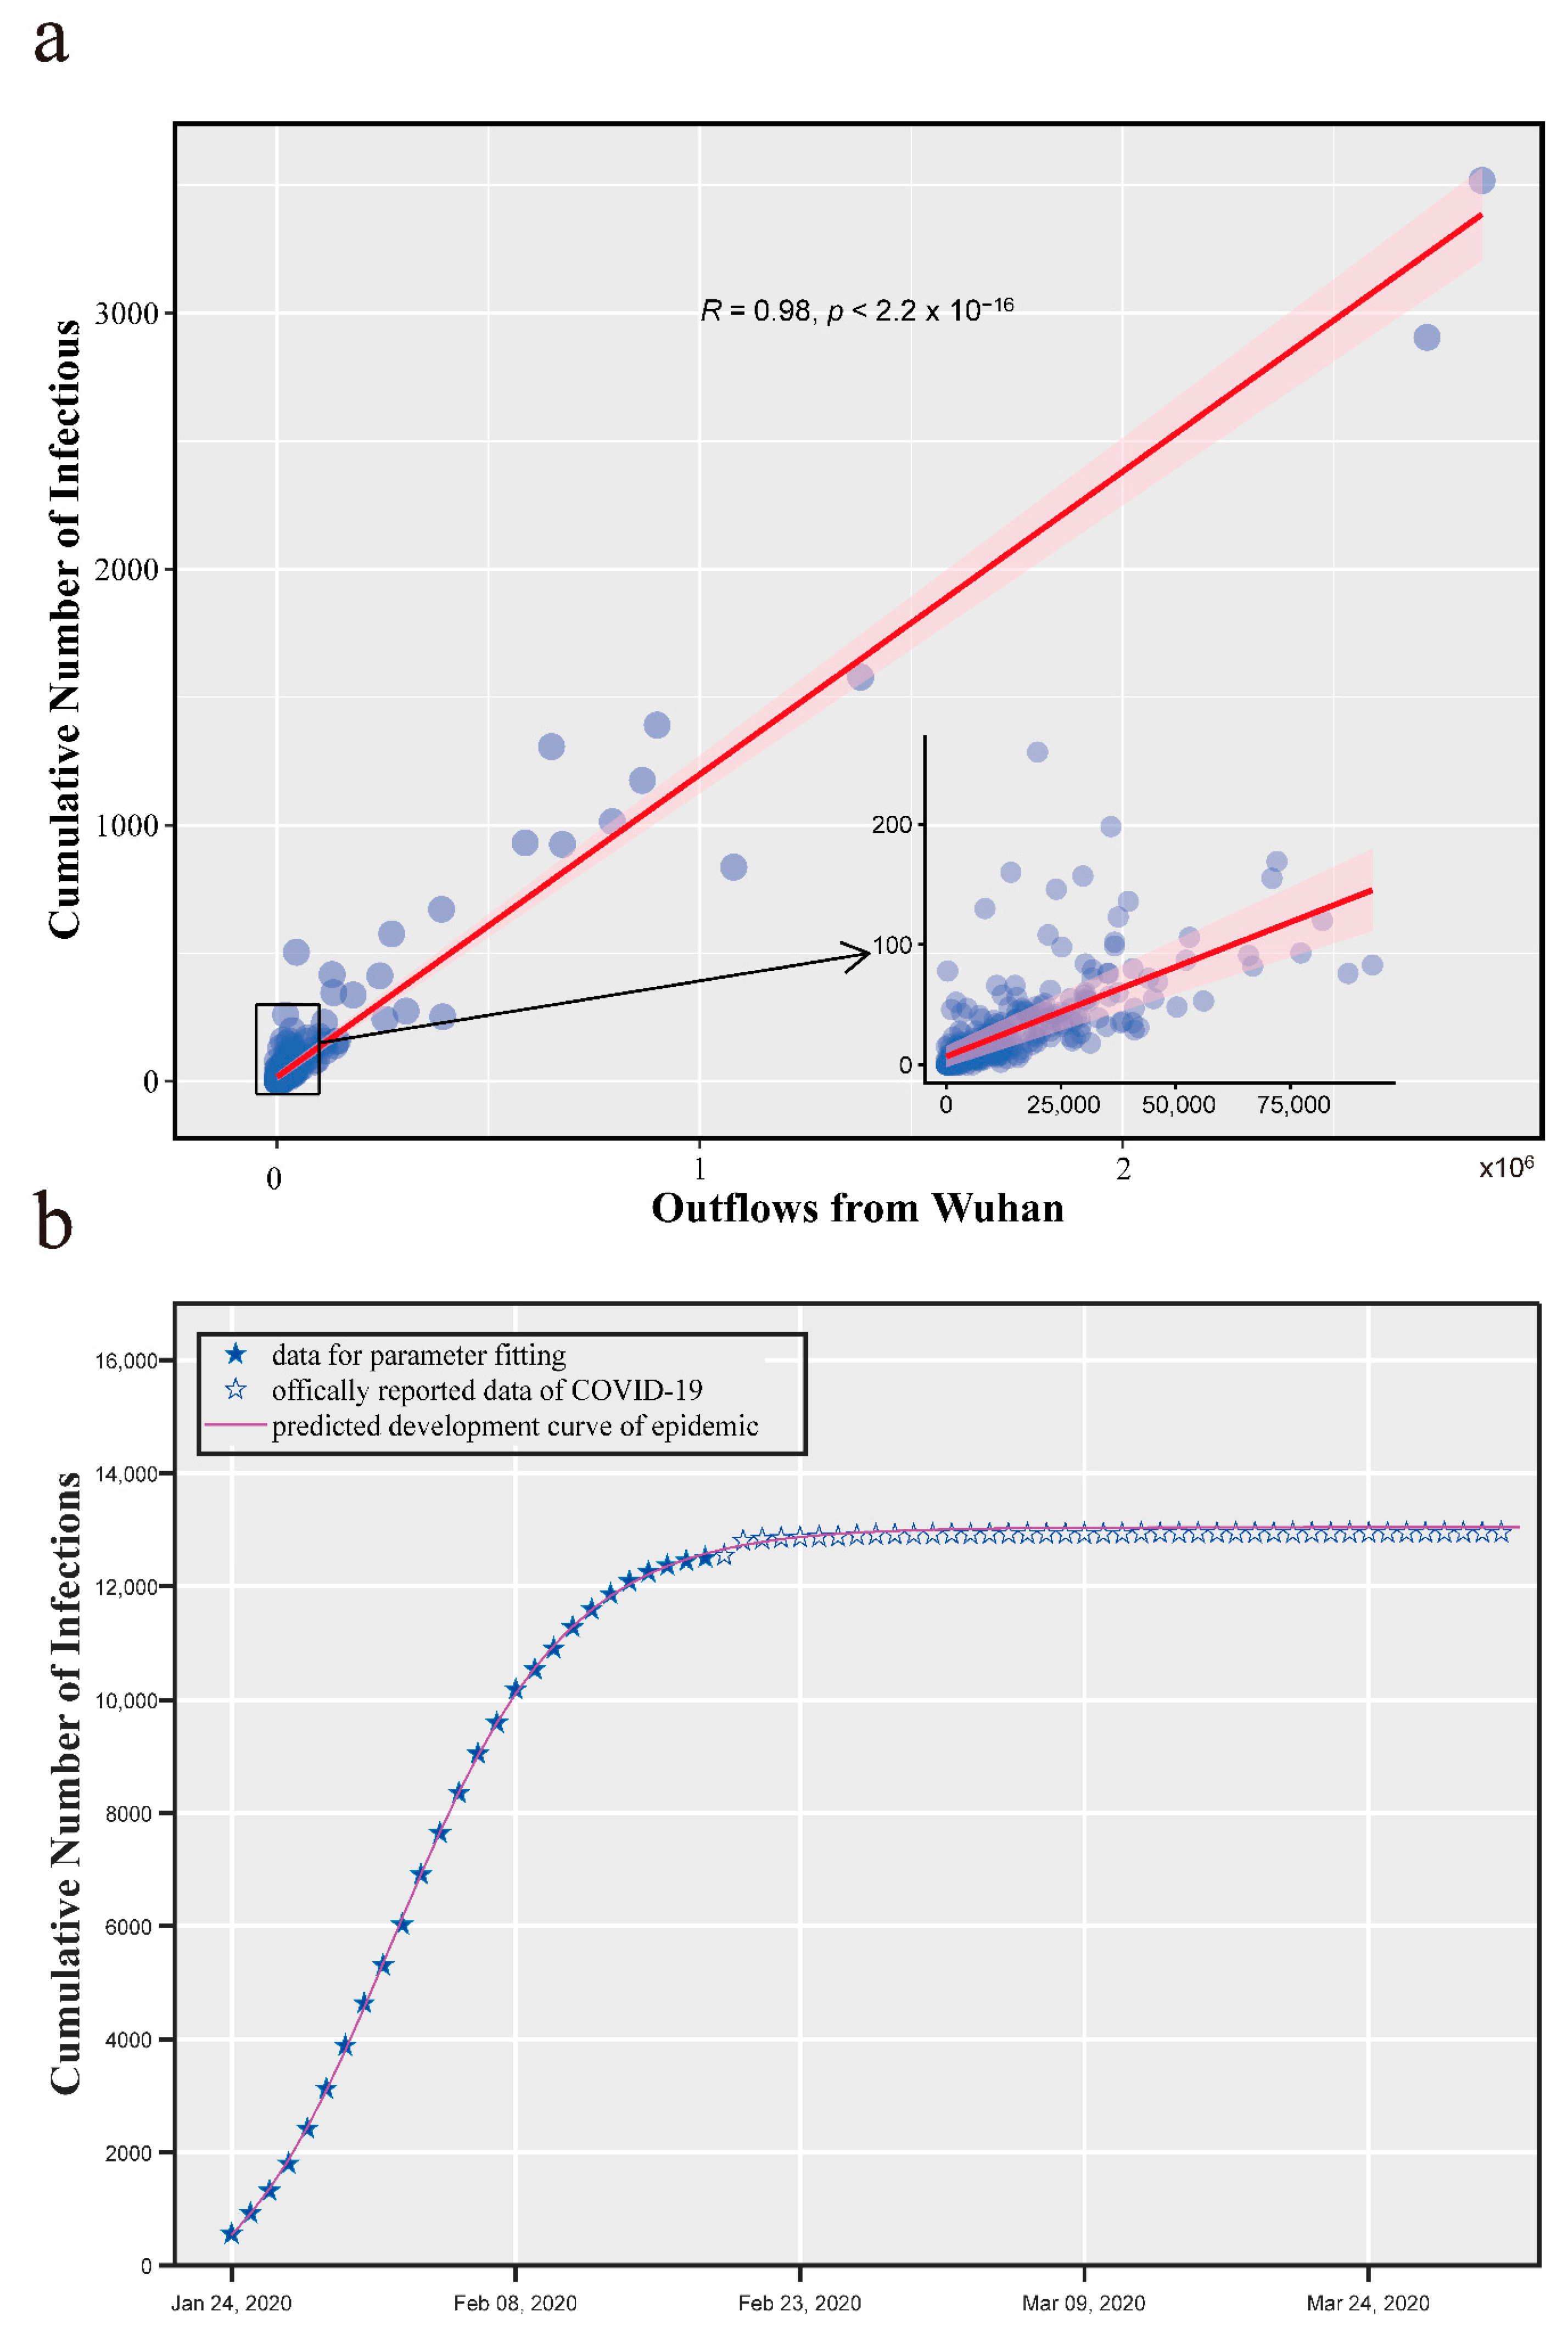
3. Results
4. Discussion
Supplementary Materials
Author Contributions
Funding
Institutional Review Board Statement
Informed Consent Statement
Data Availability Statement
Acknowledgments
Conflicts of Interest
Appendix A
Appendix B

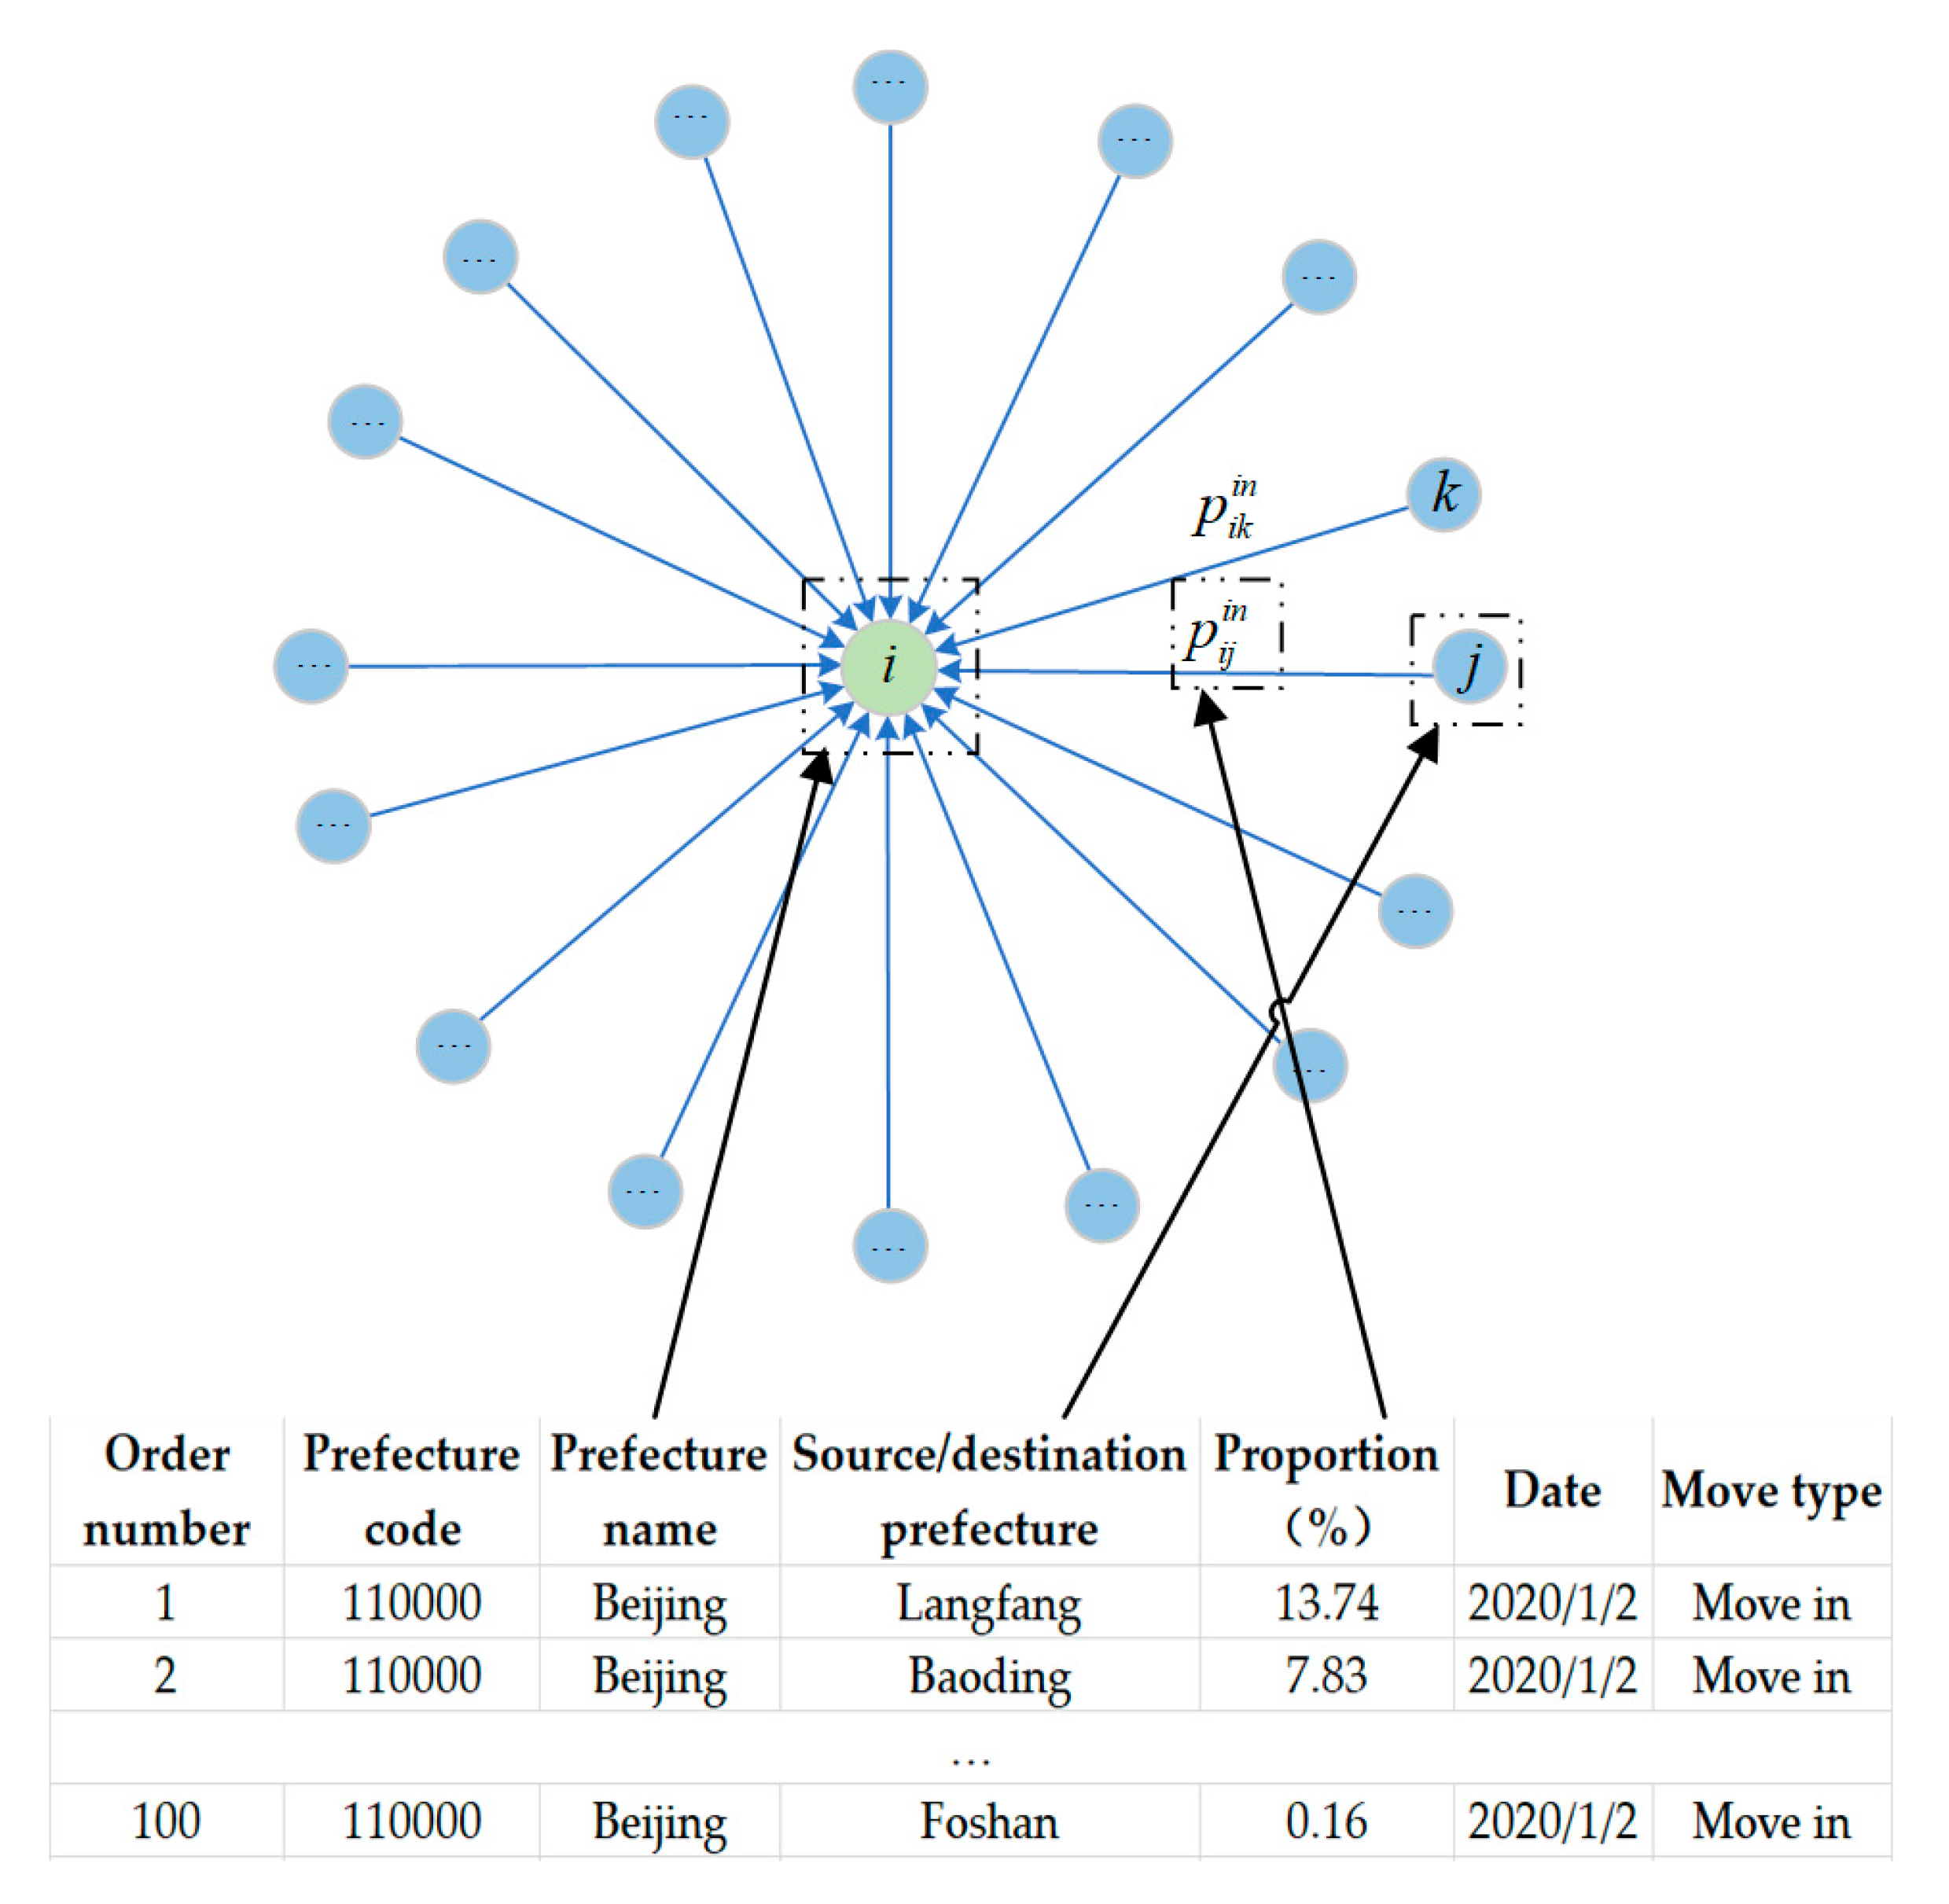
| Order Number | Prefecture Code | Prefecture Name | Source/Destination Prefecture | Proportion (%) | Date | Move Type |
|---|---|---|---|---|---|---|
| 1 | 110000 | Beijing | Langfang | 13.74 | 2020-01-02 | Move in |
| 2 | 110000 | Beijing | Baoding | 7.83 | 2020-01-02 | Move in |
| … | ||||||
| 100 | 110000 | Beijing | Foshan | 0.16 | 2020-01-02 | Move in |
| 1 | 110000 | Beijing | Langfang | 9.27 | 2020-01-02 | Move out |
| 2 | 110000 | Beijing | Baoding | 7.12 | 2020-01-02 | Move out |
| … | ||||||
| 100 | 110000 | Beijing | Mudanjiang | 0.19 | 2020-01-02 | Move out |

Appendix C

| Parameters | Notation | Values | Source | Interpretations |
|---|---|---|---|---|
| probability of transmission | 0.028964 | CNLP | probability of transmission per effective contact | |
| number of contacts | 21.332 | CNLP | number of effective contacts in 1st period | |
| 7.3657 | CNLP | number of effective contacts in 2nd period | ||
| proportion of isolation: | 3.6818 | CNLP | coefficient of Sigmoid function | |
| 0.63232 | CNLP | coefficient of Sigmoid function | ||
| coefficient of difference | 0.25175 | CNLP | coefficient of difference between and | |
| rate of transformation between compartments | 0.071429 | [44] | rate at which the quarantined uninfected were released | |
| 0.20000 | [46] | rate at which the infected from to | ||
| 0.073912 | CNLP | rate at which person from to in 1st period | ||
| 0.18210 | CNLP | rate at which person from to in 2nd period | ||
| 0.017459 | CNLP | rate at which person from to in 1st period | ||
| 0.42601 | CNLP | rate at which person from to in 2nd period | ||
| 0.095992 | CNLP | rate at which the infected from to | ||
| proportion | 0.51317 | CNLP | proportion of symptomatic infected individuals that can travel normally | |
| 7.9 × 10⁴ | CNLP | local minimum of error |
References
- Colizza, V.; Vespignani, A. Epidemic modeling in metapopulation systems with heterogeneous coupling pattern: Theory and simulations. J. Theor. Biol. 2008, 251, 450–467. [Google Scholar] [CrossRef] [Green Version]
- Einav, L.; Levin, J. Economics in the age of big data. Science 2014, 346, 6210. [Google Scholar] [CrossRef] [PubMed]
- Xu, J.; Li, A.; Li, D.; Liu, Y.; Du, Y.; Pei, T.; Ma, T.; Zhou, C. Difference of urban development in China from the perspective of passenger transport around Spring Festival. Appl. Geogr. 2017, 87, 85–96. [Google Scholar] [CrossRef]
- Wei, Y.; Song, W.; Xiu, C.; Zhao, Z. The rich-club phenomenon of China’s population flow network during the country’s spring festival. Appl. Geogr. 2018, 96, 77–85. [Google Scholar] [CrossRef]
- Cui, C.; Wu, X.; Liu, L.; Zhang, W. The spatial-temporal dynamics of daily intercity mobility in the Yangtze River Delta: An analysis using big data. Habitat Int. 2020, 106, 102174. [Google Scholar] [CrossRef]
- Kraemer, M.U.; Sadilek, A.; Zhang, Q.; Marchal, N.A.; Tuli, G.; Cohn, E.L.; Hswen, Y.; Perkins, T.A.; Smith, D.L.; Reiner, R.C. Mapping global variation in human mobility. Nat. Hum. Behav. 2020, 4, 800–810. [Google Scholar] [CrossRef]
- Meslé, M.M.I.; Hall, I.M.; Christley, R.M.; Leach, S.; Read, J.M. The use and reporting of airline passenger data for infectious disease modelling: A systematic review. Eurosurveillance 2019, 24, 1800216. [Google Scholar] [CrossRef] [PubMed] [Green Version]
- Wilder-Smith, A. The severe acute respiratory syndrome: Impact on travel and tourism. Travel Med. Infect. Dis. 2006, 4, 53–60. [Google Scholar] [CrossRef]
- Fraser, C.; Donnelly, C.A.; Cauchemez, S.; Hanage, W.P.; Van Kerkhove, M.D.; Hollingsworth, T.D.; Griffin, J.; Baggaley, R.F.; Jenkins, H.E.; Lyons, E.J. Pandemic potential of a strain of influenza A (H1N1): Early findings. Science 2009, 324, 1557–1561. [Google Scholar] [CrossRef] [Green Version]
- Lopez, L.F.; Amaku, M.; Coutinho, F.A.B.; Quam, M.; Burattini, M.N.; Struchiner, C.J.; Wilder-Smith, A.; Massad, E. Modeling importations and exportations of infectious diseases via travelers. Bull. Math. Biol. 2016, 78, 185–209. [Google Scholar] [CrossRef]
- Quam, M.B.; Khan, K.; Sears, J.; Hu, W.; Rocklöv, J.; Wilder-Smith, A. Estimating air travel–associated importations of dengue virus into Italy. J. Travel Med. 2015, 22, 186–193. [Google Scholar] [CrossRef] [Green Version]
- Quam, M.B.; Wilder-Smith, A. Importation index of dengue to determine the most probable origin of importation. J. Travel Med. 2015, 22, 72. [Google Scholar] [CrossRef] [Green Version]
- Brockmann, D.; Helbing, D. The hidden geometry of complex, network-driven contagion phenomena. Science 2013, 342, 1337–1342. [Google Scholar] [CrossRef] [PubMed] [Green Version]
- Ravenstein, E.G. The laws of migration. J. Stat. Soc. Lond. 1885, 48, 167–235. [Google Scholar] [CrossRef]
- Simini, F.; González, M.C.; Maritan, A.; Barabási, A.-L. A universal model for mobility and migration patterns. Nature 2012, 484, 96–100. [Google Scholar] [CrossRef] [PubMed]
- Huang, Z.; Wu, X.; Garcia, A.J.; Fik, T.J.; Tatem, A.J. An open-access modeled passenger flow matrix for the global air network in 2010. PLoS ONE 2013, 8, e64317. [Google Scholar] [CrossRef] [Green Version]
- Mao, L.; Wu, X.; Huang, Z.; Tatem, A.J. Modeling monthly flows of global air travel passengers: An open-access data resource. J. Transp. Geogr. 2015, 48, 52–60. [Google Scholar] [CrossRef] [PubMed] [Green Version]
- Balcan, D.; Colizza, V.; Gonçalves, B.; Hu, H.; Ramasco, J.J.; Vespignani, A. Multiscale mobility networks and the spatial spreading of infectious diseases. Proc. Natl. Acad. Sci. USA 2009, 106, 21484–21489. [Google Scholar] [CrossRef] [PubMed] [Green Version]
- Ajelli, M.; Gonçalves, B.; Balcan, D.; Colizza, V.; Hu, H.; Ramasco, J.J.; Merler, S.; Vespignani, A. Comparing large-scale computational approaches to epidemic modeling: Agent-based versus structured metapopulation models. BMC Infect. Dis. 2010, 10, 190. [Google Scholar] [CrossRef] [PubMed] [Green Version]
- Balcan, D.; Gonçalves, B.; Hu, H.; Ramasco, J.J.; Colizza, V.; Vespignani, A. Modeling the spatial spread of infectious diseases: The GLobal Epidemic and Mobility computational model. J. Comput. Sci. 2010, 1, 132–145. [Google Scholar] [CrossRef] [Green Version]
- Candia, J.; González, M.C.; Wang, P.; Schoenharl, T.; Madey, G.; Barabási, A.-L. Uncovering individual and collective human dynamics from mobile phone records. J. Phys. A Math. Theor. 2008, 41, 224015. [Google Scholar] [CrossRef] [Green Version]
- Gonzalez, M.C.; Hidalgo, C.A.; Barabasi, A.-L. Understanding individual human mobility patterns. Nature 2008, 453, 779–782. [Google Scholar] [CrossRef]
- Xiong, C.; Hu, S.; Yang, M.; Luo, W.; Zhang, L. Mobile device data reveal the dynamics in a positive relationship between human mobility and COVID-19 infections. Proc. Natl. Acad. Sci. USA 2020, 117, 27087–27089. [Google Scholar] [CrossRef] [PubMed]
- Coronaviridae Study Group of the International Committee on Taxonomy of Viruses. The species Severe acute respiratory syndrome-related coronavirus: Classifying 2019-nCoV and naming it SARS-CoV-2. Nat. Microbiol. 2020, 5, 536–544. [Google Scholar] [CrossRef] [PubMed] [Green Version]
- Kraemer, M.U.; Yang, C.-H.; Gutierrez, B.; Wu, C.-H.; Klein, B.; Pigott, D.M.; Du Plessis, L.; Faria, N.R.; Li, R.; Hanage, W.P. The effect of human mobility and control measures on the COVID-19 epidemic in China. Science 2020, 368, 493–497. [Google Scholar] [CrossRef] [PubMed] [Green Version]
- Badr, H.S.; Du, H.; Marshall, M.; Dong, E.; Squire, M.M.; Gardner, L.M. Association between mobility patterns and COVID-19 transmission in the USA: A mathematical modelling study. Lancet Infect. Dis. 2020, 20, 1247–1254. [Google Scholar] [CrossRef]
- Cartenì, A.; Di Francesco, L.; Martino, M. How mobility habits influenced the spread of the COVID-19 pandemic: Results from the Italian case study. Sci. Total Environ. 2020, 741, 140489. [Google Scholar] [CrossRef] [PubMed]
- Lai, S.; Ruktanonchai, N.W.; Zhou, L.; Prosper, O.; Luo, W.; Floyd, J.R.; Wesolowski, A.; Santillana, M.; Zhang, C.; Du, X. Effect of non-pharmaceutical interventions to contain COVID-19 in China. Nature 2020, 585, 410–413. [Google Scholar] [CrossRef] [PubMed]
- Chang, S.; Pierson, E.; Koh, P.W.; Gerardin, J.; Redbird, B.; Grusky, D.; Leskovec, J. Mobility network models of COVID-19 explain inequities and inform reopening. Nature 2021, 589, 82–87. [Google Scholar] [CrossRef]
- Ruktanonchai, N.W.; Floyd, J.; Lai, S.; Ruktanonchai, C.W.; Sadilek, A.; Rente-Lourenco, P.; Ben, X.; Carioli, A.; Gwinn, J.; Steele, J. Assessing the impact of coordinated COVID-19 exit strategies across Europe. Science 2020, 369, 1465–1470. [Google Scholar] [CrossRef]
- Pepe, E.; Bajardi, P.; Gauvin, L.; Privitera, F.; Lake, B.; Cattuto, C.; Tizzoni, M. COVID-19 outbreak response: A first assessment of mobility changes in Italy following national lockdown. Sci. Data 2020, 7, 230. [Google Scholar] [CrossRef]
- Pan, Y.; Darzi, A.; Kabiri, A.; Zhao, G.; Luo, W.; Xiong, C.; Zhang, L. Quantifying human mobility behaviour changes during the COVID-19 outbreak in the United States. Sci. Rep. 2020, 10, 1–9. [Google Scholar] [CrossRef]
- Kang, Y.; Gao, S.; Liang, Y.; Li, M.; Rao, J.; Kruse, J. Multiscale dynamic human mobility flow dataset in the US during the COVID-19 epidemic. Sci. Data 2020, 7, 1–13. [Google Scholar] [CrossRef] [PubMed]
- Baidu Map Migration Big Data Platform. Available online: http://qianxi.baidu.com/ (accessed on 1 March 2020).
- Tencent location Big Data. Available online: https://heat.qq.com/ (accessed on 1 March 2020).
- VariFlight Big Data. Available online: https://data.variflight.com/ (accessed on 1 March 2020).
- National Health Commission of the People’s Republic of China. Available online: http://www.nhc.gov.cn/xcs/yqtb/list_gzbd.shtml (accessed on 1 May 2020).
- Mahikul, W.; Chotsiri, P.; Ploddi, K.; Pan-ngum, W. Evaluating the Impact of Intervention Strategies on the First Wave and Predicting the Second Wave of COVID-19 in Thailand: A Mathematical Modeling Study. Biology 2021, 10, 80. [Google Scholar] [CrossRef] [PubMed]
- Wölfel, R.; Corman, V.M.; Guggemos, W.; Seilmaier, M.; Zange, S.; Müller, M.A.; Niemeyer, D.; Jones, T.C.; Vollmar, P.; Rothe, C.; et al. Virological assessment of hospitalized patients with COVID-2019. Nature 2020, 581, 465–469. [Google Scholar] [CrossRef] [PubMed] [Green Version]
- Pan, A.; Liu, L.; Wang, C.; Guo, H.; Hao, X.; Wang, Q.; Huang, J.; He, N.; Yu, H.; Lin, X. Association of Public Health Interventions With the Epidemiology of the COVID-19 Outbreak in Wuhan, China. JAMA J. Am. Med. Assoc. 2020, 323, 19. [Google Scholar] [CrossRef] [Green Version]
- Nishiura, H.; Kobayashi, T.; Suzuki, A.; Jung, S.M.; Miyama, T. Estimation of the asymptomatic ratio of novel coronavirus infections (COVID-19). Int. J. Infect. Dis. 2020, 94, 154. [Google Scholar] [CrossRef] [PubMed]
- Protocol on Prevention and Control of COVID-19 (Edition 6). Available online: http://en.nhc.gov.cn/2020-03/29/c_78468.htm (accessed on 1 May 2020).
- Zhang, J.; Litvinova, M.; Liang, Y.; Wang, Y.; Yu, H. Changes in contact patterns shape the dynamics of the COVID-19 outbreak in China. Science 2020, 368, eabb8001. [Google Scholar] [CrossRef]
- Chong, E.; Zak, S.H. An Introduction to Optimization, 4th ed.; John Wiley & Sons: Hoboken, NJ, USA, 2013; pp. 453–476. [Google Scholar]
- Rosvall, M.; Bergstrom, C.T. Maps of Random Walks on Complex Networks Reveal Community Structure. Proc. Natl. Acad. Sci. USA 2008, 105, 1118–1123. [Google Scholar] [CrossRef] [Green Version]
- Li, Q.; Guan, X.; Wu, P.; Wang, X.; Zhou, L.; Tong, Y.; Ren, R.; Leung, K.S.M.; Lau, E.H.Y.; Wong, J.Y.; et al. Early Transmission Dynamics in Wuhan, China, of Novel Coronavirus–Infected Pneumonia. N. Engl. J. Med. 2020, 382, 1199–1207. [Google Scholar] [CrossRef]


Publisher’s Note: MDPI stays neutral with regard to jurisdictional claims in published maps and institutional affiliations. |
© 2021 by the authors. Licensee MDPI, Basel, Switzerland. This article is an open access article distributed under the terms and conditions of the Creative Commons Attribution (CC BY) license (https://creativecommons.org/licenses/by/4.0/).
Share and Cite
Li, Z.; Li, H.; Zhang, X.; Zhao, C. Estimation of Human Mobility Patterns for Forecasting the Early Spread of Disease. Healthcare 2021, 9, 1224. https://doi.org/10.3390/healthcare9091224
Li Z, Li H, Zhang X, Zhao C. Estimation of Human Mobility Patterns for Forecasting the Early Spread of Disease. Healthcare. 2021; 9(9):1224. https://doi.org/10.3390/healthcare9091224
Chicago/Turabian StyleLi, Zhengyan, Huichun Li, Xue Zhang, and Chengli Zhao. 2021. "Estimation of Human Mobility Patterns for Forecasting the Early Spread of Disease" Healthcare 9, no. 9: 1224. https://doi.org/10.3390/healthcare9091224