
Forecast of the COVID-19 Epidemic Based on RF-BOA-LightGBM


School of Life Sciences, Central South University, Changsha 410083, China
*
Author to whom correspondence should be addressed.
Healthcare 2021, 9(9), 1172; https://doi.org/10.3390/healthcare9091172
Submission received: 21 July 2021
/
Revised: 26 August 2021
/
Accepted: 30 August 2021
/
Published: 6 September 2021
(This article belongs to the Special Issue Artificial Intelligence (AI) and Machine Learning (ML) in Human Health and Healthcare)
Abstract
:In this paper, we utilize the Internet big data tool, namely Baidu Index, to predict the development trend of the new coronavirus pneumonia epidemic to obtain further data. By selecting appropriate keywords, we can collect the data of COVID-19 cases in China between 1 January 2020 and 1 April 2020. After preprocessing the data set, the optimal sub-data set can be obtained by using random forest feature selection method. The optimization results of the seven hyperparameters of the LightGBM model by grid search, random search and Bayesian optimization algorithms are compared. The experimental results show that applying the data set obtained from the Baidu Index to the Bayesian-optimized LightGBM model can better predict the growth of the number of patients with new coronary pneumonias, and also help people to make accurate judgments to the development trend of the new coronary pneumonia.
1. Introduction
During the outbreak of infectious diseases, social media is usually the most active platform for the exchange of information on infectious disease, and the information released is often of good real-time. Using Internet information to predict the epidemic situation of infectious diseases is one of the current research hotspots. L. Lu et al. used Baidu index and micro-index to conduct a comparative study on influenza surveillance in China [1]. J. H. Lu, School of Public Health, Sun Yat-sen University, and others studied the use of Internet search queries or social media data to monitor the temporal and spatial trends of the Avian Influenza (H7N9) in China, and the results show that the number of H7N9 cases is positively correlated with Baidu Index and Weibo Index search results in space and time [2]. J. X. Feng of the University of South Georgia and others studied the impact of Chinese social networks on the Middle East Respiratory Syndrome Coronavirus and Avian Influenza [3]. Mutual relations prove the effectiveness of using social media to predict infectious diseases. H. G. Gu et al. collected data on cases of H7N9 avian influenza in the Chinese urban population through the Internet, as well as geographic and meteorological data during the same period, and established a disease risk early warning model for human infection with H7N9 avian influenza, which can identify the high risk areas of avian influenza outbreaks and issue an early warning [4]. However, in these studies, most of the search process of network data adopts manual empirical methods to select keywords for search, and the choice of keywords often has a greater impact on search results.
At present, the focus of the world’s attention is mainly on the changes in the epidemic situation of the new type of coronary pneumonia. During the four months after the outbreak of the new type of coronavirus in Wuhan, Hubei in December 2019, the epidemic information was widely disseminated on social media such as Baidu, Sina, 360, Sogou, WeChat and QQ. Google, Weibo, Zhihu, Dingxiangyuan, Twitter, Facebook, etc. also released a lot of information about the new coronavirus epidemic, especially through the Google platform to spread to the world. On 31 March 2019, Google launched a project called “COVID-19 Public Datasets” to provide a public database related to the epidemic and open it to the public for free, which means that people can freely access and analyze relevant data and information [5]. How to use this information to predict the spread of the new type of coronary pneumonia in time is an urgent research topic. Currently, X. M. Zhao and others have proposed to use big data retrospective technology to study the spreading trend and epidemic control of the new coronary pneumonia [6]. B. McCall et al. used artificial intelligence methods to predict the new type of coronary pneumonia, thereby protecting medical staff and controlling the spread of the epidemic [7]. These studies are still in the preliminary stage, and the use of network data and prediction of the new coronary pneumonia are not yet ideal.
In this article, we consider that the amount of data indexed by Baidu is large enough for us to use. Based on this, we use the first feature in the search index, namely Baidu index [8], to study the prediction of the epidemic of new coronary pneumonia. We collected data on COVID-19 cases in China from 1 January 2020 to 1 April 2020, and used the random forest feature selection method to select the optimal sub-data set, and used grid search, random search and the Bayesian optimization algorithm optimizes the 7 hyperparameters of the LightGBM (light gradient boosting machine) model. The results show that the application of the data set obtained from the Baidu index to the Bayesian-optimized LightGBM model can better predict the growth of the number of patients with new coronary pneumonia.
This paper is organized as follows. In Section 2, we introduce the data set and analysis method used in detail. Baidu index search and actual case results are compared in time and space, and the impact of keywords and selected index in Baidu index search on the results is analyzed. Model structure, data set preprocessing methods, tuning algorithm, etc. are also introduced in detail. In Section 3, the experimental results are showed and related discussions are presented. Finally, the conclusion is drawn in Section 4.
2. Materials and Methods
2.1. COVID-19 Dataset
In order to standardize prevention and treatment, on 11 February 2020, the World Health Organization named the pneumonia caused by the new coronavirus as “COVID-19” (Corona Virus Disease 2019). In this study, we first obtain the data of COVID-19 cases that occurred in China from 1 January 2020 to 1 April 2020 by searching the COVID-19 Public Datasets on the Google platform, mainly including diagnosis number and death toll, and use them as actual data. These data are released by the Centers for Disease Control (CDC), so we identify these data as CDC data , namely the CDC-Diagnosis and CDC-Death toll mentioned in this paper. Then, we can collect keywords related to COVID-19 through commonly used social networking sites, such as Baidu, Sina, 360, Sogou, WeChat, QQ, Google, Weibo, Zhihu, Dingxiangyuan, Twitter, Facebook, etc., And form a keyword library. Then use the Baidu index platform (http://index.baidu.com, (accessed on 1 April 2020)) to retrieve relevant keywords, and use the statistics of the average daily search volume of relevant Chinese keywords as social network mining data for prediction. In this article, this part of the data is identified as Baidu index data.
By searching for the name and clinical symptoms of new coronavirus pneumonia on social networking sites, we can get the following keywords: new coronavirus, fever, dry cough, fatigue, dyspnea and cough. Using the Baidu index platform to retrieve the above keywords, we can get the average daily search volume of each keyword from 1 January 2020 to 1 April 2020, that is, Baidu index data. Table 1 shows part of the data of the CDC data set and the Baidu index data set. See Appendix A for all the data.
2.1.1. Time and Space Comparative Analysis of Baidu Index Search and Actual Cases
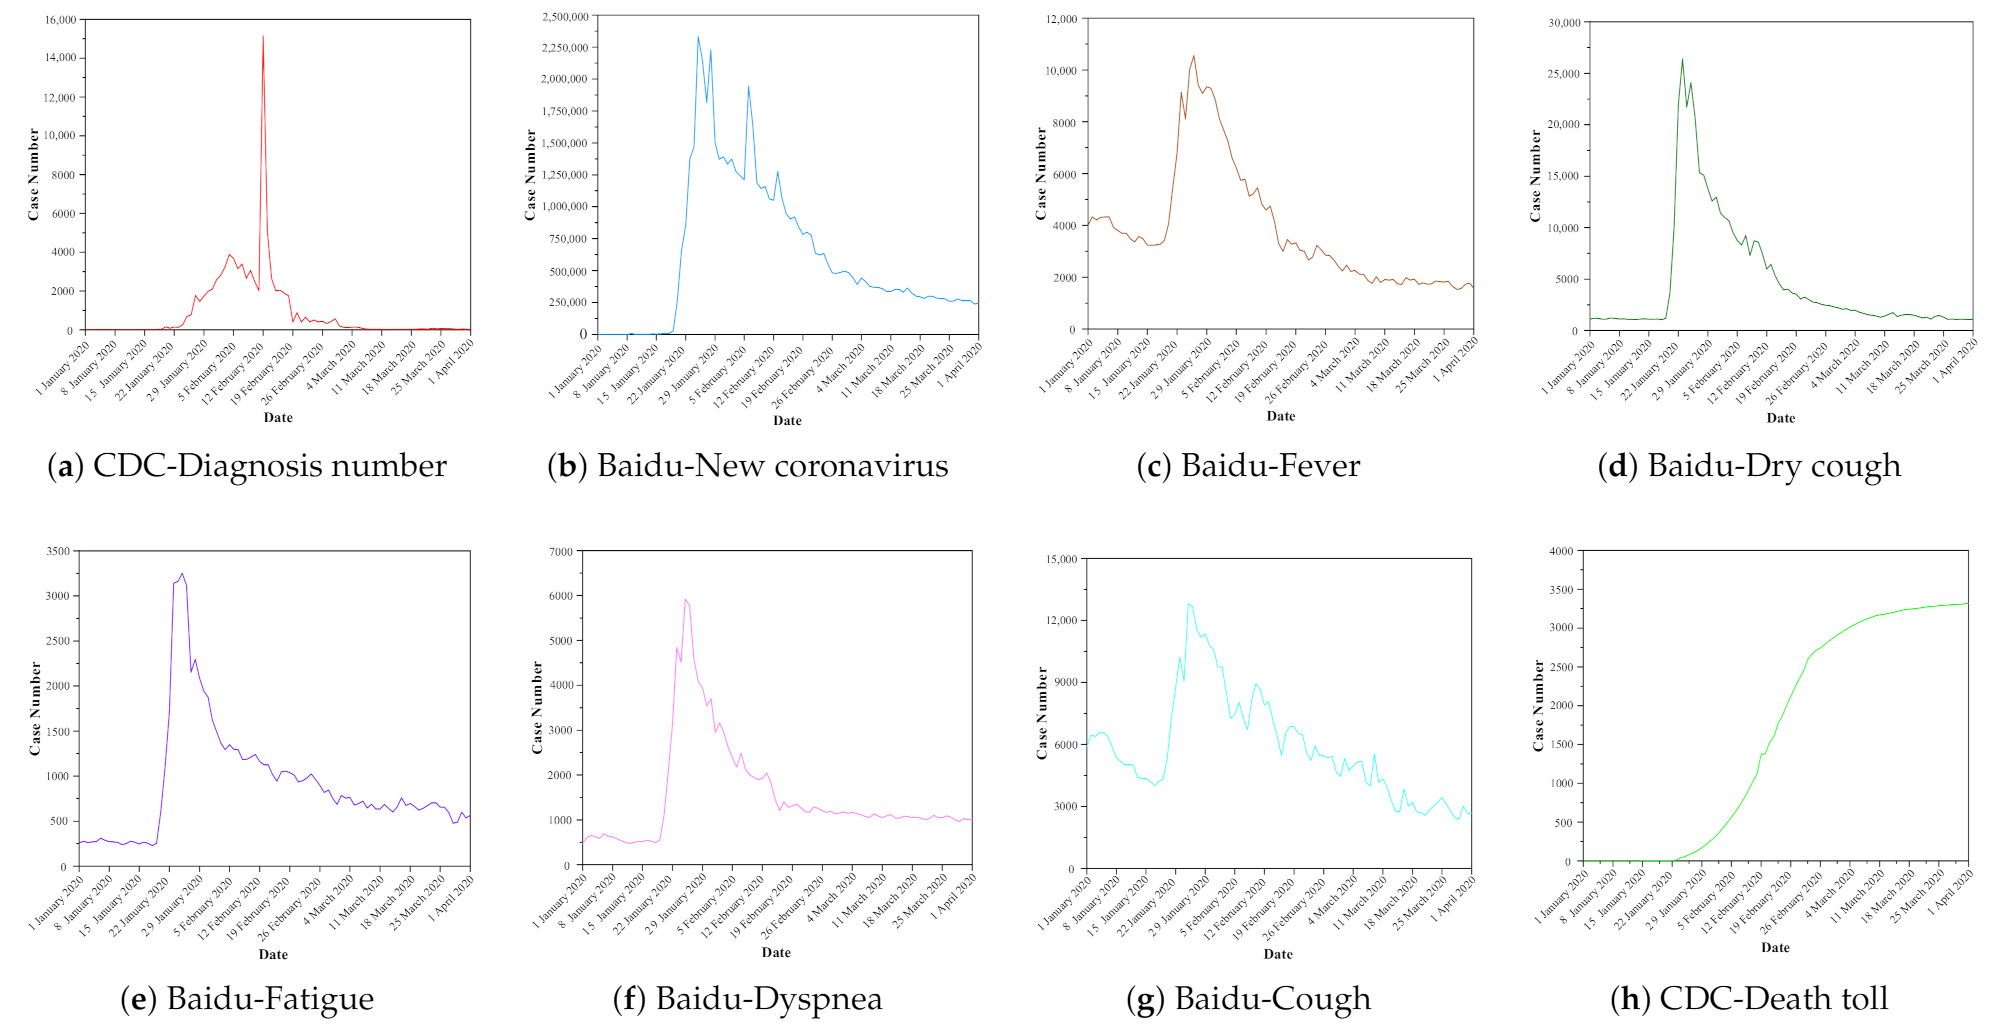
Based on the data obtained during the data collection phase, we have drawn the trend graph of CDC data and Baidu Index data over time, as shown in Figure 1. From Figure 1a–g, it can be seen that the keyword “dry cough” is the most commonly used keyword when Chinese netizens search for symptoms of new coronavirus pneumonia, followed by fever, dyspnea, and fatigue. We can see that in the Baidu index method, the keywords “new coronavirus” and “dry cough” are the best choices. The extracted data has the best spatio-temporal positive correlation with the actual number of cases. Through website search, we can find that these two keywords mainly appear in the columns of Baidu Baike and Baidu Health Pharmacopoeia. Therefore, it is recommended to search these two columns first when choosing keywords in the future. On the other hand, it can also be seen that the Baidu index method is used to predict the change trend of the new coronavirus pneumonia. If the keywords are not selected properly, not only will the accuracy of the prediction be low, but sometimes it may even make it impossible to predict in advance.
In addition, we can see that the CDC diagnosis number and Baidu index data have peak times, so we can compare the correlation between the Baidu index data and the CDC-Diagnosis number from the perspective of the first peak generation time and the time difference, which are shown in Table 2. From the comparative analysis of Figure 1 and Table 2, we can draw the following conclusions. The actual number of new coronavirus pneumonia cases in China reached its highest value on 12 February 2020, which was 15,152, while the Baidu Index data all reach their peak before this date, and the average value of the first peak time difference between the Baidu Index data based on the six keywords and the newly diagnosed CDC is 18 days. This is mainly because during the outbreak of the COVID-19, people like to discuss the it on social media networks. The information released on the new crown epidemic is often of good real-time. The CDC data collection comes from the national infectious disease surveillance system, where the pneumonia often requires a longer diagnosis process from onset to diagnosis, usually 7–14 days.
2.1.2. The Influence of the Selected Index on the Result
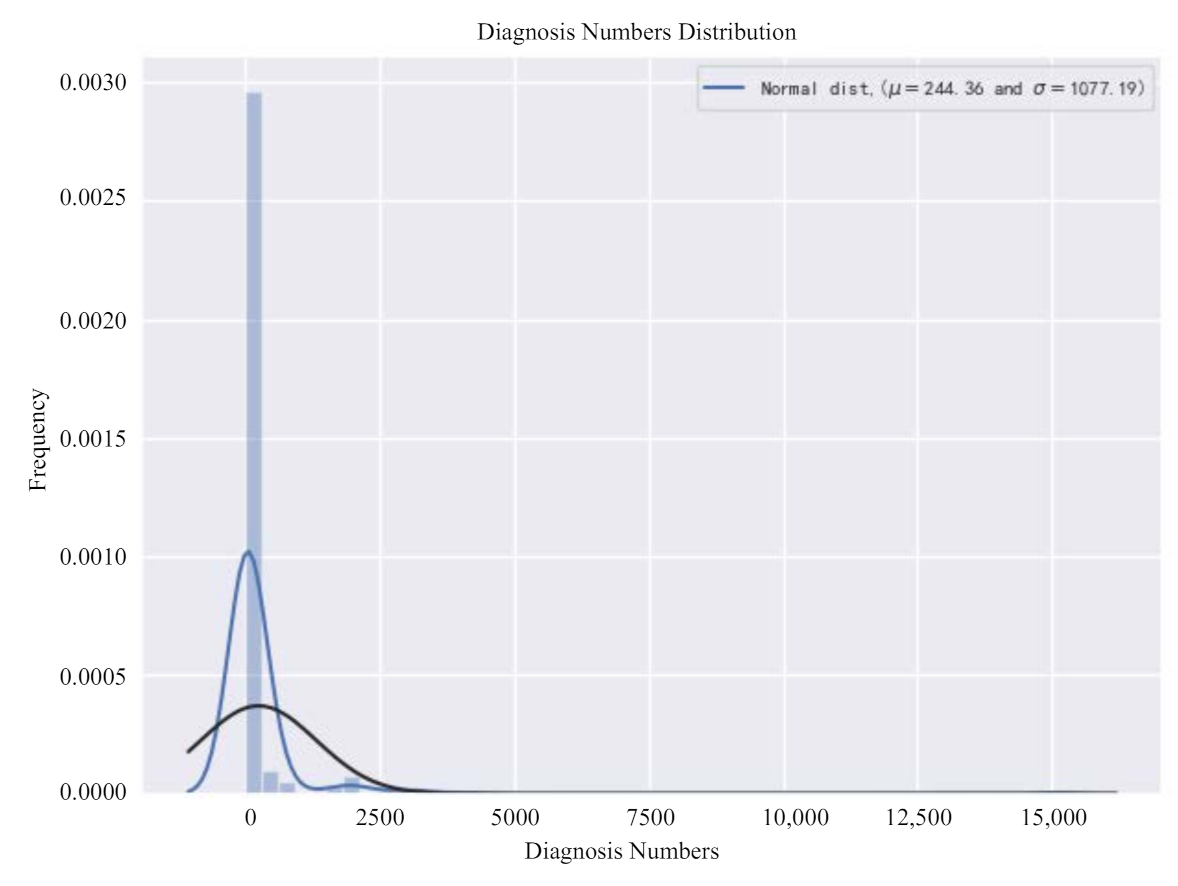
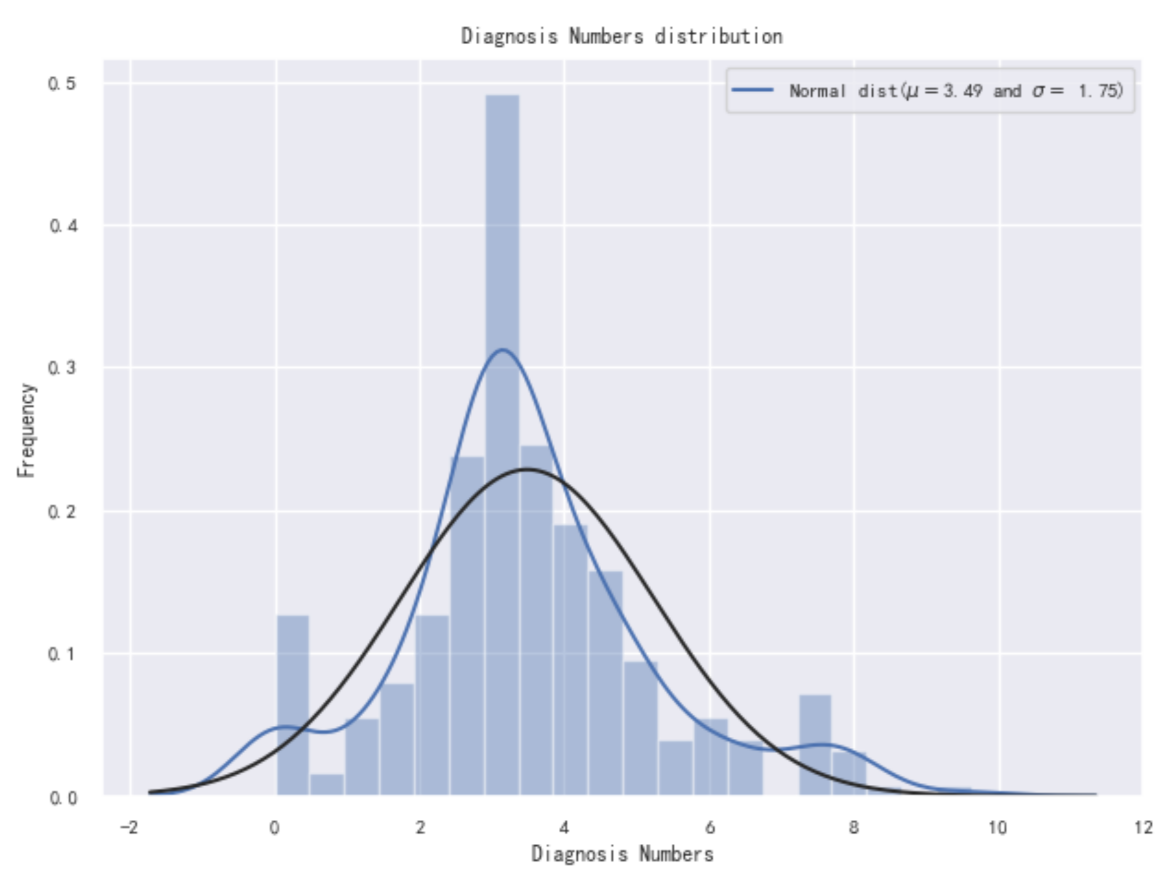
In order to explore the impact of the selected index on the results, we first need to check the distribution of the number of new coronavirus confirmed in the data, as shown in Figure 2. It can be seen from the figure that the overall distribution of the target variable deviates from the normal distribution and needs to be adjusted later. The skewness and kurtosis are calculated again, and the calculation results are 10.72 and 140.84, respectively. It can basically be determined that the skewness of the data in this paper is relatively large and needs to be adjusted.
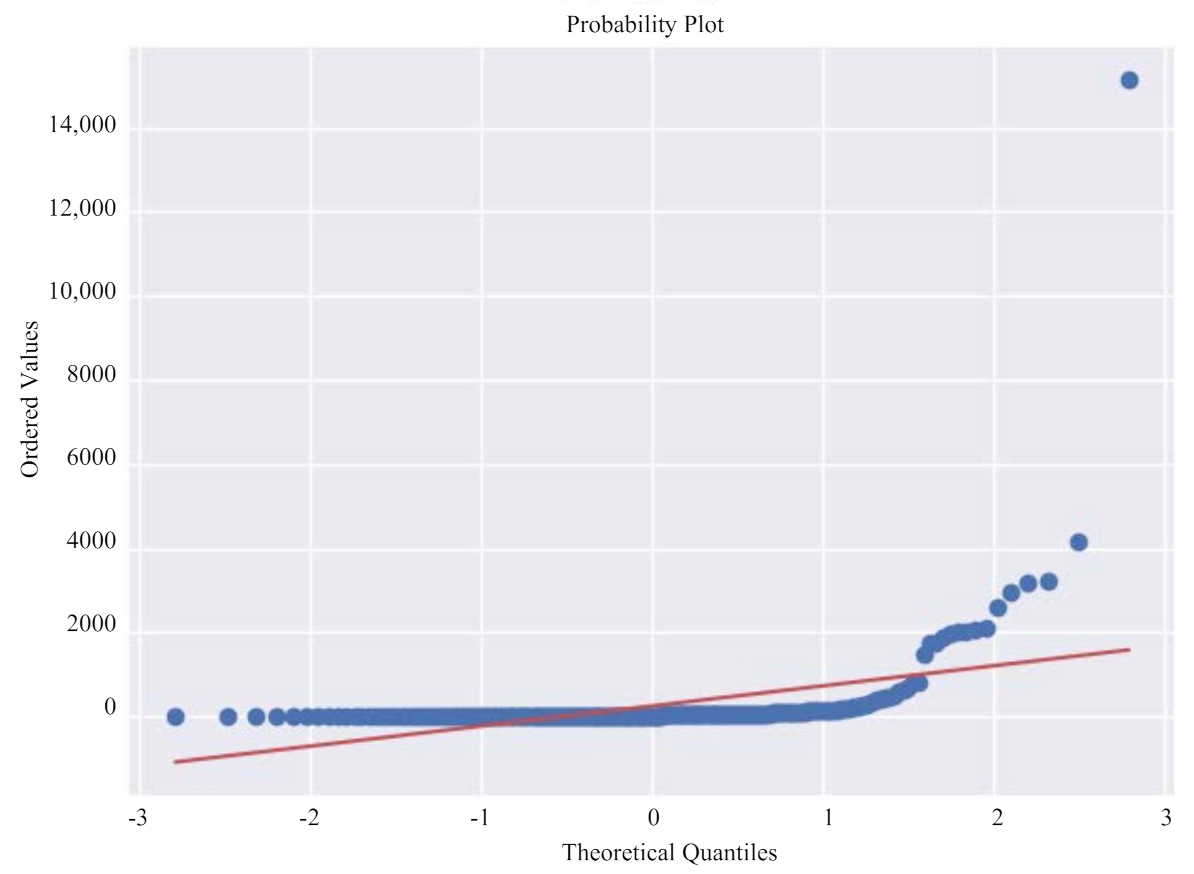
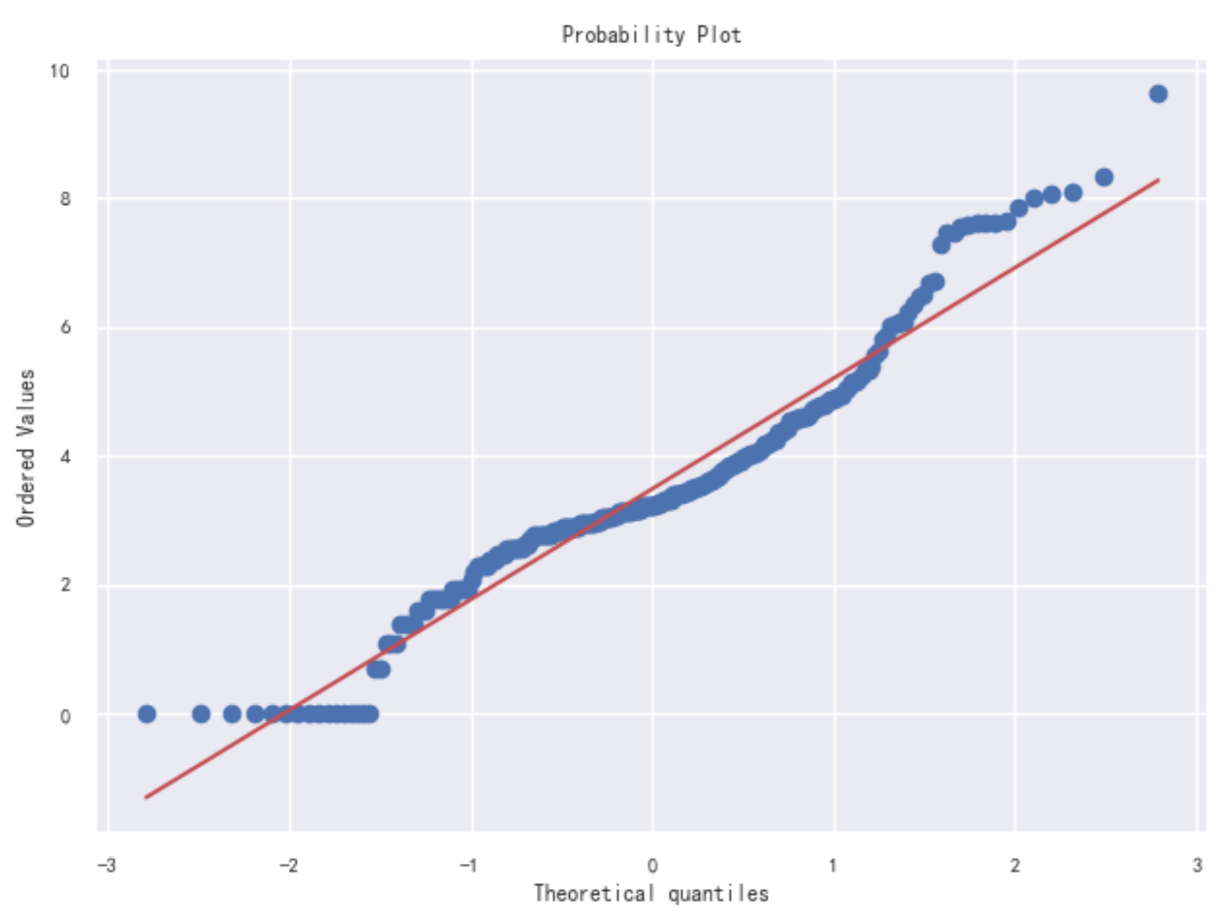
Figure 3 shows the Q-Q graph of the COVID-19 data set. Judge whether the data conforms to the normal distribution by comparing whether the quantiles of the data and the normal distribution are equal. The red line represents the normal distribution, and the blue line represents the sample data. The closer the blue and red reference lines are, the more in line with the expected distribution. From the distribution of data, the data presents a normal state. It is further verified that the data distribution has a large skewness, and further data conversion is needed to make it conform to the normal distribution.
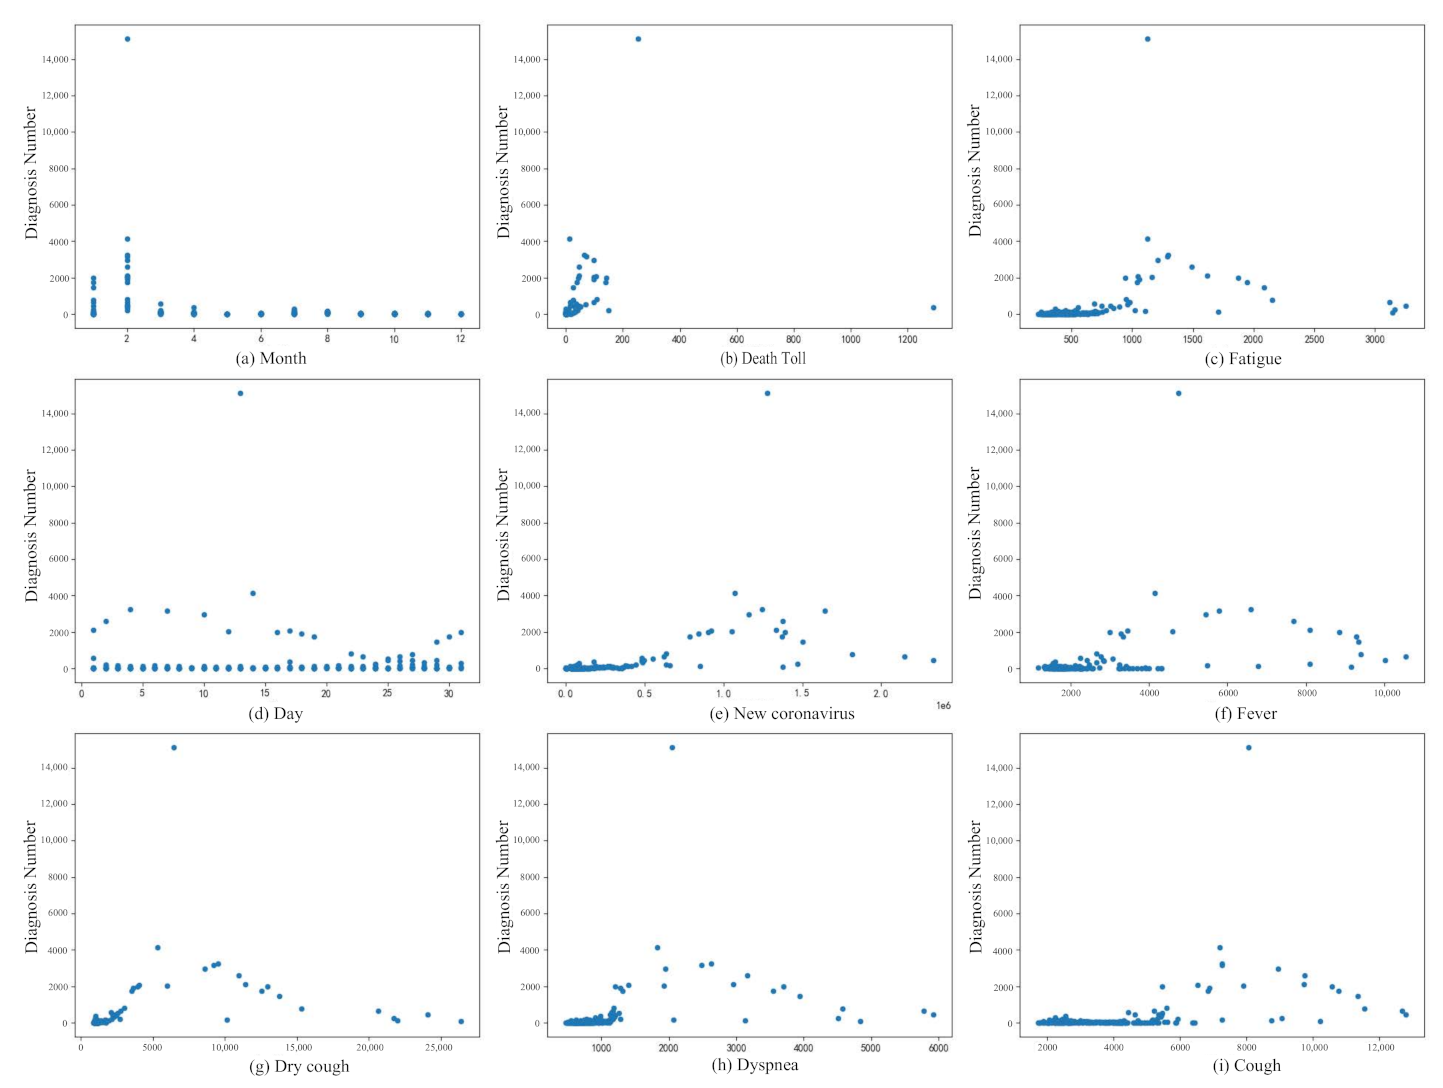
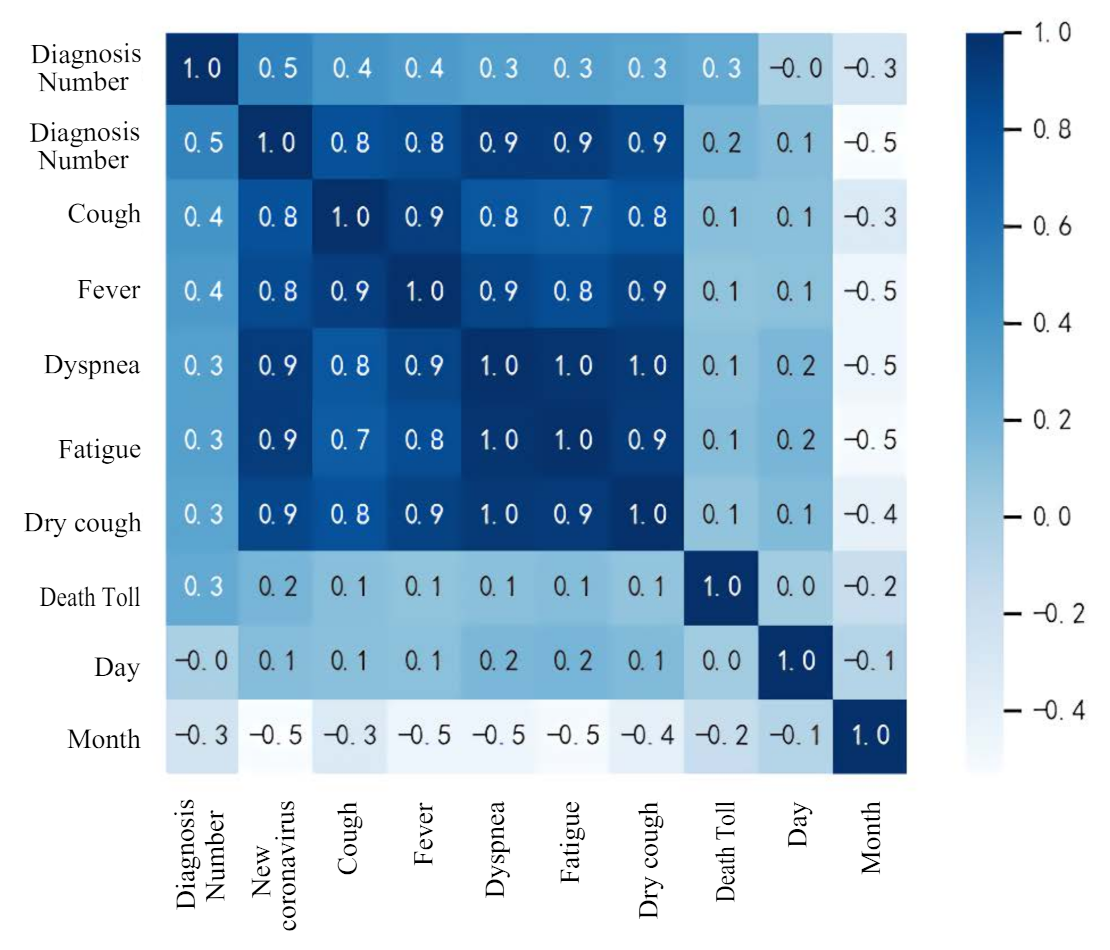
Figure 4 shows the relationship between Diagnosis Numbers and other attributes. It can be seen from the figure that the attributes in the data set are basically positively correlated with the attributes of Diagnosis Numbers. Figure 5 shows the relationship between all attributes, which can be represented by a heat map. The heat map uses different colors to intuitively show the relationship between different attributes, which is a very simple way of data interpretation. The values in the figure are calculated using Pearson’s correlation coefficient. The calculation formula of Pearson’s correlation coefficient is
It can be seen from the heat map that the attribute of month is negatively correlated with Diagnosis Numbers. It can be seen from the above analysis that the collected data set has a certain influence on Diagnosis Numbers and can be used for the numerical prediction of Diagnosis Numbers.
2.2. RF-BOA-LightGBM
As a new cutting-edge technology, predictive models based on machine learning have been widely used in various fields of medicine. For example, Y. D. Zhang et al. proposed a new attention network model, namely ANC (attention network for COVID-19) model, which can diagnose COVID-19 more effectively and accurately [9]. X. Zhang et al. enhanced the deep learning network AlexNet to achieve a more effective classification of new coronary pneumonia [10]. Here, we consider using the RF-BOA-LightGBM (random forest-Bayesian optimization algorithm-light gradient boosting machine) model to predict the development trend of the COVID-19.
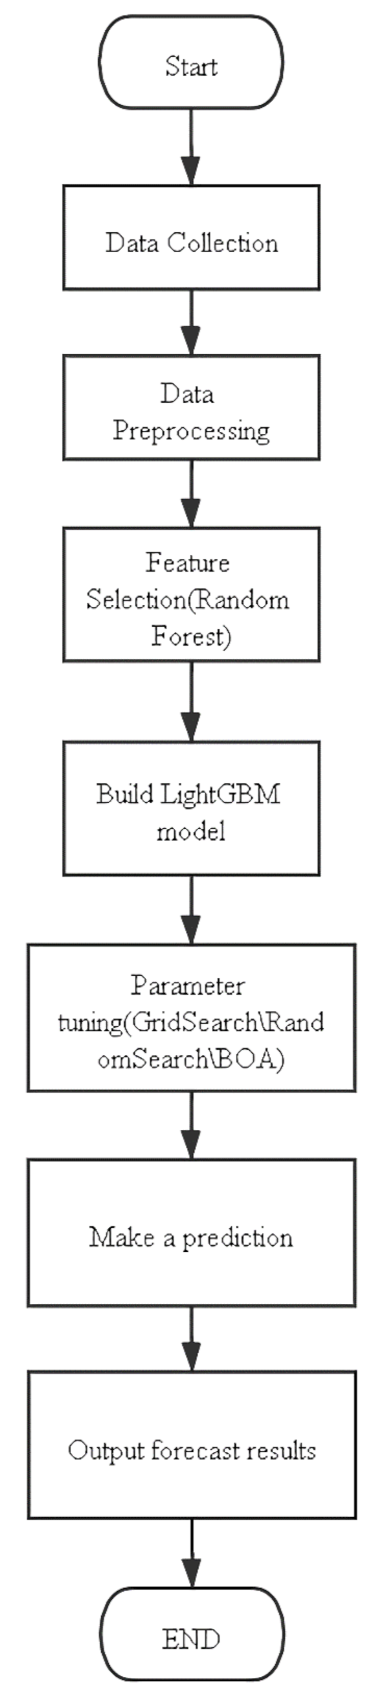
2.2.1. Model Structure
Figure 6 shows the model structure used in this article. After collecting the data, you need to perform a simple processing on the data, so that this model can “learn” the data. Then build the LightGBM model for training, but due to the many parameters of LightGBM, the effect of using the default parameters to train the data set in this article is not necessarily good, so three hyperparameter tuning algorithms are introduced here to adjust the model parameters of LightGBM Perform tuning. After finding a combination of model parameters suitable for the data set in this article, the training prediction is carried out.
2.2.2. Dataset Preprocessing
In order to enable the model to fully learn the data obtained from the Baidu Index COVID-19 vaccine, this article first made great efforts to preprocess the data. It can be seen from the foregoing that the distribution of the data in this paper presents a similar normal distribution. Therefore, this article first performs logarithmic transformation on the data to make the data satisfy the normal distribution. The data conversion formula is
Then, deal with the missing data in the data set and delete the samples with missing values (there are not many samples with missing values, which has little effect on the results). Subsequently, the date is divided into three attributes: year, month, and day, and the year attribute is deleted (the year attribute is a fixed value and has little effect on the result), which avoids the problem that the model cannot directly process the date. Finally, the maximum and minimum normalization method is used to integrate the data into (0, 1) range data, which eliminates the influence between samples of different orders of magnitude. The maximum and minimum normalization formula is as follows
The distribution graph and Q-Q graph of the processed data are shown in Figure 7 and Figure 8 respectively. As can be seen from the figure, the data has basically satisfied the normal distribution.
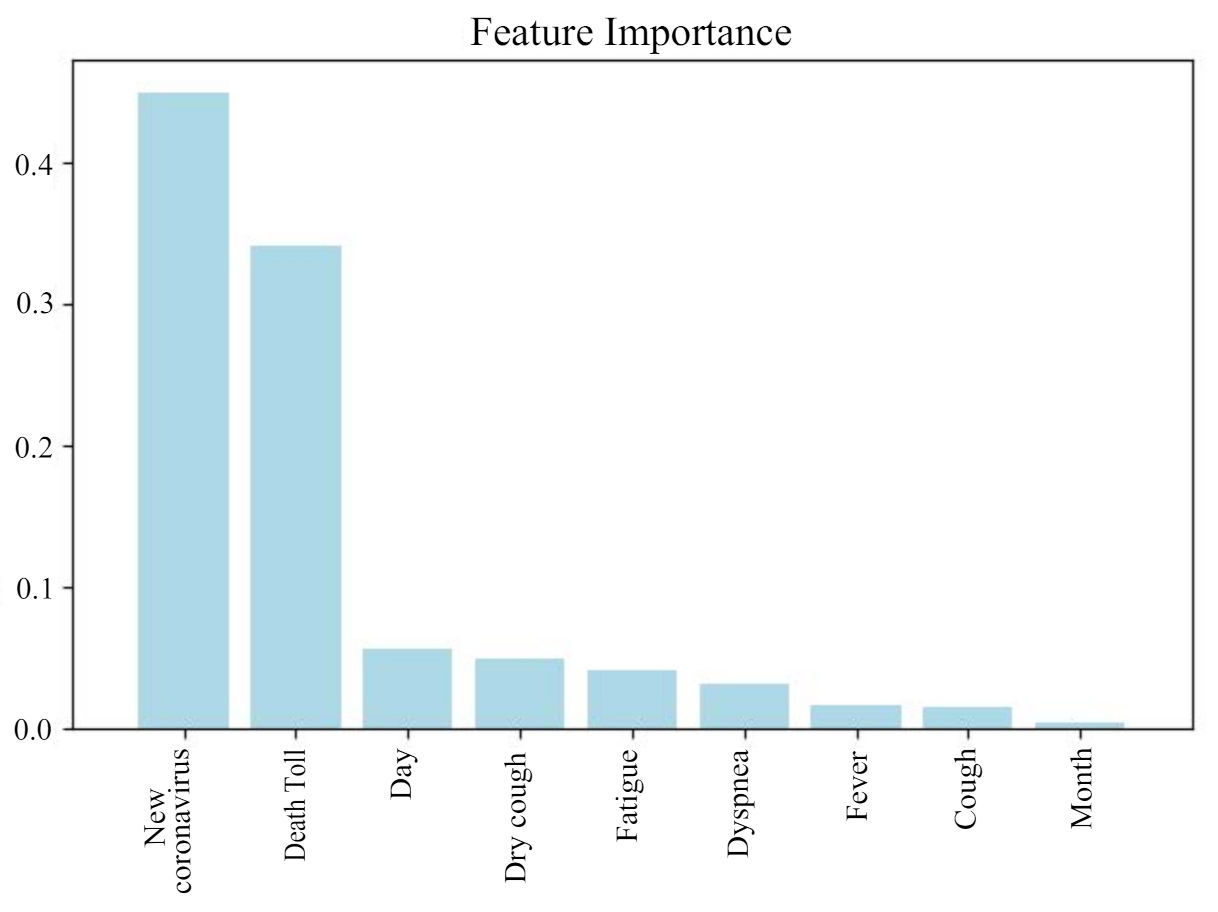
This data set contains feature data related to the number of new crowns, irrelevant feature data and related but redundant feature data. In the face of complex faults, it is no longer possible to accurately obtain the number of new crowns by relying only on expert experience and simple correlation analysis to perform feature selection work. Important features, so this article uses random forest (RF) out-of-bag estimation to rank the importance of new crown-related features. The random forest is used to select the features of the data set, and the features that have little influence on the prediction results are eliminated.
RF is a combined classifier based on decision trees, which can be used for feature selection [11]. RF uses the Bagging method to randomly and repeatably extract samples from the original sample set for classifier training. About 1/3 of the sample data will not be selected [12]. This data is called Out of Bag (OOB). When calculating the importance of a certain feature, use the OOB data as the base learner after the test set to test the training, and the test error rate is recorded as the out-of-bag error (errOOB). Add noise to the important features to be calculated in the OOB sample, and recalculate errOOB again. The average test error of all base learners is calculated by using the average accuracy decrease rate (MDA) as an indicator for feature importance calculation, namely
where n is the number of base learners, errOOB is the out-of-bag error after adding noise.
The more the MDA index decreases, the more the corresponding feature has a greater impact on the prediction result, and the higher its importance. This feature importance calculation method is called random forest out-of-bag estimation. According to this method, the importance of fault-related features is ranked and feature selection is performed.
2.2.3. Tuning Algorithm
For the LightGBM model, there are many internal hyperparameters that affect the prediction results. However, if the value of the hyperparameter used is the default value, this hyperparameter combination may not be the optimal hyperparameter combination for the new coronavirus number prediction data set [13]. Therefore, this paper introduces three tuning algorithms, namely grid search, random search, and Bayesian optimization, to optimize some important hyperparameters of LightGBM [14]. Before adjusting the parameters of LightGBM, the optimization range of hyperparameters is generally set first. These three algorithms are briefly described below.
Grid search divides the search range into grid shapes, and adjusts the parameters according to the set step to train the model until all possible combination parameters are verified, and finally the parameter combination that gives the best result is output [15]. Because the different prediction results of the data in each group of hyperparameter combinations are also different, when the hyperparameter combination is relatively large and the search range is relatively large, the optimization speed of the grid search is very slow.
Random search is similar to grid search, but it does not verify all possible parameter combinations like grid search, but randomly combines the random value of each parameter, so the speed of random search is faster than that of Grid search [16]. However, random search may also miss the parameter combination that maximizes the prediction result.
Bayesian optimization algorithm(BOA) can quickly find the optimal parameters for the problem to be solved based on historical experience [17]. The main problem scenarios for Bayesian optimization are
where x is the parameter to be optimized, S is the candidate set of x variable, that is, the set of possible values of parameter x. The target selects an x from the set S such that the value of is the largest or smallest. Here, the specific formula of may not be known, that is, the black box function. But you can choose an x, and get the value of through experiment or observation [18].
BOA has two core processes, a priori function (PF) and acquisition function (AC). The acquisition function is also called the efficiency function. Under the framework of Bayesian decision theory, many collection functions can be interpreted as evaluating the expected loss associated with f at point x, and then usually selecting the point with the lowest expected loss [19]. PF mainly uses Gaussian process regression, AC mainly uses these methods including EI (expected improvement), PI (probability of improvement) and UCB (upper confidence bound), and this article uses the EI function. The EI function can find out the global optimum without falling into the local optimum. The collection function is as follows
where f is the collection function, and is the optimized performance indicator.
The final collection function for variable x is
The calculation shows that the point corresponding to the maximum value of is the best point. There are two components in Formula (7). To maximize the value of it, you need to optimize the left and right parts at the same time, that is, the left side needs to reduce the as much as possible, and the right side needs to increase the variance (or covariance) K(x, x) as small as possible. It is a typical theory on issues such as exploration and exploitation.
Upper confidence bound (UCB) can be simply understood as the upper confidence boundary. It is usually described by maximizing f instead of minimizing f. But in the case of minimization, the collection function will take the following form
where is a strategy parameter, and is the boundary standard deviation of . Similarly, UCB also includes exploitation and exploration modes. It can converge to the global optimal value under certain conditions.
Table 3 shows the hyperparameter combinations selected in this article and the corresponding descriptions.
2.2.4. LightGBM
LightGBM is an open source decision tree-based gradient boosting framework proposed by Microsoft. As an improved version of Gradient Boosting, it has the characteristics of high accuracy, high training efficiency, support for parallelism and GPU, small memory required, and ability to handle large-scale data [20].
According to the different generation methods of the base learner, integrated learning can be divided into parallel learning and serial learning. As the most typical representative of serial learning, Boosting algorithm can be divided into Adaboost and Gradient Boosting. The main difference between them is that the former improves the model by increasing the weight of misclassified data points, while the latter improves the model by calculating negative gradients. The core idea of Gradient Boosting is to use the negative gradient of the loss function to approximate the value of the current model to replace the residual. Suppose the training sample is i (), the number of iterations is j (), and the loss function is , then the negative gradient can be expressed as
Use the base learner to fit the negative gradient r of the loss function, and find the best fit value that minimizes the loss function
Model update:
Gradient Boosting generates a base learner in each round of iteration. Through multiple rounds of iteration, the final strong learner is the base learner generated in each round and obtained by linear addition:
As an improved lightweight Gradient Boosting algorithm, the core ideas of LightGBM are: histogram algorithm, leaf growth strategy with depth limitation, direct support for category features, histogram feature optimization, multithreading optimization, and cache hit rate optimization. The first two features effectively control the complexity of the model and realize the lightweight of the algorithm, so this article is particularly concerned.
The histogram algorithm discretizes continuous floating-point features into L integers to construct a histogram with a width of L. When traversing the data, use the discretized value as an index to accumulate statistics in the histogram. After traversing the data once, the histogram accumulates the necessary statistics, and then find the optimal split point from the discrete values of the histogram .
The traditional leaf growth strategy can split the leaves of the same layer at the same time. In fact, the splitting gain of many leaves is low and there is no need to split, which brings a lot of unnecessary expenses. For this, LightGBM uses a more efficient leaf growth strategy: each time it searches for the leaf with the largest split gain from all the current leaves to split, and sets a maximum depth limit. While ensuring high efficiency, it also prevents the model from overfitting.
3. Results and Discussion
3.1. Performance Predictor
All models are cross-validated and the coefficient of determination (R2), mean absolute error (MAE), relative absolute error (RAE), relative square root error (RRSE), root mean square error (RMSE) are calculated, as shown below
where y represents the true value, represents the predicted value, represents the average value of the true value and n is the number of test sets.
3.2. Experiment Results
Figure 9 shows the result of feature selection using random deep forest, and the features are output in descending order of importance. It can be seen from the figure that Death Toll has the greatest impact on Diagnosis Numbers, while the attribute of Month has the least impact. Finally, we selected the 7 most influential attributes for the prediction of Diagnosis Numbers.
According to the optimal parameter set of the model, the Diagnosis Numbers prediction model of COVID-19 is constructed. In this paper, LightGBM, GridSearch-LightGBM, RandomSearch-LightGBM, and BOA-LightGBM models are used for Diagnosis Numbers prediction. Table 4 shows the specific values of the optimal parameter combinations found by the three tuning algorithms.
Table 5 shows the evaluation indicators of the prediction results of the four models. The prediction results of the model are evaluated by R2, RMSE, MAE, RAE, RRSE evaluation indicators. It can be seen from the values of the five evaluation indicators that the results of BOA-LightGBM are better than the former. RandomSearch-LightGBM and GridSearch-LightGBM have their own advantages and disadvantages. It can also be seen that the default hyperparameters of LightGBM are not suitable for the prediction of Diagnosis Numbers of COVID-19 in this article. From the approximate prediction effect, BOA-LightGBM can better analyze the relationship between historical data and can effectively predict the value of Diagnosis Numbers of COVID-19, which proves the superiority of the model.
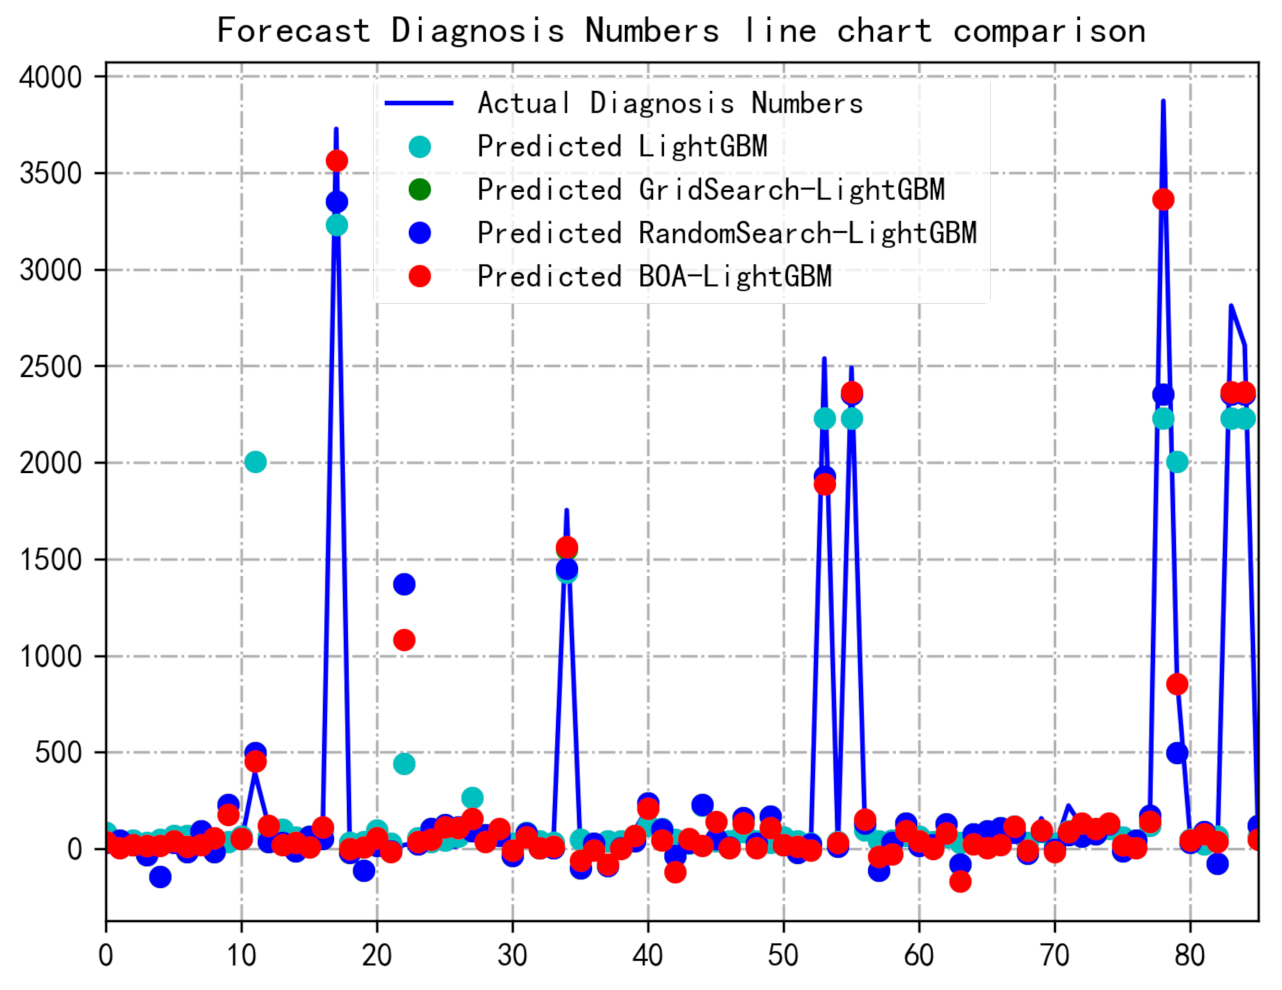
Figure 10 is a line chart of the four algorithms to predict Diagnosis Numbers, and only part of the data is taken on the abscissa. The prediction effect of the model can be seen more intuitively from the line graph. It can be seen from the figure that in most cases, the BOA-LightGBM model can better fit the fluctuation trend of Diagnosis Numbers at some points, and the predicted value is very close to the actual value. In the figure, the points predicted by GridSearch-LightGBM are basically covered, so they are not shown in the figure, which just shows that the prediction results are not very prominent. Sometimes the prediction value of LightGBM is better than other models, but most of them are inferior to other models. So comprehensively, the BOA-LightGBM model is more in line with the changing trend of real values.
4. Conclusions
This study uses the Internet big data tool-Baidu Index to predict the development trend of the new coronavirus pneumonia epidemic to obtain data. By selecting appropriate keywords, data on COVID-19 cases in China from 1 January 2020 to 1 April 2020 are collected. After preprocessing the data set, the random forest feature selection method is used to obtain the optimal sub-data set. After comparing and analyzing the optimization results of the seven hyperparameters of the LightGBM model with the three optimization algorithms of grid search, random search, and Bayesian optimization. It is concluded that applying the data set obtained from the Baidu Index to the Bayesian-optimized LightGBM model can better predict the increase in the number of new coronary pneumonias, and it is a good aid to predict the new number of new coronary pneumonia in the future medical structure effect.
Author Contributions
Conceptualization, D.H.H; methodology, Z.L. and D.H.H; formal analysis, Z.L.; data curation, Z.L.; writing—original draft preparation, Z.L.; writing—review and editing, D.H.H; validation, D.H.H All authors have read and agree to the published version of the manuscript.
Funding
This research received no external funding.
Institutional Review Board Statement
Not applicable.
Informed Consent Statement
Not applicable.
Data Availability Statement
Data are available at School of Life Sciences, Central South University, China.
Conflicts of Interest
The authors declare no conflict of interest.
Appendix A. Datasets from CDC and Baidu Index Search

Table A1.
Datasets from CDC and Baidu Index search.
| Source | CDC- Diagnosis | Baidu- New Coronavirus | Baidu- Fever | Baidu- Dry Cough | Baidu- Fatigue | Baidu- Dyspnea | Baidu- Cough | CDC- Death Toll | ||
|---|---|---|---|---|---|---|---|---|---|---|
| Data | ||||||||||
| Date | ||||||||||
| 1 January 2020 | 0 | 0 | 4001 | 1100 | 256 | 481 | 5885 | 0 | ||
| 2 January 2020 | 0 | 0 | 4323 | 1206 | 278 | 602 | 6448 | 0 | ||
| 3 January 2020 | 1 | 0 | 4212 | 1173 | 262 | 654 | 6392 | 0 | ||
| 4 January 2020 | 0 | 0 | 4309 | 1109 | 270 | 621 | 6570 | 0 | ||
| 5 January 2020 | 5 | 0 | 4327 | 1118 | 271 | 591 | 6564 | 0 | ||
| 6 January 2020 | 0 | 0 | 4324 | 1226 | 310 | 693 | 6404 | 0 | ||
| 7 January 2020 | 0 | 0 | 3920 | 1175 | 288 | 633 | 5875 | 0 | ||
| 8 January 2020 | 0 | 0 | 3803 | 1124 | 272 | 622 | 5354 | 0 | ||
| 9 January 2020 | 0 | 8812 | 3693 | 1131 | 270 | 579 | 5182 | 0 | ||
| 10 January 2020 | 0 | 2032 | 3700 | 1095 | 263 | 535 | 5022 | 0 | ||
| 11 January 2020 | 0 | 2879 | 3478 | 1083 | 237 | 498 | 5033 | 1 | ||
| 12 January 2020 | 0 | 1445 | 3364 | 1067 | 252 | 474 | 5011 | 1 | ||
| 13 January 2020 | 0 | 1515 | 3573 | 1118 | 278 | 494 | 4418 | 1 | ||
| 14 January 2020 | 0 | 4846 | 3479 | 1133 | 266 | 528 | 4359 | 1 | ||
| 15 January 2020 | 0 | 4191 | 3241 | 1097 | 245 | 512 | 4355 | 2 | ||
| 16 January 2020 | 0 | 5174 | 3230 | 1100 | 267 | 546 | 4220 | 2 | ||
| 17 January 2020 | 4 | 7713 | 3247 | 1114 | 254 | 521 | 4008 | 2 | ||
| 18 January 2020 | 17 | 7754 | 3271 | 1060 | 228 | 492 | 4218 | 2 | ||
| 19 January 2020 | 36 | 29,003 | 3418 | 1182 | 253 | 548 | 4323 | 2 | ||
| 20 January 2020 | 151 | 266,892 | 4064 | 3684 | 609 | 1090 | 5324 | 2 | ||
| 21 January 2020 | 77 | 659,926 | 5474 | 10,162 | 1106 | 2073 | 7260 | 2 | ||
| 22 January 2020 | 149 | 852,363 | 6782 | 21,967 | 1711 | 3125 | 8751 | 3 | ||
| 23 January 2020 | 131 | 1,374,253 | 9151 | 26,393 | 3141 | 4840 | 10,229 | 11 | ||
| 24 January 2020 | 259 | 1,469,947 | 8108 | 21,718 | 3162 | 4511 | 9059 | 41 | ||
| 25 January 2020 | 688 | 2,330,851 | 10029 | 24,100 | 3253 | 5922 | 12798 | 56 | ||
| 26 January 2020 | 769 | 2,150,021 | 10552 | 20,635 | 3117 | 5779 | 12677 | 80 | ||
| 27 January 2020 | 1771 | 1,816,430 | 9406 | 15,323 | 2152 | 4572 | 11,547 | 106 | ||
| 28 January 2020 | 1459 | 2,227,942 | 9091 | 15,115 | 2296 | 4087 | 11,185 | 132 | ||
| 29 January 2020 | 1737 | 1,503,255 | 9350 | 13,783 | 2088 | 3940 | 11,351 | 170 | ||
| 30 January 2020 | 1982 | 1,372,206 | 9287 | 12,574 | 1943 | 3541 | 10,786 | 213 | ||
| 31 January 2020 | 2102 | 1,390,560 | 8855 | 12,974 | 1876 | 3702 | 10,584 | 259 | ||
| 1 February 2020 | 2590 | 1,334,127 | 8108 | 11,425 | 1620 | 2952 | 9741 | 304 | ||
| 2 February 2020 | 2829 | 1,374,154 | 7682 | 10,981 | 1491 | 3162 | 9750 | 361 | ||
| 3 February 2020 | 3235 | 1,277,132 | 7258 | 10,683 | 1365 | 2949 | 8517 | 425 | ||
| 4 February 2020 | 3887 | 1,244,048 | 6602 | 9504 | 1293 | 2626 | 7258 | 490 | ||
| 5 February 2020 | 3694 | 1,209,808 | 6213 | 8763 | 1349 | 2380 | 7434 | 563 | ||
| 6 February 2020 | 3143 | 1,943,197 | 5736 | 8305 | 1295 | 2179 | 8043 | 636 | ||
| 7 February 2020 | 3399 | 1,643,941 | 5789 | 9236 | 1292 | 2488 | 7261 | 722 | ||
| 8 February 2020 | 2656 | 1,185,978 | 5126 | 7287 | 1183 | 2131 | 6718 | 811 | ||
| 9 February 2020 | 3062 | 1,142,892 | 5220 | 8719 | 1187 | 2004 | 8173 | 908 | ||
| 10 February 2020 | 2478 | 1,158,302 | 5450 | 8585 | 1212 | 1946 | 8948 | 1016 | ||
| 11 February 2020 | 2015 | 1,061,433 | 4814 | 7421 | 1239 | 1901 | 8641 | 1113 | ||
| 12 February 2020 | 15,152 | 1,050,392 | 4590 | 5971 | 1163 | 1922 | 7908 | 1367 | ||
| 13 February 2020 | 5090 | 1,277,024 | 4745 | 6436 | 1125 | 2049 | 8076 | 1380 | ||
| 14 February 2020 | 2641 | 1,069,203 | 4140 | 5339 | 1126 | 1830 | 7197 | 1523 | ||
| 15 February 2020 | 2009 | 948,165 | 3295 | 4537 | 1018 | 1456 | 6452 | 1596 | ||
| 16 February 2020 | 2048 | 904,431 | 2994 | 3953 | 942 | 1205 | 5461 | 1770 | ||
| 17 February 2020 | 1886 | 920,373 | 3454 | 4025 | 1046 | 1406 | 6542 | 1868 | ||
| 18 February 2020 | 1749 | 840,490 | 3274 | 3652 | 1056 | 1278 | 6889 | 2004 | ||
| 19 February 2020 | 394 | 784,784 | 3327 | 3530 | 1038 | 1315 | 6848 | 2118 | ||
| 20 February 2020 | 889 | 800,960 | 3035 | 3071 | 1012 | 1345 | 6552 | 2236 | ||
| 21 February 2020 | 397 | 776,563 | 3003 | 3244 | 935 | 1269 | 6467 | 2345 | ||
| 22 February 2020 | 648 | 636,594 | 2663 | 3003 | 949 | 1179 | 5606 | 2442 | ||
| 23 February 2020 | 409 | 622,095 | 2777 | 2771 | 978 | 1172 | 5218 | 2592 | ||
| 24 February 2020 | 508 | 634,391 | 3234 | 2695 | 1025 | 1286 | 5940 | 2663 | ||
| 25 February 2020 | 406 | 550,484 | 3066 | 2550 | 964 | 1260 | 5462 | 2715 | ||
| 26 February 2020 | 433 | 482,726 | 2850 | 2468 | 896 | 1202 | 5451 | 2744 | ||
| 27 February 2020 | 327 | 478,822 | 2835 | 2403 | 819 | 1165 | 5354 | 2788 | ||
| 28 February 2020 | 427 | 486,394 | 2660 | 2285 | 845 | 1195 | 5425 | 2835 | ||
| 29 February 2020 | 573 | 496,289 | 2420 | 2213 | 750 | 1133 | 4655 | 2870 | ||
| 1 March 2020 | 202 | 482,280 | 2244 | 2070 | 686 | 1151 | 4458 | 2912 | ||
| 2 March 2020 | 125 | 441,914 | 2468 | 2123 | 785 | 1176 | 5326 | 2943 | ||
| 3 March 2020 | 119 | 393,118 | 2223 | 1955 | 755 | 1143 | 4741 | 2981 | ||
| 4 March 2020 | 139 | 441,921 | 2264 | 1970 | 765 | 1163 | 4967 | 3012 | ||
| 5 March 2020 | 143 | 414,142 | 2122 | 1789 | 680 | 1140 | 5157 | 3042 | ||
| 6 March 2020 | 99 | 376,106 | 2111 | 1658 | 694 | 1112 | 5186 | 3070 | ||
| 7 March 2020 | 44 | 369,780 | 1877 | 1539 | 723 | 1072 | 4196 | 3097 | ||
| 8 March 2020 | 40 | 368,916 | 1759 | 1480 | 646 | 1052 | 3993 | 3119 | ||
| 9 March 2020 | 19 | 359,426 | 2017 | 1414 | 687 | 1133 | 5547 | 3136 | ||
| 10 March 2020 | 24 | 335,711 | 1792 | 1288 | 635 | 1085 | 4164 | 3158 | ||
| 11 March 2020 | 15 | 337,491 | 1911 | 1413 | 633 | 1049 | 4331 | 3169 | ||
| 12 March 2020 | 8 | 353,167 | 1891 | 1575 | 686 | 1088 | 3967 | 3176 | ||
| 13 March 2020 | 11 | 353,857 | 1906 | 1756 | 641 | 1119 | 3269 | 3189 | ||
| 14 March 2020 | 20 | 332,215 | 1745 | 1358 | 601 | 1042 | 2788 | 3199 | ||
| 15 March 2020 | 16 | 364,033 | 1721 | 1486 | 657 | 1037 | 2732 | 3213 | ||
| 16 March 2020 | 21 | 324,566 | 1985 | 1555 | 759 | 1087 | 3845 | 3226 | ||
| 17 March 2020 | 13 | 300,185 | 1885 | 1546 | 673 | 1068 | 3022 | 3237 | ||
| 18 March 2020 | 34 | 295,536 | 1920 | 1491 | 696 | 1052 | 3198 | 3245 | ||
| 19 March 2020 | 39 | 282,990 | 1724 | 1355 | 663 | 1057 | 2742 | 3248 | ||
| 20 March 2020 | 41 | 300,183 | 1779 | 1227 | 621 | 1036 | 2705 | 3255 | ||
| 21 March 2020 | 46 | 299,291 | 1734 | 1308 | 641 | 1006 | 2577 | 3261 | ||
| 22 March 2020 | 39 | 285,191 | 1736 | 1102 | 672 | 1027 | 2829 | 3270 | ||
| 23 March 2020 | 78 | 280,841 | 1855 | 1391 | 704 | 1102 | 3018 | 3277 | ||
| 24 March 2020 | 47 | 278,221 | 1830 | 1457 | 704 | 1052 | 3215 | 3281 | ||
| 25 March 2020 | 67 | 259,091 | 1810 | 1308 | 656 | 1045 | 3446 | 3287 | ||
| 26 March 2020 | 55 | 261,957 | 1839 | 1094 | 655 | 1091 | 3114 | 3292 | ||
| 27 March 2020 | 54 | 279,082 | 1645 | 1129 | 592 | 1061 | 2780 | 3295 | ||
| 28 March 2020 | 45 | 264,664 | 1525 | 1065 | 476 | 998 | 2480 | 3300 | ||
| 29 March 2020 | 31 | 265,761 | 1562 | 1096 | 490 | 961 | 2364 | 3304 | ||
| 30 March 2020 | 48 | 264,442 | 1725 | 1094 | 601 | 1031 | 3021 | 3305 | ||
| 31 March 2020 | 36 | 239,272 | 1772 | 1071 | 535 | 1007 | 2676 | 3312 | ||
| 1 April 2020 | 35 | 243,582 | 1569 | 1080 | 565 | 1013 | 2676 | 3318 | ||
Note: CDC = Centers of Disease Control.
References
- Lu, L.; Zou, Y.Q.; Peng, Y.S.; Li, K.L.; Jiang, T.J. Comparison of Baidu index and Weibo index in surveillance of influenza virus in China. Appl. Res. Comput. 2016, 33, 392–395. [Google Scholar]
- Chen, Y.; Zhang, Y.Z.; Xu, Z.W.; Wang, X.Z.; Lu, J.H.; Hu, W.B. Avian Influenza A (H7N9) and related Internet search query data in China. Sci. Rep. 2019, 9, 10434. [Google Scholar] [CrossRef] [PubMed] [Green Version]
- Fung, I.C.H.; Fu, K.W.; Ying, Y.C.; Schaible, B.; Hao, Y.; Chan, C.H.; Tse, Z.T.H. Chinese social media reaction to the MERS-CoV and avian influenza A(H7N9) outbreaks. Infect. Dis. Poverty 2013, 2, 31. [Google Scholar] [CrossRef] [PubMed] [Green Version]
- Gu, H.G.; Zhang, W.J.; Xu, H.; Li, P.Y.; Wu, L.L.; Guo, P.; Hao, Y.T.; Lu, J.H.; Zhang, D.M. Predicating risk area of human infection with avian influenza A (H7N9) virus by using early warning model in China. Chin. J. Epidemiol. 2015, 36, 470–475. [Google Scholar]
- COVID-19 Coronavirus Data. Available online: https://data.europa.eu/euodp/en/data/dataset/covid-19-coronavirus-data (accessed on 14 December 2020).
- Zhao, X.M.; Li, X.H.; Nie, C.H. Retrospecting the spread of new coronary pneumonia based on big data and China’s control of the epidemic. Bull. Chin. Acad. Sci. 2020, 35, 248–255. [Google Scholar]
- McCall, B. COVID-19 and artificial intelligence: Protecting health-care workers and curbing the spread. Lancet Digit. Health 2020, 2, 166–167. [Google Scholar] [CrossRef]
- Baidu Index. Available online: http://index.baidu.com/ (accessed on 1 April 2020).
- Zhang, Y.D.; Zhang, X.; Zhu, W.G. ANC: Attention network for COVID-19 explainable diagnosis based on convolutional block attention module. Cmes-Comp. Model. Eng. 2021, 127, 1037–1058. [Google Scholar]
- Zhang, X.; Lu, S.Y.; Wang, S.H.; Yu, X.; Wang, S.J.; Yao, L.; Pan, Y.; Zhang, Y.D. Diagnosis of COVID-19 pneumonia via a novel deep learning architecture. J. Comput. Sci. Tech. 2021, 1. [Google Scholar] [CrossRef]
- Sylvester, E.V.A.; Bentzen, P.; Bradbury, I.R.; Clement, M.; Pearce, J.; Horne, J.; Beiko, R.G. Applications of random forest feature selection for fine-scale genetic population assignment. Evol. Appl. 2018, 11, 153–165. [Google Scholar] [CrossRef] [PubMed]
- Li, X.K.; Chen, W.; Zhang, Q.R.; Wu, L.F. Building auto-encoder intrusion detection system based on random forest feature selection. Comput. Secur. 2020, 95, 101851. [Google Scholar] [CrossRef]
- Al Daoud, E. Comparison between XGBoost, LightGBM and CatBoost using a home credit dataset. Int. J. Comput. Inf. Eng. 2019, 13, 6–10. [Google Scholar]
- Frazier, P.I. A tutorial on Bayesian optimization. arXiv 2018, arXiv:1807.02811. [Google Scholar]
- Liashchynskyi, P.; Liashchynskyi, P. Grid search, random search, genetic algorithm: A big comparison for NAS. arXiv 2019, arXiv:1912.06059. [Google Scholar]
- Wang, Y.; Wang, T. Application of improved LightGBM model in blood glucose prediction. Appl. Sci. 2020, 10, 3227. [Google Scholar] [CrossRef]
- Liang, X. Image-based post-disaster inspection of reinforced concrete bridge systems using deep learning with Bayesian optimization. Comput.-Aided Civ. Inf. 2019, 34, 415–430. [Google Scholar] [CrossRef]
- Jones, D.R.; Schonlau, M.; Welch, W.J. Efficient global optimization of expensive black-box functions. J. Global Optim. 1998, 13, 455–492. [Google Scholar] [CrossRef]
- Sameen, M.I.; Pradhan, B.; Lee, S. Application of convolutional neural networks featuring Bayesian optimization for landslide susceptibility assessment. Catena 2020, 186, 104249. [Google Scholar] [CrossRef]
- Liang, W.Z.; Luo, S.Z.; Zhao, G.Y.; Wu, H. Predicting hard rock pillar stability using GBDT, XGBoost, and LightGBM algorithms. Mathematics 2020, 8, 765. [Google Scholar] [CrossRef]
Figure 1.
The number released by the CDC and Baidu index data based on keyword searches. (a) represents the number of newly diagnosis released by the CDC. (b–g) represent the Baidu index data based on keywords “New coronavirus”, “Fever”, “Dry cough”, “Fatigue”, “Dyspnea”, “Cough” respectively. (h) represents the death toll released by the CDC. CDC = Centers of Disease Control.

Figure 2.
Original diagnosis numbers distribution diagram.

Figure 3.
Original diagnosis numbers Q-Q diagram.

Figure 4.
The impact of all attributes on diagnosis numbers. (a,d) show the trend of newly diagnosis number by month and day, respectively. (b) represents the relationship between the diagnosis numbers and the death toll. (e) represents the relationship between the diagnosis numbers and new diagnosis released by the CDC. (c,f,g,h) and (i) respectively represent the relationship between the diagnosis numbers and Baidu Index data based on keyword search, and they correspond to keywords “Fatigue” “Fever” “Dry cough” “Dyspnea” and “Cough” respectively.

Figure 5.
Heat map between variables.

Figure 6.
RF-BOA-LightGBM structure. BOA = Bayesian optimization algorithm.

Figure 7.
Distribution of diagnosis numbers after data conversion.

Figure 8.
Diagnosis numbers Q-Q diagram after data conversion.

Figure 9.
Feature selection results.

Figure 10.
Comparison of predicted and true values of the four models. BOA, Bayesian optimization algorithm; GBM, gradient boosting machine.
Figure 10.
Comparison of predicted and true values of the four models. BOA, Bayesian optimization algorithm; GBM, gradient boosting machine.

Table 1.
Partial data from CDC and Baidu Index search.
| Source | CDC- Diagnosis | Baidu- New Coronavirus | Baidu- Fever | Baidu- Dry Cough | Baidu- Fatigue | Baidu- Dyspnea | Baidu- Cough | CDC- Death Toll | ||
|---|---|---|---|---|---|---|---|---|---|---|
| Data | ||||||||||
| Date | ||||||||||
| 1 January 2020 | 0 | 0 | 4001 | 1100 | 256 | 481 | 5885 | 0 | ||
| 2 January 2020 | 0 | 0 | 4323 | 1206 | 278 | 602 | 6448 | 0 | ||
| 3 January 2020 | 1 | 0 | 4212 | 1173 | 262 | 654 | 6392 | 0 | ||
| 4 January 2020 | 0 | 0 | 4309 | 1109 | 270 | 621 | 6570 | 0 | ||
| 5 January 2020 | 5 | 0 | 4327 | 1118 | 271 | 591 | 6564 | 0 | ||
| 6 January 2020 | 0 | 0 | 4324 | 1226 | 310 | 693 | 6404 | 0 | ||
| 7 January 2020 | 0 | 0 | 3920 | 1175 | 288 | 633 | 5875 | 0 | ||
| 8 January 2020 | 0 | 0 | 3803 | 1124 | 272 | 622 | 5354 | 0 | ||
| 9 January 2020 | 0 | 8812 | 3693 | 1131 | 270 | 579 | 5182 | 0 | ||
| 10 January 2020 | 0 | 2032 | 3700 | 1095 | 263 | 535 | 5022 | 0 | ||
| 11 January 2020 | 0 | 2879 | 3478 | 1083 | 237 | 498 | 5033 | 1 | ||
| 12 January 2020 | 0 | 1445 | 3364 | 1067 | 252 | 474 | 5011 | 1 | ||
| 13 January 2020 | 0 | 1515 | 3573 | 1118 | 278 | 494 | 4418 | 1 | ||
| 14 January 2020 | 0 | 4846 | 3479 | 1133 | 266 | 528 | 4359 | 1 | ||
| 15 January 2020 | 0 | 4191 | 3241 | 1097 | 245 | 512 | 4355 | 2 | ||
Note: CDC = Centers of Disease Control.
Table 2.
Comparison of peak time between Baidu Index data based on different keywords and CDC new diagnostic data.
Table 2.
Comparison of peak time between Baidu Index data based on different keywords and CDC new diagnostic data.
| Category | First Peak Time | Time Difference (Days) |
|---|---|---|
| CDC-Diagnostic | 12 February 2020 | - |
| Baidu-New coronavirus | 25 January 2020 | +18 |
| Baidu-Fever | 26 January 2020 | +17 |
| Baidu-Dry cough | 23 January 2020 | +20 |
| Baidu-Fatigue | 25 January 2020 | +18 |
| Baidu-Dyspnea | 25 January 2020 | +18 |
| Baidu-Cough | 25 January 2020 | +18 |
| Arithmetic mean | - | +18 |
Note: + indicates the number of days in advance, - indicates the number of days later. CDC = Centers of Disease Control.
Table 3.
The LightGBM hyperparameters selected in this article and their functions.
| Parameter | Style | Search Scope | Effect |
|---|---|---|---|
| learn_rate | float | (0.001, 0.3) | improve accuracy |
| max_depth | int | (3, 10) | prevent overfitting |
| num_leaves | int | (3, 1024) | improve accuracy |
| min_data_in_leaf | int | (0, 80) | prevent overfitting |
| feature_fraction | float | (0.2, 0.9) | accelerate |
| bagging_fraction | float | (0.2, 0.9) | accelerate |
| lambda_l1 | float | (0, 10) | prevent overfitting |
Table 4.
Specific parameter values found by three tuning algorithms.
| Parameter | GridSearch | RandomSearch | BOA |
|---|---|---|---|
| learn_rate | 0.632 | 0.828 | 0.355 |
| max_depth | 7 | 8 | 5 |
| num_leaves | 225 | 237 | 249 |
| min_data_in_leaf | 33 | 27 | 30 |
| feature_fraction | 0.7 | 0.7 | 0.8 |
| bagging_fraction | 0.7 | 0.7 | 0.8 |
| lambda_l1 | 2.34 | 3.45 | 1.80 |
Note: BOA = Bayesian optimization algorithm.
Table 5.
Model evaluation index.
| Models | R2 | RMSE | MAE | RAE | RRSE |
|---|---|---|---|---|---|
| LightGBM | 0.820 | 354.945 | 138.939 | 0.535 | 0.424 |
| GridSearch-LightGBM | 0.865 | 311.918 | 145.266 | 0.548 | 0.368 |
| RandomSearch-LightGBM | 0.861 | 316.217 | 137.621 | 0.533 | 0.373 |
| BOA-LightGBM | 0.879 | 295.686 | 124.911 | 0.508 | 0.348 |
Note: GBM, gradient boosting machine; BOA, Bayesian optimization algorithm; R2, coefficient of determination; RMSE, root mean square error; MAE, mean absolute error; RAE, relative absolute error; RRSE, relative square root error.
Publisher’s Note: MDPI stays neutral with regard to jurisdictional claims in published maps and institutional affiliations. |
© 2021 by the authors. Licensee MDPI, Basel, Switzerland. This article is an open access article distributed under the terms and conditions of the Creative Commons Attribution (CC BY) license (https://creativecommons.org/licenses/by/4.0/).
Share and Cite
MDPI and ACS Style
Li, Z.; Hu, D. Forecast of the COVID-19 Epidemic Based on RF-BOA-LightGBM. Healthcare 2021, 9, 1172. https://doi.org/10.3390/healthcare9091172
AMA Style
Li Z, Hu D. Forecast of the COVID-19 Epidemic Based on RF-BOA-LightGBM. Healthcare. 2021; 9(9):1172. https://doi.org/10.3390/healthcare9091172
Chicago/Turabian StyleLi, Zhe, and Dehua Hu. 2021. "Forecast of the COVID-19 Epidemic Based on RF-BOA-LightGBM" Healthcare 9, no. 9: 1172. https://doi.org/10.3390/healthcare9091172
Note that from the first issue of 2016, this journal uses article numbers instead of page numbers. See further details here.