
A Comprehensive Survey of Image-Based Food Recognition and Volume Estimation Methods for Dietary Assessment


Abstract
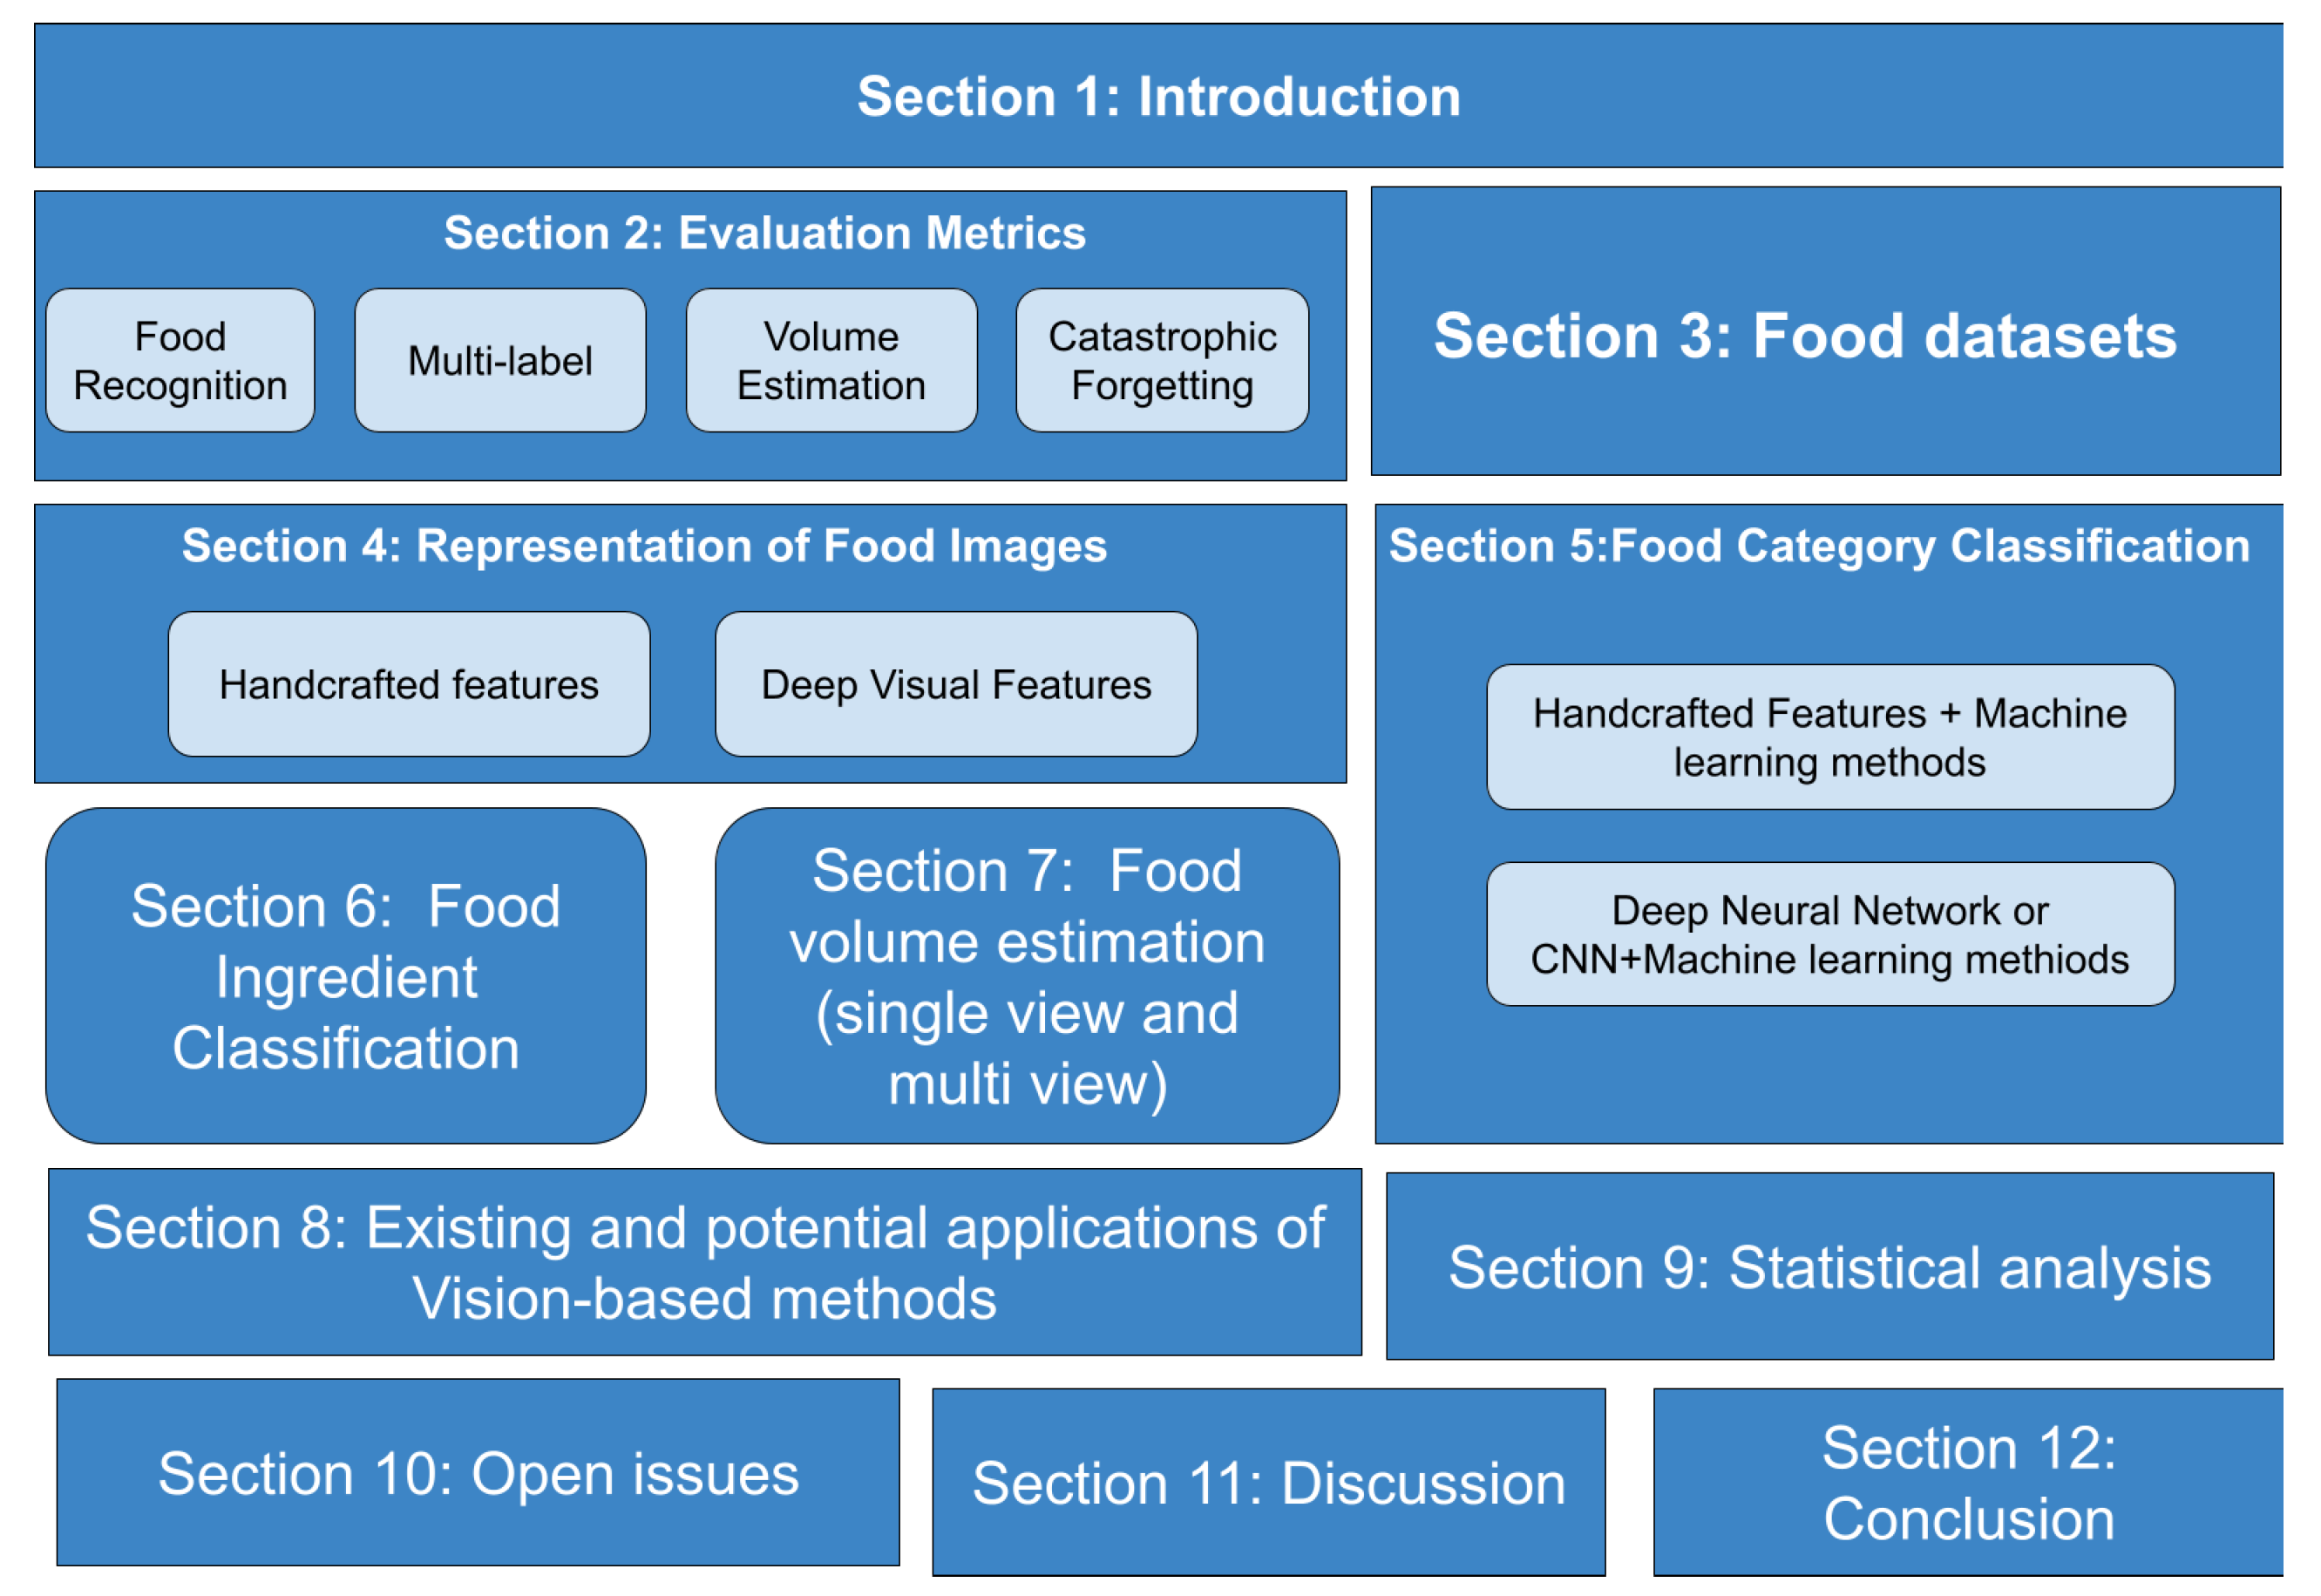
:1. Introduction
- (1)
- The article briefly explores food databases for evaluating vision-based approaches and performance measures to thoroughly investigate food recognition, ingredient detection, and volume estimation methods.
- (2)
- It presents an extensive review of food recognition techniques, including traditional methods with handcrafted features and modern deep-learning-based approaches.
- (3)
- It provides deep insight into multi-label methods for food ingredient classification.
- (4)
- This study surveyed most performing single-view and multi-view methods for food volume estimation.
- (5)
- This study presents existing mobile applications that implement these approaches and other potential applications of vision-based methods in health care.
- (6)
- The article analyzes open issues and suggests possible solutions to overcome the limitations of the existing methodologies.
2. Evaluation Metrics
2.1. Evaluation Metrics for Food Categorization
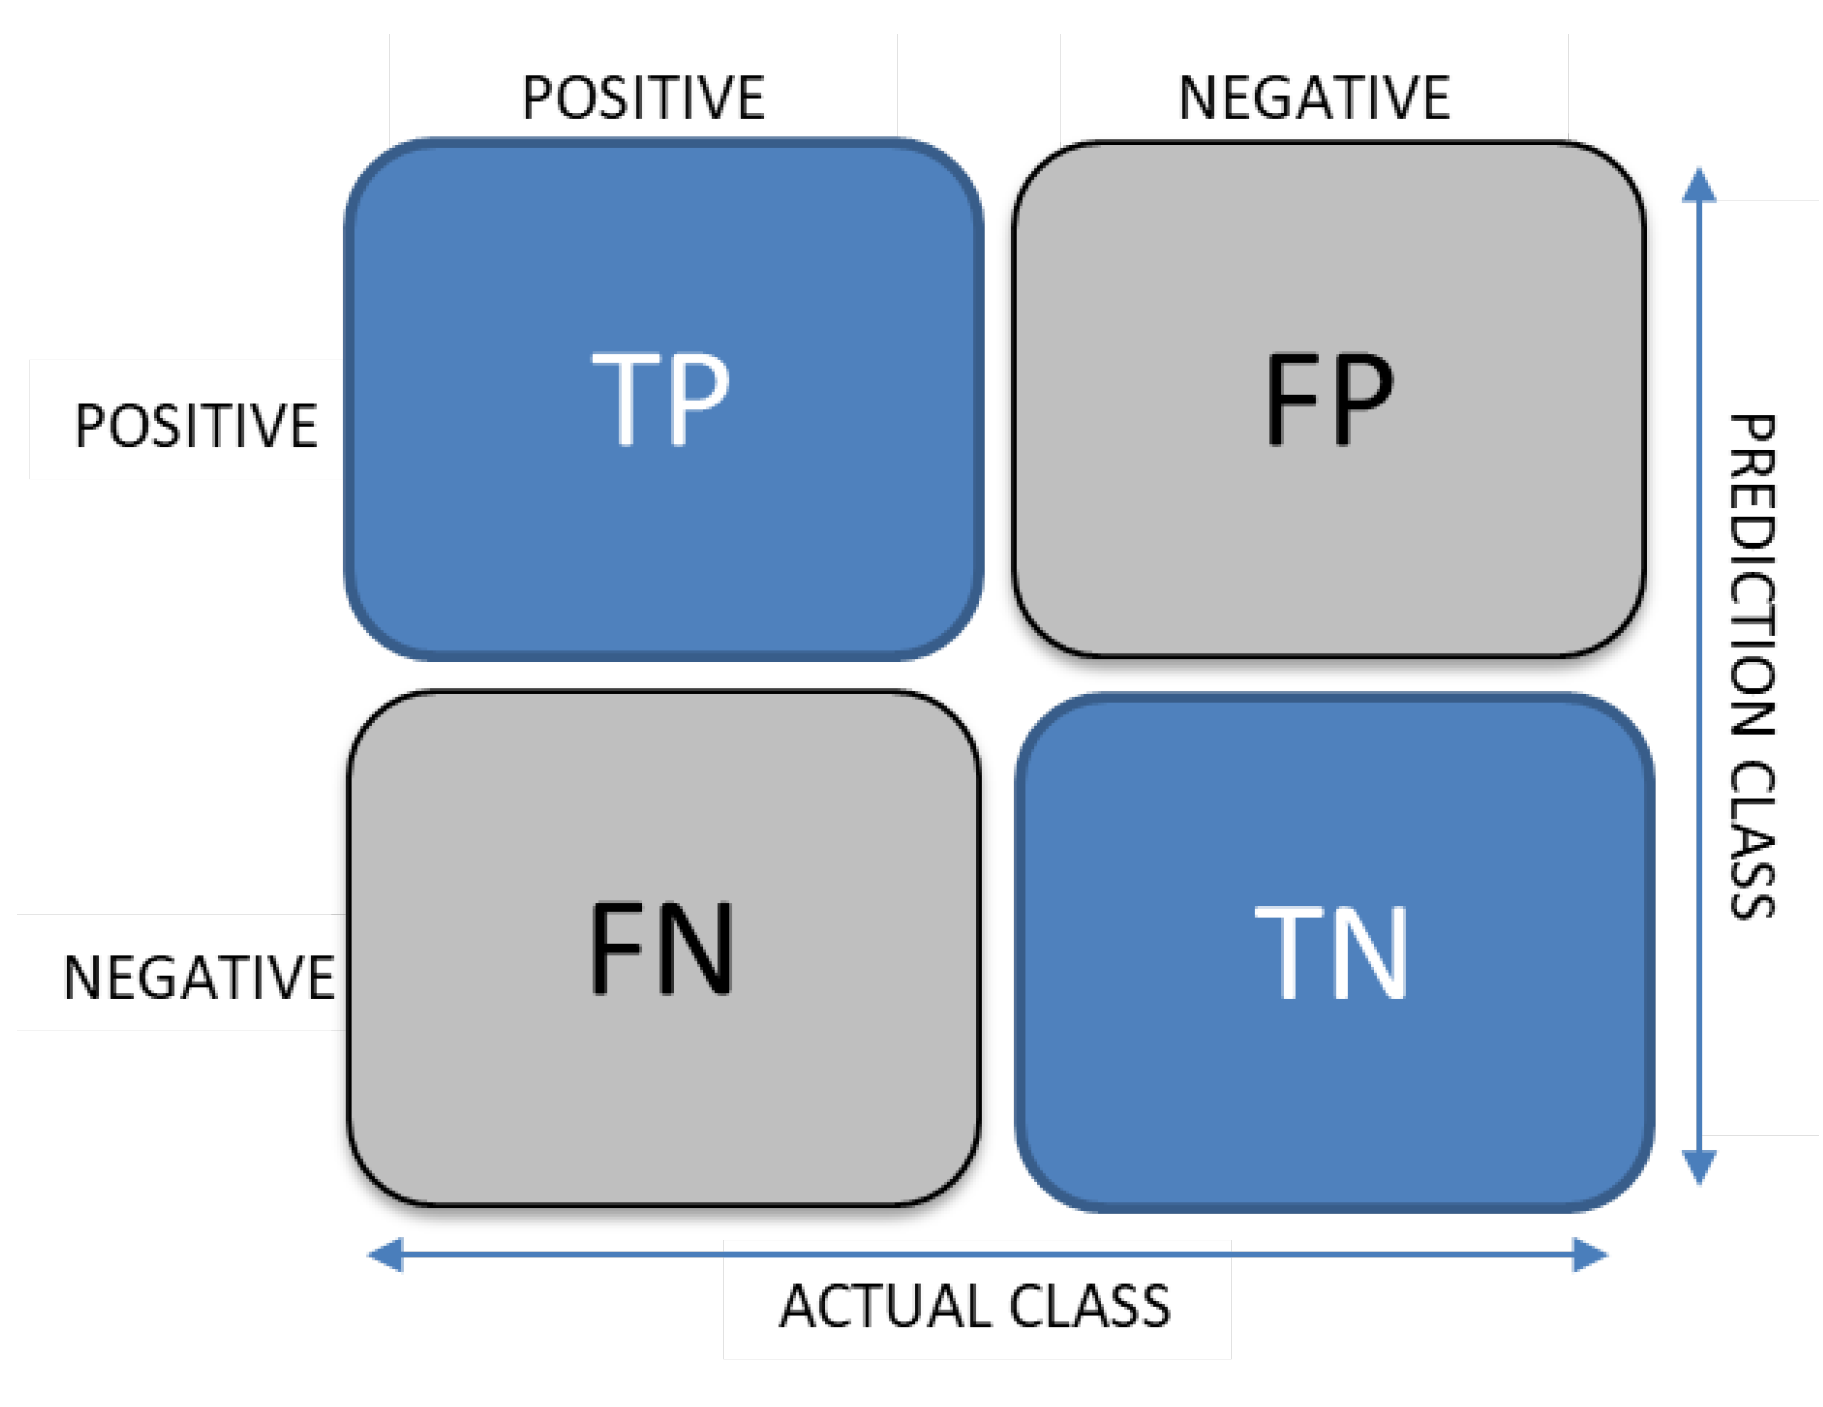
2.1.1. Confusion Matrix
2.1.2. Accuracy
2.1.3. Precision
2.1.4. Recall
2.1.5. F1 Score
2.2. Catastrophic Forgetting during Progressive Learning
2.2.1. Intransigence
2.2.2. Forgetting
2.2.3. Base Session
2.2.4. New Session
2.2.5. All Session
2.3. Evaluation Metrics for Food Ingredient Classification
2.3.1. Precision
2.3.2. Recall
2.3.3. F1 Score
2.4. Evaluation Metrics for Food Volume Estimation
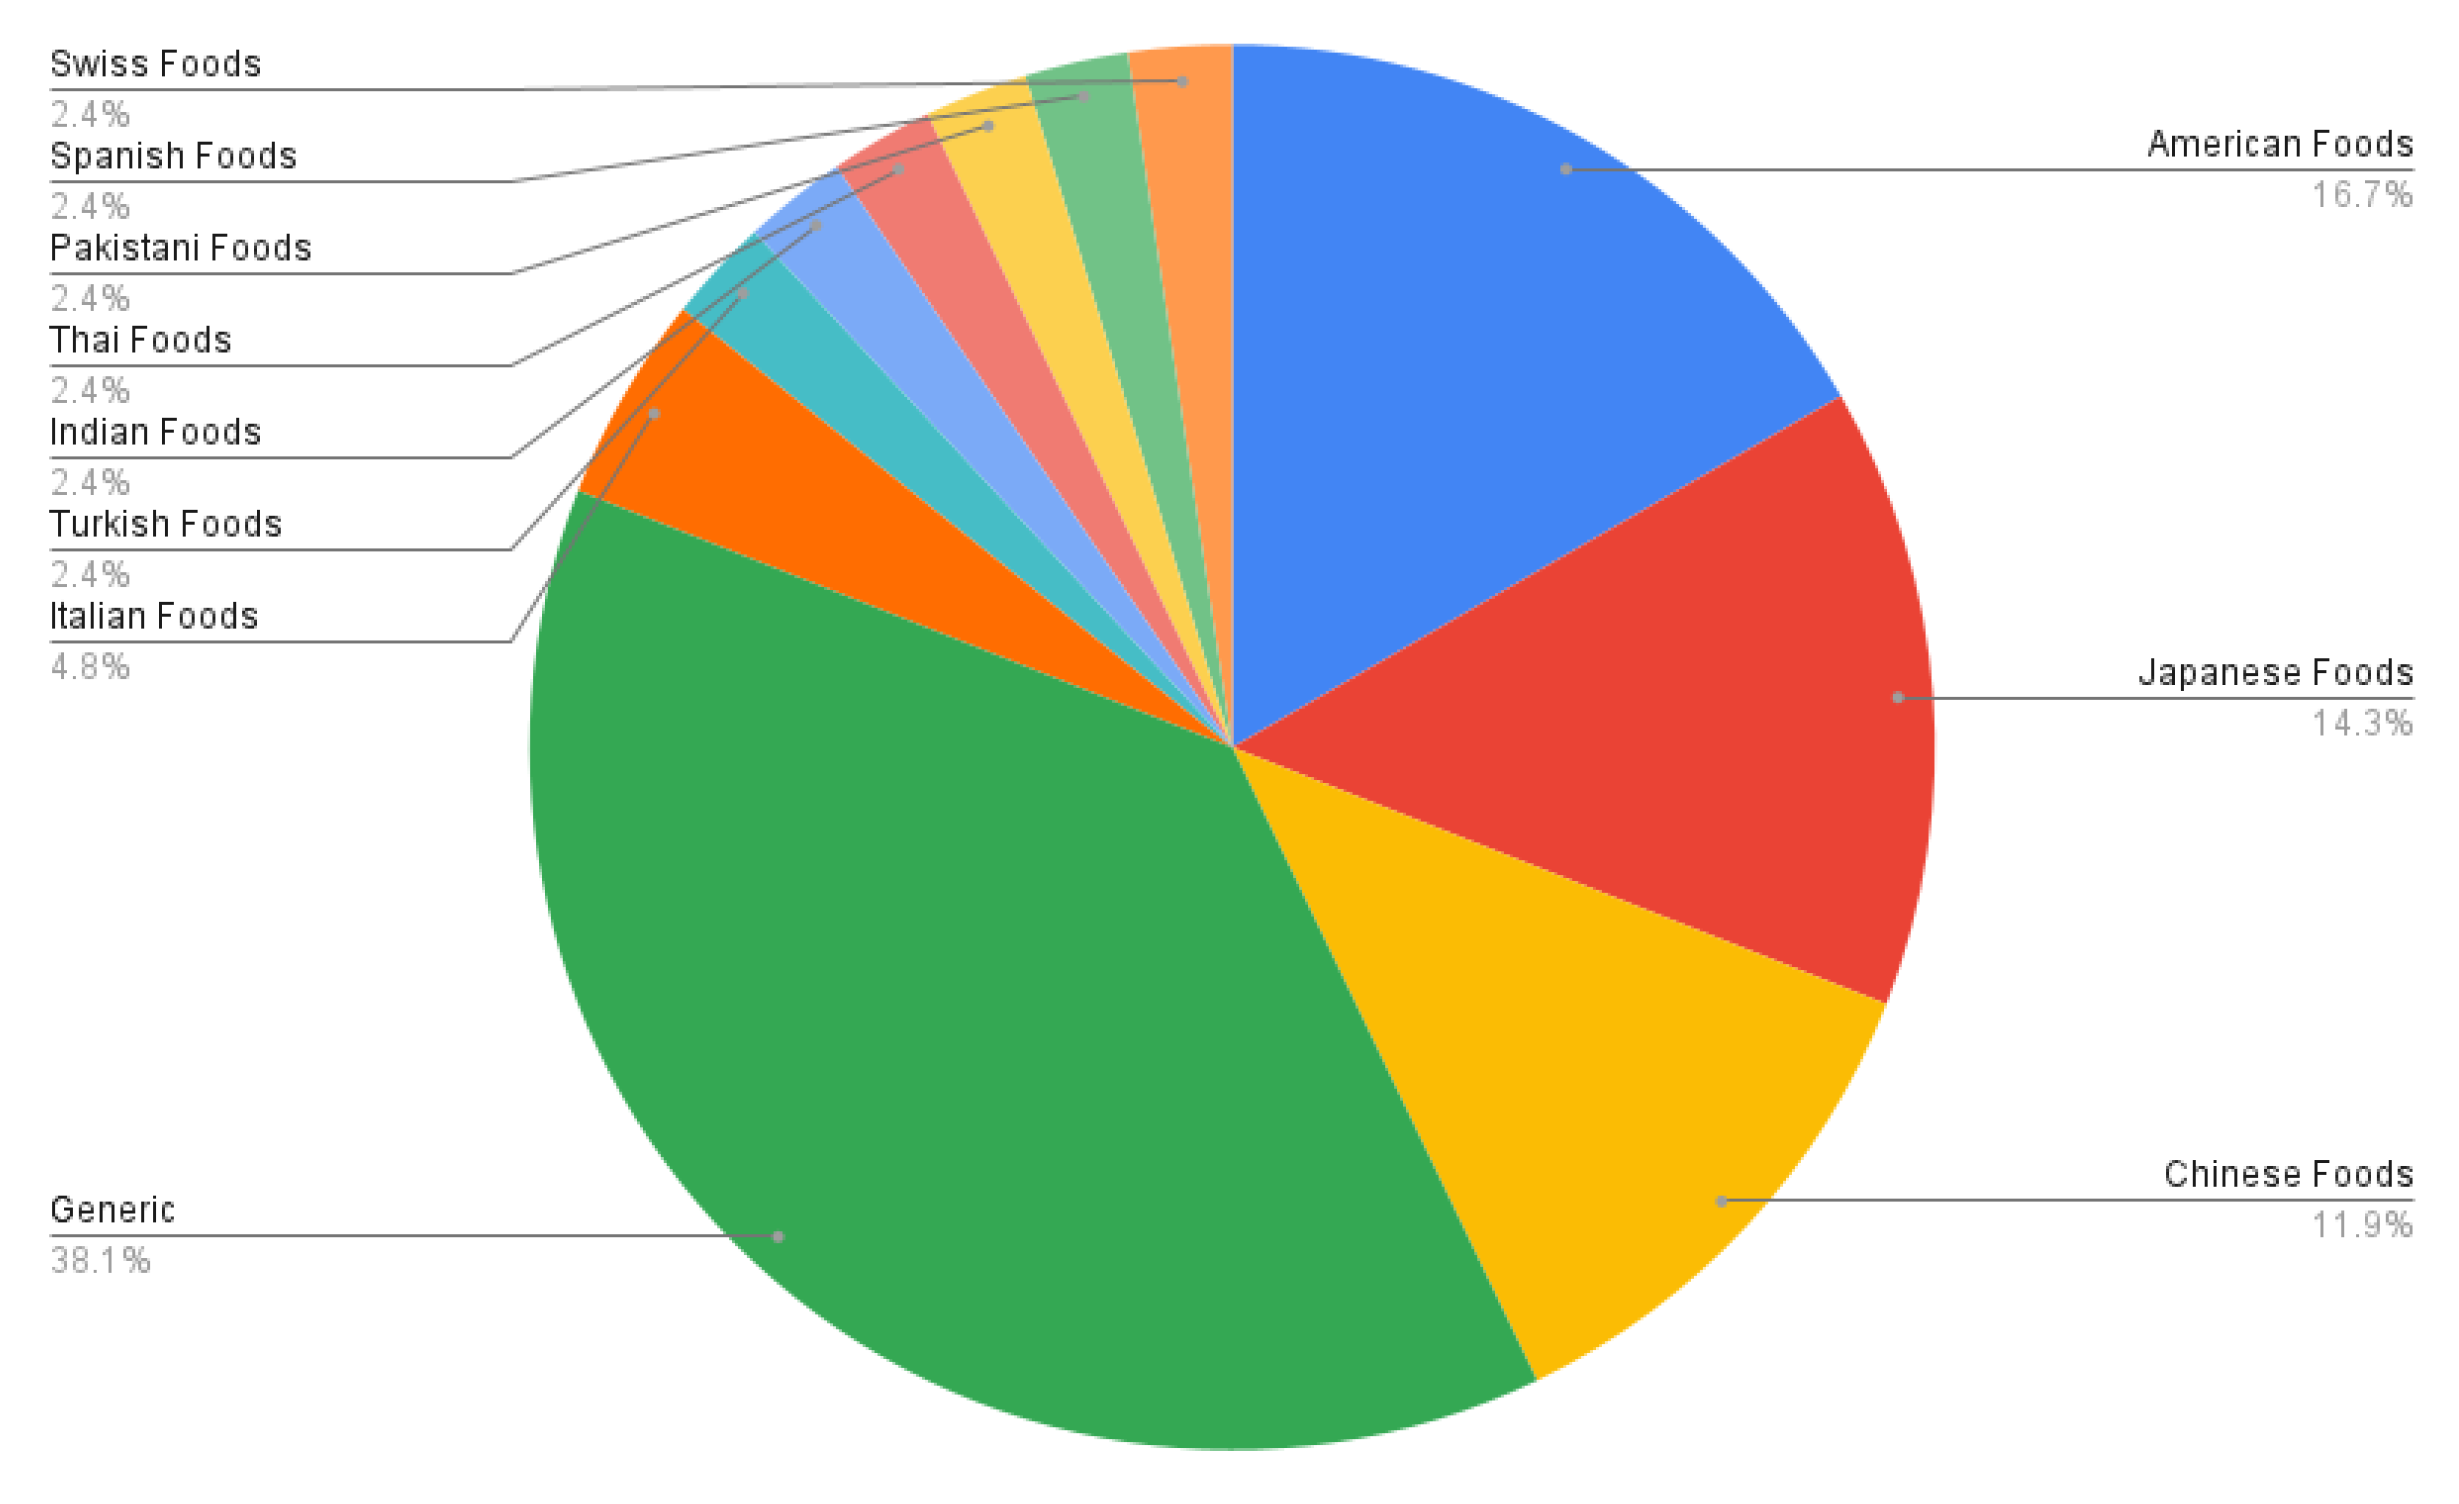
3. Datasets Used for Food Recognition
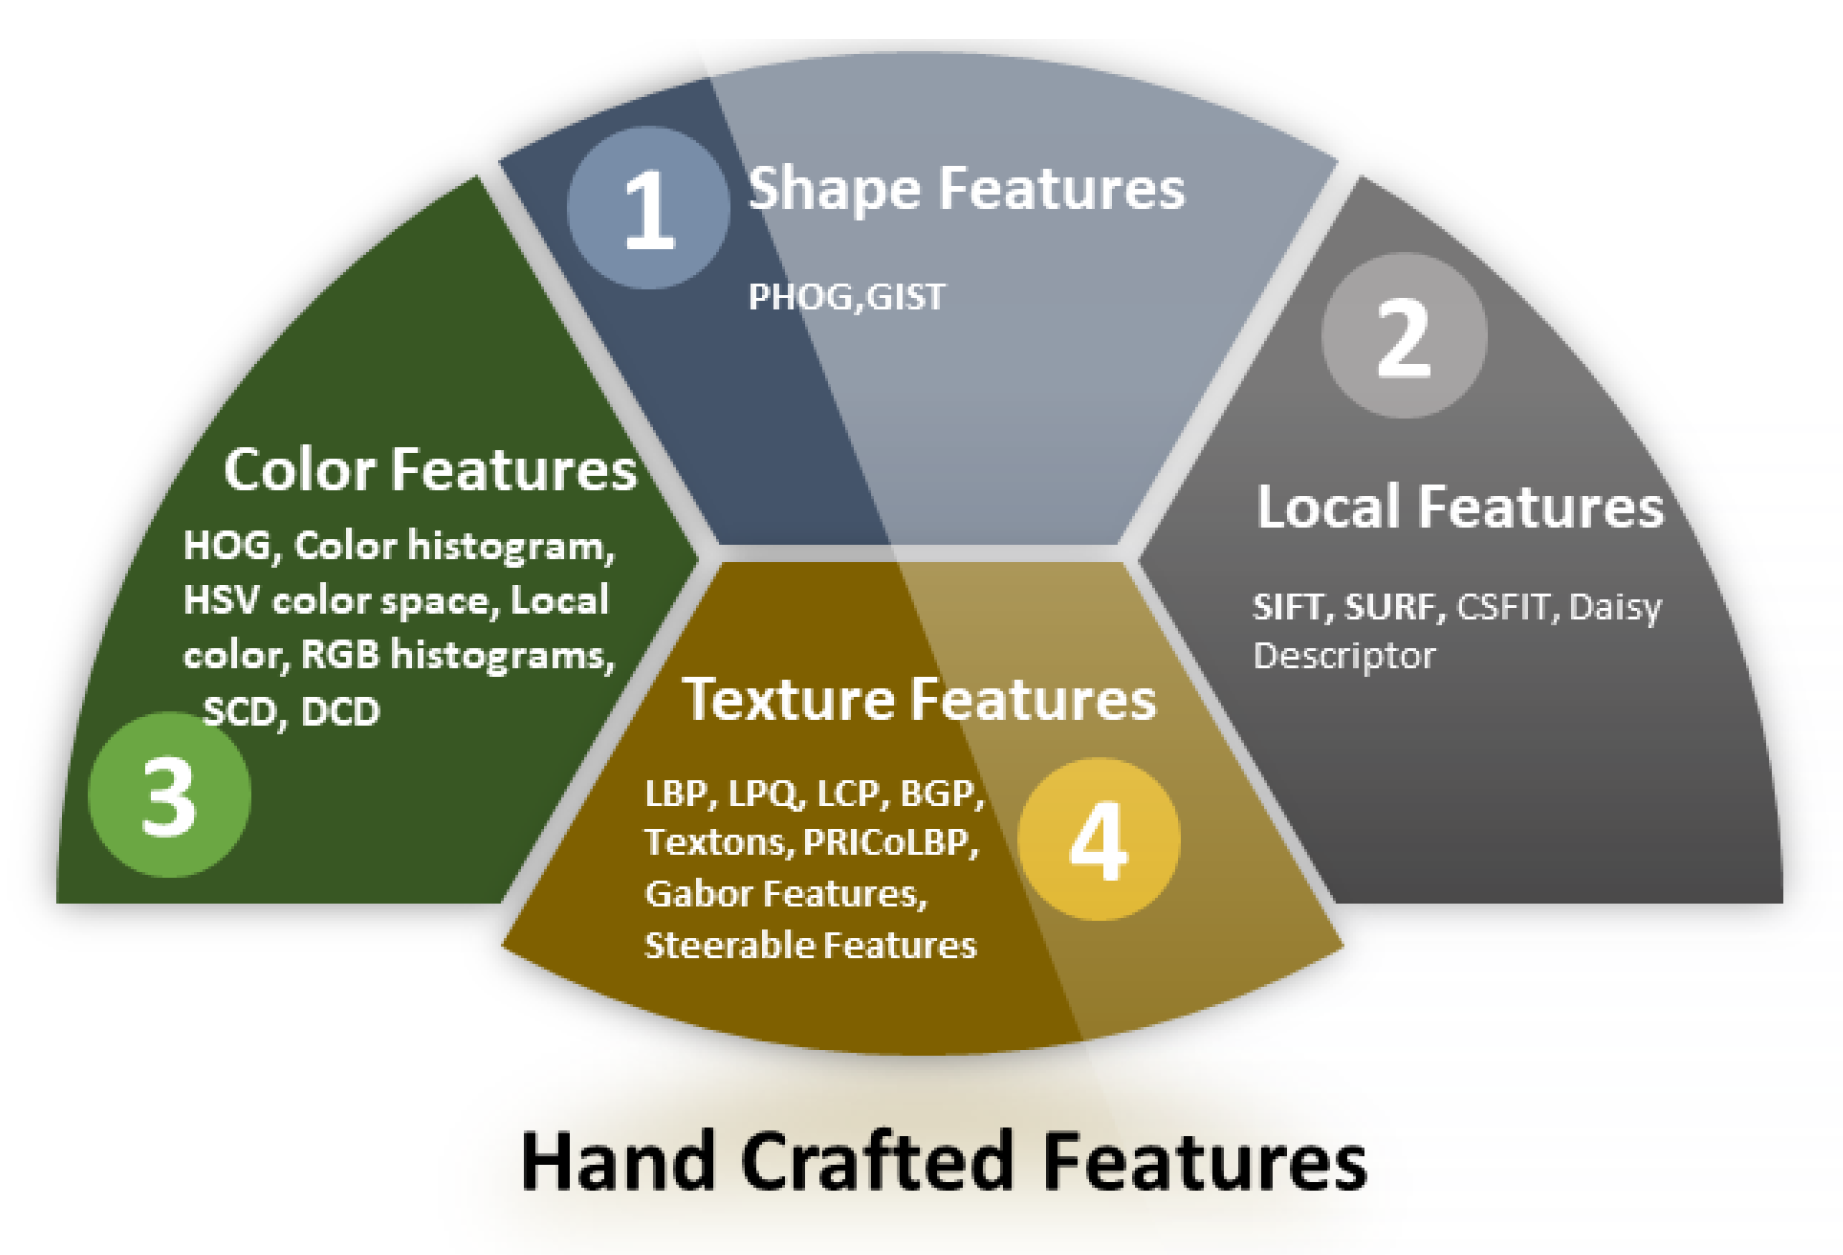
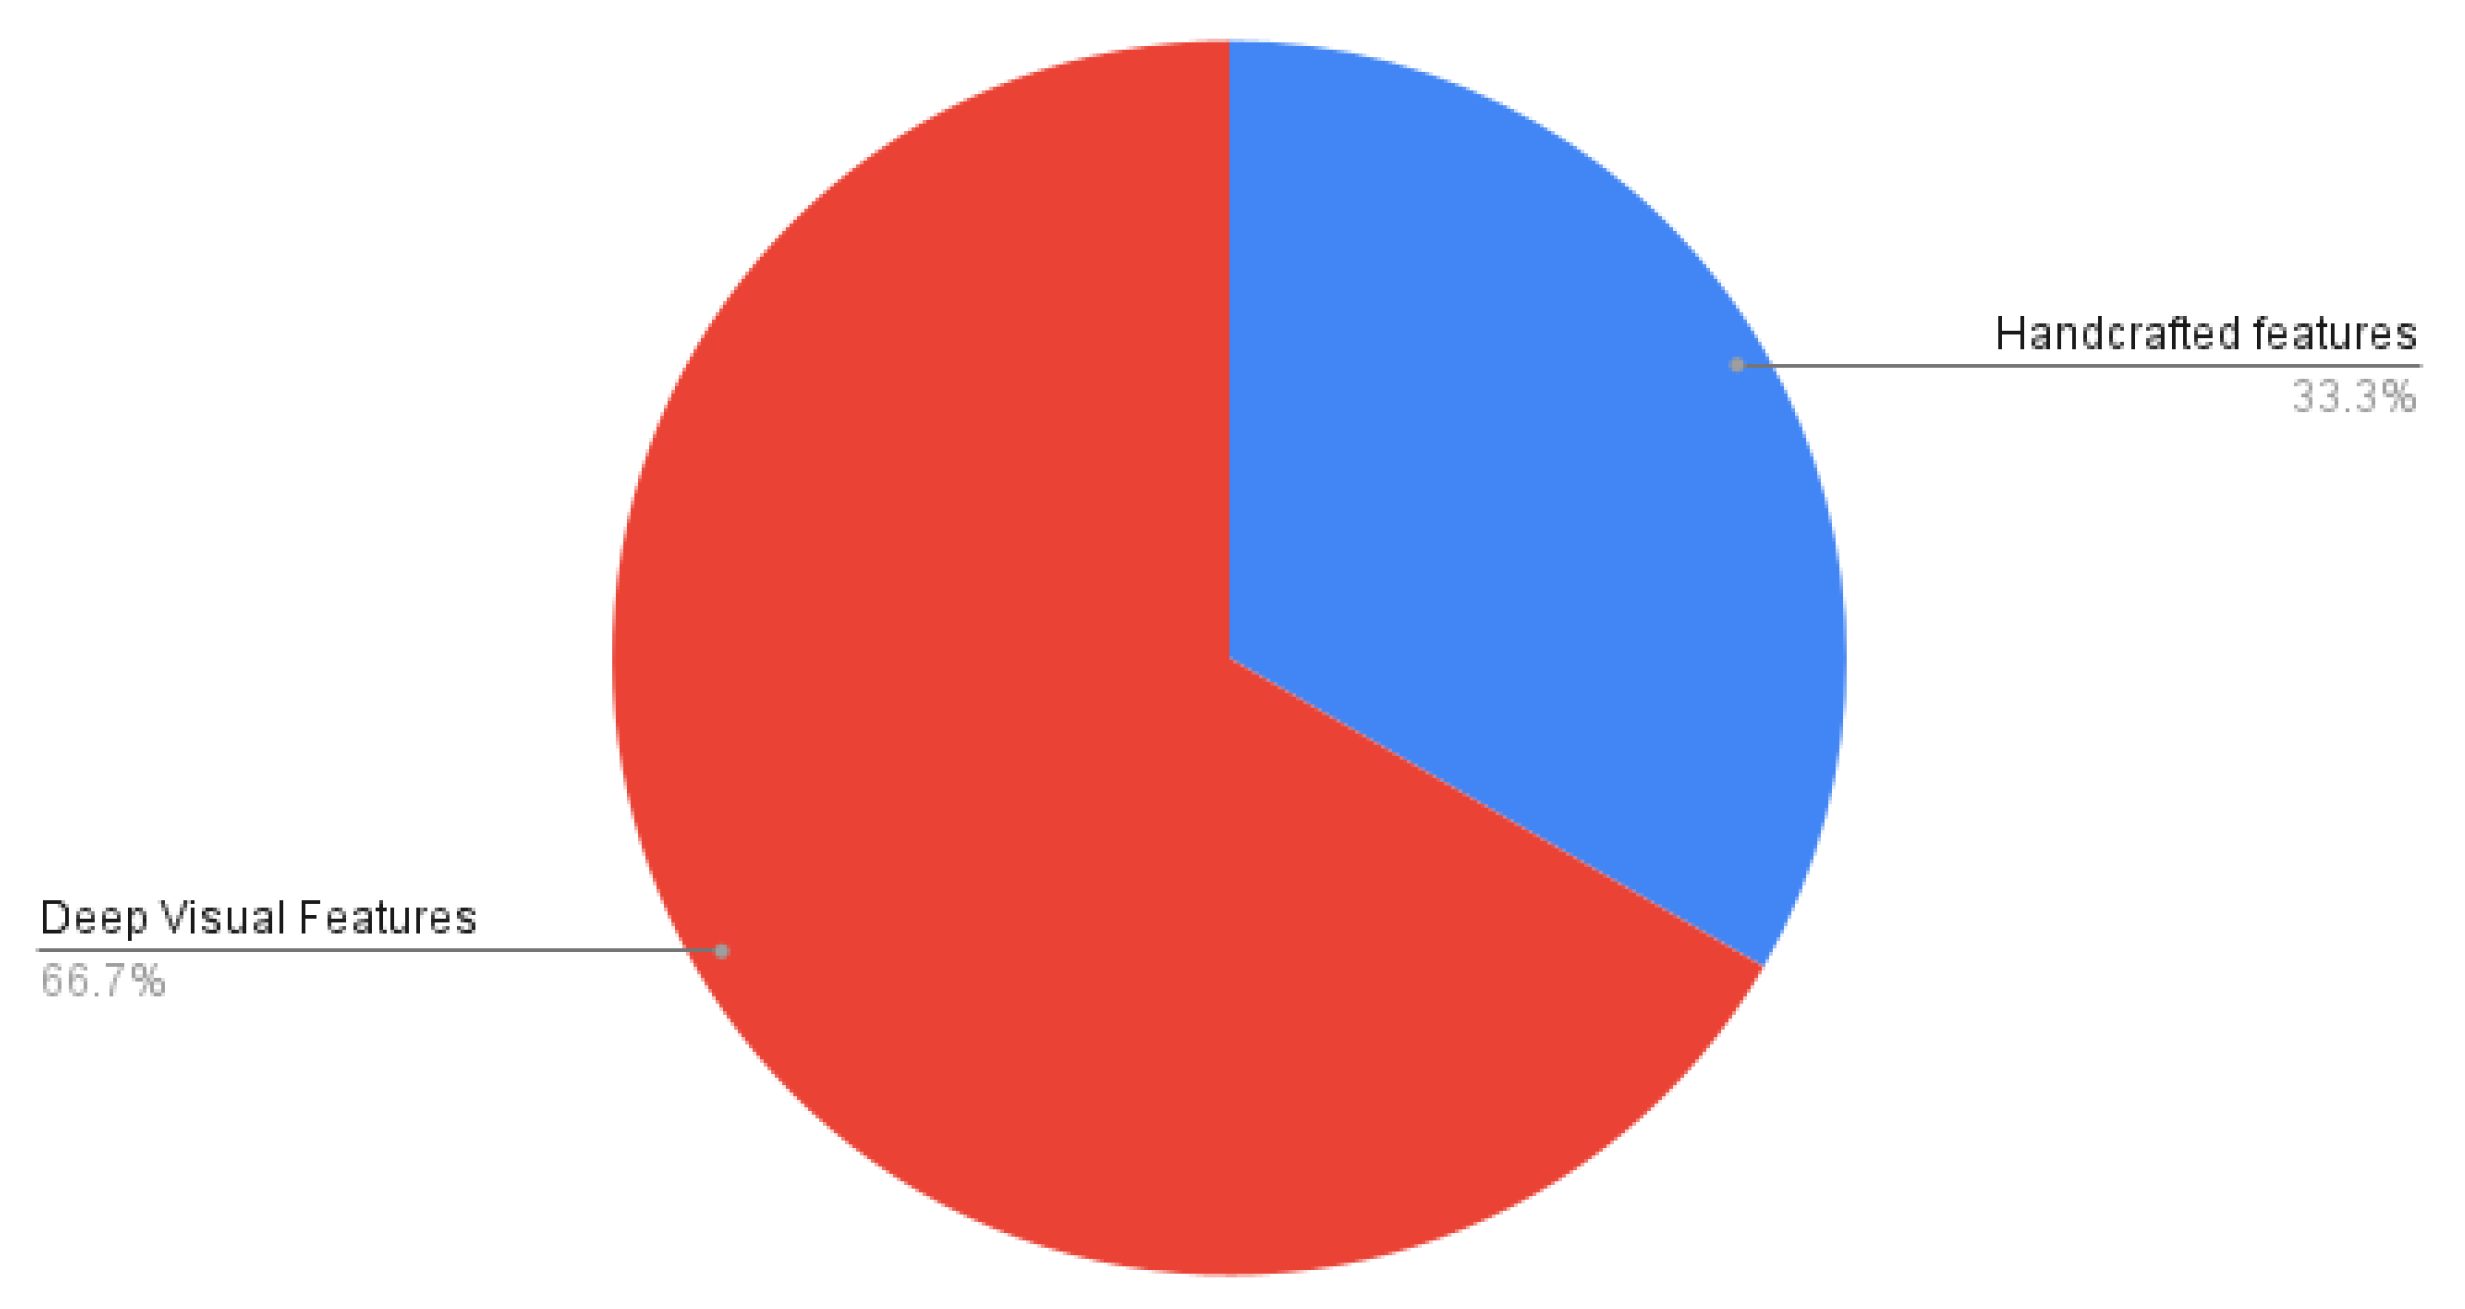
4. Representation of Food Images
4.1. Handcrafted Features
4.2. Deep Visual Features
5. Food Category Classification
5.1. Traditional Machine Learning Methods
5.2. Deep Learning Models
6. Food Ingredient Classification
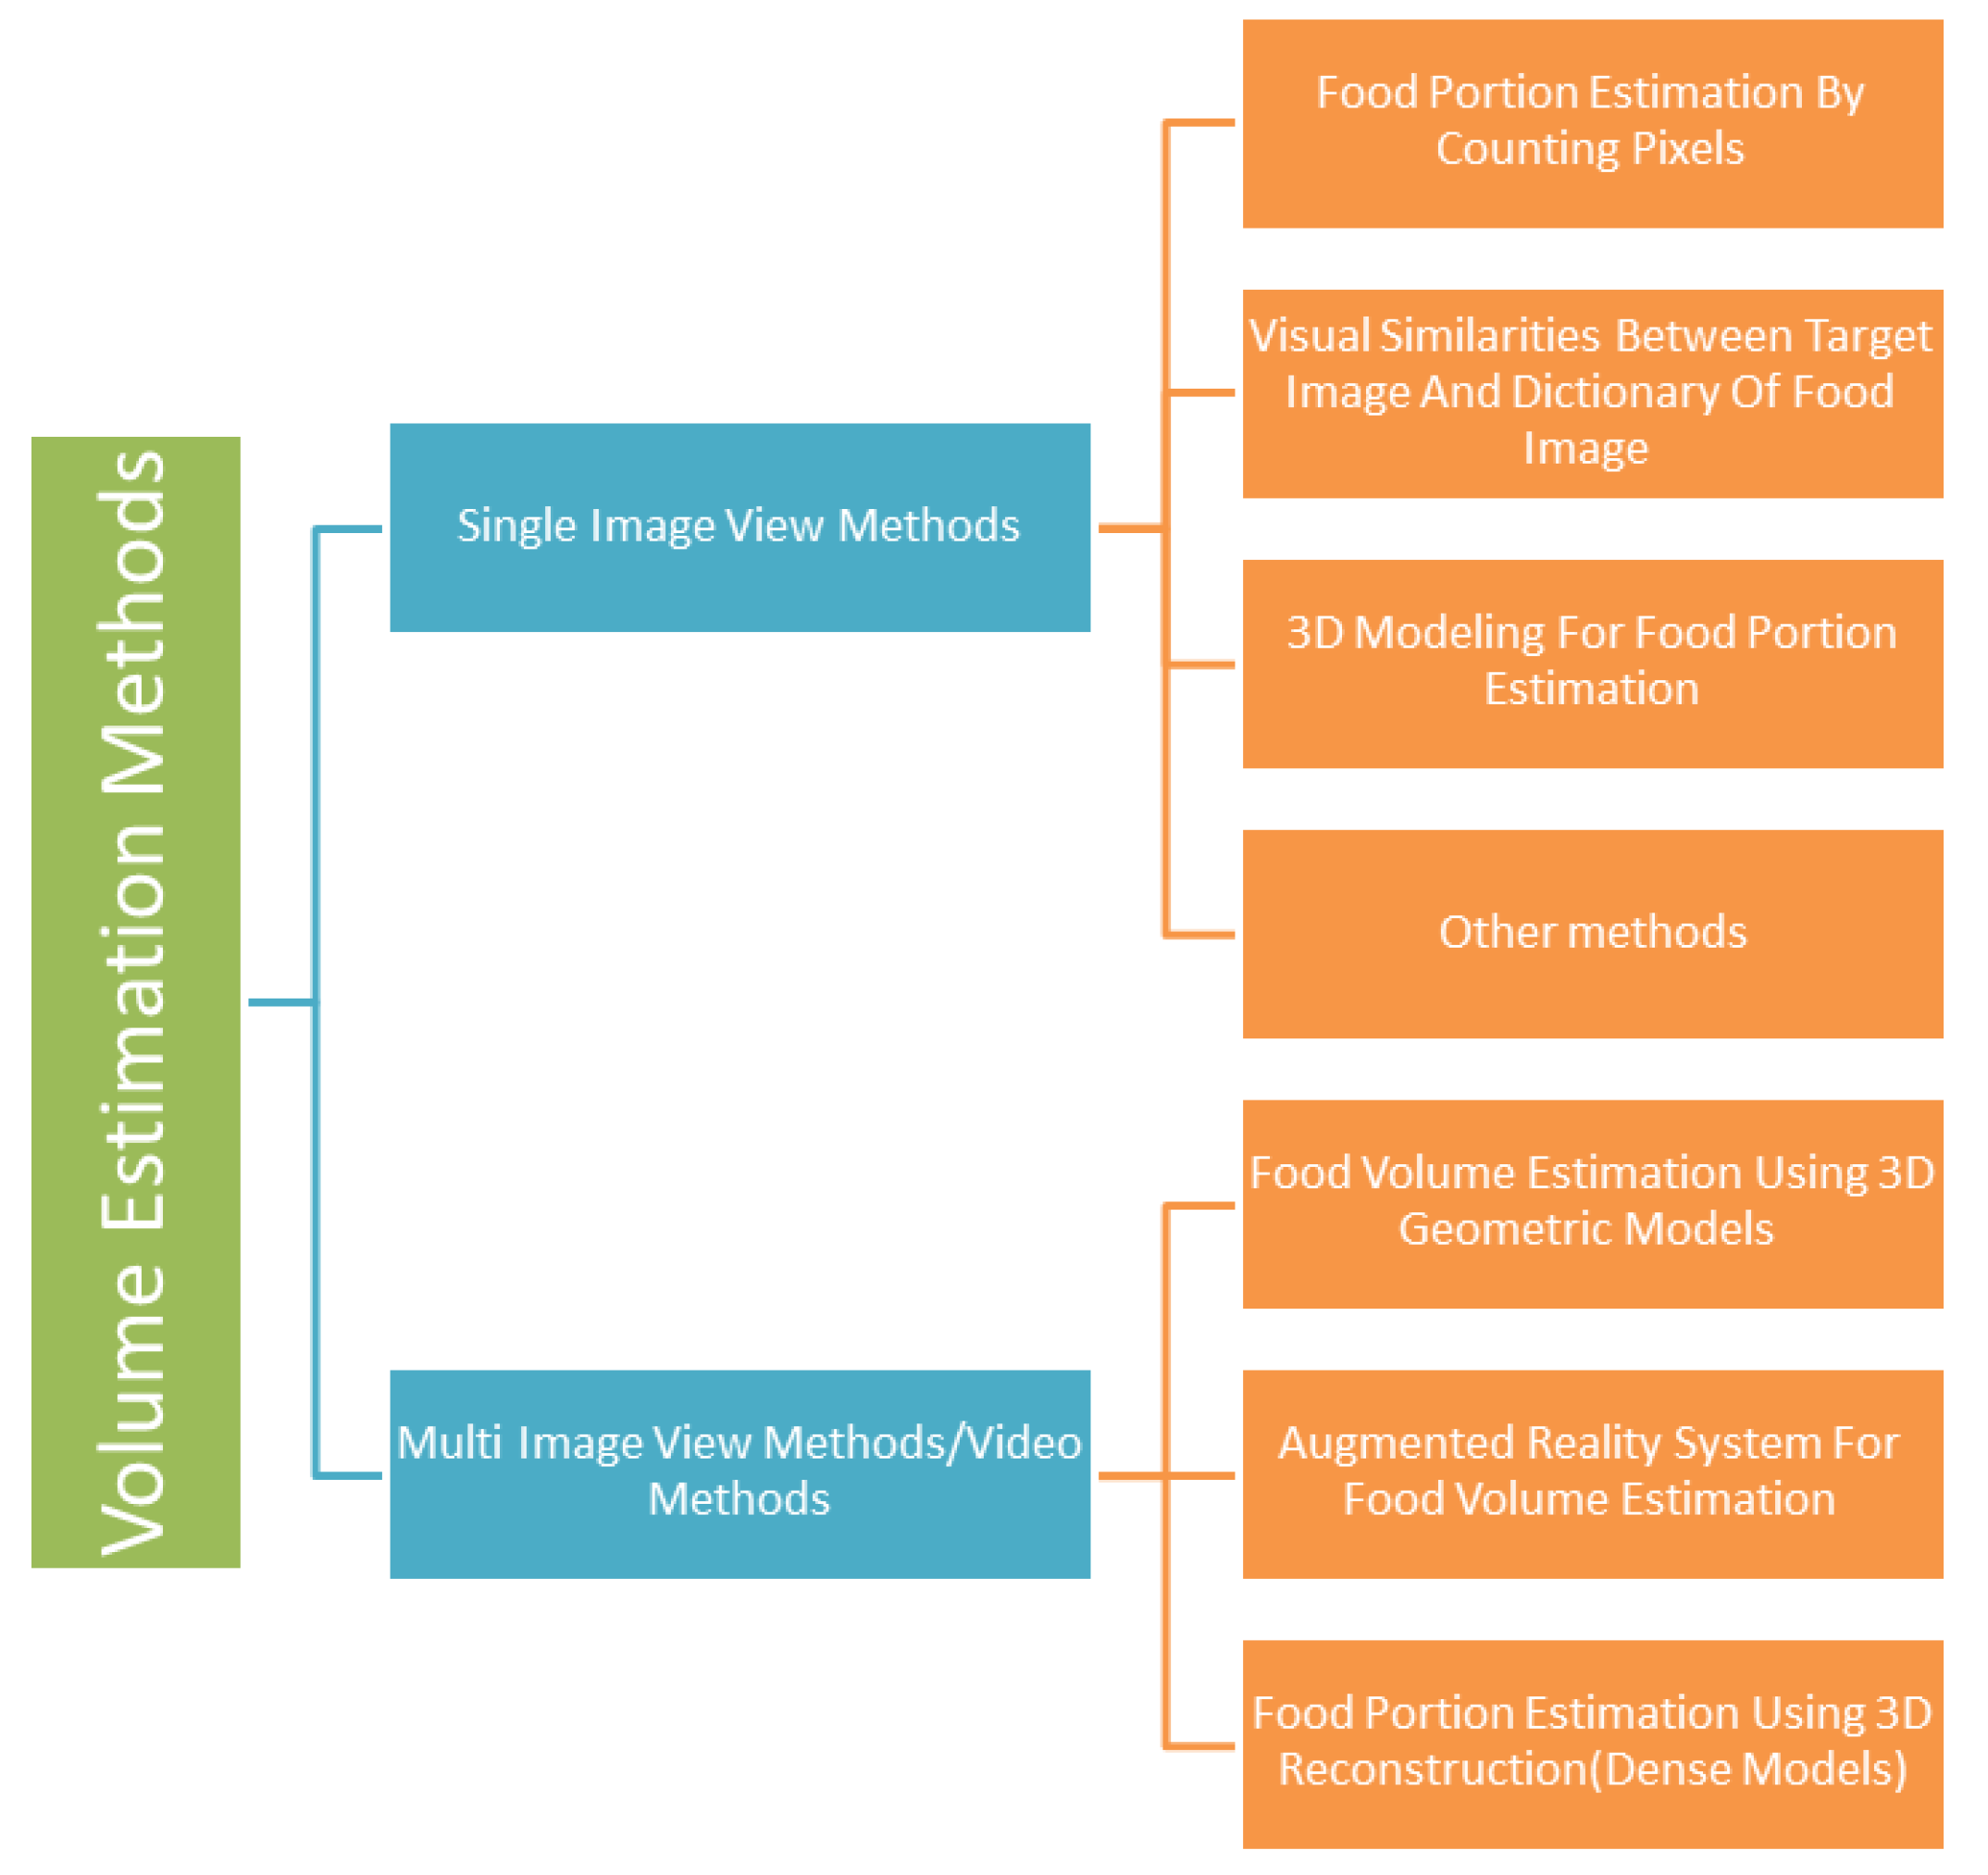
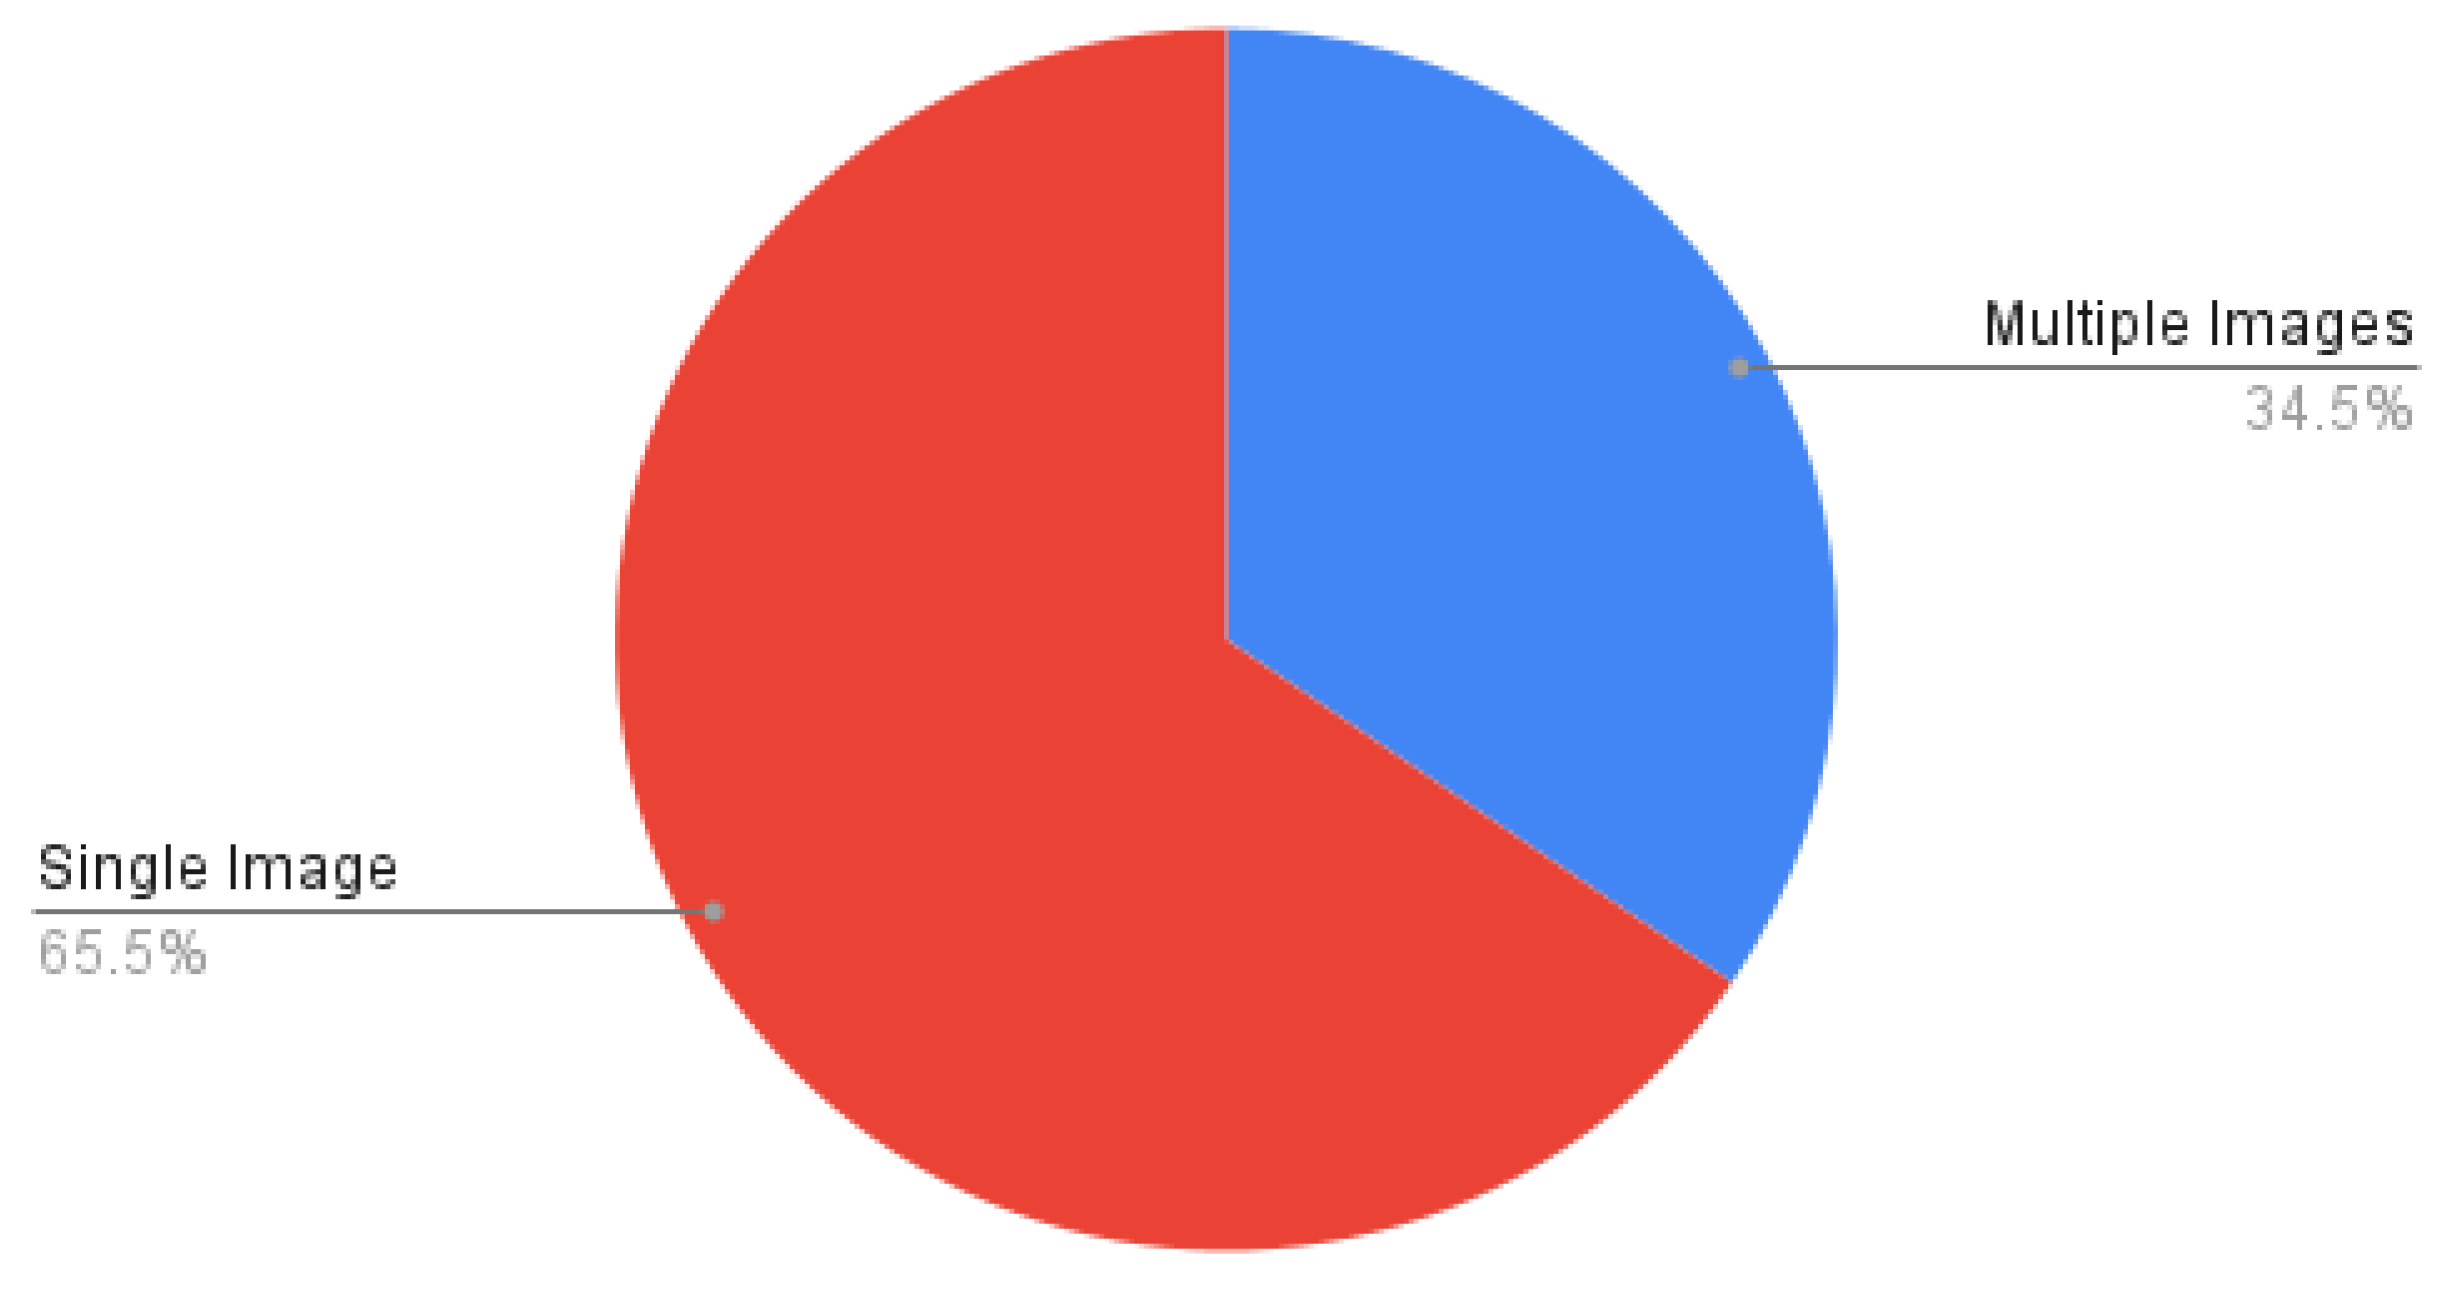
7. Food Volume Estimation
7.1. Single Image View Methods
7.1.1. Food Portion Estimation by Counting Pixels
7.1.2. Visual Similarities between Target Image and Dictionary of Food Images
7.1.3. 3D Modeling for Food Portion Estimation
7.1.4. Other Methods
7.2. Multi-Image View or Video Methods
7.2.1. Food Volume Estimation Using 3D Geometric Models
7.2.2. Augmented Reality System for Food Volume Estimation
7.2.3. Food Portion Estimation Using 3D Reconstruction (Dense Models)
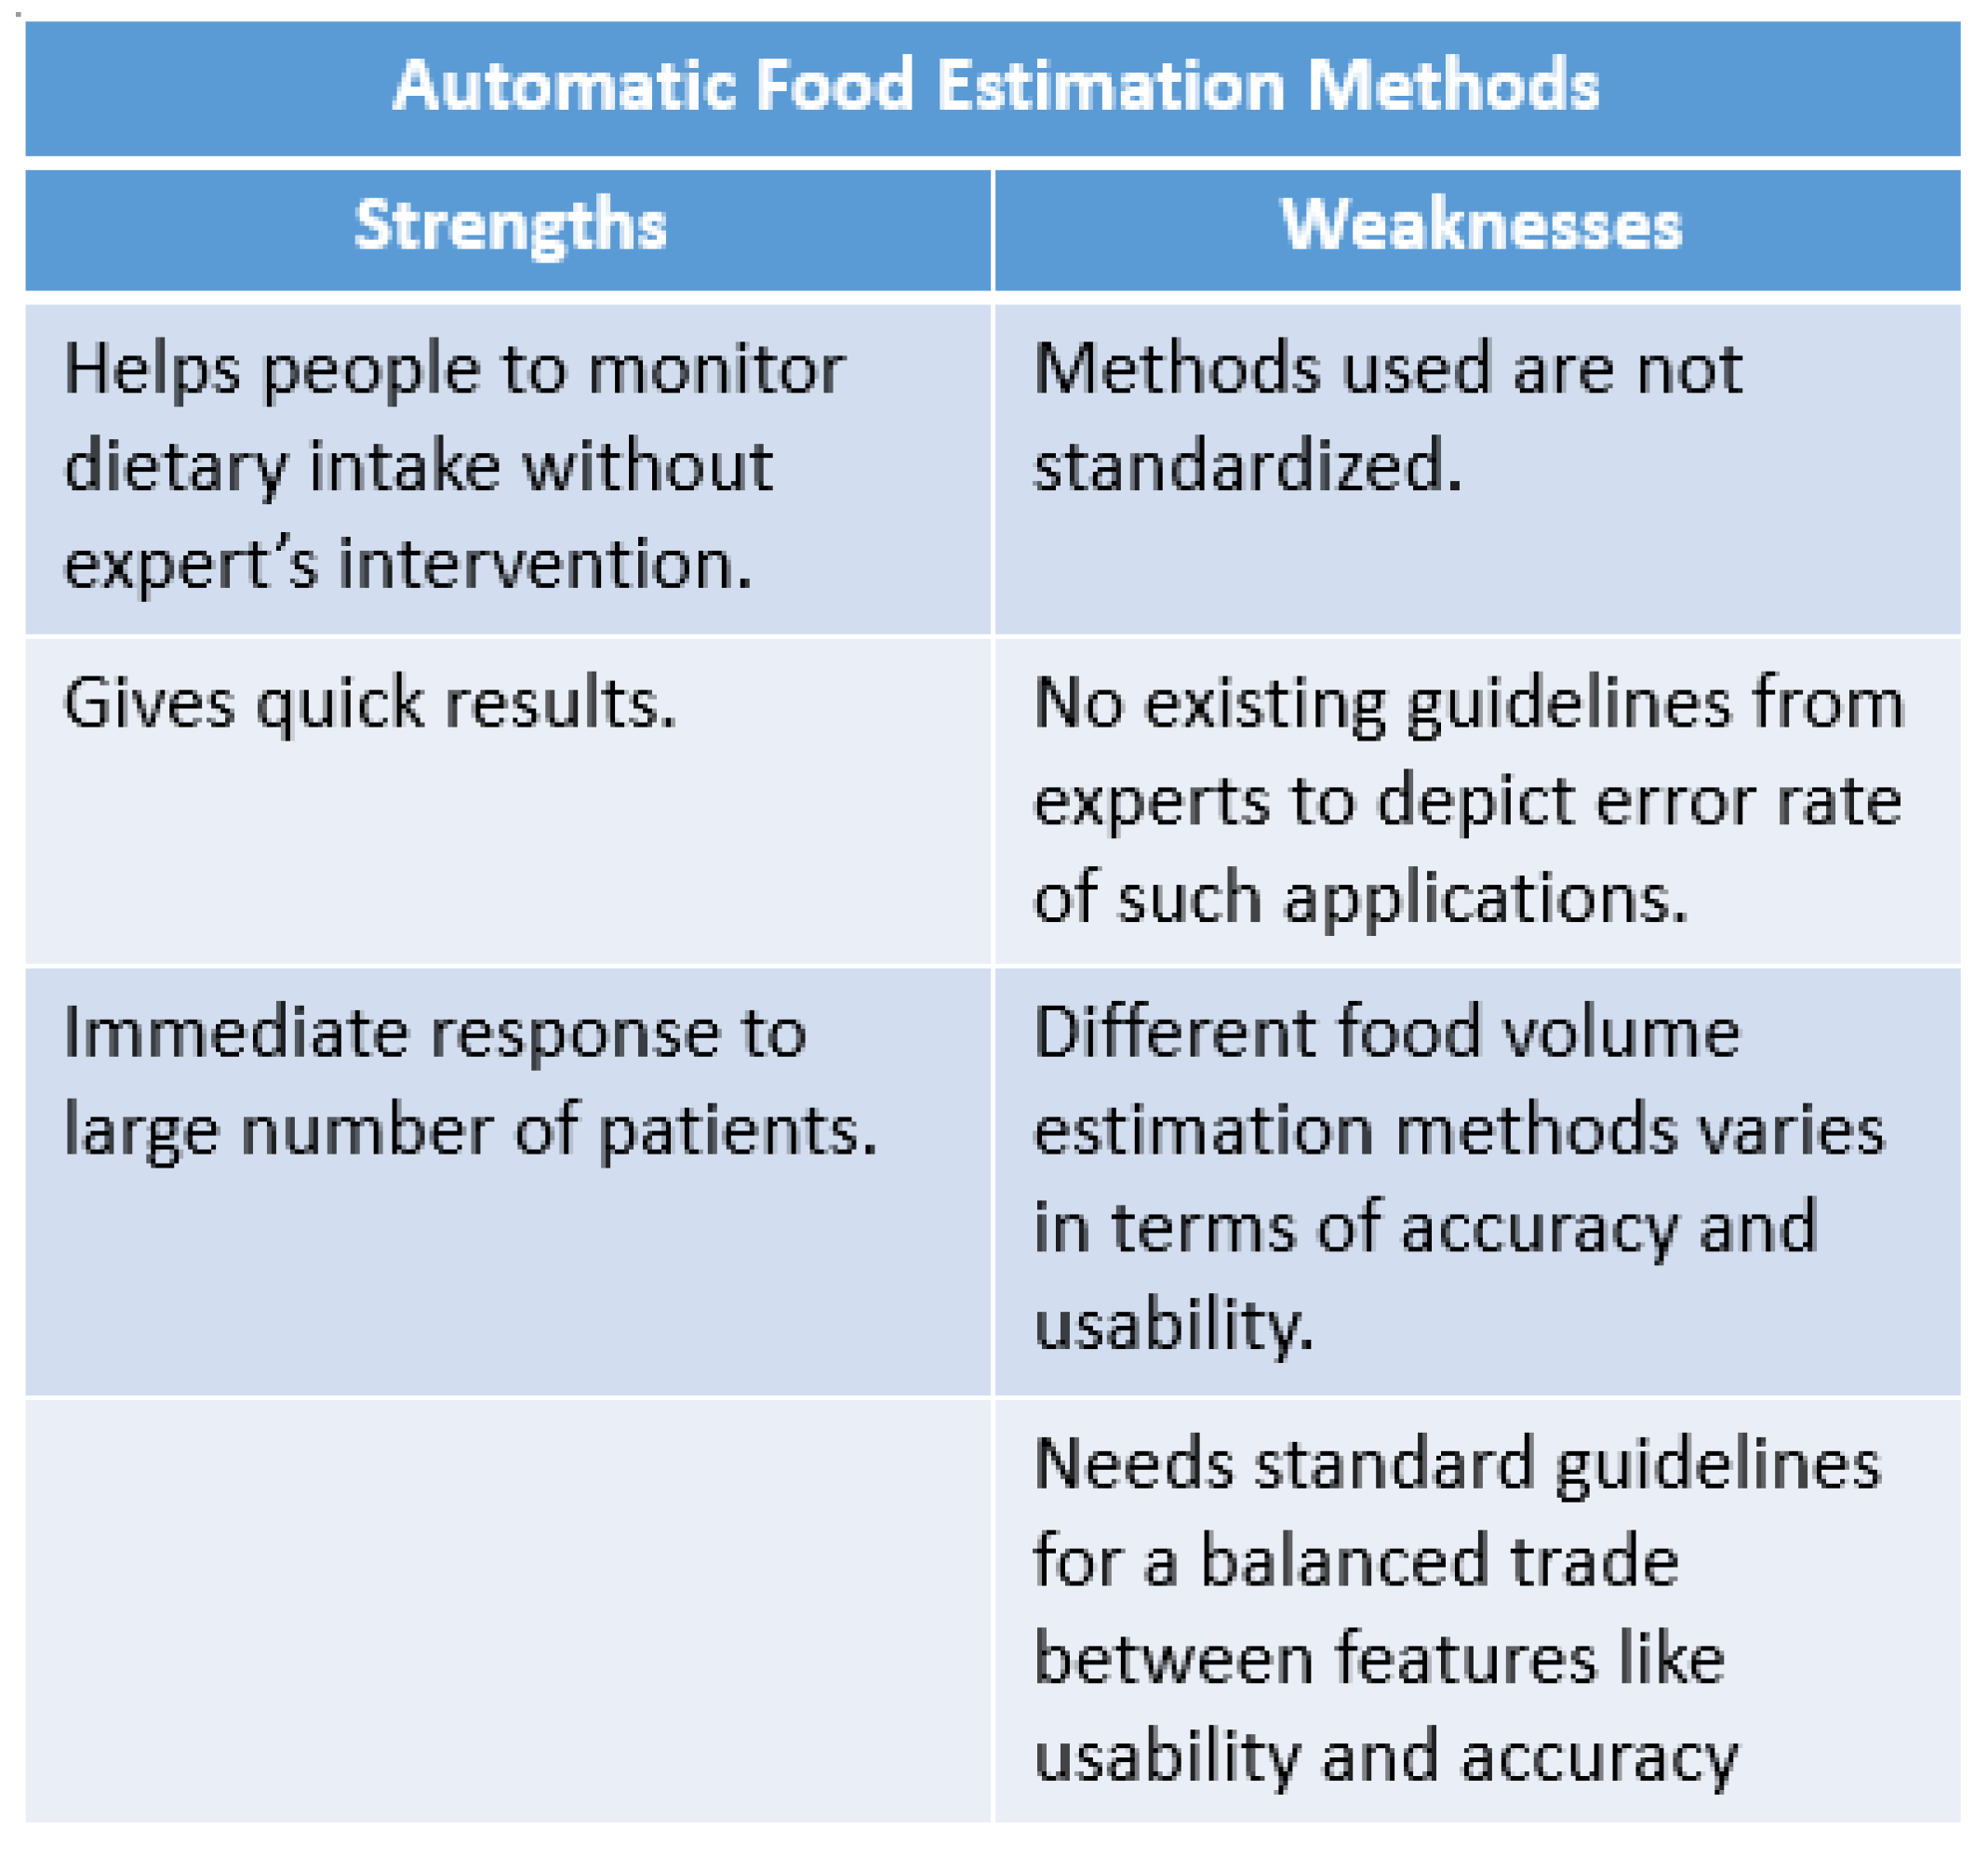
7.3. Strengths and Weakness of the Food Volume Estimation Methods
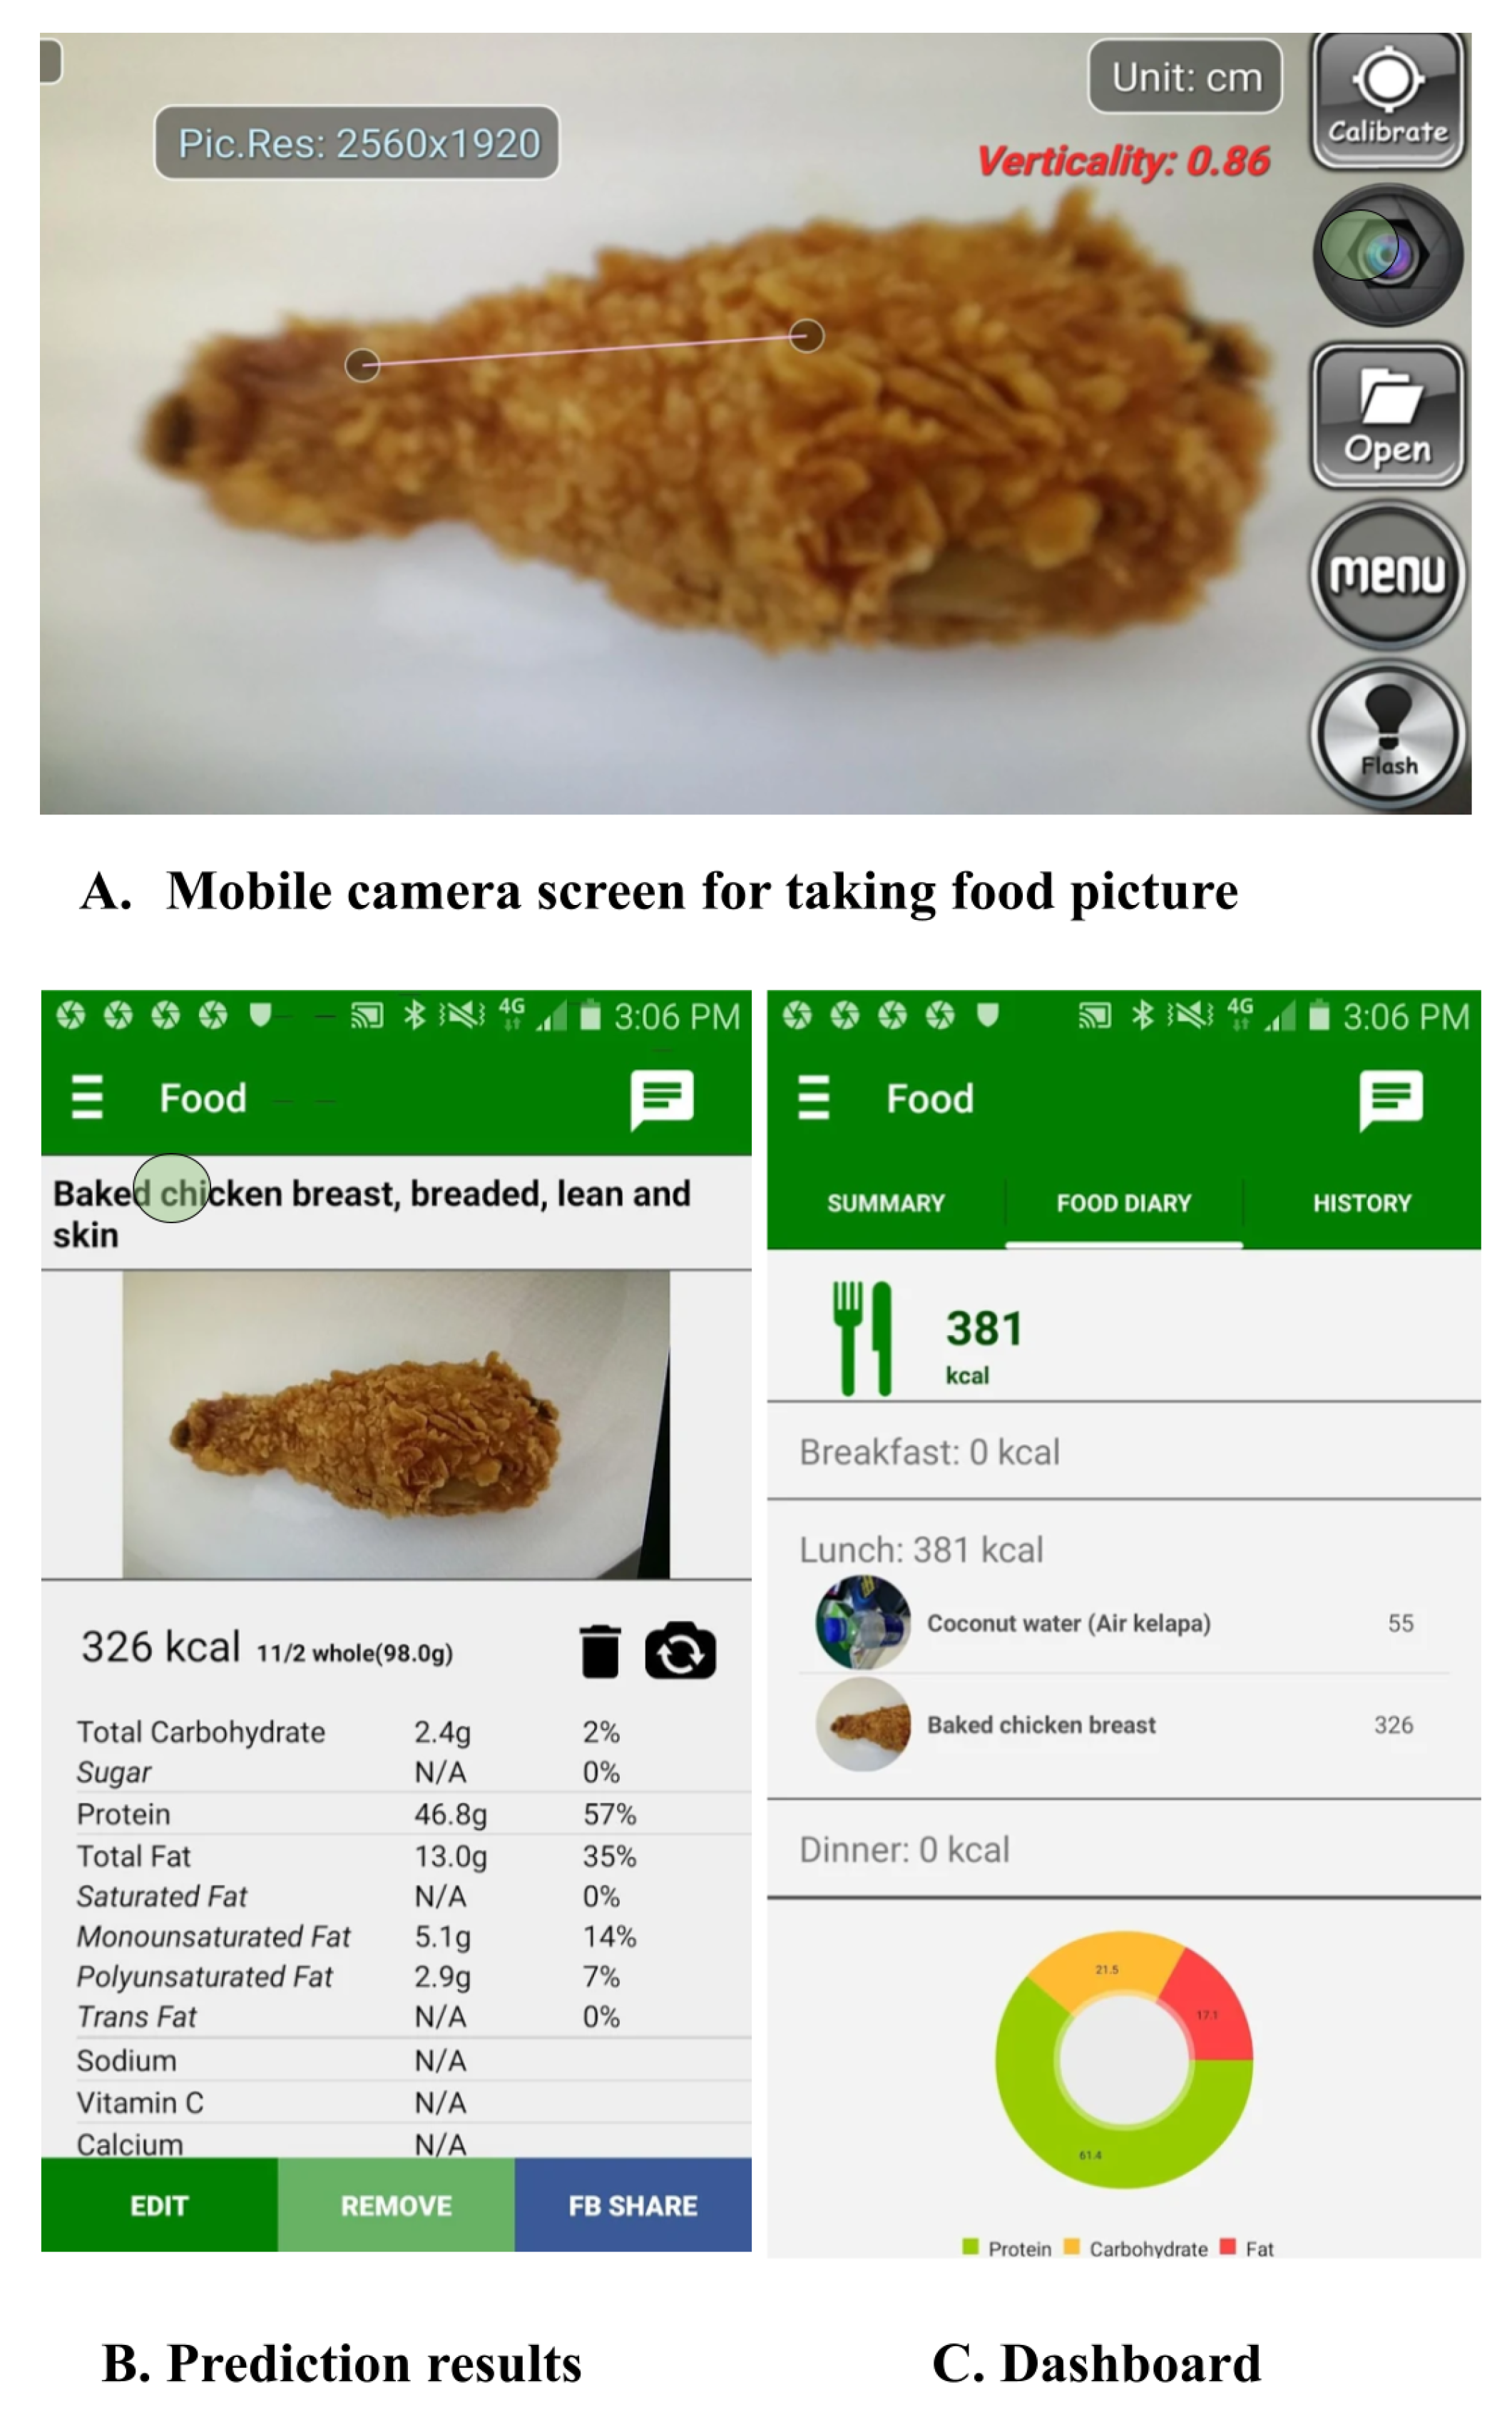
8. Existing and Potential Applications of Vision-Based Methods for Food Recognition in Healthcare
8.1. mHealth Apps for Dietary Assessment
8.2. Harnessing Vision-Based Method to Measure Nutrient Intake during COVID-19
8.3. Life’s Simple 7
8.4. Enforcing Eating Ban on Public Places during COVID-19 Pandemic or Other Restricted Places
8.5. Monitoring Malnutrition in Low-Income Countries
8.6. Food Image Analysis from Social Media
8.7. Food Quality Assessment
9. Statistical Analysis
10. Open Issues
10.1. Unsupervised Learning from Unlabelled Dataset
10.2. Continual Learning
10.3. Explainability
11. Discussion
11.1. Findings
11.2. Limitations and Future Research Challenges
12. Conclusions
Author Contributions
Funding
Institutional Review Board Statement
Informed Consent Statement
Data Availability Statement
Conflicts of Interest
References
- Hajat, C.; Stein, E. The global burden of multiple chronic conditions: A narrative review. Prev. Med. Rep. 2018, 12, 284–293. [Google Scholar] [CrossRef]
- Hall, J.E.; do Carmo, J.M.; da Silva, A.A.; Wang, Z.; Hall, M.E. Obesity-induced hypertension: Interaction of neurohumoral and renal mechanisms. Circ. Res. 2015, 116, 991–1006. [Google Scholar] [CrossRef] [PubMed] [Green Version]
- Al-Goblan, A.S.; Al-Alfi, M.A.; Khan, M.Z. Mechanism linking diabetes mellitus and obesity. Diabetes Metab Syndr. Obes. 2014, 7, 587–591. [Google Scholar] [CrossRef] [Green Version]
- Akil, L.; Ahmad, H.A. Relationships between obesity and cardiovascular diseases in four southern states and Colorado. J. Health Care Poor Underserved. 2011, 22, 61–72. [Google Scholar] [CrossRef] [PubMed] [Green Version]
- De Pergola, G.; Silvestris, F. Obesity as a major risk factor for cancer. J. Obes. 2013, 2013, 291546. [Google Scholar] [CrossRef] [Green Version]
- World Health Organization (WHO). Obesity and Overweigh. Available online: https://www.who.int/news-room/fact-sheets/detail/obesity-and-overweight (accessed on 23 August 2018).
- Ngo, J.; Engelen, A.; Molag, M.; Roesle, J.; García-Segovia, P.; Serra-Majem, L. A review of the use of information and communication technologies for dietary assessment. Br. J. Nutr. 2009, 101 (Suppl. 2), S102–S112. [Google Scholar] [CrossRef] [PubMed] [Green Version]
- Mendi, E.; Ozyavuz, O.; Pekesen, E.; Bayrak, C. Food intake monitoring system for mobile devices. In Proceedings of the 5th IEEE International Workshop on Advances in Sensors and Interfaces IWASI, Bari, Italy, 13–14 June 2013; pp. 31–33. [Google Scholar] [CrossRef]
- Haapala, I.; Barengo, N.C.; Biggs, S.; Surakka, L.; Manninen, P. Weight loss by mobile phone: A 1-year effectiveness study. Public Health Nutr. 2009, 12, 2382–2391. [Google Scholar] [CrossRef] [PubMed]
- Chen, Y.S.; Wong, J.E.; Ayob, A.F.; Othman, N.E.; Poh, B.K. Can Malaysian young adults report dietary intake using a food diary mobile. application? A pilot study on acceptability and compliance. Nutrients 2017, 9, 62. [Google Scholar] [CrossRef] [Green Version]
- Ming, Z.Y.; Chen, J.; Cao, Y.; Forde, C.; Ngo, C.W.; Chua, T.S. Food photo recognition for dietary tracking: System and experiment. In Multimedia Modeling; Springer: Berlin/Heidelberg, Germany, 2018; pp. 129–141. [Google Scholar]
- Kong, F.; Tan, J. DietCam: Automatic Dietary Assessment with Mobile Camera Phones. Pervasive Mob. Comput. 2012, 8, 147–163. [Google Scholar] [CrossRef]
- Meyers, A.; Johnston, N.; Rathod, V.; Korattikara, A.; Gorban, A.; Silberman, N.; Guadarrama, S.; Papandreou, G.; Huang, J.; Murphy, K.P. Im2Calories: Towards an Automated Mobile Vision Food Diary. In Proceedings of the 2015 IEEE International Conference on Computer Vision (ICCV), Santiago, Chile, 7–13 December 2015; pp. 1233–1241. [Google Scholar] [CrossRef]
- Martinel, N.; Micheloni, C. Classification of local eigen-dissimilarities for person re-identification. IEEE Signal Process. Lett. 2015, 22, 455–459. [Google Scholar] [CrossRef]
- Martinel, N.; Das, A.; Micheloni, C.; Roy-Chowdhury, A.K. Re-Identification in the function space of feature warps. IEEE Trans. Pattern Anal. Mach. Intell. 2015, 37, 1656–1669. [Google Scholar] [CrossRef] [PubMed]
- Martinel, N.; Micheloni, C.; Foresti, G.L. Kernelized Saliency-Based Person Re-Identification Through Multiple Metric Learning. IEEE Trans. Image Process. 2015, 24, 5645–5658. [Google Scholar] [CrossRef] [PubMed]
- Mahabir, S.; Baer, D.J.; Giffen, C.; Subar, A.; Campbell, W.; Hartman, T.J.; Clevidence, B.; Albanes, D.; Taylor, P.R. Calorie intake misreporting by diet record and food frequency questionnaire compared to doubly labeled water among postmenopausal women. Eur. J. Clin. Nutr. 2006, 60, 561–565. [Google Scholar] [CrossRef] [PubMed]
- Bandini, L.G.; Must, A.; Cyr, H.; Anderson, S.E.; Spadano, J.L.; Dietz, W.H. Longitudinal changes in the accuracy of reported energy intake in girls 10–15 y of age. Am. J. Clin. Nutr. 2003, 78, 480–484. [Google Scholar] [CrossRef] [Green Version]
- Champagne, C.M.; Baker, N.B.; DeLany, J.P.; Harsha, D.W.; Bray, G.A. Assessment of energy intake underreporting by doubly labeled water and observations on reported nutrient intakes in children. J. Am. Diet Assoc. 1998, 98, 426–433. [Google Scholar] [CrossRef]
- Champagne, C.M.; Bray, G.A.; Kurtz, A.A.; Monteiro, J.B.; Tucker, E.; Volaufova, J.; Delany, J.P. Energy intake and energy expenditure: A controlled study comparing dietitians and non-dietitians. J. Am. Diet Assoc. 2002, 102, 1428–1432. [Google Scholar] [CrossRef] [Green Version]
- Subar, A.F.; Kipnis, V.; Troiano, R.P.; Midthune, D.; Schoeller, D.A.; Bingham, S.; Sharbaugh, C.O.; Trabulsi, J.; Runswick, S.; Ballard-Barbash, R.; et al. Using intake biomarkers to evaluate the extent of dietary misreporting in a large sample of adults: The OPEN study. Am. J. Epidemiol. 2003, 158, 1–13. [Google Scholar] [CrossRef]
- Blanton, C.A.; Moshfegh, A.J.; Baer, D.J.; Kretsch, M.J. The usda automated multiple-pass method accurately estimates group total energy and nutrient intake. J. Nutr. 2006, 136, 2594–2599. [Google Scholar] [CrossRef] [PubMed]
- Daugherty, B.L.; Schap, T.E.; Ettienne-Gittens, R.; Zhu, F.M.; Bosch, M.; Delp, E.J.; Ebert, D.S.; Kerr, D.A.; Boushey, C.J. Novel Technologies for Assessing Dietary Intake: Evaluating the Usability of a Mobile Telephone Food Record Among Adults and Adolescents. J. Med. Internet Res. 2012, 14, e58. [Google Scholar] [CrossRef]
- Snyder, H. Literature review as a research methodology: An overview and guidelines. J. Bus. Res. 2019, 104, 333–339. [Google Scholar] [CrossRef]
- Ronald, K.; Marc, M.; Angelina, A.; Tyler, H.; Christopher, K. Measuring Catastrophic Forgetting in Neural Networks. arXiv 2017, arXiv:1708.02072. [Google Scholar]
- Liew, W.S.; Loo, C.K.; Gryshchuk, V.; Weber, C.; Wermter, S. Effect of Pruning on Catastrophic Forgetting in Growing Dual Memory Networks. In Proceedings of the 2019 International Joint Conference on Neural Networks (IJCNN), Budapest, Hungary, 14–19 July 2019; pp. 1–8. [Google Scholar] [CrossRef]
- Tsoumakas, G.; Katakis, I. Multi-label classification: An overview. Int. J. Data Warehous. Min. 2006, 3, 1–3. [Google Scholar] [CrossRef] [Green Version]
- He, Y.; Xu, C.; Khanna, N.; Boushey, C.J.; Delp, E.J. Food image analysis: Segmentation, identification and weight estimation. In Proceedings of the 2013 IEEE International Conference on Multimedia and Expo (ICME), San Jose, CA, USA, 15–19 July 2013; pp. 1–6. [Google Scholar] [CrossRef] [Green Version]
- Miyazaki, T.; de Silva, G.C.; Aizawa, K. Image-based Calorie Content Estimation for Dietary Assessment. In Proceedings of the 2011 IEEE International Symposium on Multimedia, Dana Point, CA, USA, 5–7 December 2011; pp. 363–368. [Google Scholar] [CrossRef]
- Fang, S.; Zhu, F.; Jiang, C.; Zhang, S.; Boushey, C.J.; Delp, E.J. A comparison of food portion size estimation using geometric models and depth images. In Proceedings of the Image Processing (ICIP), Hoenix, AZ, USA, 25–28 September 2016; Volume 2016, pp. 26–30. [Google Scholar] [CrossRef]
- Okamoto, K.; Yanai, K. An Automatic Calorie Estimation System of Food Images on a Smartphone. In Proceedings of the Madima’16: Proceedings of the 2nd International Workshop on Multimedia Assisted Dietary Management, Amsterdam, The Netherlands, 16 October 2016; pp. 63–70. [Google Scholar] [CrossRef]
- Wu, W.; Yang, J. Fast food recognition from videos of eating for calorie estimation. In Proceedings of the 2009 IEEE International Conference on Multimedia and Expo, New York, NY, USA, 28 June–3 July 2009; pp. 1210–1213. [Google Scholar] [CrossRef]
- Zhang, Z.; Yang, Y.; Yue, Y.; Fernstrom, J.D.; Jia, W.; Sun, M. Food volume estimation from a single image using virtual reality technology. In Proceedings of the 2011 IEEE 37th Annual Northeast Bioengineering Conference (NEBEC), Troy, NY, USA, 1 April 2011; pp. 1–2. [Google Scholar] [CrossRef]
- Hippocrate, E.A.A.; Suwa, H.; Arakawa, Y.; Yasumoto, K. Food Weight Estimation using Smartphone and Cutlery. In Proceedings of the First Workshop on IoT-enabled Healthcare and Wellness Technologies and Systems (IoT of Health’16), Singapore, 30 June 2016; Association for Computing Machinery: New York, NY, USA, 2016; pp. 9–14. [Google Scholar] [CrossRef]
- Yue, Y.; Jia, W.; Sun, M. Measurement of food volume based on single 2-D image without conventional camera calibration. In Proceedings of the 2012 Annual International Conference of the IEEE Engineering in Medicine and Biology Society, San Diego, CA, USA, 29 August 2012; pp. 2166–2169. [Google Scholar] [CrossRef] [Green Version]
- Xu, C.; He, Y.; Khanna, N.; Boushey, C.J.; Delp, E.J. Model-based food volume estimation using 3D pose. In Proceedings of the 2013 IEEE International Conference on Image Processing, Melbourne, VIC, Australia, 15–18 September 2013; pp. 2534–2538. [Google Scholar] [CrossRef] [Green Version]
- Hernández, T.; Wilder, L.; Kuehn, D.; Rubotzky, K.; Moser-Veillon, P.; Godwin, S.; Thompson, C.; Wang, C. Portion size estimation and expectation of accuracy. J. Food Compos. Anal. 2006, 19, S14–S21. [Google Scholar] [CrossRef]
- Zhang, W.; Yu, Q.; Siddiquie, B.; Divakaran, A.; Sawhney, H. Snap-n-Eat: Food Recognition and Nutrition Estimation on a Smartphone. J. Diabetes Sci. Technol. 2015, 9, 525–533. [Google Scholar] [CrossRef] [Green Version]
- Huang, J.; Ding, H.; Mcbride, S.; Ireland, D.; Karunanithi, M. Use of Smartphones to Estimate Carbohydrates in Foods for Diabetes Management. Stud. Health Technol. Inform. 2015, 214, 121–127. [Google Scholar]
- Khanna, N.; Boushey, C.J.; Kerr, D.; Okos, M.; Ebert, D.S.; Delp, E.J. An Overview of The Technology Assisted Dietary Assessment Project at Purdue University. In Proceedings of the 2010 IEEE International Symposium on Multimedia, ISM 2010, Taichung, Taiwan, 13–15 December 2010; pp. 290–295. [Google Scholar] [CrossRef] [Green Version]
- Jia, W.; Yue, Y.; Fernstrom, J.D.; Zhang, Z.; Yang, Y.; Sun, M. 3D localization of circular feature in 2D image and application to food volume estimation. In Proceedings of the 2012 Annual International Conference of the IEEE Engineering in Medicine and Biology Society, San Diego, CA, USA, 29 August 2012; pp. 4545–4548. [Google Scholar] [CrossRef] [Green Version]
- Matsuda, Y.; Yanai, K. Multiple-food recognition considering co-occurrence employing manifold ranking. In Proceedings of the 21st International Conference on Pattern Recognition (ICPR2012), Tsukuba, Japan, 11–15 November 2012; pp. 2017–2020. [Google Scholar]
- Kawano, Y.; Yanai, K. FoodCam-256: A Large-scale Real-time Mobile Food RecognitionSystem employing High-Dimensional Features and Compression of Classifier Weights. In Proceedings of the 22nd ACM international conference on Multimedia (MM’14), Orlando, FL, USA, 3–7 November 2014; Association for Computing Machinery: New York, NY, USA, 2014; pp. 761–762. [Google Scholar] [CrossRef]
- Chen, M.; Dhingra, K.; Wu, W.; Yang, L.; Sukthankar, R.; Yang, J. PFID: Pittsburgh fast-food image dataset. In Proceedings of the 2009 16th IEEE International Conference on Image Processing (ICIP), Cairo, Egypt, 7–10 November 2009; pp. 289–292. [Google Scholar] [CrossRef] [Green Version]
- Farinella, G.M.; Allegra, D.; Moltisanti, M.; Stanco, F.; Battiato, S. Retrieval and classification of food images. Comput. Biol. Med. 2016, 77, 23–39. [Google Scholar] [CrossRef] [PubMed]
- Farinella, G.M.; Allegra, D.; Stanco, F. A Benchmark Dataset to Study the Representation of Food Images. In Proceedings of the International Workshop on Assistive Computer Vision and Robotics (ACVR) 2014, Zurigo, Switzerland, 6–12 September 2014. [Google Scholar] [CrossRef]
- Chen, J.; Ngo, C. Deep-based Ingredient Recognition for Cooking Recipe Retrieval. In Proceedings of the 24th ACM International Conference on Multimedia (MM’16), Amsterdam, The Netherlands, 15–19 October 2016; Association for Computing Machinery: New York, NY, USA, 2016; pp. 32–41. [Google Scholar] [CrossRef]
- Chen, M.-Y.; Yang, Y.-H.; Ho, C.-J.; Wang, S.-H.; Liu, S.-M.; Chang, E.; Yeh, C.-H.; Ouhyoung, M. Automatic Chinese food identification and quantity estimation. In SIGGRAPH Asia 2012 Technical Briefs (SA’12); Association for Computing Machinery: New York, NY, USA, 2012; pp. 1–4. [Google Scholar] [CrossRef]
- Hoashi, H.; Joutou, T.; Yanai, K. Image recognition of 85 food categories by feature fusion. In Proceedings of the 2010 IEEE International Symposium on Multimedia, Taichung, Taiwan, 13–15 December 2010; pp. 296–301. [Google Scholar] [CrossRef]
- Ciocca, G.; Napoletano, P.; Schettini, R. Food Recognition and Leftover Estimation for Daily Diet Monitoring. In Proceedings of the ICIAP 2015 International Workshops, BioFor, CTMR, RHEUMA, ISCA, MADiMa, SBMI, and QoEM, Genoa, Italy, 7–8 September 2015; Volume 9281, pp. 334–341. [Google Scholar] [CrossRef]
- Güngör, C.; Baltacı, F.; Erdem, A.; Erdem, E. Turkish cuisine: A benchmark dataset with Turkish meals for food recognition. In Proceedings of the 2017 25th Signal Processing and Communications Applications Conference (SIU), Antalya, Turkey, 15–18 May 2017; pp. 1–4. [Google Scholar] [CrossRef]
- Tahir, G.A.; Loo, C.K. An Open-Ended Continual Learning for Food Recognition Using Class Incremental Extreme Learning Machines. IEEE Access 2020, 8, 82328–82346. [Google Scholar] [CrossRef]
- Hou, S.; Feng, Y.; Wang, Z. VegFru: A Domain-Specific Dataset for Fine-Grained Visual Categorization. In Proceedings of the 2017 IEEE International Conference on Computer Vision (ICCV), Venice, Italy, 22–29 October 2017; pp. 541–549. [Google Scholar] [CrossRef]
- Mureșan, H.; Oltean, M. Fruit recognition from images using deep learning. Acta Univ. Sapientiae Inform. 2018, 10, 26–42. [Google Scholar] [CrossRef] [Green Version]
- Waltner, G.; Schwarz, M.; Ladstätter, S.; Weber, A.; Luley, P.; Lindschinger, M.; Schmid, I.; Scheitz, W.; Bischof, H.; Paletta, L. Personalized dietary self-management using mobile vision-based assistance. In Proceedings of the International Conference on Image Analysis and Processing, Catania, Italy, 11–15 September 2017; Springer: Berlin/Heidelberg, Germany, 2018; pp. 385–393. [Google Scholar] [CrossRef]
- Godwin, S.; Chambers, E.T.; Cleveland, L.; Ingwersen, L. A new portion size estimation aid for wedgeshaped. Foods. J. Am. Diet. Assoc. 2006, 106, 1246–1250. [Google Scholar] [CrossRef]
- Mariappan, A.; Bosch, M.; Zhu, F.; Boushey, C.J.; Kerr, D.A.; Ebert, D.S.; Delp, E.J. Personal Dietary Assessment Using Mobile Devices. In Proceedings of the Computational Imaging VII. International Society for Optics and Photonics, San Jose, CA, USA, 19–20 January 2009; Volume 7246, 72460Z. [Google Scholar] [CrossRef] [Green Version]
- Bosch, M.; Schap, T.; Zhu, F.; Khanna, N.; Boushey, C.J.; Delp, E.J. Integrated database system for mobile dietary assessment and analysis. In Proceedings of the 2011 IEEE International Conference on Multimedia and Expo, Barcelona, Spain, 11–15 July 2011. [Google Scholar] [CrossRef] [Green Version]
- Bossard, L.; Guillaumin, M.; van Gool, L. Food-101–mining discriminative components with random forests. In Proceedings of the European Conference on Computer Vision, Zurich, Switzerland, 6–12 September 2014; pp. 446–461. [Google Scholar] [CrossRef]
- Stütz, T.; Dinic, R.; Domhardt, M.; Ginzinger, S. Can mobile augmented reality systems assist in portion estimation? A user study. In Proceedings of the 2014 IEEE International Symposium on Mixed and Augmented Reality—Media, Art, Social Science, Humanities and Design (ISMAR-MASH’D), Munich, Germany, 10–12 September 2014; pp. 51–57. [Google Scholar] [CrossRef]
- Wang, X.; Kumar, D.; Thome, N.; Cord, M.; Precioso, F. Recipe recognition with large multimodal food dataset. In Proceedings of the 2015 IEEE International Conference on Multimedia & Expo Workshops (ICMEW), Turin, Italy, 29 June–3 July 2015; pp. 1–6. [Google Scholar] [CrossRef] [Green Version]
- Fang, S.; Liu, C.; Zhu, F.; Delp, E.J.; Boushey, C.J. Single-View Food Portion Estimation Based on Geometric Models. In Proceedings of the 2015 IEEE International Symposium on Multimedia (ISM), Miami, FL, USA, 14–16 December 2015; pp. 385–390. [Google Scholar] [CrossRef] [Green Version]
- Herranz, L.; Xu, R.; Jiang, S. A probabilistic model for food image recognition in restaurants. In Proceedings of the 2015 IEEE International Conference on Multimedia and Expo (ICME), Turin, Italy, 29 June–3 July 2015; pp. 1–6. [Google Scholar] [CrossRef]
- Beijbom, O.; Joshi, N.; Morris, D.; Saponas, S.; Khullar, S. Menu-Match: Restaurant-Specific Food Logging from Images. In Proceedings of the 2015 IEEE Winter Conference on Applications of Computer Vision, Waikoloa, HI, USA, 5–9 January 2015; pp. 844–851. [Google Scholar] [CrossRef]
- Zhou, F.; Lin, Y. Fine-grained image classification by exploring bipartite-graph labels. In Proceedings of the IEEE Conference on Computer Vision and Pattern Recognition, Las Vegas, NV, USA, 27–30 June 2016; pp. 1124–1133. [Google Scholar]
- Ciocca, G.; Napoletano, P.; Schettini, R. Food Recognition: A New Dataset, Experiments and Results. IEEE J. Biomed. Health Inform. 2017, 21, 588–598. [Google Scholar] [CrossRef] [PubMed]
- Wu, H.; Merler, M.; Uceda-Sosa, R.; Smith, J.R. Learning to Make Better Mistakes: Semantics-aware Visual Food Recognition. In Proceedings of the 24th ACM international conference on Multimedia (MM’16), Amsterdam, The Netherlands, 15–19 October 2016; Association for Computing Machinery: New York, NY, USA, 2016; pp. 172–176. [Google Scholar] [CrossRef]
- Singla, A.; Yuan, L.; Ebrahimi, T. Food/Non-food Image Classification and Food Categorization using Pre-Trained GoogLeNet Model. In Proceedings of the 2nd International Workshop on Multimedia Assisted Dietary Management (MADiMa’16), Amsterdam, The Netherlands, 16 October 2016; Association for Computing Machinery: New York, NY, USA, 2016; pp. 3–11. [Google Scholar] [CrossRef] [Green Version]
- Rich, J.; Haddadi, H.; Hospedales, T.M. Towards Bottom-Up Analysis of Social Food. In Proceedings of the 6th International Conference on Digital Health Conference (DH’16), Montréal, QC, Canada, 11–13 April 2016; Association for Computing Machinery: New York, NY, USA, 2016; pp. 111–120. [Google Scholar] [CrossRef] [Green Version]
- Liang, Y.; Li, J. Computer vision-based food calorie estimation: Dataset, method, and experiment. arXiv 2017, arXiv:1705.07632. [Google Scholar]
- Pandey, P.; Deepthi, A.; Mandal, B.; Puhan, N.B. FoodNet: Recognizing Foods Using Ensemble of Deep Networks. IEEE Signal Process. Lett. 2017, 24, 1758–1762. [Google Scholar] [CrossRef] [Green Version]
- Termritthikun, C.; Muneesawang, P.; Kanprachar, S. NUInNet: Thai food image recognition using convolutional neural networks on smartphone. J. Telecommun. Electron. Comput. Eng. (JTEC) 2017, 9, 63–67. [Google Scholar]
- Ciocca, G.; Napoletano, P.; Schettini, R. Learning CNN-based features for retrieval of food images. In Proceedings of the New Trends in Image Analysis and Processing—ICIAP 2017, Catania, Italy, 11–15 September 2017; pp. 426–434. [Google Scholar]
- Yu, Q.; Anzawa, M.; Amano, S.; Ogawa, M.; Aizawa, K. Food Image Recognition by Personalized Classifier. In Proceedings of the 2018 25th IEEE International Conference on Image Processing (ICIP), Athens, Greece, 7–10 October 2018; pp. 171–175. [Google Scholar] [CrossRef]
- Kaur, P.; Sikka, K.; Wang, W.; Belongie, S.; Divakaran, A. Foodx-251: A dataset for fine-grained food classification. arXiv 2019, arXiv:1907.06167. [Google Scholar]
- Available online: https://www.aicrowd.com/challenges/food-recognition-challenge (accessed on 23 August 2021).
- Bolaños, M.; Radeva, P. Simultaneous Food Localization and Recognition. In Proceedings of the 23rd International Conference on Pattern Recognition (ICPR) 2016 (IN PRESS), Cancun, Mexico, 4–8 December 2016. [Google Scholar]
- Aguilar, E.; Bolaños, M.; Radeva, P. Regularized Uncertainty-based Multi-Task LearningModel for Food Analysis. J. Vis. Commun. Image R. 2019, 60, 360–370. [Google Scholar] [CrossRef]
- Kumar, G.; Bhatia, P.K. A Detailed Review of Feature Extraction in Image Processing Systems. In Proceedings of the 2014 Fourth International Conference on Advanced Computing & Communication Technologies, Rohtak, India, 8–9 February 2014; pp. 5–12. [Google Scholar] [CrossRef]
- Yang, S.; Chen, M.; Pomerleau, D.; Sukthankar, R. Food recognition using statistics of pairwise local features. In Proceedings of the IEEE Computer Society Conference on Computer Vision and Pattern Recognition, San Francisco, CA, USA, 13–18 June 2010; pp. 2249–2256. [Google Scholar] [CrossRef]
- Pouladzadeh, P.; Shirmohammadi, S.; Bakirov, A.; Bulut, A.; Yassine, A. Cloud-Based SVM for Food Categorization. Multimedia Tools and Applications; Springer: Berlin/Heidelberg, Germany, 2014. [Google Scholar] [CrossRef]
- Kawano, Y.; Yanai, K. Real-Time Mobile Food Recognition System. In Proceedings of the 2013 IEEE Conference on Computer Vision and Pattern Recognition Workshops, Portland, OR, USA, 23–28 June 2013; pp. 1–7. [Google Scholar] [CrossRef]
- Oliveira, L.; Costa, V.; Neves, G.; Oliveira, T.; Jorge, E.; Lizarraga, M. A mobile, lightweight, poll-based food identification system. Pattern Recognit. 2014, 47, 1941–1952. [Google Scholar] [CrossRef]
- Martinel, N.; Piciarelli, C.; Micheloni, C. A supervised extreme learning committee for food recognition. Comput. Vis. Image Underst. 2016, 148, 67–86. [Google Scholar] [CrossRef]
- Bosch, M.; Zhu, F.; Khanna, N.; Boushey, C.J.; Delp, E.J. Combining global and local features for food identification in dietary assessment. In Proceedings of the 2011 18th IEEE International Conference on Image Processing, Brussels, Belgium, 11–14 September 2011; Volume 2011, pp. 1789–1792. [Google Scholar] [CrossRef] [Green Version]
- Kong, F.; Tan, J. DietCam: Regular Shape Food Recognition with a Camera Phone. In Proceedings of the 2011 International Conference on Body Sensor Networks, Chicago, IL, USA, 19–22 May 2011; pp. 127–132. [Google Scholar] [CrossRef]
- Zhang, M.M. Identifying the Cuisine of a Plate of Food; Tech. Report; University of California San Diego: San Diego, CA, USA, 2011. [Google Scholar]
- Matsuda, Y.; Hoashi, H.; Yanai, K. Recognition of Multiple-Food Images by Detecting Candidate Regions. In Proceedings of the 2012 IEEE International Conference on Multimedia and Expo, Melbourne, VIC, Australia, 9–13 July 2012; pp. 25–30. [Google Scholar] [CrossRef] [Green Version]
- Anthimopoulos, M.M.; Gianola, L.; Scarnato, L.; Diem, P.; Mougiakakou, S.G. A food recognition system for diabetic patients based on an optimized bag-of-features model. IEEE J. Biomed. Health Inform. 2014, 18, 1261–1271. [Google Scholar] [CrossRef]
- Tammachat, N.; Pantuwong, N. Calories analysis of food intake using image recognition. In Proceedings of the 2014 6th International Conference on Information Technology and Electrical Engineering (ICITEE), Yogyakarta, Indonesia, 7–8 October 2014; pp. 1–4. [Google Scholar] [CrossRef]
- Pouladzadeh, P.; Shirmohammadi, S.; Yassine, A. Using graph cut segmentation for food calorie measurement. In Proceedings of the 2014 IEEE International Symposium on Medical Measurements and Applications (MeMeA), Lisbon, Portugal, 11–12 June 2014; pp. 1–6. [Google Scholar] [CrossRef]
- He, Y.; Xu, C.; Khanna, N.; Boushey, C.J.; Delp, E.J. Analysis of food images: Features and classification. In Proceedings of the 2014 IEEE International Conference on Image Processing (ICIP), Paris, France, 27–30 October 2014; pp. 2744–2748. [Google Scholar] [CrossRef] [Green Version]
- Heaton, J. Ian Goodfellow, Yoshua Bengio, and Aaron Courville: Deep learning. In Genetic Programming and Evolvable Machines; The MIT Press: Cambridge, MA, USA, 2016; Volume 19, 800p, ISBN 0262035618. [Google Scholar] [CrossRef] [Green Version]
- Deng, L.; Yu, D. Deep learning: Methods and applications. Found. Trends Signal Process. 2014, 7, 197–387. [Google Scholar] [CrossRef] [Green Version]
- LeCun, Y.; Bengio, Y.; Hinton, G. Deep learning. Nature 2015, 521, 436–444. [Google Scholar] [CrossRef]
- Yanai, K.; Kawano, Y. Food image recognition using deep convolutional network with pre-training and fine-tuning. In Proceedings of the 2015 IEEE International Conference on Multimedia & Expo Workshops (ICMEW), Turin, Italy, 29 June–3 July 2015; pp. 1–6. [Google Scholar] [CrossRef]
- Szegedy, C.; Vanhoucke, V.; Ioffe, S.; Shlens, J.; Wojna, Z. Rethinking the Inception Architecture for Computer Vision. In Proceedings of the 2016 IEEE Conference on Computer Vision and Pattern Recognition (CVPR), Las Vegas, NV, USA, 27–30 June 2016; pp. 2818–2826. [Google Scholar] [CrossRef] [Green Version]
- Russakovsky, O.; Deng, J.; Su, H.; Krause, J.; Satheesh, S.; Ma, S.; Huang, Z.; Karpathy, A.; Khosla, A.; Bernstein, M.; et al. ImageNet Large Scale Visual Recognition Challenge. Int. J. Comput. Vis. 2015, 115, 211–252. [Google Scholar] [CrossRef] [Green Version]
- Krizhevsky, A.; Sutskever, I.; Hinton, G.E. Imagenet classification with deep convolutional neural networks. Adv. Neural Inf. Process. Syst. 2012, 25, 1097–1105. [Google Scholar] [CrossRef]
- Heravi, E.; Aghdam, H.; Puig, D. Classification of Foods Using Spatial Pyramid Convolutional Neural Network. Artif. Intell. Res. Dev. 2016, 288, 163–168. [Google Scholar] [CrossRef]
- Jiang, S.; Min, W.; Liu, L.; Luo, Z. Multi-Scale Multi-View Deep Feature Aggregation for Food Recognition. IEEE Trans. Image Process. 2020, 29, 265–276. [Google Scholar] [CrossRef]
- Kawano, Y.; Yanai, K. Food image recognition with deep convolutional features. In Proceedings of the 2014 ACM International Joint Conference on Pervasive and Ubiquitous Computing: Adjunct Publication (UbiComp’14 Adjunct), Seattle, WA, USA, 13–17 September 2014; Association for Computing Machinery: New York, NY, USA, 2014; pp. 589–593. [Google Scholar] [CrossRef]
- Christodoulidis, S.; Anthimopoulos, M.; Mougiakakou, S. Food Recognition for Dietary Assessment. Using Deep. Convolutional Neural Netw. 2015, 9281, 458–465. [Google Scholar] [CrossRef]
- Pouladzadeh, P.; Kuhad, P.; Peddi, S.V.B.; Yassine, A.; Shirmohammadi, S. Food calorie measurement using deep learning neural network. In Proceedings of the 2016 IEEE International Instrumentation and Measurement Technology Conference Proceedings, Taipei, Taiwan, 23–26 May 2016; pp. 1–6. [Google Scholar] [CrossRef]
- Hassannejad, H.; Matrella, G.; Ciampolini, P.; de Munari, I.; Mordonini, M.; Cagnoni, S. Food Image Recognition Using Very Deep Convolutional Networks. In Proceedings of the 2nd International Workshop on Multimedia Assisted Dietary Management (MADiMa’16), Amsterdam, The Netherlands, 16 October 2016; Association for Computing Machinery: New York, NY, USA, 2016; pp. 41–49. [Google Scholar] [CrossRef]
- Liu, C.; Cao, Y.; Luo, Y.; Chen, G.; Vokkarane, V.; Ma, Y. Deepfood: Deep learning-based food image recognition for computer-aided dietary assessment. In Proceedings of the International Conference on Smart Homes and Health Telematics, Wuhan, China, 25–27 May 2016; pp. 37–48. [Google Scholar]
- Liu, C.; Cao, Y.; Luo, Y.; Chen, G.; Vokkarane, V.; Yunsheng, M.; Chen, S.; Hou, P. A New Deep Learning-Based Food Recognition System for Dietary Assessment on An Edge Computing Service Infrastructure. IEEE Trans. Serv. Comput. 2018, 11, 249–261. [Google Scholar] [CrossRef]
- McAllister, P.; Zheng, H.; Bond, R.; Moorhead, A. Combining deep residual neural network features with supervised machine learning algorithms to classify diverse food image datasets. Comput. Biol. Med. 2018, 95, 217–233. [Google Scholar] [CrossRef]
- Martinel, N.; Foresti, G.L.; Micheloni, C. Wide-Slice Residual Networks for Food Recognition. In Proceedings of the 2018 IEEE Winter Conference on Applications of Computer Vision (WACV), Lake Tahoe, NV, USA, 12–15 March 2018; pp. 567–576. [Google Scholar] [CrossRef] [Green Version]
- Aguilar, E.; Remeseiro, B.; Bolaños, M.; Radeva, P. Grab, Pay, and Eat: Semantic Food Detection for Smart Restaurants. IEEE Trans. Multimed. 2018, 20, 3266–3275. [Google Scholar] [CrossRef] [Green Version]
- Horiguchi, S.; Amano, S.; Ogawa, M.; Aizawa, K. Personalized Classifier for Food Image Recognition. IEEE Trans. Multimed. 2018, 20, 2836–2848. [Google Scholar] [CrossRef] [Green Version]
- Ciocca, G.; Napoletano, P.; Schettini, R. CNN-based features for retrieval and classification of food images. Comput. Vis. Image Underst. 2018, 176–177, 70–77. [Google Scholar] [CrossRef]
- Mandal, B.; Puhan, N.B.; Verma, A. Deep Convolutional Generative Adversarial Network-Based Food Recognition Using Partially Labeled Data. IEEE Sens. Lett. 2019, 3, 7000104. [Google Scholar] [CrossRef]
- Ciocca, G.; Micali, G.; Napoletano, P. State Recognition of Food Images Using Deep Features. IEEE Access 2020, 8, 32003–32017. [Google Scholar] [CrossRef]
- Jiang, L.; Qiu, B.; Liu, X.; Huang, C.; Lin, K. DeepFood: Food Image Analysis and Dietary Assessment via Deep Model. IEEE Access 2020, 8, 47477–47489. [Google Scholar] [CrossRef]
- Liu, C.; Liang, Y.; Xue, Y.; Qian, X.; Fu, J. Food and Ingredient Joint Learning for Fine-Grained Recognition. IEEE Trans. Circuits Syst. Video Technol. 2021, 31, 2480–2493. [Google Scholar] [CrossRef]
- Liang, H.; Wen, G.; Hu, Y.; Luo, M.; Yang, P.; Xu, Y. MVANet: Multi-Tasks Guided Multi-View Attention Network for Chinese Food Recognition. IEEE Trans. Multimed. 2020, 23, 3551–3561. [Google Scholar] [CrossRef]
- Zhao, H.; Yap, K.-H.; Kot, A.C.; Duan, L. JDNet: A Joint-Learning Distilled Network for Mobile Visual Food Recognition. IEEE J. Sel. Top. Signal Process. 2020, 14, 665–675. [Google Scholar] [CrossRef]
- Won, C.S. Multi-Scale CNN for Fine-Grained Image Recognition. IEEE Access 2020, 8, 116663–116674. [Google Scholar] [CrossRef]
- Shen, Z.; Shehzad, A.; Chen, S.; Sun, H.; Liu, J. Machine Learning Based Approach on Food Recognition and Nutrition Estimation. Procedia Comput. Sci. 2020, 174, 448–453. [Google Scholar] [CrossRef]
- Zhu, F.; Bosch, M.; Khanna, N.; Boushey, C.J.; Delp, E.J. Multiple Hypotheses Image Segmentation and Classification With Application to Dietary Assessment. IEEE J. Biomed. Health Inform. 2015, 19, 377–388. [Google Scholar] [CrossRef] [Green Version]
- Aguilar-Torres, E.; Radeva, P. Food Recognition by Integrating Local and Flat Classifiers. In Proceedings of the 9th Iberian Conference, IbPRIA 2019, Madrid, Spain, 1–4 July 2019. [Google Scholar] [CrossRef]
- Merchant, K.; Pande, Y. ConvFood: A CNN-Based Food Recognition Mobile Application for Obese and Diabetic Patients. In Emerging Research in Computing, Information, Communication and Applications; Springer: Singapore, 2019. [Google Scholar] [CrossRef]
- Mezgec, S.; Eftimov, T.; Bucher, T.; Koroušić Seljak, B. Mixed deep learning and natural language processing method for fake-food image recognition and standardization to help automated dietary assessment. Public Health Nutr. 2019, 22, 1193–1202. [Google Scholar] [CrossRef] [Green Version]
- He, J.; Shao, Z.; Wright, J.; Kerr, D.; Boushey, C.; Zhu, F. Multi-task Image-Based Dietary Assessment for Food Recognition and Portion Size Estimation. In Proceedings of the 2020 IEEE Conference on Multimedia Information Processing and Retrieval (MIPR), Shenzhen, China, 9–11 April 2020; pp. 49–54. [Google Scholar] [CrossRef]
- Aguilar, E.; Nagarajan, B.; Khantun, R.; Bolaños, M.; Radeva, P. Uncertainty-Aware Data Augmentation for Food Recognition. In Proceedings of the 2020 25th International Conference on Pattern Recognition (ICPR), Milan, Italy, 10–15 January 2021; pp. 4017–4024. [Google Scholar]
- Ortega Anderez, D.; Lotfi, A.; Pourabdollah, A. A deep learning based wearable system for food and drink intake recognition. J. Ambient. Intell. Hum. Comput. 2020, 12, 9435–9447. [Google Scholar] [CrossRef]
- Song, G.; Tao, Z.; Huang, X.; Cao, G.; Liu, W.; Yang, L. Hybrid Attention-Based Prototypical Network for Unfamiliar Restaurant Food Image Few-Shot Recognition. IEEE Access 2020, 8, 14893–14900. [Google Scholar] [CrossRef]
- Xiao, L.; Lan, T.; Xu, D.; Gao, W.; Li, C. A Simplified CNNs Visual Perception Learning Network Algorithm for Foods Recognition. Comput. Electr. Eng. 2021, 2, 107152. [Google Scholar] [CrossRef]
- Deng, L.; Chen, J.; Ngo, C.W.; Sun, Q.; Tang, S.; Zhang, Y.; Chua, T.S. Mixed Dish Recognition with Contextual Relation and Domain Alignment. IEEE Trans. Multimed. 2021. [Google Scholar] [CrossRef]
- Marc, B.; Ferrà, A.; Radeva, P. Food ingredients recognition through multi-label learning. In Proceedings of the International Conference on Image Analysis and Processing, Catania, Italy, 11–15 September 2017; Springer: Cham, Switzerland, 2017. [Google Scholar]
- Wang, Y.; Chen, J.-J.; Ngo, C.-W.; Chua, Y.-S.; Zuo, W.; Ming, Z. Mixed Dish Recognition through Multi-Label Learning. In Proceedings of the 11th Workshop on Multimedia for Cooking and Eating Activities (CEA’19), Ottawa, ON, Canada, 10 June 2019; Association for Computing Machinery: New York, NY, USA, 2019; pp. 1–8. [Google Scholar] [CrossRef]
- Salvador, A.; Drozdzal, M.; Giro-i-Nieto, X.; Romero, A. Inverse cooking: Recipe generation from food images. In Proceedings of the IEEE/CVF Conference on Computer Vision and Pattern Recognition, Long Beach, CA, USA, 15–20 June 2019. [Google Scholar] [CrossRef]
- Chen, J.; Pan, L.; Wei, Z.; Wang, X.; Ngo, C.-W.; Chua, T.-S. Zero-Shot Ingredient Recognition by Multi-Relational Graph Convolutional Network. In Proceedings of the AAAI Conference on Artificial Intelligence 2020, New York, NY, USA, 7–12 February 2020; Volume 34, pp. 10542–10550. [Google Scholar] [CrossRef]
- Chen, J.; Zhu, B.; Ngo, C.-W.; Chua, T.-S.; Jiang, Y.-G. A Study of Multi-Task and Region-Wise Deep Learning for Food Ingredient Recognition. IEEE Trans. Image Process. 2021, 30, 1514–1526. [Google Scholar] [CrossRef]
- Pettitt, C.; Liu, J.; Kwasnicki, R.; Yang, G.; Preston, T.; Frost, G. A pilot study to determine whether using a lightweight, wearable micro-camera improves dietary assessment accuracy and offers information on macronutrients and eating rate. Br. J. Nutr. 2016, 115, 160–167. [Google Scholar] [CrossRef] [PubMed] [Green Version]
- Comber, R.; Weeden, J.; Hoare, J.; Lindsay, S.; Teal, G.; Macdonald, A.; Methven, L.; Moynihan, P.; Olivier, P. Supporting visual assessment of food and nutrient intake in a clinical care setting. In Proceedings of the Conference on Human Factors in Computing Systems, Austin, TX, USA, 5–10 May 2012; pp. 919–922. [Google Scholar] [CrossRef] [Green Version]
- Yang, Z.; Yu, H.; Cao, S.; Xu, Q.; Yuan, D.; Zhang, H.; Jia, W.; Mao, Z.-H.; Sun, M. Human-Mimetic Estimation of Food Volume from a Single-View RGB Image Using an AI System. Electronics 2021, 10, 1556. [Google Scholar] [CrossRef] [PubMed]
- Graikos, A.; Charisis, V.; Iakovakis, D.; Hadjidimitriou, S.; Hadjileontiadis, L. Single Image-Based Food Volume Estimation Using Monocular Depth-Prediction Networks. In Universal Access in Human-Computer Interaction. Applications and Practice. HCII 2020; Lecture Notes in Computer Science; Springer: Cham, Switzerland, 2020; Volume 12189. [Google Scholar] [CrossRef]
- Lo, F.P.; Sun, Y.; Qiu, J.; Lo, B.P.L. Point2Volume: A Vision-Based Dietary Assessment Approach Using View Synthesis. IEEE Trans. Ind. Inform. 2020, 16, 577–586. [Google Scholar] [CrossRef]
- Zhu, F.; Bosch, M.; Boushey, C.; Delp, E. An image analysis system for dietary assessment and evaluation. Proc./ICIP Int. Conf. Image Process. 2010, 185, 1853–1856. [Google Scholar] [CrossRef] [Green Version]
- Trevño, R.; Ravelo, A.; Birkenfeld, E.; Murad, M.; Diaz, J. Food Weight Estimation: A Comparative Analysis of Digital Food Imaging Analysis and 24-Hour Dietary Recall. J. Nutr. Educ. Behav. 2015, 47, S105. [Google Scholar] [CrossRef]
- Jia, W.; Chen, H.C.; Yue, Y.; Li, Z.; Fernstrom, J.; Bai, Y.; Li, C.; Sun, M. Accuracy of food portion size estimation from digital pictures acquired by a chest-worn camera. Public Health Nutr. 2014, 17, 1671–1681. [Google Scholar] [CrossRef] [PubMed] [Green Version]
- Rhyner, D.; Loher, H.; Dehais, J.; Anthimopoulos, M.; Shevchik, S.; Botwey, R.H.; Duke, D.; Stettler, C.; Diem, P.; Mougiakakou, S. Carbohydrate Estimation by a Mobile Phone-Based System Versus Self-Estimations of Individuals With Type 1 Diabetes Mellitus: A Comparative Study. J. Med. Internet Res. 2016, 18, e101. [Google Scholar] [CrossRef] [Green Version]
- Makhsous, S.; Mohammad, H.M.; Schenk, J.M.; Mamishev, A.V.; Kristal, A.R. A Novel Mobile Structured Light System in Food 3D Reconstruction and Volume Estimation. Sensors 2019, 19, 564. [Google Scholar] [CrossRef] [Green Version]
- Yuan, D.; Hu, X.; Zhang, H.; Jia, W.; Mao, Z.; Sun, M. An automatic electronic instrument for accurate measurements of food volume and density. Public Health Nutr. 2021, 24, 1248–1255. [Google Scholar] [CrossRef] [PubMed]
- Rollo, M.E.; Bucher, T.; Smith, S.P.; Collins, C.E. ServAR: An augmented reality tool to guide the serving of food. Int. J. Behav. Nutr. Phys. Act. 2017, 14, 65. [Google Scholar] [CrossRef]
- Dehais, J.; Anthimopoulos, M.; Shevchik, S.; Mougiakakou, S. Two-View 3D Reconstruction for Food Volume Estimation. IEEE Trans. Multimed. 2017, 19, 1090–1099. [Google Scholar] [CrossRef] [Green Version]
- Aizawa, K.; Maruyama, Y.; Li, H.; Morikawa, C. Food Balance Estimation by Using Personal Dietary Tendencies in a Multimedia Food Log. IEEE Trans. Multimed. 2013, 15, 2176–2185. [Google Scholar] [CrossRef]
- Ravì, D.; Lo, B.; Yang, G. Real-time food intake classification and energy expenditure estimation on a mobile device. In Proceedings of the 2015 IEEE 12th International Conference on Wearable and Implantable Body Sensor Networks (BSN), Cambridge, MA, USA, 9–12 June 2015; pp. 1–6. [Google Scholar] [CrossRef] [Green Version]
- Jiang, H.; Starkman, J.; Liu, M.; Huang, M. Food Nutrition Visualization on Google Glass: Design Tradeoff and Field Evaluation. IEEE Consum. Electron. Mag. 2018, 7, 21–31. [Google Scholar] [CrossRef]
- Probst, Y.; Nguyen, D.T.; Tran, M.K.; Li, W. Dietary Assessment on a Mobile Phone Using Image Processing and Pattern Recognition Techniques: Algorithm Design and System Prototyping. Nutrients 2015, 7, 6128–6138. [Google Scholar] [CrossRef]
- Mezgec, S.; Koroušić Seljak, B. Nutrinet: A deep learning food and drink image recognition system for dietary assessment. Nutrients 2017, 9, 657. [Google Scholar] [CrossRef] [PubMed]
- Pouladzadeh, P.; Shirmohammadi, S. Mobile Multi-Food Recognition Using Deep Learning. ACM Trans. Multimed. Comput. Commun. Appl. 2017, 13, 36. [Google Scholar] [CrossRef]
- Waltner, G.; Schwarz, M.; Ladstätter, S.; Weber, A.; Luley, P.; Bischof, H.; Lindschinger, M.; Schmid, I.; Paletta, L. MANGO—Mobile Augmented Reality with Functional Eating Guidance and Food Awareness. In Proceedings of the New Trends in Image Analysis and Processing—ICIAP 2015 Workshops, Genoa, Italy, 7–8 September 2015; pp. 425–432. [Google Scholar] [CrossRef]
- Sun, J.; Radecka, K.; Zilic, Z. FoodTracker: A Real-time Food Detection Mobile Application byDeep Convolutional Neural Networks. arXiv 2019, arXiv:1909.05994. [Google Scholar]
- Jia, W.; Li, Y.; Qu, R.; Baranowski, T.; Burke, L.E.; Zhang, H.; Bai, Y.; Mancino, J.M.; Xu, G.; Mao, Z.H.; et al. Automatic food detection in egocentric images using artificial intelligence technology. Public Health Nutr. 2018, 22, 1168–1179. [Google Scholar] [CrossRef]
- Chen, G.; Jia, W.; Zhao, Y.; Mao, Z.H.; Lo, B.; Anderson, A.K.; Frost, G.; Jobarteh, M.L.; McCrory, M.A.; Sazonov, E.; et al. Food/Non-Food Classification of Real-Life Egocentric Images in Low- and Middle-Income Countries Based on Image Tagging Features. Front. Artif. Intell. 2021, 4, 644712. [Google Scholar] [CrossRef]
- Mejova, Y.; Abbar, S.; Haddadi, H. Fetishizing Food in Digital Age: Foodporn Around the World. arXiv 2016, arXiv:1603.00229. [Google Scholar]
- Ismail, A.; Idris, M.Y.I.; Ayub, M.N.; Por, L.Y. Investigation of Fusion Features for Apple Classification in Smart Manufacturing. Symmetry 2019, 11, 1194. [Google Scholar] [CrossRef] [Green Version]
- Chen, T.; Kornblith, S.; Norouzi, M.; Hinton, G. A Simple Framework for Contrastive Learning of Visual Representations. In Proceedings of the 37th International Conference on Machine, Learning, PMLR, Vienna, Austria, 13–18 July 2020; Volume 110, pp. 1597–1607. [Google Scholar]
- Caron, M.; Misra, I.; Mairal, J.; Goyal, P.; Bojanowski, P.; Joulin, A. Unsupervised Learning of Visual Features by Contrasting Cluster Assignments. arXiv 2020, arXiv:2006.09882. [Google Scholar]
- Strumbelj, E.; Kononenko, I. Explaining prediction models and individual predictions with feature contributions. Knowl. Inf. Syst. 2014, 41, 647–665. [Google Scholar] [CrossRef]
- Arik, S.; Liu, Y.-H. Explaining Deep Neural Networks using Unsupervised Clustering. arXiv 2020, arXiv:2007.07477. [Google Scholar]
- Subhi, M.A.; Ali, S.H.; Mohammed, M.A. Vision-based approaches for automatic food recognition and dietary assessment: A survey. IEEE Access 2019, 7, 35370–35381. [Google Scholar] [CrossRef]
- Min, W.; Jiang, S.; Liu, L.; Rui, Y.; Jain, R. A Survey on Food Computing. ACM Comput. Surv. 2019, 52, 92. [Google Scholar] [CrossRef] [Green Version]


| Authors | Year | Dataset | Food Category | Total # Images/Class | Image Source |
|---|---|---|---|---|---|
| S. Godwin et al. [56] | 2006 | Wedge Shape foods dataset | American Foods | 3 categories | Controlled environment |
| Chen et al. [44] | 2009 | PFID | American Fast Foods | 1038(61) | Fast food data captured in multiple restaurants |
| Mariappan et al. [57] | 2009 | TADA | Artificial And Generic Food | 256(11) | Controlled environment |
| Yanai et al. [49] | 2010 | Food-50 | Japanese Foods | 5000(50) | Crawled from web |
| Hoashi et al. [49] | 2010 | Food-85 | Japanese Foods | 8500(85) | Existing food databases |
| Miyazaki et al. [29] | 2011 | Foodlog | Japanese Foods | 6512(2000) | Captured by users |
| Marc Bosch et al. [58] | 2011 | FNDDS | American Foods | 7000 | Images of food accquired by users |
| Matsuda et al. [42] | 2012 | UECFOOD-100 | Japanese Foods | 14,361(100) | Captured by mobile camera |
| Chen et al. [48] | 2012 | ChineseFoodNet | Chinese dishes. | 192,000(208) | Gathered from web |
| M.-Y. Chen et al. [48] | 2012 | Chen | Chinese Foods | 5000/50 | Crawled from the Internet |
| Bossard et al. [59] | 2014 | Food-101 | American Foods | 101,000(101) | Crawled from web |
| L. Bossard et al. [59] | 2014 | ETHZ Food-101 | American Foods | 100,000(101) | Crawled from web |
| Kawano et al. [43] | 2014 | UECFOOD-256 | Japanese Foods | 25,088(256) | Captured by mobile camera |
| T. Stutz et al. [60] | 2014 | Rice dataset | Generic (Rice) | 1 food type | Acquired from user |
| Farinella et al. [46] | 2014 | UNCIT-FD889 | Italian Foods | 3583 (899) | Acquired with a smartphone |
| Meyers et al. [13] | 2015 | FOOD201-Segmented | American Foods | 12625 | Manually annotated dataset |
| Xin Wang et al. [61] | 2015 | UPMC Food-101 | Generic | 100,000(101) | Crawled from web |
| Cioccoa et al. [50] | 2015 | UNIMB 2015 | Generic | 2000(15) | Using a Samsung Galaxy S3 smartphone |
| Shaobo Fang et al. [62] | 2015 | TADA(19 foods) | American Foods | 19 categories | Controlled environment |
| Xu et al. [63] | 2015 | Dishes | Chinese Restaurant Foods | 117,504(3832) | Download from dianping |
| Beijbom et al. [64] | 2015 | Menu-Match | Generic Restaurant Food | 646(41) | Captured from social media |
| Zhou et al. [65] | 2016 | Food-975 | Chinese Foods | 37,785(975) | Collected from restaurants |
| J. chen et al. [47] | 2016 | Vireo-Food 172 | Chinese Foods | 110,241(172) | Downloaded from web |
| Cioccoa et al. [66] | 2016 | UNIMB 2016 | Italian Foods | 1027(73) | Captured from dining tables |
| Hui Wu et al. [67] | 2016 | Food500 | Generic | 148,408(508) | Crawled from web |
| Singla et al. [68] | 2016 | Food-11 | Generic | 16,643(11) | Other food datasets |
| Farinella et al. [45] | 2016 | UNCIT-FD1200 | Generic | 4754(1200) | Acquired using smartphone |
| Jaclyn Rich et al. [69] | 2016 | Instagram 800k | Generic | 808,964(43) | Social Media |
| Liang et al. [70] | 2017 | ECUSTFD | Generic | 2978(19) | Acquired using smartphone |
| Güngör et al. [51] | 2017 | Turkish-Foods-15 | Turkish Dishes | 7500/15 | Collected from other datasets |
| Pandey et al. [71] | 2017 | Indian Food Database | Indian Foods | 5000(50) | Downloaded from web |
| Termritthikun et al. [72] | 2017 | THFood-50 | Thai Foods | 700/50 | Downloaded from web |
| Ciocca et al. [73] | 2017 | FOOD524DB | Generic | 247,636(524) | Existing food database |
| Hou et al. [53] | 2017 | VegFru | Generic (Fruit and VEG) | 160,731(292) | Collected from search engine |
| Waltner et al. [55] | 2017 | FruitVeg-81 | Generic (Fruit and VEG) | 15,630(81) | Collected using mobile phone |
| Muresan et al. [54] | 2018 | Generic (Fruits 360 Dataset) | Fruit Dataset | 71,125(103) | Camera |
| Qing Yu et al. [74] | 2018 | FLD-469 | Japanese Foods | 209,700(469) | Smart Phone camera |
| Kaur et al. [75] | 2019 | FoodX-251 | Generic | 158,000(251) | Collected from web |
| Ghalib et al. [52] | 2020 | Pakistani Food Dataset | Pakistani Dishes | 4928(100) | Crawled from web |
| Narayanan et al. [76] | AI-Crowd | Swiss Foods | 25,389 | Volunteer Users | |
| Bolaños M. et al. [77] | 2016 | EgocentricFood | Generic | 5038(9) | Taken by a wearable egocentric vision camera |
| E. Aguilar et al. [78] | 2019 | MAFood-121 | Spanish Foods | 21,175 | Google search engine |
| Reference | Year | Visual Features | Dataset | Recognition Type |
|---|---|---|---|---|
| Hoashi et al. [49] | 2010 | Bag-of-features (BoF), Color histogram, Gabor features, and gradient histogram with Multiple Kernel learning. | Used for recognition of 85 food categories | Automatic food recognition |
| Yang et al. [80] | 2010 | Deals with pair wise statistics between local features | Pittsburgh Food Image Dataset (PFID) | Food recognition |
| kong and Tan [86] | 2011 | SIFT, Guassian Region detector | Pittsburgh Food Image Dataset (PFID) and dataset consisting of food images collected from local restaurants. | Regular shaped foods recognition |
| Bosh et al. [85] | 2011 | Global feature classes: texture and color Local features: local entropy color, local color, Garbor filter, SIFT, Haar, Daisy descriptor, Steerable filters and Tamura perceptual filter | Database consisting of food images collected under controlled conditions, from nutritional studies conducted at Prudue University [58] | Food recognition and quantification |
| Zhang et al. [87] | 2011 | Color, SIFT, Shape, RGB histograms | Dataset came from online sources, which includes three types of cuisines, two dishes per cuisines were represented by 76 images | Classification of cuisines |
| Matsuda et al. [88] | 2012 | Gabor texture features, Histogram of Oriented Gradient (HoG), Bag-of-features of SIFT and CSFIT with Spatial pyramid. | Food image dataset containing 100 different food categories. | Multiple food images recognition |
| Kawano and Yanai [82] | 2013 | Bag-of-features and color histogram, HOG patch descriptor and color patch descriptor. | - | Mobile food recognition |
| Anthimopoulos et al. [89] | 2014 | Bag-of-features, SIFT and HSV color space | Visual dataset consisting of 5000 food images organized into 11 different classes | Food recognition system for diabetic patients |
| Tammachat and Pantuwong [90] | 2014 | Bag-of-features (BoF), Texture and Color | Database consisting of 40 types of Thai food consisting of 100 images of each food type. | Food image recognition |
| Pouladzadeh et al. [91] | 2014 | Graph cut, Color and Texture | Dataset consisting of 15 different categories of fruits and food. | Food image recognition for calorie estimation |
| He et al. [92] | 2014 | Color, Texture, Dominant Color Descriptor (DCD), Scalable Color Descriptor (SCD), SIFT, Multi-scale Dense SIFT (MDSIFT), Entropy-Based Categorization and Fractal Dimension Estimation (EFD) and Gabor-Based Image Decomposition and Fractal Dimension Estimation (GFD) | Food image dataset containing 1453 images | Food image analysis |
| Kawano and Yanai [43] | 2014 | Color, HoG and Fisher Vector | UECFOOD-256 food image dataset | Real-time food image recognition |
| Oliveira et al. [83] | 2014 | Color, Texture | Images were gathered using mobile’s camera | Mobile Food Recognition |
| Pouladzadeh et al. [81] | 2015 | Color, Texture, Size, Shape, Gabor filter | System was tested on single food portions consisting of fruits and single piece of food. 100 images were chosen for training and 100 for testing purposes. | Cloud-based food recognition. |
| Farinella et al. [45] | 2016 | SIFT, Bag of Textons, PRICoLBP | UNICT-FD1200 dataset. | Food image recognition |
| Reference | Year | Features | Dataset | Recognition Type |
|---|---|---|---|---|
| Kawano and Yanai, [102] | 2014 | Fisher Vector and DCNN | UECFOOD-100 and 100-class food Dataset | Food image recognition |
| Yanai and Kawano, [96] | 2015 | DCNN | UECFOOD-100 and UECFOOD- 256 | Food image recognition |
| Christodoulidis et al. [103] | 2015 | CNN | Manually annotated dataset with 573 food items | Food recognition |
| Pouladzadeh et al. [104] | 2016 | Graphcut and DCNN | Database consisting of 10,000 high res images | Food recognition for calorie measurement |
| Hassannejad et al. [105] | 2016 | Inception | Food-101, UECFOOD-100 and UECFOOD-256 | Food image recognition |
| Liu et al. [106] | 2016 | DCNN | Food-101, UECFOOD-256 | Mobile food image recognition |
| Chen and Ngo, [47] | 2016 | Arch-D | Chinese Foods | Ingredient recognition and food categorization |
| Ciocca et al. [66] | 2017 | VGG | UNIMIB 2016 | Food recognition |
| Termritthikun et al. [72] | 2017 | NU-InNet | THFOOD-50 | Food recognition |
| Pandey et al. [71] | 2017 | AlexNet, GoogLeNet and ResNet | ETH Food-101 and Indian Food Image Database | Food Recognition |
| Liu et al. [107] | 2018 | GoogleNet | UECFOOD-100, UECFOOD-256 and Food-101 | Food recognition for dietary assessment |
| McAllister et al. [108] | 2018 | ResNet-152, GoogLeNet | Food 5k, Food-11, RawFooT-DB and Food-101 | Food recognition |
| Martinel et al. [109] | 2018 | WISeR | UECFOOD-100, UECFOOD-256 and Food-101 | Food recognition |
| E. Aguilar et al. [110] | 2018 | AlexNet | UNIMIB2016 | Automatic food tray analysis |
| S. Horiguchi et al. [111] | 2018 | GoogleNet | Built their own food dataset FoodLog | Food image recognition |
| Gianluigi Ciocca et al. [112] | 2018 | ResNet50 | Food 475 | Food image recognition and classification |
| B. Mandal et al. [113] | 2019 | SSGAN | ETH Food-101 and Indian Food Dataset | Food Recognition of Partially Labeled Data |
| G.Ciocca et al. [114] | 2020 | GoogleNet, Inception-v3, MobileNet-V2 and ResNet-50 | Own dataset containing 20 different food categories of fruit and vegetables. | Food category recognition, Food state recognition |
| L. Jiang et al. [115] | 2020 | VGGNet | UECFOOD-100, UECFOOD-256 and introduced new dataset based on FOOD-101. | Food recognition and dietary assesment |
| C. Liu et al. [116] | 2020 | VGGNet, ResNet | Vireo-Food 172 | Food ingredient recognition |
| H. Liang et al. [117] | 2020 | ChineseFoodNet and Vireo-Food 172 | Chinese food recognition | |
| H. Zhao et al. [118] | 2020 | VGGNet, ResNet and DenseNet | UECFOOD-256 and Food-101 | Mobile food recognition |
| G. A. Tahir and C. K. Loo [52] | 2020 | ResNet-50, DenseNet201 and InceptionResNet-V2 | Pakistani Food Dataset, UECFOOD-100, UECFOOD-256, FOOD-101 and PFID | Food recognition |
| C. S. Won [119] | 2020 | ResNet50 | UECFOOD-256, Food-101 and Vireo-Food 172 | Fine grained Food image recognition |
| Zhidong Shen et al. [120] | 2020 | Inception-v3, Inception-v4 | Dataset was created including hundreds and thousands of images of several food categories | Food recognition and nutrition estimation |
| Reference | Year | Classification Technique | Classification Accuracy | |
|---|---|---|---|---|
| Top 1 | Top 5 | |||
| Hoashi et al. [49] | 2010 | Multiple Kernel Learning (MKL) | Own Food Dataset = 62.5% | N/A |
| Yang et al. [80] | 2010 | Support Vector Machine (SVM) | PFID = 78.0% | N/A |
| Kong and Tan [86] | 2011 | Multi-class SVM | PFID = 84% | N/A |
| Bosh et al. [85] | 2011 | Support Vector Machine (SVM) | Dataset collected = 86.1% using nutritional studies Conducted at Prudue University | N/A |
| Zhang et al. [87] | 2011 | SVM regression with RBF kernel | Own Food Dataset = 82.9% | N/A |
| Matsuda et al. [88] | 2012 | Multiple Kernel Learning (MKL) and Support Vector Machine (SVM) | Own food Dataset = 55.8% | N/A |
| Kawano and Yanai [82] | 2013 | Linear SVM and fast tookernel | N/A | 81.6% |
| Anthimopoulos et al. [89] | 2014 | Linear SVM | Own Food Dataset = 78.0% | N/A |
| Tammachat and Pantuwong [90] | 2014 | Support Vector Machine (SVM) | Own Food Dataset = 70.0% | N/A |
| Pouladzadeh et al. [91] | 2014 | Support Vector Machine (SVM) | Own Food Dataset = 95% | N/A |
| He et al. [92] | 2014 | K-nearest Neighbors and Vocabulary Trees | Own Food Dataset = 64.5% | N/A |
| Kawano and Yanai [43] | 2014 | One-vs-rest | UECFOOD-256 = 50.1% | UECFOOD-256 = 74.4% |
| Oliveira et al. [83] | 2014 | Support Vector Machine (SVM) | Own Food Dataset Top 3 classification achieved between 84 and 100% | N/A |
| Pouladzadeh et al. [81] | 2015 | Cloud-based Support Vector Machine | Own Food Dataset = 94.5% | N/A |
| Farinella et al. [45] | 2016 | Support Vector Machine (SVM) | UNICT-FD1200 = 75.74% | UNICT-FD1200 = 85.68% |
| Reference | Year | Classification Technique | Classification Performance | |
|---|---|---|---|---|
| Top 1 | Top 5 | |||
| Yanai and Kawano [96] | 2015 | DCNN | UECFOOD-100 = 78.8% UECFOOD-256 = 67.6% | N/A |
| Christodoulidis et al. [103] | 2015 | DCNN | Own dataset = 84.9% | N/A |
| Chen and Ngo [47] | 2016 | DCNN | ||
| Pouladzadeh et al. [104] | 2016 | DCNN + Graph cut | Own dataset = 99% | N/A |
| Hassannejad et al. [105] | 2016 | DCNN | ETH Food-101 = 88.3% UECFOOD-100 = 81.5% UECFOOD-256 = 76.2% | ETH Food-101 = 96.9% UECFOOD-100 = 97.3% UECFOOD-256 = 92.6% |
| Liu et al. [106] | 2016 | CNN | UECFOOD-100 = 76.3% Food-101 = 77.4% | UECFOOD-100 = 94.6% Food-101 = 93.7% |
| Pandey et al. [71] | 2017 | Ensemble Net | ETH-Food101 = 72.1% Indian Food = 73.5% Database | ETH-Food101 = 91.6% Indian Food = 94.4% Database |
| Ciocca et al. [66] | 2017 | CNN | UNIMIB 2016 = 78.3% | N/A |
| Termritthikun et al. [72] | 2017 | CNN | THFOOD-50 = 69.8% | THFOOD-50 = 92.3% |
| McAllister et al. [108] | 2018 | CNN+ANN+SVM+ Random Forest | Food-5K = 99.4% Food-11 = 91.3% RawFooT-DB = 99.3% Food-101 = 65.0% | N/A |
| Liu et al. [107] | 2018 | DCNN | UECFOOD-256 = 54.5% UECFOOD-100 = 77.5% Food 101 = 77.0% | UECFOOD-256 = 81.8% UECFOOD-100 = 95.2% Food 101 = 94.0% |
| Martinel et al. [109] | 2018 | DNN | UECFOOD-100 = 89.6% UECFOOD-256 = 83.2% Food-101 = 90.3% | UECFOOD-100 = 99.2% UECFOOD-256 = 95.5% Food-101 = 98.7% |
| E. Aguilar et al. [110] | 2018 | CNN+SVM | UNIMIB 2016 = 90.0% | N/A |
| Gianluigi Ciocca et al. [112] | 2018 | CNN | Food-475 = 81.6% | Food-475 = 95.5% |
| S. Horiguchi et al. [111] | 2018 | Sequential Personalized Classifier (SPC) with fixed-class and incremental classification | FoodLog = 40.2% (t251-t300) | FoodLog = 56.6% (t251-t300) |
| B. Mandal et al. [113] | 2019 | Generative Adversarial Network | ETH Food-101 = 75.3% IndianFood Database = 85.3% | ETH Food-101 = 93.3% Indian Food Database = 95.6% |
| Aguilar-Torres et al. [122] | 2019 | CNN based on ResNet-50 | MAFood-121 = 81.62% | N/A |
| Kaiz Merchant and Yash Pande [123] | 2019 | Inception V3 | ETHZ Food-101 = 70.0% | N/A |
| Mezgec, S. et al. [124] | 2019 | Deep Learning | Own Food dataset = 93% | N/A |
| L. Jiang et al. [115] | 2020 | DCNN (Faster R-CNN) | FOOD20-with-bbx = 71.7% | FOOD20-with-bbx = 93.1% |
| C. Liu et al., 2020 [116] | ||||
| H. Zhao et al. [118] | 2020 | JDNet | UECFOOD-256 = 84.0% FOOD-101 = 91.2% | UECFOOD-256 = 96.2% FOOD-101 = 98.8% |
| G. A. Tahir and C. K. Loo [52] | 2020 | Adaptive Reduced Class Incremental Kernel Extreme Learning Machine (ARCIKELM) | Food-101 = 87.3% UECFOOD-100 = 88.7% UECFOOD-256= 76.51% PFID = 100% Pakistani Food = 74.8% | N/A |
| C. S. Won [119] | 2020 | Three-scale CNN | UECFOOD-256 = 74.1% Food 101 = 88.8% Vireo-Food 172 = 91.3% | UECFOOD-256 = 93.2% Food-101 = 98.1% Vireo-Food 172 = 98.9% |
| Zhidong Shen et al. [120] | 2020 | CNN | Own dataset = 85.0% | N/A |
| Jiangpeng He et al. [125] | 2020 | 18 layer ResNet | Own dataset = 88.67% | N/A |
| Eduardo Aguilar et al. [126] | 2020 | CNN | Own dataset = 88.67% | N/A |
| Dario Ortega Anderez et al. [127] | 2020 | CNN | Own dataset = 97.10% | N/A |
| G. Song et al. [128] | 2020 | CNN | Web crawled dataset = 56.47% | Web crawled dataset = 60.33 |
| Limei Xiao et al. [129] | 2021 | CNN | Own dataset = 97.42% | N/A |
| Lixi Deng et al. [130] | 2021 | ResNet-50 | School lunch dataset = 95.3% | N/A |
| Reference | Year | Dataset | Method | Recall | Precision | F1 |
|---|---|---|---|---|---|---|
| Chen et al. [47] | 2016 | Vireo-Food 172 | Arch-D (Multi-task) | - | - | 67.17% (Micro-F1) 47.18% (Macro-F1) |
| UECFOOD-100 | Arch-D (Multi-task) | - | - | 82.06% (Micro-F1) 95.88% (Macro-F1) | ||
| Bolaños et al. [131] | 2017 | Food-101 | ResNet50+ Ingredients 101 | 73.45% | 88.11% | 80.11% |
| Recipe 5k | ResNet50+ Recipe 5k | 19.57% | 38.93% | 26.05% | ||
| Recipe 5k | Inception-v3+ Recipe 5k (Simplified) | 42.77% | 53.43% | 47.51% | ||
| Wang, Yunan, et al. [132] | 2019 | Economic Rice | Inception-V4 + NS (multi-scale) | 71.90% | 72.10% | 71.40% |
| Economic Behoon | Inception-V4 + NS (multi-scale) | 77.60% | 68.50% | 69.70% | ||
| Salvador, Amaia, et al. [133] | 2019 | Recipe 1M | CNN Auto-Encoder | 75.47% | 77.13% | 48.61% |
| J. Chen et al. [135] | 2021 | VireoFood-172 | DCNN | - | - | 75.77% (Micro-F1) |
| Reference | Year | Dataset | Results (E: Error%) | Technique |
|---|---|---|---|---|
| S. Fang [62] | 2015 | 19 food items | E: <6% | 3D parameters and reference objects to compute density for estimating the weight of food item |
| Y. He [36] | 2013 | 1453 food images | E: 11% (beverages) 63% | “Integrated image segmentation and identification system” |
| T. Miyazaki [29] | 2011 | 6512 images | E: 40% | Linear estimation |
| Beijbom, O [64] | 2015 | 646 images, with 1386 tagged food items across 41 categories | E: 232 ± 7.2 | Restaurant-specific food recognition considers meal as a whole entry with all of its nutrients details in DB to solve the volume estimation problem for the restaurant scenario. |
| Koichi Okamoto [31] | 2016 | 20 kinds of Japanese Foods (60 test image) | E: 21.30% | Single-image-based food calorie estimation system which uses reference objects to determine food region and quadratic curve estimation from the 2D size of foods to their calories |
| Pettitt, C [136] | 2016 | Test data from N:6 participants who completed food diary during pilot sudy by wear micro camera | E: 34% | Wearable micro camera in conjunction with food dairies |
| Akpa Akpro Hippocrate [34] | 2016 | 119 food images | E: 6.87% | Image processing with cutlery |
| Jia, W. Y [35] | 2012 | 224 pictures | E: <10% | 3D location of a circular feature from a 2D image |
| Yang, Y. Q [33] | 2011 | 72 images | E: −3.55% | Single digital image, plate reference |
| Huang, J [39] | 2015 | fruits (n:6) | imaging processing | |
| Yue, Y [41] | 2012 | 6 food replicas | E: Length (−1.18) | A mathematical model based system involves a camera, circular object in a 3D space to compute food volume. |
| Zhang, W [38] | 2015 | 15 different kinds of foods | 85% | Portion estimation by counting pixels |
| Rob Comber [137] | 2016 | 6 different meals | “Beef (E: −13.89 g, : 5.10 g), scrambled egg (E: −9.11 g, : 8.29 g), Jam sponge (E: −12.31 g, : 7.03 g) and fish pie (E: −12.59 g, : 5.74 g). Mean: −9.58” | Visual Assessment |
| S. Fang [30] | 2016 | 10 objects | “3D geometric models and depth images.” | |
| Godwin, S. [56] | 2006 | Five portions of 9-inch cake, Seven portions of pizza, Pies were 9 or 10 inches | E: 25% | Estimated portion sizes using a ruler and the adjustable wedge |
| Hernández, Teresita [37] | 2006 | 101 subjects, 5 foods | E: 4.8% ± 1.8% | Digital photographs printed onto a poster. |
| Yang et al. [138] | 2021 | Virtual Food Dataset and Real Food Dataset (RFD) (1500 images) | E: <9% on VFD, E: 11.6% and 20.1% on RFD. | Estimates volume by computing inner product between the probability vector from modified MobileNetV2 and the reference volume vector. |
| Graikos et al. [139] | 2021 | EPIC-KITCHENS and their own food video datasets | 46.32% average MAPE on 16 test foods and 36.90% average MAPE on 6 combined meals. | Generate 3-dimensional point cloud by using depth map, segmentation mask and camera parameters. It then approximates the volume with points cloud-to-volume algorithm. |
| Lo, F.P.W et al. [140] | 2019 | Test dataset: 11 food items | E: 15.32%. | 3D point cloud completion from RGB and depth images. |
| Reference | Year | Dataset | Results (E: Error%) | Technique |
|---|---|---|---|---|
| F. Zhu [141] | 2010 | 3000 images | E: 1% 19 food items (97.2%) | “Camera calibration step and a 3D volume reconstruction step” |
| Xu Chang [141] | 2013 | 14 to 20 images for multi-view method | E: 7.4% to 57.3% | Multi-view volume estimation using “Shape from Silhouettes” to estimate the food portion size |
| Kong, Fanyu [12] | 2015 | 6 food items | 84–91% | Multi-View RGB images for 3D reconstruction to estimate the volume |
| Trevno, Roberto [142] | 2015 | 120 students (n = 120 meals; 57 breakfast + 63 lunch) | 74% (reliability) | Digital Food Imaging Analysis (DFIA) |
| Jia, W. Y [143] | 2014 | 100 food samples | E: −2.80% 30% | ebutton is used for taking pictures, and then portion size is calculated semi-automatically by using computer software |
| Xu, C [36] | 2013 | E: 10% | 3D MODELLING AND POSE ESTIMATION | |
| Rhyner, D [144] | 2016 | 6 meals | 85.10% | Multi-View RGB images, reference card and 3D model for volume estimation |
| T. Stutz [60] | 2014 | Rice, blinded servings | E: <33% | Mobile Augmented Reality System |
| Makhsous et al. [145] | 2020 | 8 food items tested | 40% improvement in the accuracy of volume estimation as compared to manual calculation. | Employs a mobile Structured Light System (SLS) to measure the food volume and portion size of a dietary intake. |
| Yuan et al. [146] | 2021 | Test dataset: 6 food items | E: 0.83 5.23%. | 3D reconstruction from multi-view RGB images. |
| Lo, F.P.W et al. [140] | 2019 | Test dataset: 11 food items | E: 15.32%. | 3D point cloud completion from RGB and depth images. |
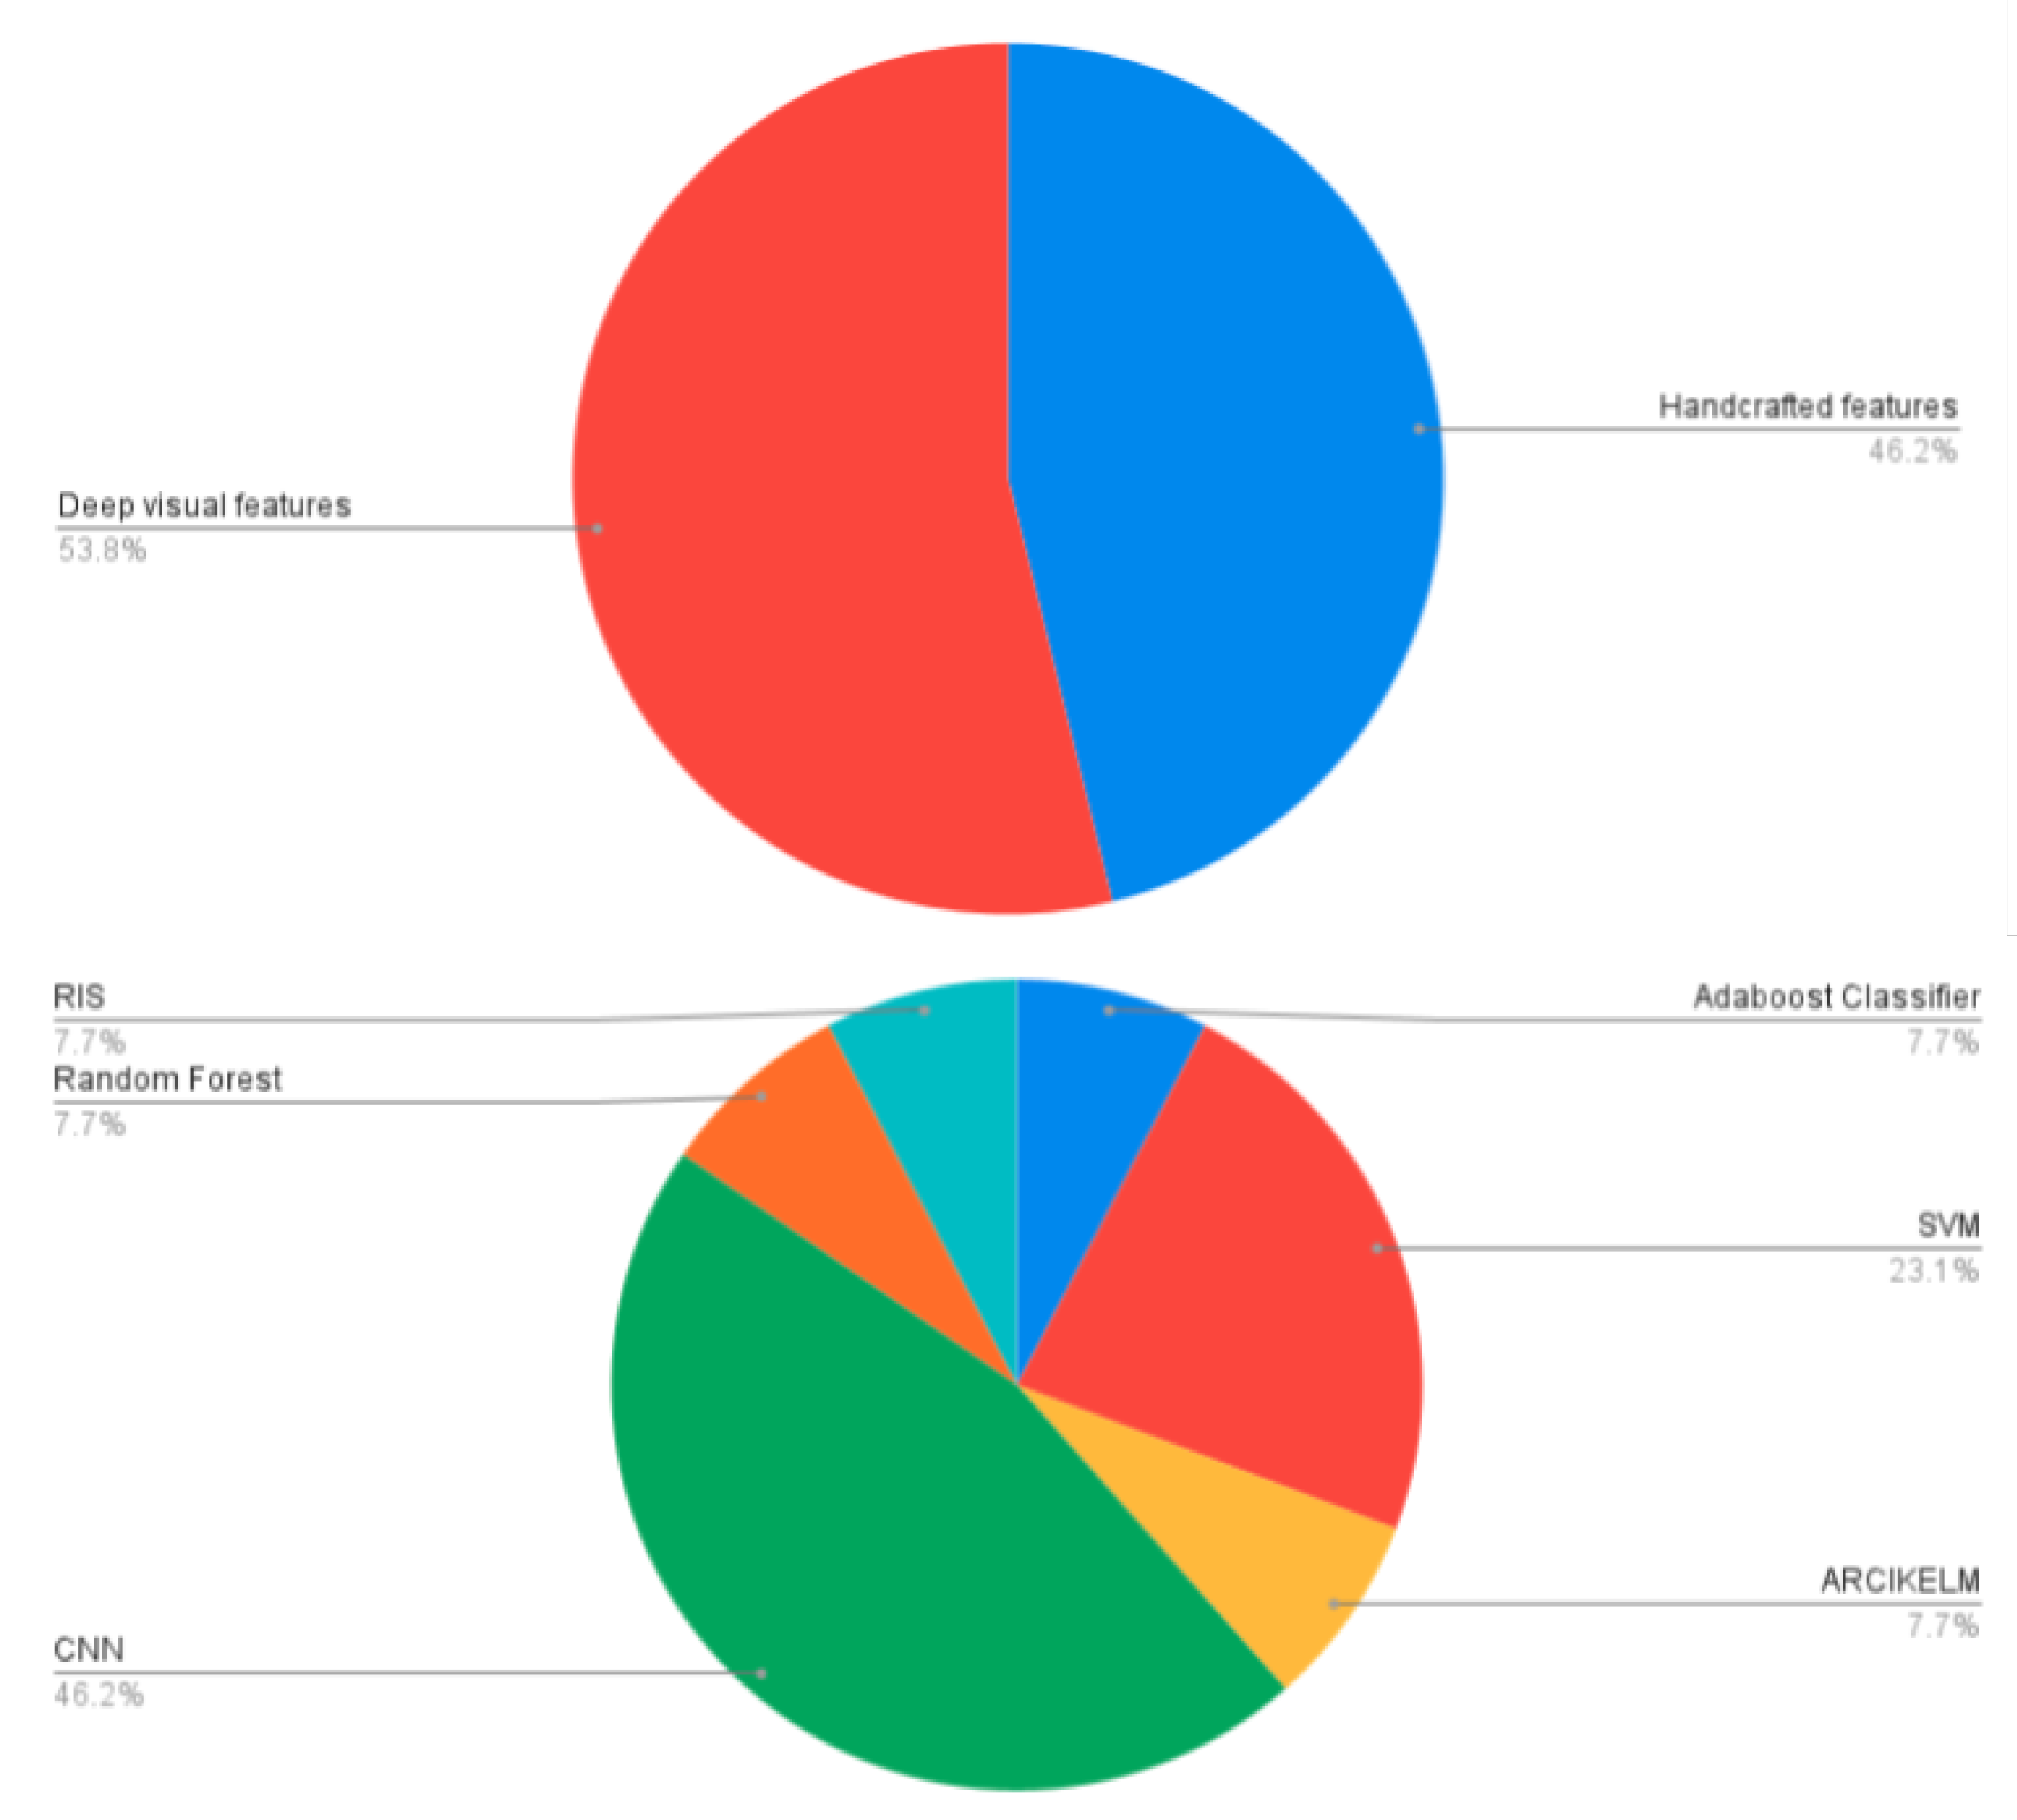
| Reference | Year | Application Name | Food Segmentation | Feature Extraction Method | Classification Method |
|---|---|---|---|---|---|
| Aizawa et al. [149] | 2013 | FoodLog | No | Color, SIFT and Bag of Features | Adaboost Classifier |
| Oliveira et al. [83] | 2014 | - | Yes | Color and Texture | Support Vector Machine (SVM) |
| Probst et al. [152] | 2015 | - | - | SIFT, LBP and Color | Linear SVM |
| Meyers et al. [13] | 2015 | Im2Calories | Yes | GoogleNet CNN | GoogleNet CNN model |
| Ravi et al. [150] | 2015 | FoodCam | No | HoG, LBP and RGB Color Features | Linear SVM |
| Waltner et al. [55] | 2017 | - | Yes | RGB, HSV and LAB Color values | Random Forest Classifier |
| Mezgec and Seljak [153] | 2017 | - | - | NutriNet | NutriNet |
| Pouladzadeh et al. [154] | 2017 | - | Yes | CNN | Caffe Framework |
| Waltner et al. [155] | 2017 | - | Yes | CNN | CNN |
| Ming et al. [11] | 2018 | DietLens | - | ResNet-50 CNN | ResNet-50 CNN |
| Jiang et al. [151] | 2018 | - | Yes | Colors, Lines, Points, SIFTand Texture Features | Reverse Image Search (RIS) and Text Mining |
| Jianing Sun et al. [156] | 2019 | Food Tracker | Yes | DCNN | DCNN |
| G. A. Tahir and C.K. Loo [52] | 2020 | MyDietCam | Yes | ResNet-50, DenseNet201 and Inception ResNet-V2 | Adaptive Reduced Class Incremental Kernel Extreme Learning Machine (ARCIKELM) |
Publisher’s Note: MDPI stays neutral with regard to jurisdictional claims in published maps and institutional affiliations. |
© 2021 by the authors. Licensee MDPI, Basel, Switzerland. This article is an open access article distributed under the terms and conditions of the Creative Commons Attribution (CC BY) license (https://creativecommons.org/licenses/by/4.0/).
Share and Cite
Tahir, G.A.; Loo, C.K. A Comprehensive Survey of Image-Based Food Recognition and Volume Estimation Methods for Dietary Assessment. Healthcare 2021, 9, 1676. https://doi.org/10.3390/healthcare9121676
Tahir GA, Loo CK. A Comprehensive Survey of Image-Based Food Recognition and Volume Estimation Methods for Dietary Assessment. Healthcare. 2021; 9(12):1676. https://doi.org/10.3390/healthcare9121676
Chicago/Turabian StyleTahir, Ghalib Ahmed, and Chu Kiong Loo. 2021. "A Comprehensive Survey of Image-Based Food Recognition and Volume Estimation Methods for Dietary Assessment" Healthcare 9, no. 12: 1676. https://doi.org/10.3390/healthcare9121676