
Self-Reported Eating Speed Is Associated with Indicators of Obesity in Adults: A Systematic Review and Meta-Analysis

 , , , , and
Abstract
:1. Introduction
2. Materials and Methods
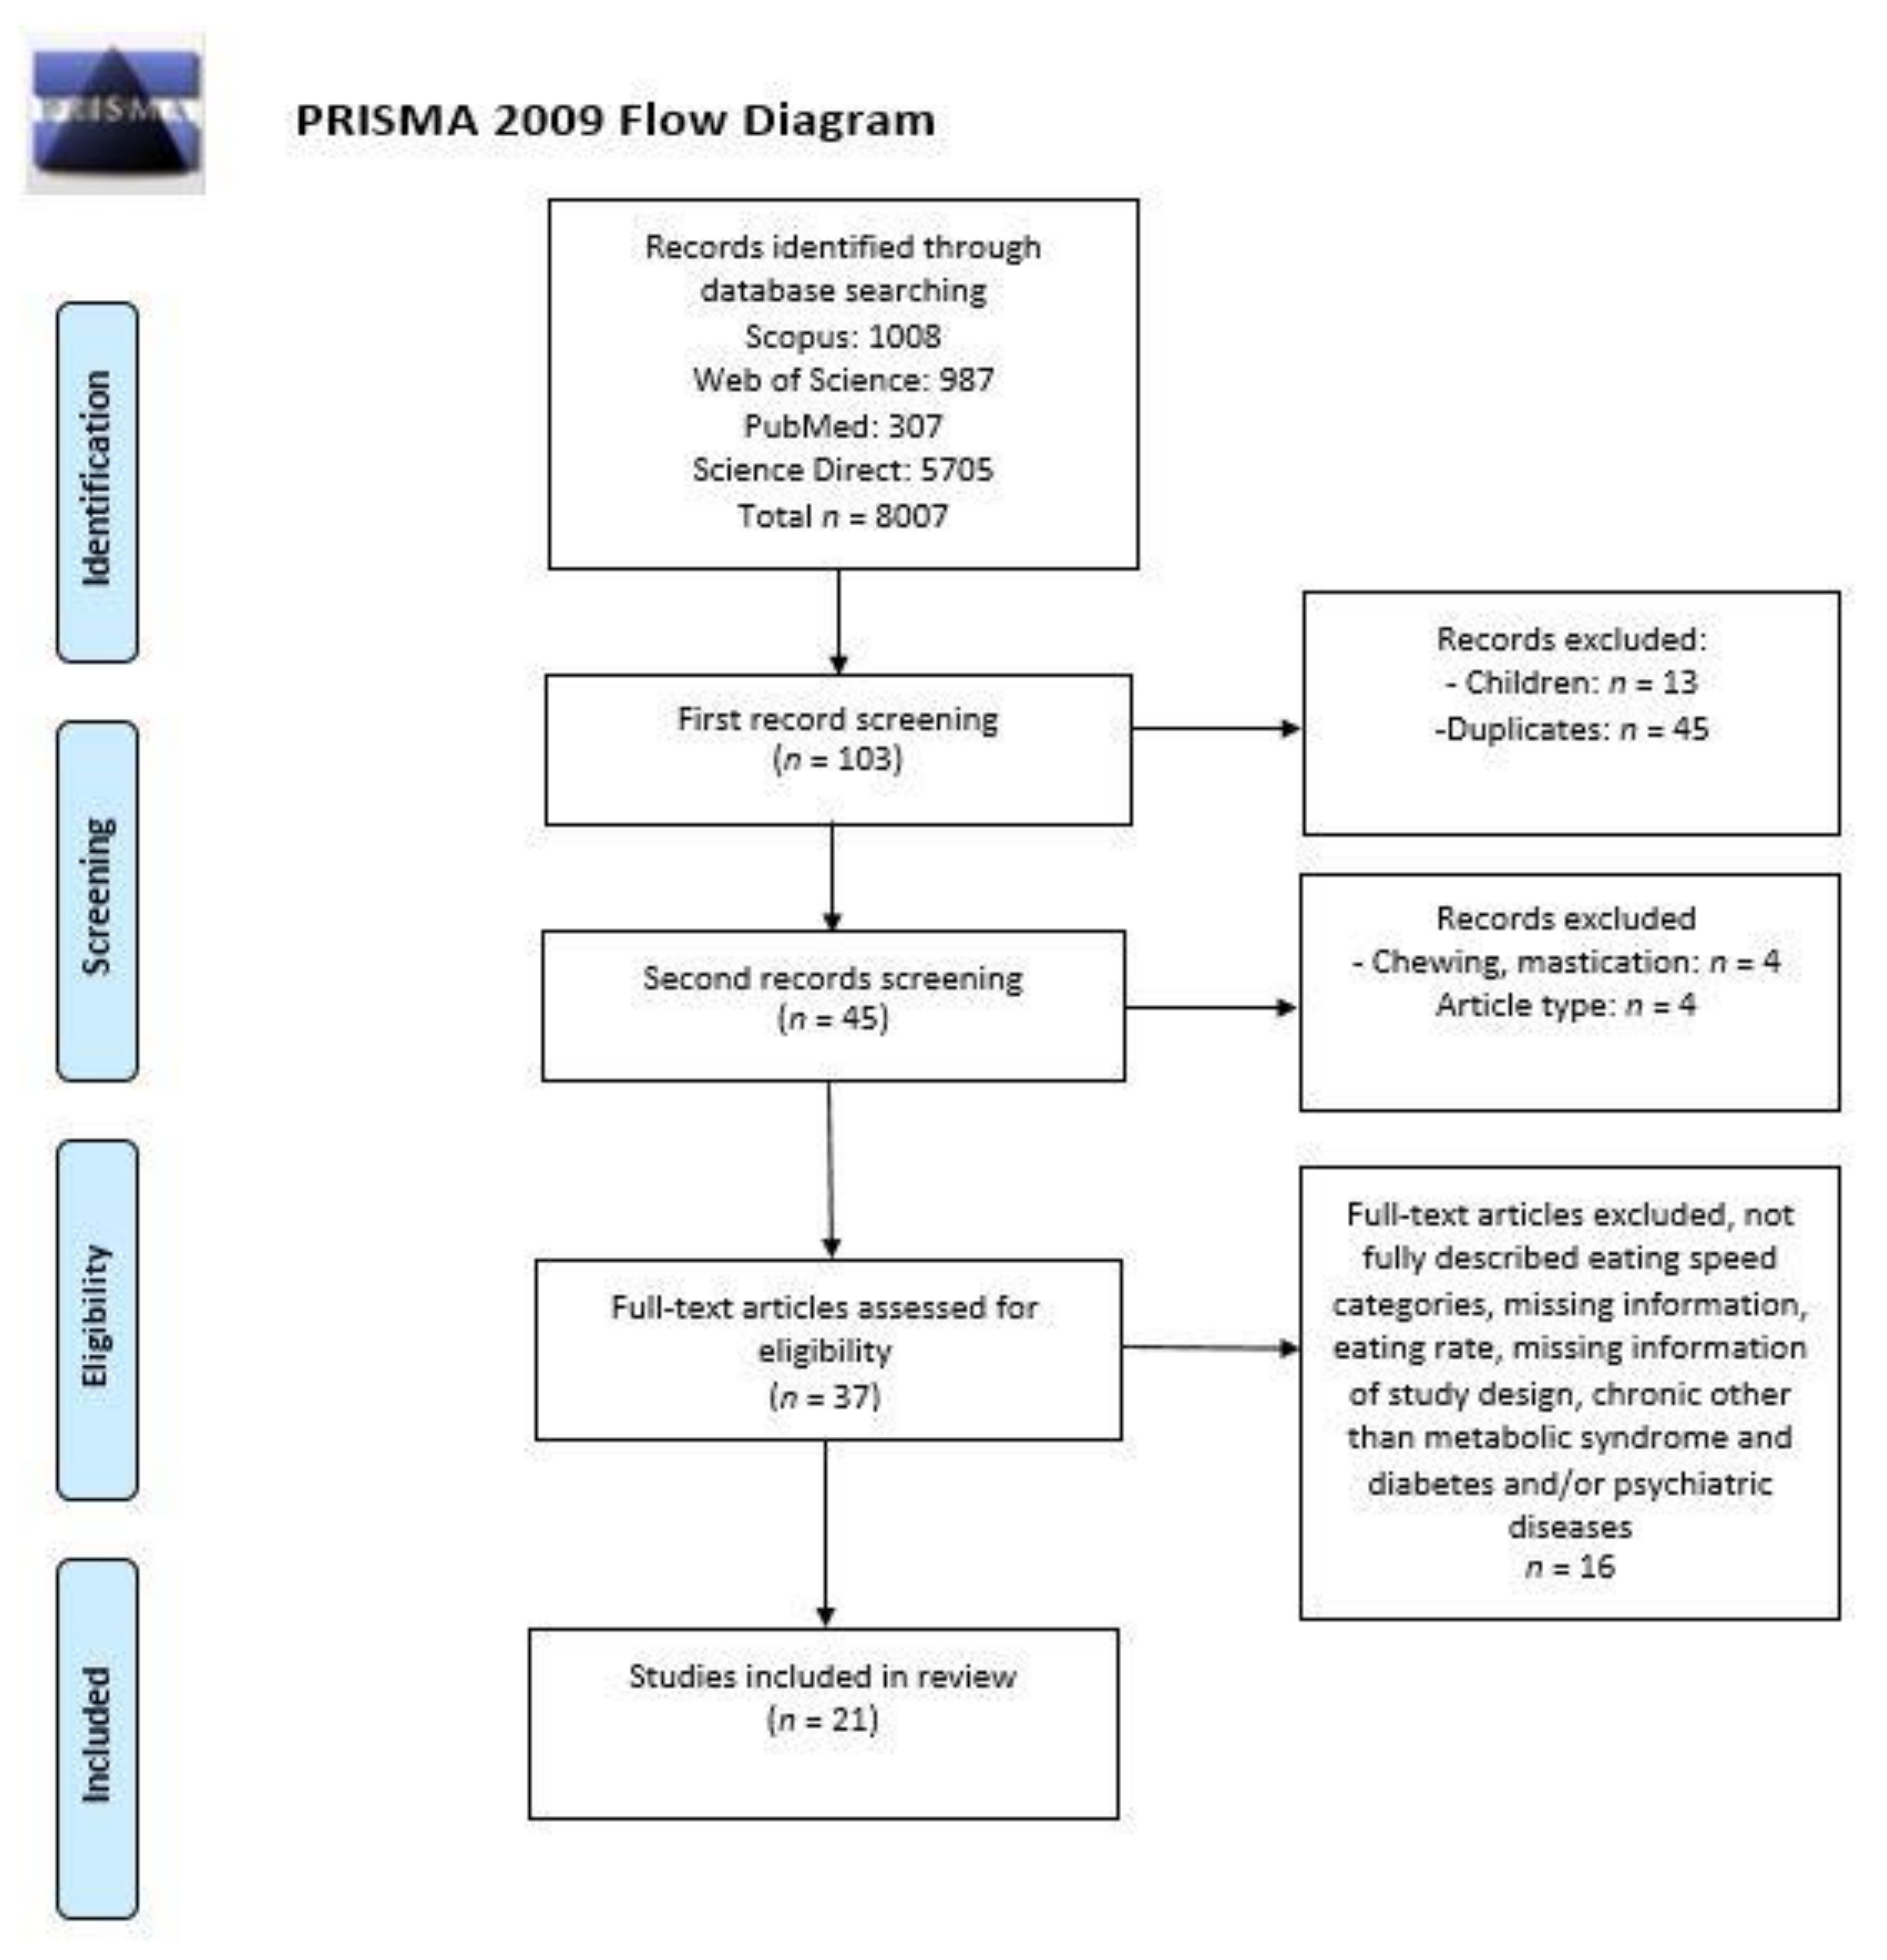
2.1. Study Selection Process
2.2. Inclusion and Exclusion Criteria
2.3. Data Analysis
2.4. Quality Assessment
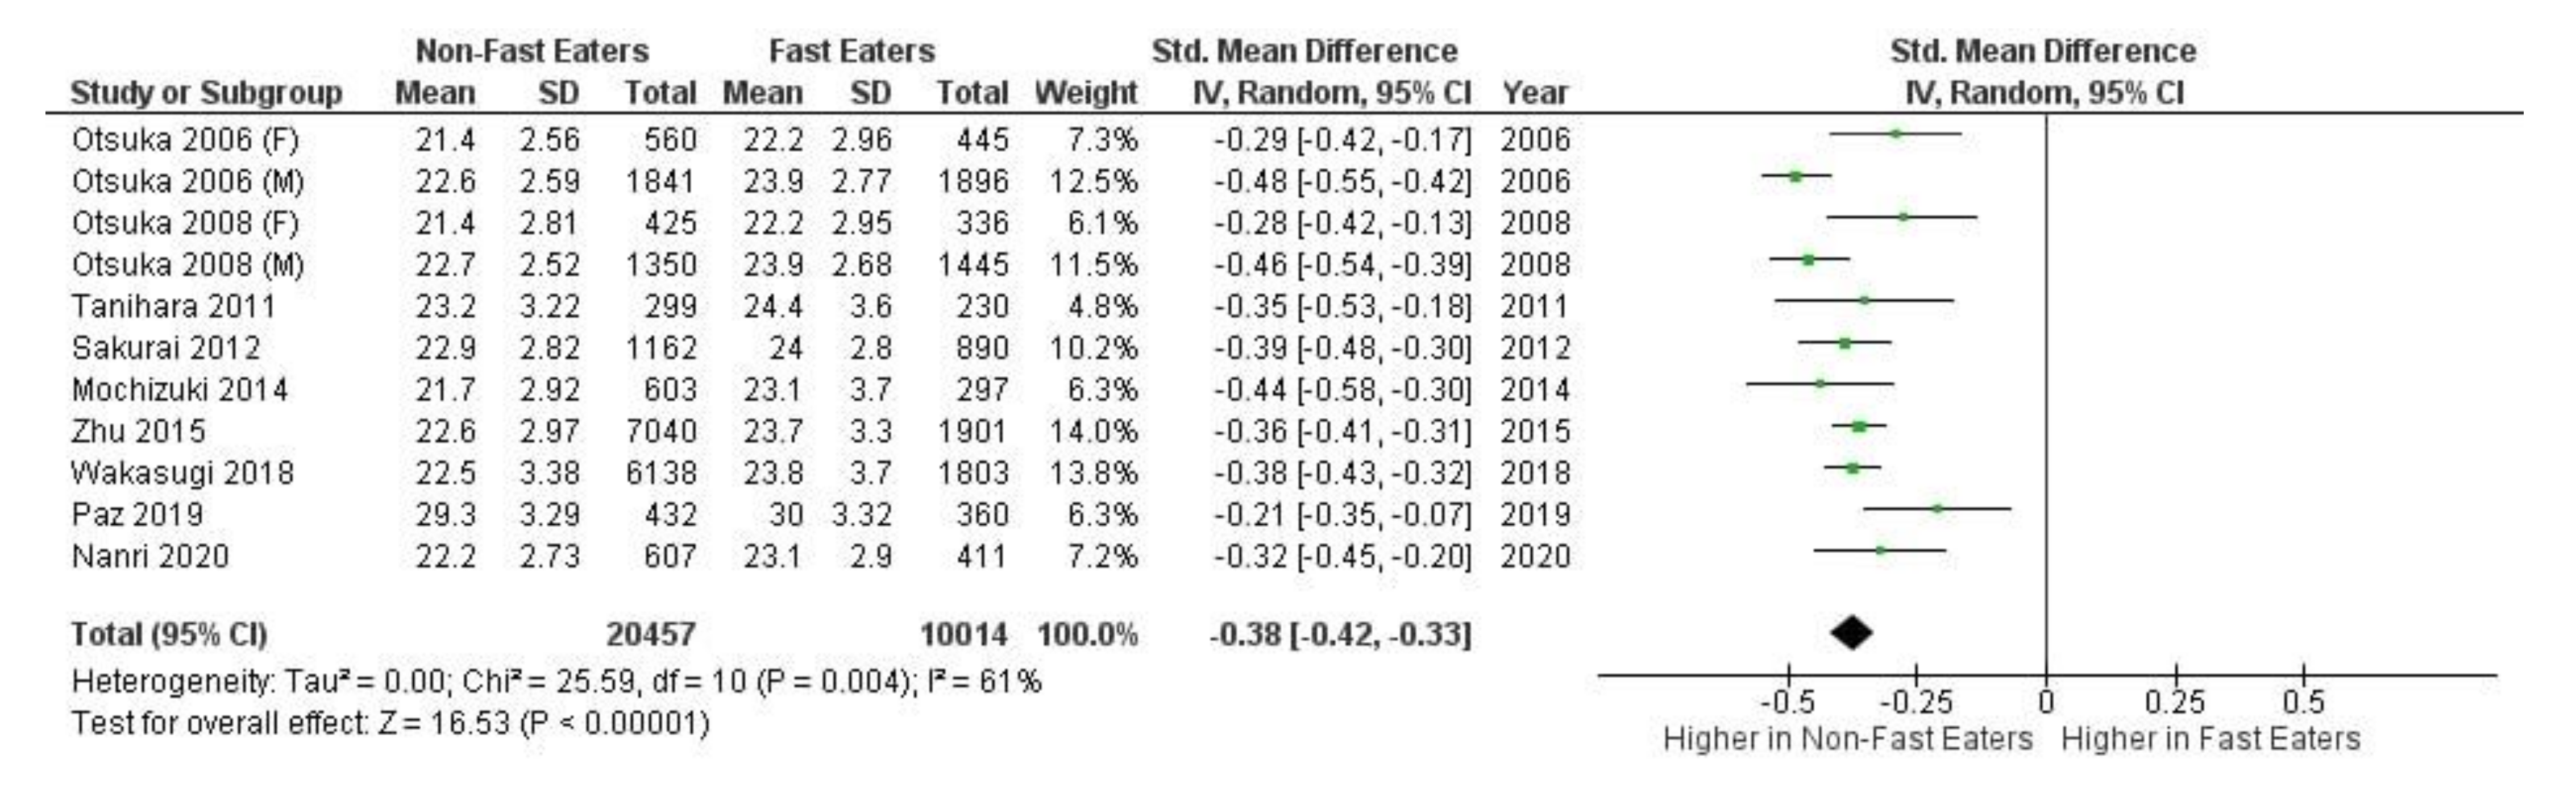
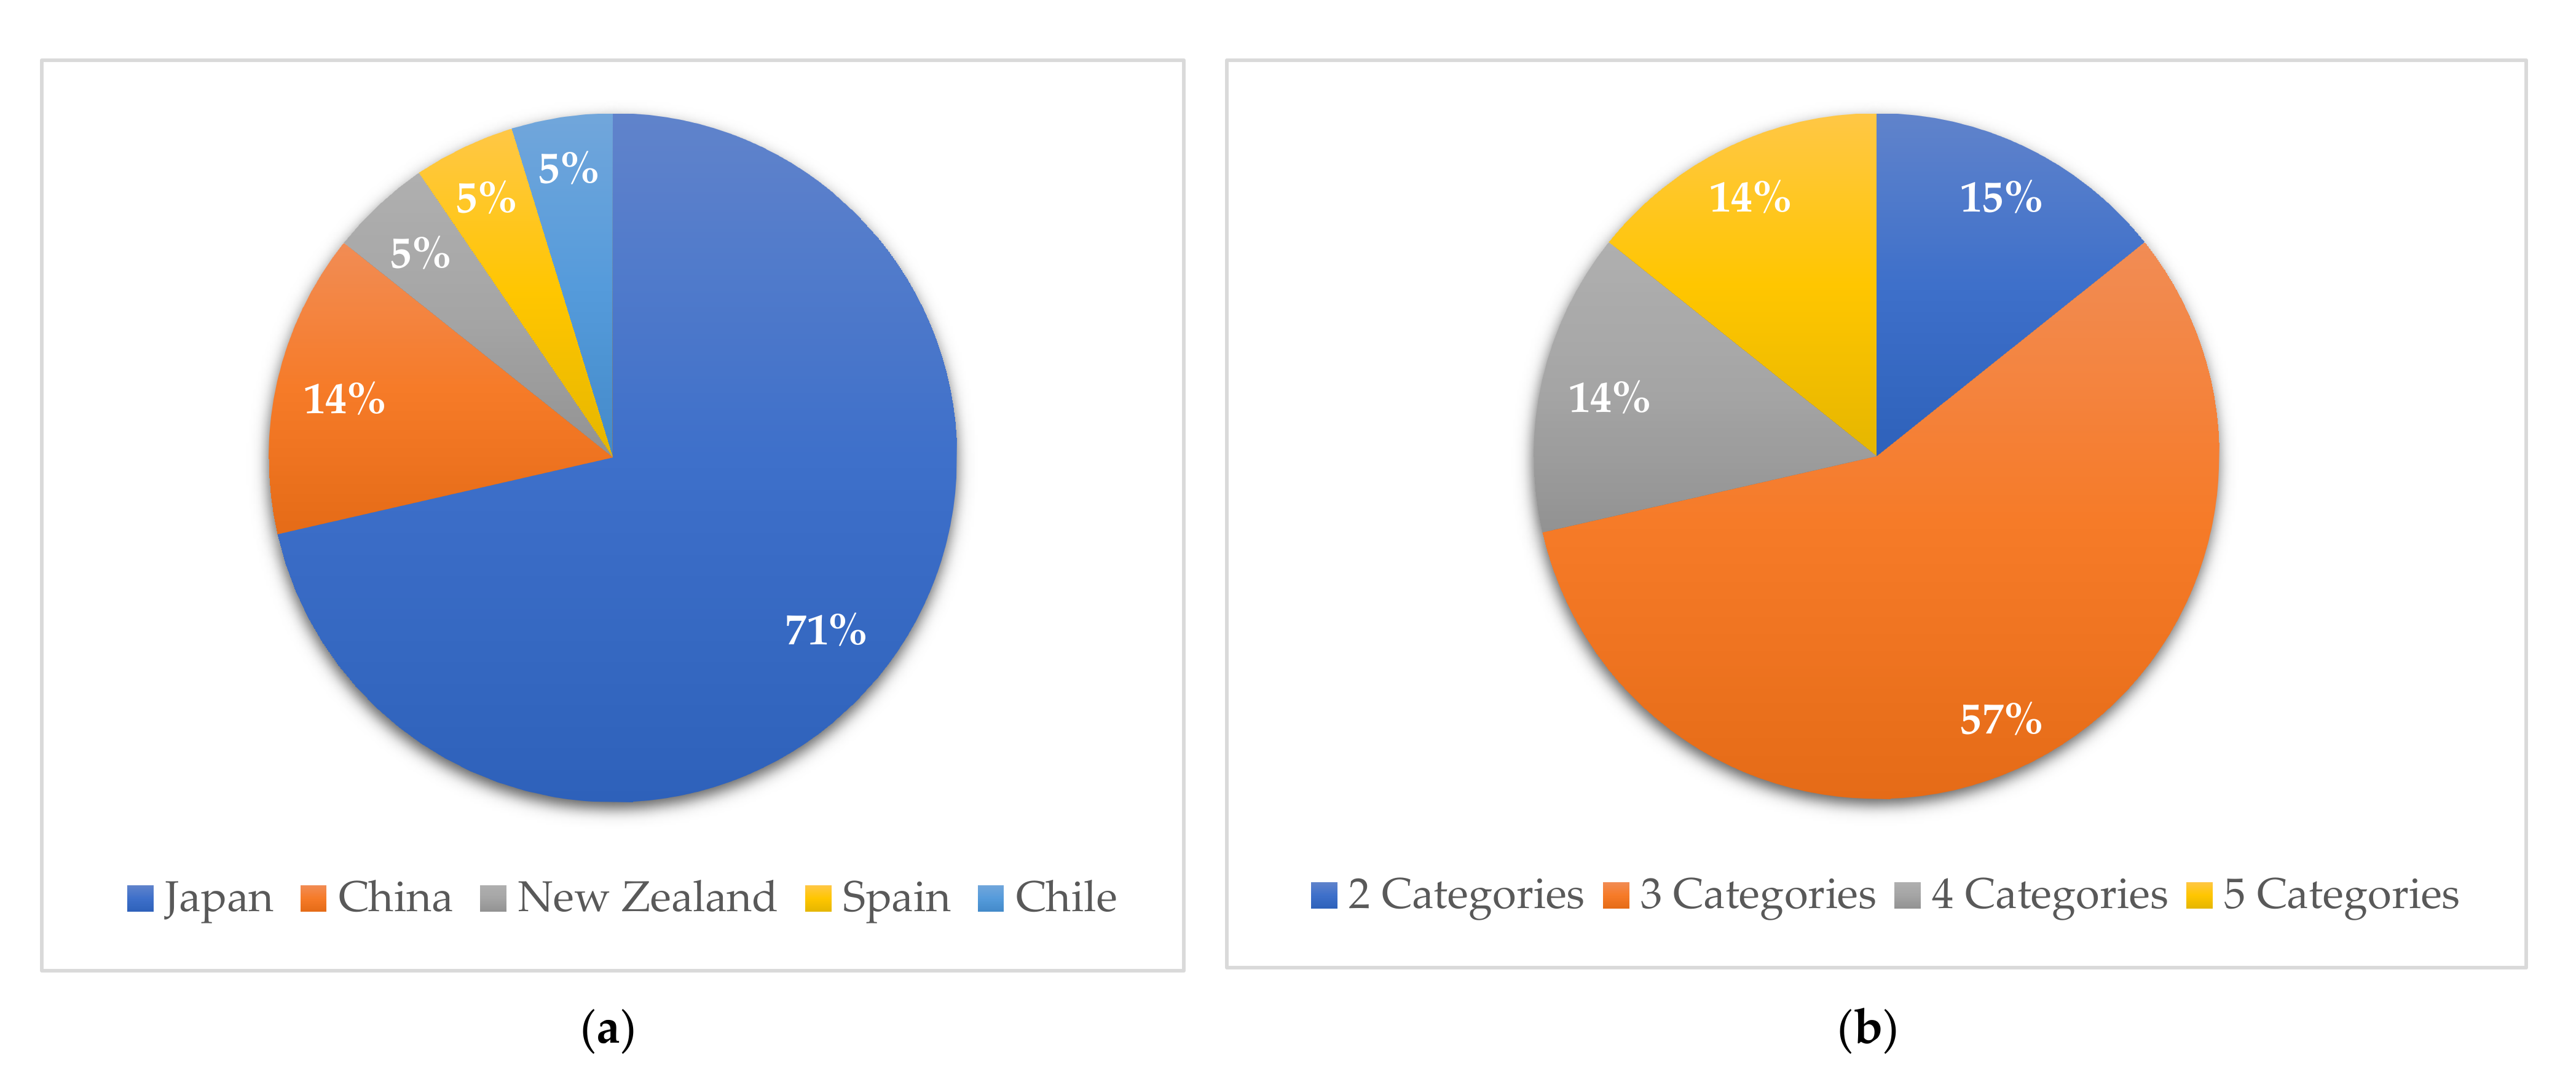
3. Results
4. Discussion
4.1. The Correlation between Eating Speed and Obesity
4.2. Sex Difference in Eating Speed
4.3. The Relation between Eating Speed and Other Noncommunicable Diseases
4.4. Strengths and Limitations
5. Conclusions
Supplementary Materials
Author Contributions
Funding
Institutional Review Board Statement
Informed Consent Statement
Data Availability Statement
Conflicts of Interest
References
- Bentham, J.; Di Cesare, M.; Bilano, V.; Bixby, H.; Zhou, B.; Stevens, G.A.; Riley, L.M.; Taddei, C.; Hajifathalian, K.; Lu, Y.; et al. Worldwide trends in body-mass index, underweight, overweight, and obesity from 1975 to 2016: A pooled analysis of 2416 population-based measurement studies in 128·9 million children, adolescents, and adults. Lancet 2017, 390, 2627–2642. [Google Scholar] [CrossRef] [Green Version]
- Bjertnaes, A.A.; Fossum, I.N.; Oma, I.; Bakken, K.S.; Arne, T.; Holten-Andersen, M.N. A Cross-Sectional Study of the Relationship Between Mental Health Problems and Overweight and Obesity in Adolescents. Front. Public Health 2020, 8, 334. [Google Scholar] [CrossRef] [PubMed]
- Kałużna, M.; Człapka-Matyasik, M.; Wachowiak-Ochmańska, K.; Moczko, J.; Kaczmarek, J.; Janicki, A.; Piątek, K.; Ruchała, M.; Ziemnicka, K. Effect of Central Obesity and Hyperandrogenism on Selected Inflammatory Markers in Patients with PCOS: A WHtR-Matched Case-Control Study. J. Clin. Med. 2020, 9, 3024. [Google Scholar] [CrossRef]
- Guagliano, J.M.; Morton, K.L.; Hughes, C.; Sluijs, E.M.F. Effective and resource-efficient strategies for recruiting families in physical activity, sedentary behavior, nutrition, and obesity prevention research: A systematic review with expert opinion. Obes. Rev. 2020, 22, e13161. [Google Scholar] [CrossRef]
- Crandall, A.K.; Ziegler, A.M.; Mansouri, T.; Matteson, J.; Isenhart, E.; Carter, A.; Balantekin, K.N.; Temple, J.L. Having less and wanting more: An investigation of socioeconomic status and reinforcement pathology. BMC Public Health 2021, 21, 402. [Google Scholar] [CrossRef]
- Choquet, H.; Meyre, D. Genetics of Obesity: What have we Learned? Curr. Genom. 2011, 12, 169–179. [Google Scholar] [CrossRef] [PubMed] [Green Version]
- Ngowi, E.E.; Wang, Y.; Khattak, S.; Khan, N.H.; Sayed Mohamed Mahmoud, S.; Helmy, Y.A.S.H.; Jiang, Q.; Li, T.; Duan, S.; Ji, X.; et al. Impact of the factors shaping gut microbiota on obesity. J. Appl. Microbiol. 2021, 131, 2131–2147. [Google Scholar] [CrossRef] [PubMed]
- Sobas, K.; Wadolowska, L.; Slowinska, M.A.; Czlapka-Matyasik, M.; Wuenstel, J.; Niedzwiedzka, E. Like mother, like daughter? Dietary and non-dietary bone fracture risk factors in mothers and their daughters. Iran. J. Public Health 2015, 44, 939–952. [Google Scholar] [PubMed]
- Wadolowska, L.; Hamulka, J.; Kowalkowska, J.; Ulewicz, N.; Hoffmann, M.; Gornicka, M.; Bronkowska, M.; Leszczynska, T.; Glibowski, P.; Korzeniowska-Ginter, R. Changes in sedentary and active lifestyle, diet quality and body composition nine months after an education program in Polish students aged 11–12 years: Report from the ABC of healthy eating study. Nutrients 2019, 11, 331. [Google Scholar] [CrossRef] [PubMed] [Green Version]
- Wicherski, J.; Schlesinger, S.; Fischer, F. Association between breakfast skipping and body weight—A systematic review and meta-analysis of observational longitudinal studies. Nutrients 2021, 13, 272. [Google Scholar] [CrossRef]
- Marangoni, F.; Martini, D.; Scaglioni, S.; Sculati, M.; Donini, L.M.; Leonardi, F.; Agostoni, C.; Castelnuovo, G.; Ferrara, N.; Ghiselli, A.; et al. Snacking in nutrition and health. Int. J. Food Sci. Nutr. 2019, 70, 909–923. [Google Scholar] [CrossRef] [PubMed]
- Yamamoto, R.; Tomi, R.; Shinzawa, M.; Yoshimura, R.; Ozaki, S.; Nakanishi, K.; Ide, S.; Nagatomo, I.; Nishida, M.; Yamauchi-Takihara, K.; et al. Associations of Skipping Breakfast, Lunch, and Dinner with Weight Gain and Overweight/Obesity in University Students: A Retrospective Cohort Study. Nutrients 2021, 13, 271. [Google Scholar] [CrossRef]
- Czlapka-Matyasik, M.; Lonnie, M.; Wadolowska, L.; Frelich, A. “Cutting down on sugar” by non-dieting young women: An impact on diet quality on weekdays and the weekend. Nutrients 2018, 10, 1463. [Google Scholar] [CrossRef] [PubMed] [Green Version]
- Wadolowska, L.; Ulewicz, N.; Sobas, K.; Wuenstel, J.W.; Slowinska, M.A.; Niedzwiedzka, E.; Czlapka-Matyasik, M. Dairy-related dietary patterns, dietary calcium, body weight and composition: A study of obesity in polish mothers and daughters, the MODAF project. Nutrients 2018, 10, 90. [Google Scholar] [CrossRef] [PubMed] [Green Version]
- Mullins, V.A.; Bresette, W.; Johnstone, L.; Hallmark, B.; Chilton, F.H. Genomics in Personalized Nutrition: Can You “Eat for Your Genes”? Nutrients 2020, 12, 3118. [Google Scholar] [CrossRef] [PubMed]
- Swinburn, B.A.; Caterson, I.; Seidell, J.C.; James, W.P.T. Diet, nutrition and the prevention of excess weight gain and obesity. Public Health Nutr. 2004, 7, 123–146. [Google Scholar] [CrossRef] [PubMed]
- Wardle, J.; Haase, A.M.; Steptoe, A.; Nillapun, M.; Jonwutiwes, K.; Bellisle, F. Gender Differences in Food Choice: The Contribution of Health Beliefs and Dieting. Ann. Behav. Med. 2004, 27, 107–116. [Google Scholar] [CrossRef] [PubMed]
- Leblanc, V.; Bégin, C.; Hudon, A.-M.; Royer, M.-M.; Corneau, L.; Dodin, S.; Lemieux, S. Gender differences in the long-term effects of a nutritional intervention program promoting the Mediterranean diet: Changes in dietary intakes, eating behaviors, anthropometric and metabolic variables. Nutr. J. 2014, 13, 107. [Google Scholar] [CrossRef] [PubMed] [Green Version]
- Sproesser, G.; Ruby, M.B.; Arbit, N.; Akotia, C.S.; Alvarenga, M.D.S.; Bhangaokar, R.; Furumitsu, I.; Hu, X.; Imada, S.; Kaptan, G.; et al. Understanding traditional and modern eating: The TEP10 framework. BMC Public Health 2019, 19, 1606. [Google Scholar] [CrossRef]
- Sproesser, G.; Imada, S.; Furumitsu, I.; Rozin, P.; Ruby, M.B.; Arbit, N.; Fischler, C.; Schupp, H.T.; Renner, B. What constitutes traditional and modern eating? The case of Japan. Nutrients 2018, 10, 118. [Google Scholar] [CrossRef] [PubMed] [Green Version]
- Huseynov, S.; Palma, M.A. Food decision-making under time pressure. Food Qual. Prefer. 2021, 88, 104072. [Google Scholar] [CrossRef]
- Macchi, R.; MacKew, L.; Davis, C. Is decision-making ability related to food choice and facets of eating behaviour in adolescents? Appetite 2017, 116, 442–455. [Google Scholar] [CrossRef]
- Woodward, E.; Haszard, J.; Worsfold, A.; Venn, B. Comparison of self-reported speed of eating with an objective measure of eating rate. Nutrients 2020, 12, 599. [Google Scholar] [CrossRef] [PubMed] [Green Version]
- Viskaal-van Dongen, M.; Kok, F.J.; de Graaf, C. Eating rate of commonly consumed foods promotes food and energy intake. Appetite 2011, 56, 25–31. [Google Scholar] [CrossRef] [PubMed] [Green Version]
- Zhu, B.; Haruyama, Y.; Muto, T.; Yamazaki, T. Association Between Eating Speed and Metabolic Syndrome in a Three-Year Population-Based Cohort Study. J. Epidemiol. 2015, 25, 332–336. [Google Scholar] [CrossRef] [PubMed] [Green Version]
- Nagahama, S.; Kurotani, K.; Pham, N.M.; Nanri, A.; Kuwahara, K.; Dan, M.; Nishiwaki, Y.; Mizoue, T. Self-reported eating rate and metabolic syndrome in Japanese people: Cross-sectional study. BMJ Open 2014, 4, e005241. [Google Scholar] [CrossRef] [PubMed] [Green Version]
- Wakasugi, M.; Kazama, J.J.; Narita, I. Self-reported slower eating is associated with a lower salt intake: A population-based cross-sectional study. Intern. Med. 2018, 57, 1561–1567. [Google Scholar] [CrossRef] [PubMed] [Green Version]
- Sakurai, M.; Nakamura, K.; Miura, K.; Takamura, T.; Yoshita, K.; Nagasawa, S.; Morikawa, Y.; Ishizaki, M.; Kido, T.; Naruse, Y.; et al. Self-reported speed of eating and 7-year risk of type 2 diabetes mellitus in middle-aged Japanese men. Metabolism 2012, 61, 1566–1571. [Google Scholar] [CrossRef] [Green Version]
- Ohkuma, T.; Hirakawa, Y.; Nakamura, U.; Kiyohara, Y.; Kitazono, T.; Ninomiya, T. Association between eating rate and obesity: A systematic review and meta-analysis. Int. J. Obes. 2015, 39, 1589–1596. [Google Scholar] [CrossRef] [PubMed]
- Andrade, A.M.; Greene, G.W.; Melanson, K.J. Eating Slowly Led to Decreases in Energy Intake within Meals in Healthy Women. J. Am. Diet. Assoc. 2008, 108, 1186–1191. [Google Scholar] [CrossRef] [PubMed]
- Hollis, J.H. The effect of mastication on food intake, satiety and body weight. Physiol. Behav. 2018, 193, 242–245. [Google Scholar] [CrossRef]
- Val-Laillet, D.; Guérin, S.; Malbert, C.H. Slower eating rate is independent to gastric emptying in obese minipigs. Physiol. Behav. 2010, 101, 462–468. [Google Scholar] [CrossRef] [PubMed]
- Kokkinos, A.; Le Roux, C.W.; Alexiadou, K.; Tentolouris, N.; Vincent, R.P.; Kyriaki, D.; Perrea, D.; Ghatei, M.A.; Bloom, S.R.; Katsilambros, N. Eating slowly increases the postprandial response of the anorexigenic gut hormones, peptide YY and glucagon-like peptide-1. J. Clin. Endocrinol. Metab. 2010, 95, 333–337. [Google Scholar] [CrossRef] [PubMed]
- Asarian, L.; Geary, N. Sex differences in the physiology of eating. Am. J. Physiol. Integr. Comp. Physiol. 2013, 305, R1215–R1267. [Google Scholar] [CrossRef] [PubMed] [Green Version]
- Massa, M.G.; Correa, S.M. Sexes on the brain: Sex as multiple biological variables in the neuronal control of feeding. Biochim. Biophys. Acta Mol. Basis Dis. 2020, 1866, 165840. [Google Scholar] [CrossRef] [PubMed]
- Koliaki, C.; Liatis, S.; Dalamaga, M.; Kokkinos, A. The Implication of Gut Hormones in the Regulation of Energy Homeostasis and Their Role in the Pathophysiology of Obesity. Curr. Obes. Rep. 2020, 9, 255–271. [Google Scholar] [CrossRef] [PubMed]
- Chaudhri, O.; Small, C.; Bloom, S. Gastrointestinal hormones regulating appetite. Philos. Trans. R. Soc. B Biol. Sci. 2006, 361, 1187–1209. [Google Scholar] [CrossRef] [PubMed] [Green Version]
- Zhang, T.; Cai, L.; Ma, L.; Jing, J.; Chen, Y.; Ma, J. The prevalence of obesity and influence of early life and behavioral factors on obesity in Chinese children in Guangzhou. BMC Public Health 2016, 16, 954. [Google Scholar] [CrossRef] [Green Version]
- Hawton, K.; Ferriday, D.; Rogers, P.; Toner, P.; Brooks, J.; Holly, J.; Biernacka, K.; Hamilton-Shield, J.; Hinton, E. Slow Down: Behavioural and Physiological Effects of Reducing Eating Rate. Nutrients 2018, 11, 50. [Google Scholar] [CrossRef] [PubMed] [Green Version]
- Paz-Graniel, I.; Babio, N.; Mendez, I.; Salas-Salvadó, J. Association between Eating Speed and Classical Cardiovascular Risk Factors: A Cross-Sectional Study. Nutrients 2019, 11, 83. [Google Scholar] [CrossRef] [Green Version]
- Takahashi, F.; Hashimoto, Y.; Kawano, R.; Kaji, A.; Sakai, R.; Kawate, Y.; Okamura, T.; Ushigome, E.; Kitagawa, N.; Majima, S.; et al. Eating fast is associated with nonalcoholic fatty liver disease in men but not in women with type 2 diabetes: A cross-sectional study. Nutrients 2020, 12, 2174. [Google Scholar] [CrossRef] [PubMed]
- Tao, L.; Yang, K.; Huang, F.; Liu, X.; Li, X.; Luo, Y.; Wu, L.; Guo, X. Association between self-reported eating speed and metabolic syndrome in a Beijing adult population: A cross-sectional study. BMC Public Health 2018, 18, 855. [Google Scholar] [CrossRef] [Green Version]
- Ghesmaty Sangachin, M.; Cavuoto, L.A.; Wang, Y. Use of various obesity measurement and classification methods in occupational safety and health research: A systematic review of the literature. BMC Obes. 2018, 5, 28. [Google Scholar] [CrossRef]
- Gutin, I. In BMI we trust: Reframing the body mass index as a measure of health. Soc. Theory Health 2018, 16, 256–271. [Google Scholar] [CrossRef] [PubMed]
- WHO. The WHO STEPwise Approach to Noncommunicable Disease Risk Factor Surveillance; WHO: Geneva, Switzerland, 2003. [Google Scholar]
- Sommer, I.; Teufer, B.; Szelag, M.; Nussbaumer-Streit, B.; Titscher, V.; Klerings, I.; Gartlehner, G. The performance of anthropometric tools to determine obesity: A systematic review and meta-analysis. Sci. Rep. 2020, 10, 12699. [Google Scholar] [CrossRef]
- Phelan, S.; Halfman, T.; Pinto, A.M.; Foster, G.D. Behavioral and Psychological Strategies of Long-Term Weight Loss Maintainers in a Widely Available Weight Management Program. Obesity 2020, 28, 421–428. [Google Scholar] [CrossRef] [PubMed]
- Teixeira, P.J.; Marques, M.M. Health Behavior Change for Obesity Management. Obes. Facts 2017, 10, 666–673. [Google Scholar] [CrossRef]
- Kudo, A.; Asahi, K.; Satoh, H.; Iseki, K.; Moriyama, T.; Yamagata, K.; Tsuruya, K.; Fujimoto, S.; Narita, I.; Konta, T.; et al. Fast eating is a strong risk factor for new-onset diabetes among the Japanese general population. Sci. Rep. 2019, 9, 8210. [Google Scholar] [CrossRef] [PubMed]
- Ochiai, H.; Shirasawa, T.; Nanri, H.; Nishimura, R.; Hoshino, H.; Kokaze, A. Relationship between eating quickly and overweight: A cohort study of schoolchildren in Japan. Acta Med. Okayama 2018, 72, 121–128. [Google Scholar] [CrossRef]
- Nanri, A.; Miyaji, N.; Kochi, T.; Eguchi, M.; Kabe, I.; Mizoue, T. Eating speed and risk of metabolic syndrome among Japanese workers: The Furukawa Nutrition and Health Study. Nutrition 2020, 78, 110962. [Google Scholar] [CrossRef] [PubMed]
- Higgins, J.P.T.; Thomas, J.; Chandler, J.; Cumpston, M.; Li, T.; Page, M.J.; Welch, V.A. Cochrane Handbook for Systematic Reviews of Interventions Version 6.0; Cochrane: London, UK, 2019. [Google Scholar]
- Tanihara, S.; Imatoh, T.; Miyazaki, M.; Babazono, A.; Momose, Y.; Baba, M.; Uryu, Y.; Une, H. Retrospective longitudinal study on the relationship between 8-year weight change and current eating speed. Appetite 2011, 57, 179–183. [Google Scholar] [CrossRef] [PubMed]
- Oda-Montecinos, C.; Saldaña, C.; Andrés, A. Eating behaviors are risk factors for the development of overweight. Nutr. Res. 2013, 33, 796–802. [Google Scholar] [CrossRef]
- Iwasaki, T.; Hirose, A.; Azuma, T.; Ohashi, T.; Watanabe, K.; Obora, A.; Deguchi, F.; Kojima, T.; Isozaki, A.; Tomofuji, T. Association between eating behavior and poor glycemic control in Japanese adults. Sci. Rep. 2019, 9, 3418. [Google Scholar] [CrossRef] [Green Version]
- Hurst, Y.; Fukuda, H. Effects of changes in eating speed on obesity in patients with diabetes: A secondary analysis of longitudinal health check-up data. BMJ Open 2018, 8, e019589. [Google Scholar] [CrossRef] [PubMed]
- Iwasaki, T.; Hirose, A.; Azuma, T.; Watanabe, K.; Deguchi, F.; Obora, A.; Kojima, T.; Tomofuji, T. Self-reported behavior of eating quickly is correlated with visceral fat area in Japanese non-obese adults. Asia Pac. J. Clin. Nutr. 2019, 28, 92–98. [Google Scholar] [CrossRef] [PubMed]
- Mochizuki, K.; Hariya, N.; Miyauchi, R.; Misaki, Y.; Ichikawa, Y.; Goda, T. Self-reported faster eating associated with higher ALT activity in middle-aged, apparently healthy Japanese women. Nutrition 2014, 30, 69–74. [Google Scholar] [CrossRef]
- Hamada, Y.; Miyaji, A.; Hayashi, Y.; Matsumoto, N.; Nishiwaki, M.; Hayashi, N. Objective and subjective eating speeds are related to body composition and shape in female college students. J. Nutr. Sci. Vitaminol. 2017, 63, 174–179. [Google Scholar] [CrossRef] [Green Version]
- Sonoda, C.; Fukuda, H.; Kitamura, M.; Hayashida, H.; Kawashita, Y.; Furugen, R.; Koyama, Z.; Saito, T. Associations among obesity, eating speed, and oral health. Obes. Facts 2018, 11, 165–175. [Google Scholar] [CrossRef] [PubMed]
- Xie, Q.; Hao, M.L.; Meng, L.B.; Zuo, X.Q.; Guo, P.; Qiu, Y.; Wang, Q.; Zhang, N.; Lei, M. Effect of eating habits on obesity in adolescents: A study among Chinese college students. J. Int. Med. Res. 2019, 48, 0300060519889738. [Google Scholar] [CrossRef] [PubMed] [Green Version]
- Shan, M.-J.; Zou, Y.-F.; Guo, P.; Weng, J.-X.; Wang, Q.-Q.; Dai, Y.-L.; Liu, H.-B.; Zhang, Y.-M.; Jiang, G.-Y.; Xie, Q.; et al. Systematic estimation of BMI. Medicine 2019, 98, e15810. [Google Scholar] [CrossRef] [PubMed]
- Leong, S.L.; Madden, C.; Gray, A.; Waters, D.; Horwath, C. Faster Self-Reported Speed of Eating Is Related to Higher Body Mass Index in a Nationwide Survey of Middle-Aged Women. J. Am. Diet. Assoc. 2011, 111, 1192–1197. [Google Scholar] [CrossRef] [PubMed]
- Otsuka, R.; Tamakoshi, K.; Yatsuya, H.; Wada, K.; Matsushita, K.; OuYang, P.; Hotta, Y.; Takefuji, S.; Mitsuhashi, H.; Sugiura, K.; et al. Eating fast leads to insulin resistance: Findings in middle-aged Japanese men and women. Prev. Med. 2008, 46, 154–159. [Google Scholar] [CrossRef]
- Otsuka, R.; Tamakoshi, K.; Yatsuya, H.; Murata, C.; Sekiya, A.; Wada, K.; Zhang, H.M.; Matsushita, K.; Sugiura, K.; Takefuji, S.; et al. Eating fast leads to obesity: Findings based on self-administered questionnaires among middle-aged Japanese men and women. J. Epidemiol. 2006, 16, 117–124. [Google Scholar] [CrossRef] [PubMed] [Green Version]
- Ross, R.; Neeland, I.J.; Yamashita, S.; Shai, I.; Seidell, J.; Magni, P.; Santos, R.D.; Arsenault, B.; Cuevas, A.; Hu, F.B.; et al. Waist circumference as a vital sign in clinical practice: A Consensus Statement from the IAS and ICCR Working Group on Visceral Obesity. Nat. Rev. Endocrinol. 2020, 16, 177–189. [Google Scholar] [CrossRef] [PubMed]
- Hankinson, A.L.; Daviglus, M.L.; Bouchard, C.; Carnethon, M.; Lewis, C.E.; Schreiner, P.J.; Liu, K.; Sidney, S. Maintaining a High Physical Activity Level Over 20 Years and Weight Gain. JAMA 2010, 304, 2603. [Google Scholar] [CrossRef] [PubMed] [Green Version]
- Kroll, D.S.; Feldman, D.E.; Biesecker, C.L.; McPherson, K.L.; Manza, P.; Joseph, P.V.; Volkow, N.D.; Wang, G.-J. Neuroimaging of Sex/Gender Differences in Obesity: A Review of Structure, Function, and Neurotransmission. Nutrients 2020, 12, 1942. [Google Scholar] [CrossRef]
- Forouzanfar, M.H.; Afshin, A.; Alexander, L.T.; Biryukov, S.; Brauer, M.; Cercy, K.; Charlson, F.J.; Cohen, A.J.; Dandona, L.; Estep, K.; et al. Global, regional, and national comparative risk assessment of 79 behavioural, environmental and occupational, and metabolic risks or clusters of risks, 1990–2015: A systematic analysis for the Global Burden of Disease Study 2015. Lancet 2016, 388, 1659–1724. [Google Scholar] [CrossRef] [Green Version]
- Schwartz, L.N.; Shaffer, J.D.; Bukhman, G. The origins of the 4 × 4 framework for noncommunicable disease at the World Health Organization. SSM Popul. Health 2021, 13, 100731. [Google Scholar] [CrossRef] [PubMed]
- Sasaki, S.; Katagiri, A.; Tsuji, T.; Shimoda, T.; Amano, K. Self-reported rate of eating correlates with body mass index in 18-y-old Japanese women. Int. J. Obes. 2003, 27, 1405–1410. [Google Scholar] [CrossRef] [Green Version]
- Jeong, J.N.; Kim, S.H.; Park, K.N. Relationship between objectively measured lifestyle factors and health factors in patients with knee osteoarthritis: The STROBE Study. Medicine 2019, 98, e16060. [Google Scholar] [CrossRef] [PubMed]
- Leong, S.L.; Madden, C.; Gray, A.; Horwath, C. Self-Determined, Autonomous Regulation of Eating Behavior Is Related to Lower Body Mass Index in a Nationwide Survey of Middle-Aged Women. J. Acad. Nutr. Diet. 2012, 112, 1337–1346. [Google Scholar] [CrossRef] [PubMed]
- Ikeda, N. Validity of self-reports of height and weight among the general adult population in Japan: Findings from national household surveys, 1986. PLoS ONE 2016, 11, e0148297. [Google Scholar] [CrossRef] [PubMed]
- Luo, J.; Thomson, C.A.; Hendryx, M.; Tinker, L.F.; Manson, J.E.; Li, Y.; Nelson, D.A.; Vitolins, M.Z.; Seguin, R.A.; Eaton, C.B.; et al. Accuracy of self-reported weight in the Women’s Health Initiative. Public Health Nutr. 2019, 22, 1019–1028. [Google Scholar] [CrossRef] [PubMed] [Green Version]
- Wen, M.; Kowaleski-Jones, L. Sex and ethnic differences in validity of self-reported adult height, weight and body mass index. Ethn. Dis. 2012, 22, 72–78. [Google Scholar] [CrossRef] [PubMed]


| Study | Sample | Assessment Tool | Eating Speed Categories |
|---|---|---|---|
| Two categories of studies | |||
| [25] Japan 2015 | n = 8941 adults | Self-reported | Not Fast, Fast |
| [53] Japan 2011 | n = 529 male workers | Self-reported | Fast, (Medium and Slow) (Three categories planned initially) |
| [54] Chile 2013 | n = 292 adults | Self-reported | Slow, Fast |
| Three categories of studies | |||
| [55] Japan 2019 | n = 5479 adults | Self-reported | Slowly, Medium, Quickly |
| [40] Spain 2019 | n = 792 adults | Self-reported | Slow, Medium, Fast |
| [42] China 2018 | n = 7972 adults with MetS and without MetS | Self-reported | Slow, Medium, Fast |
| [56] Japan 2018 | n = 59,717 adults with type 2 diabetes | Self-reported | Slow, Normal, Fast |
| [49] Japan 2019 | n = 197,825 adults with diabetes, without diabetes | Self-reported | Slow, Moderate, Fast |
| [26] Japan 2014 | n = 56,865 adults | Self-reported | Slow, Normal, Fast |
| [57] Japan 2019 | n = 381 non-obese adults | Self-reported | Slowly, Medium, Quickly |
| [58] Japan 2014 | n = 900 healthy women | Self-reported | Slow (Very Slow and Relatively Slow), Medium, Fast (Relatively Fast and Very Fast) (Five categories planned initially) |
| [27] Japan 2018 | n = 7941 adults | Self-reported | Slow, Normal, Fast |
| [28] Japan 2012 | n = 2050 middle-aged men | Self-reported | Slow, Medium, Fast |
| [59] Japan 2017 | n = 84 female college students | Self-reported | Slow, Moderate, Fast |
| [51] Japan 2020 | n = 1018 adults | Self-reported | Slow (Very Slow and Relatively Slow), Medium, Fast (Relatively Fast and Very Fast (Five categories planned initially) |
| Four categories of studies | |||
| [60] Japan 2018 | n = 863 adult working men | Self-reported | (Slow and very Slow), Ordinary, Fast, Very fast (Five categories planned initially) |
| [61] China 2019 | n = 536 college students. | Self-reported | Slow, Normal, Slightly Fast, Fast. |
| [62] China 2019 | n = 536 undergraduates | Self-reported | Slow (Very Slow and Slow), Ordinary, Fast, Very Fast (Five categories planned initially) |
| Five categories of studies | |||
| [63] New Zealand 2011 | n = 1515 middle-age women | Self-reported | Very Slow, Relatively Slow, Medium, Relatively Fast, Very Fast |
| [64] Japan 2007 | n = 3465 non-diabetic workers | Self-reported | Very slow, Relatively slow, Medium, Relatively fast, Very fast |
| [65] Japan 2006 | n = 4742; men = 3737; women = 1005 | Self-reported | Very Slow, Relatively Slow, Medium, Relatively Fast, Very Fast |
| Study/Country | Study Design | Methods | Participants | Age (year) | Obesity Indicators | Eating Speed | Outcome | Additional Information | |
|---|---|---|---|---|---|---|---|---|---|
| BMI | WC | ||||||||
| [63] (Leong, Madden, Gray, Waters, & Horwath, 2011) New Zealand | Cross-sectional study | Self-reported eating speed and BMI | n = 1515 middle-age women | 45.5 ± 3.2 | BMI: 25.8 ± 1.2 kg/m2 | Five categories: Very slow, Relatively slow, Medium, Relatively fast, Very fast | + | NA | BMI was significantly associated with eating speed both in unadjusted and after adjusting for age, ethnicity, socioeconomic status and physical activity. |
| [55] (Iwasaki, Hirose, Azuma, Ohashi, et al., 2019) Japan | Cohort study | Anthropometric measurement for BMI. Self-reported eating speed | n = 5479 adults | 49 (45–54) ¥ | BMI: 22.4 (20.4–24.6) ¥ kg/m2 | Three categories: Slowly, Medium, Quickly | + | NA | Quick eaters were significantly more likely to be male. |
| [40] (Paz-Graniel, Babio, Mendez, & Salas-Salvadó, 2019) Spain | Cross-Sectional Study | Anthropometric measurement for BMI and WC. Self-reported eating speed | n = 792 adults | 67.5 ± 5.86 | BMI: 29.62 ± 3.32 kg/m2 WC Men: Slow: 102.74 ± 9.03 cm Medium: 103.37 ± 8.45 cm Fast: 103.24 ± 8.41 cm Women Slow: 99.23 9.6 ± 5 cm Medium: 98.27 ± 7.80 cm Fast: 99.79 ± 8.56 cm | Three categories: Slow, Medium, Fast | - | - | Fast eaters were most frequently younger women who had higher BMI than slower eaters. |
| [25](Zhu, Haruyama, Muto, & Yamazaki, 2015) Japan | Follow-up Cohort study | Anthropometric measurement for BMI and WC. Self-reported eating speed. | n = 8941 adults | 63.7 ± 7.9 | BMI: 22.8 ± 3.1 kg/m2. WC: 82 ± 8.8 cm. | Two categories Not fast, fast | + | + | In an age- and sex-adjusted analysis, eating speed was significantly associated with the incidence of metabolic syndrome. |
| [60] (Sonoda et al., 2018) Japan | Cross-sectional study | Anthropometric measurement for BMI and WC. Self-reported eating speed. | n = 863 adult working men | >39, 40–44, 45–49, ≤50 | BMI: (Slow, very slow): 24.0 ± 3.3 kg/m2, Ordinary: 24.9 ± 3.8, fast: 26.1 ± 3.8, very fast: 27.0 ± 3.3. WC: (slow, very slow): 82.4 ± 8.0, ordinary: 85.3 ± 10.1 fast: 87.9 ± 9.9, Very fast: 89.0 ± 8.1. | Four categories: (Slow and very Slow), Ordinary, Fast, Very fast | + | + | There were significant differences in BMI and waist circumference between slow eaters and fast eaters in some age groups. |
| [61] (Xie et al., 2019) China | Cross-sectional study | Anthropometric measurement for BMI. Self-reported eating speed. | n = 536 college students. Male = 257, Female = 279. | Male: 22.07 ± 3.42, Female: 21.10 ± 2.73 | BMI: Underweight: 17.61 ± 0.76 kg/m2, normal weight: 21.14 ± 1.69 kg/m2, Overweight: 27.48 ± 2.19 kg/m2. | Four categories: Slow, Normal, Slightly fast, Fast. | + | NA | |
| [53] (Tanihara et al., 2011) Japan | Retrospective longitudinal study | Self-reported eating speed and BMI. | n = 529 male workers | 4 categories: 20–29, 30–39, 40–49, 50–59 | BMI: 23.7 ± 3.4 kg/m2. | Two categories: Fast, (Medium and Slow) | + | NA | In both baseline and follow-up studies, BMI and weight were related to eating speed. |
| [26] (Nagahama et al., 2014) Japan | Cross-sectional study | Anthropometric measurement for BMI and WC. Self-reported eating speed. | n = 56,865 men = 41,820, Women = 15,045 | Age Men: Slow 46.9 ± 12.3 Normal 46.9 ± 10.9 Fast 45.0 ± 10.4 Women Slow 43.5 ± 12.5 normal 47.2 ± 11.6 fast 46.7 ± 11.2 | BMI Men: Slow: 22.4 ± 3.3 kg/m2. Normal: 23.4 ± 3.3 kg/m2. Fast: 24.6 ± 3.7 kg/m2. Women; Slow: 21.0 ± 3.5 kg/m2. Normal: 21.8 ± 3.5 kg/m2. Fast: 22.5 ± 3.8 kg/m2. WC: Men: Slow: 80.3 ± 9.2 cm. Normal: 82.9 ± 9.0 cm. Fast: 86.0 ± 9.8 cm. Women: Slow: 75.5 ± 9.5 cm. Normal: 77.7 ± 9.4 cm. Fast: 79.6 ± 9.8 cm. | Three categories: Slow, Normal, Fast | + | + | Fast eaters were more likely to have central obesity compared to slow eaters. |
| [57] (Iwasaki, Hirose, Azuma, Watanabe, et al., 2019) Japan | Cross-sectional study | Anthropometric measurement for BMI and WC. VFA and SFA measured by CT. Self-reported eating speed. | n = 381 non-obese adults | 53 (45, 59) ¥ | BMI: 23.2 (21.4, 25.4) ¥ kg/m2 WC: 81 (76, 86) ¥ cm VFA: 98 (59, 140) ¥ cm2. SFA: 136 (101, 174) ¥ cm2. | Three categories: Slowly, Medium, Quickly | + | + | Eating speed was significantly associated with VFA, but not with SFA. |
| [58] (Mochizuki et al., 2014) Japan | Cross-sectional study | Anthropometric measurement for BMI and WC. Self-reported eating speed. | n = 900 healthy women | 53.1 ± 7.1 | BMI = 22.2 ± 3.2 kg/m2 WC = 77.0 ± 9.7 cm | Three categories: (Very Slow and Relatively Slow), Medium, (Relatively Fast and Very Fast) | + | + | |
| [27] (Wakasugi, Kazama, & Narita, 2018) Japan | Cross-sectional study | Anthropometric measurement for BMI. Self-reported eating speed. | n = 7941 adults | 66.9 1 ± 3.9 | BMI = 22.8 ± 3.5 kg/m2. | Three categories: Slow, Normal, Fast | + | NA | |
| [28] (Sakurai et al., 2012) Japan | Cross-sectional study | Anthropometric measurement for BMI. Self-reported eating speed. | n = 2050 middle aged men | 45.9 ± 6.0 | BMI = 23.4 ± 2.9 kg/m2. | Three categories: Slow, medium, fast | + | NA | After adjusting for age, eating speed was associated with obesity risk. |
| [62] (Shan et al., 2019) China | Cross-sectional study | Anthropometric measurement for BMI. Self-reported eating speed. | n = 536 undergraduates | 20(17–22) ¥ | BMI Categories: Underweight: 12.5% Normal: 73.9% Overweight and obese: 13.6% | Four categories: (Very slow and slow), Ordinary, Fast, Very fast | + | NA | Eating very fast was positively associated with overweight and obesity. |
| [59] (Hamada et al., 2017) Japan | Cross-sectional study | Anthropometric measurement for BMI, WC and BF%. Abdomen and Hip circumferences. Self-reported eating speed. | n = 84 female college students. | 19 ± 1 | BMI: 22 ± 3 kg/m2. BF%: 27 ± 4 WC = 69 ± 7 cm. Hip circumferences: 93 ± 6 cm. | Three categories: Fast, moderate, slow | + | + | The objective eating speed measurement was performed and had a similar result as subjective eating speed. |
| [54] (Oda-Montecinos, Saldaña, & Andrés, 2013) Chile | Cross-sectional study | Self-reported eating speed and BMI. | n = 292 adults | 38.3 ± 11.76 | BMI: 26.58 ± 4.39 kg/m2 | Two categories: Slow, Fast | + | NA | Fast eating was significantly different between normal weight and overweight subjects. There was no difference between genders. |
| [51] (Nanri et al., 2020) Japan | Follow-up study | Anthropometric measurements for BMI and WC. Self-reported eating speed | n = 1018 | Slow: 42.6 ± 9.7 Medium: 43.3 ± 8.2 Fast: 41.1 ± 7.9 | BMI: Slow: 21.7 ± 2.8 kg/m2 Medium: 22.4 ± 2.7 kg/m2 Fast: 23.1 ± 2.9 kg/m2 WC: Slow: 77.7 ± 7.0 cm Medium: 79.4 ± 7.4 cm Fast: 81.8 ± 8.1 cm | Three Categories: Slow (Very Slow and Relatively Slow), Medium, Fast (Relatively Fast and Very Fast) | + | + | Eating speed was related to BMI change during a three-year follow-up study. |
| [64] (Otsuka et al., 2008) | Cross-sectional | Anthropometric measurements for BMI. Self-reported eating speed | n = 3465 non-diabetic workers | Men: 48.2 ± 7.1 Women: 46.3 ± 6.9 | BMI: Men: 23.3 ± 2.6 kg/m2 Women: 21.8 ± 2.7 kg/m2 | Five categories: Very slow, Relatively slow, Medium, Relatively fast, Very fast | + | NA | Eating speed was positively related to energy intake in both sexes. |
| [65] (Otsuka et al., 2006) | Cross-sectional | Anthropometric measurements for BMI. Self-reported eating speed | n = 4742 men = 3737 women = 1005 | Men: 48.2 ± 7.1 Women: 46.3 ± 7 | BMI: Men: 23.3 ± 2.7 kg/m2 Women: 21.8 ± 2.8 kg/m2 | Five categories: Very Slow, Relatively Slow, Medium, Relatively Fast, Very Fast | + | NA | |
| Study/Country | Study Design | Methods | Participants | Age (year) | Obesity Indicators | Eating Speed | Outcome | Additional Information | |
|---|---|---|---|---|---|---|---|---|---|
| BMI | WC | ||||||||
| [42] (Tao et al., 2018) China | Cross-sectional study | Anthropometric measurement for BMI and WC. Self-reported eating speed. | n = 7972 adults With MetS and without MetS | 38 (31–48) ¥ | BMI ¥: Male Slow: 24.2 (21.8–26.8) kg/m2, Medium: 25.0 (23.1–27.0) kg/m2, Fast: 25.7 (23.5–28.1) kg/m2. Female Slow: 21.1 (19.1–23.1) kg/m2, Medium: 21.8 (20.2–24.1) kg/m2, Fast: 22.5 (20.524.8) kg/m2, WC ¥: Male Slow: 84 (78–92)cm, Medium: 87 (81–93)cm, Fast: 88 (83–95) Female Slow: 70 (65–76)cm, Medium: 72 (68–78)cm Fast: 73 (68–79) cm. | Three categories: Slow, Medium, Fast | + | + | Eating speed was significantly related to excessive salt intake in both genders but not related to excessive sugar intake in both genders. |
| [56] (Hurst & Fukuda, 2018) Japan | Longitudinal study | Anthropometric measurement for BMI and WC. Self-reported eating speed. | n = 59,717 adults with type 2 diabetes | 40–69 Slow: 46.5 ± 11.7, Normal: 48.1 ± 10.6, Fast: 46.6 ± 10.4. | BMI: slow: 22.3 ± 4.0 kg/m2, normal: 23.4 ± 3.9 kg/m2, Fast: 25.0 ± 4.4 kg/m2. WC Slow: 80.1 ± 10.6 cm, Normal: 82.8 ± 10.4 cm. Fast: 86.8 ± 11.1 cm. | Three categories: Slow, Normal, Fast | + | + | Lowering the eating speed was related to the reduction of BMI and WC. |
| [49] (Kudo et al., 2019) Japan | Cohort study | Anthropometric measurement for BMI and WC Self-reported eating speed. | n = 197,825 adults With diabetes, without diabetes | Age 63.7 ± 7.7 | BMI 22.9 ± 3.1 kg/m2, WC 83.2 ± 8.8 cm | Three categories: Slow, Moderate, Fast Subcategories: Non-fast (Slow and Moderate), Fast | + | + | After adjusting multiple factors (age, weight, blood pressure, etc.), fast eating speed was significantly related to developing diabetes. |
Publisher’s Note: MDPI stays neutral with regard to jurisdictional claims in published maps and institutional affiliations. |
© 2021 by the authors. Licensee MDPI, Basel, Switzerland. This article is an open access article distributed under the terms and conditions of the Creative Commons Attribution (CC BY) license (https://creativecommons.org/licenses/by/4.0/).
Share and Cite
Kolay, E.; Bykowska-Derda, A.; Abdulsamad, S.; Kaluzna, M.; Samarzewska, K.; Ruchala, M.; Czlapka-Matyasik, M. Self-Reported Eating Speed Is Associated with Indicators of Obesity in Adults: A Systematic Review and Meta-Analysis. Healthcare 2021, 9, 1559. https://doi.org/10.3390/healthcare9111559
Kolay E, Bykowska-Derda A, Abdulsamad S, Kaluzna M, Samarzewska K, Ruchala M, Czlapka-Matyasik M. Self-Reported Eating Speed Is Associated with Indicators of Obesity in Adults: A Systematic Review and Meta-Analysis. Healthcare. 2021; 9(11):1559. https://doi.org/10.3390/healthcare9111559
Chicago/Turabian StyleKolay, Ezgi, Aleksandra Bykowska-Derda, Safa Abdulsamad, Malgorzata Kaluzna, Karolina Samarzewska, Marek Ruchala, and Magdalena Czlapka-Matyasik. 2021. "Self-Reported Eating Speed Is Associated with Indicators of Obesity in Adults: A Systematic Review and Meta-Analysis" Healthcare 9, no. 11: 1559. https://doi.org/10.3390/healthcare9111559