Article

The Regionalization Process for Universal Health Coverage in Brazil (2008–2015)

by
Rafael da Silva Barbosa
1,* and
Eduardo Fagnani
2
1
Social Policy Graduate Program, Department of Social Services, Goiabeiras, Federal University of Espírito Santo, Vitória 29075-910, Brazil
2
Economic Development Graduate Program, Institute of Economics, Barão Geraldo, State University of Campinas, Campinas 13083-970, Brazil
*
Author to whom correspondence should be addressed.
Healthcare 2021, 9(10), 1380; https://doi.org/10.3390/healthcare9101380
Submission received: 19 May 2021 / Revised: 7 June 2021 / Accepted: 10 June 2021 / Published: 15 October 2021
(This article belongs to the Special Issue Inequalities in Environmental Exposure and in Health Care)

Abstract

:
The objective of this article is to analyze the development of the public and private offer for the universalization of health services, specifically, for the progression of the public network. The time period examined is from 2008 to 2015, when there was considerable economic growth and expansion of private health insurance and an unprecedented historical period with economic growth and reduction of social inequality. Across 5570 municipalities, the multivariate analysis model was used to estimate the level of concentration and the imbalance (heterogeneity) of installed health capacity of the network of health care services. Public spending on investment and human resources showed positive variation in all regions and in almost all population strata. The offer by the Unified Health System (public) of primary health care increased by 8000 new establishments in all regions, especially in previously uncovered cities and cities that had shortages of public health services. Public universalization almost reached its maximum, with about 70% of municipalities. The only setback was the significant reduction of 50% in the number of private establishments in primary health care services. The data suggest a positive movement toward the universalization of health services in Brazil, with the concentration of high-complexity care and the heterogeneity of the installed capacity being points for improvement.

1. Introduction

In Brazil, the Constitution establishes in its Article 196 that “Health is a right of all and a duty of the State and shall be guaranteed by means of social and economic policies aimed at reducing the risk of illness and other hazards and at the universal and equal access to actions and services for its promotion, protection and recovery” [1]. The Federal Constitution of Brazil was promulgated on 5 October 1988, and it is relatively new in comparison with other countries, with its few years of existence, as is the regionalization of health in Brazil. Since the redemocratization of the country, which culminated in the creation of the Unified Health System (SUS) in 1988, there have been four main cycles [2], namely, absolute decentralization, relative decentralization, regional decentralization, and hierarchical regionalization.
From its inception, SUS regional policy had to overcome the contradiction between the centralization and decentralization of services. The expansion had to be guided by the decentralization of primary services not yet available in several regions of the country and, at the same time, centralize highly technological services without penalizing the most distant cities. This would ensure both the scale necessary for cost reduction and simultaneously increase full coverage of low-, medium-, and high-complexity care.
The economic and political context at the time opened possible areas for advancement [2]. The first cycle saw the simple transfer of competence from the federally centralized health services to subnational entities (states and municipalities). This absolute decentralization of health services was not accompanied by greater autonomy of fiscal revenues for states and municipalities; hence, the second cycle sought to formulate new mechanisms for tax and sector transfers to correct these disparities. The objective was to distribute resources according to the volume of installed capacity of each region. However, instead of correcting matters, this mechanism only reinforced the disparities with a new type of federal transfer reconversion. The rule ended up benefiting mainly the major cities holding the largest health care budgets.
This regional policy only achieved concrete results with the beginning of the third cycle, which forged the first effective mechanism for regional health care decentralization. The Basic Operational Norm, in 1996 [3], innovated by creating the fixed per capita transfer of the primary care level (in Portuguese, the Piso de Atenção Básica Fixo or, PAB-FIXO). The proportional correction introduced by this new mechanism permitted major adjustments to the regional differences. Unlike the previous cycle, the PAB-FIXO linked the federal transfer of resources to population size and not to the volume of the installed capacity and; in this way, it produced the desired effect.
The redistributive process created by the PAB-FIXO strengthened municipal actions in the less favored regions, which, when added to the good results of the Family Health Strategy [4], generated a change in the level of quality health care and coverage, proving itself to be the first qualitative instrument of a regional character for health [5].
In the wake of these innovations, the 2006 Pact for Health [6] modernized the concept of regional health care decentralization and began the fourth cycle. This perspective came to be understood as an association between technical capacity (economies of scale) and policy (federal pacts) to guarantee the investments and resources necessary for change [2] within a framework in which the federal entities were prohibited from taking on any responsibilities.
It was intended that, in this process, national and state strategies should prioritize investment projects that strengthened SUS regionalization. The integrated development plans (IDPs) would serve to operationalize actions, guaranteeing the mapping of the distribution and supply of health services in each regional area within the parameters of (a) the incorporation of technologies, permitting economies of scale, and (b) scope, ensuring equity of access [6].
The IDPs, together with the stabilization of the flow of resources secured by Constitutional Amendment 29, 2000 [7], consolidated the implementation of the fourth cycle. These factors ensured a broader and more integrated perspective for transformations to reduce regional inequalities, which are to be supported by the expansion of state and federal public investment [2] (p. 49).
In order to overcome fragmented health actions, the directives of Ordinance N°. 399 of the Pact for Health limited the operation of regional policy to parameters of scale and the federal pacts, in order to generate a hierarchy of actions [8]. The objective was to draw attention to the fact that the universalization of medium- and high-complexity care could only be achieved with the greater participation of the states and the Union.
The growth of the Brazilian economy between 2006 and 2014 allowed the implementation of the regional strategy of SUS public health policy. Economic booms contributed to increasing the effectiveness of the policy by alleviating the financial bottlenecks experienced by municipalities, states, and the Union [9].
Over the years, the results of regional health policy have been instrumental in reducing imbalances in the offer and in improving health conditions across all socioeconomic groups. According to a World Bank publication [4], in the 20 years of the building of the health system in Brazil, the SUS has brought regional gains of the highest relevance to the quality of health in Brazil. Geographic inequalities in health have been significantly reduced, with Northeast states receiving most of the benefits. Historically, the poorest regions of Brazil are the Northeast and North regions. Regional health policy has consolidated the universalization of primary health care and considerably expanded the medium-complexity outpatient network, reducing, in part, the pressure experienced by the municipalities in this specialism. Therefore, the analysis was made over an unprecedented historical period with economic growth and reduction of social inequality (Figure 1).

2. Materials and Methods

Studies on the Unified Health System (SUS) do not include their complementary elements within the private sector. These quantitative analyses evaluate SUS across its timeline without considering private participation. Although these studies characterize the public–private mixture profile of each segment of the Brazilian health system, estimates about the results are made separately [10]. We seek, therefore, to analyze the two partners (public and private) jointly across the 5570 Brazilian municipalities to understand the development of regional health policy.
Databases were extracted from the databases of the Brazilian Institute of Geography and Statistics (IBGE), Ministry of Health (MS), National Occupation Classification (CBO), and the National Agency for Supplementary Health (ANS) for the period from 2008 to 2015. Outlier methodology was used to calculate the quartiles (Q1 and Q3) and the interquartile interval (IQR) for a parameter of 1.5 to health expenditure. As these data are declarative, it is necessary to be more cautious with basic data. The law establishes that the respective federal transfers of health would only occur through the mandatory completion of health data by states and municipalities. Thus, each federal entity declares the information required by law. Despite the declaratory character of the information, this aspect qualitatively altered the robustness of the SIOPS database, which continues to guarantee the completion and continuity of the data series.
Of all variables analyzed (Table 1), expenditures on human resources, investment, primary, medium-, and high-complexity care are the most recent but least studied and published, within the scope of microdata for the 5570 municipalities. This is because it was only with the passing of Supplementary Law No. 141, dated 13 January 2012 [11], that it became mandatory to return these financial data as a condition for the transfer of funds. These data contribute to the improvement of information around the decentralization of SUS [12]. The data quality of the Public Health Budgeting System (SIOPS) has improved between 2008 and 2015. The payout was selected similar to the stage of budgetary (There are three stages of budget in Brazil: committed (empenhado), pay-off (liquidado) and pay-out (pago).) execution to analyze the data. For data treatment, the outlier methodology was used to smooth out possible distortions, since the source of information is declaratory, i.e., the municipalities are responsible for providing the data, not the federal government. Thus, there is no business intelligence (BI) for the process of collecting, organizing, analyzing, sharing, and monitoring information of SIOPS data.
For the quartiles (Q1 and Q3) and the interquartile interval (IQR) for a parameter of 1.5, where
  • IQR = Q3 − Q1;
  • Lower outliers < Q1 − IQR × 1.5;
  • Superior outliers > Q3 + IQR × 1.5,
observations outside the range [Q1 − IQR × 1.5 < data < Q3 + IQR × 1.5] were considered as outliers.
All the variables of the SIOPS database showed decreased amounts of absent (unavailable) information and presented better consistency within the information. Overall the number of “absent” and outliers fell by 6% (339–320) in human resource expenditure and 14% (615–528) in investment. The same happened with primary care and medium- and high-complexity care, which fell 20% (644–514) and 49% (3541–1792), respectively.
The regions that most improved the recorded data were the North and Northeast, in cities with less than 50,000 inhabitants.
The analysis of the data employed multivariate analysis to evaluate the specificities of the information within the regional context of the country. This approach was chosen because of its analytical capabilities to include “an ever-expanding set of techniques for data analysis that encompasses a wide range of possible research situations” [13] (p. 15). In this article, the techniques of factor and principal component analysis, Ward’s cluster analysis, and k-means clustering were applied to the Brazilian experience [14]. The technique is suggested due to its sharper focus. In view of many variables, it is possible to select the main variables relevant to the construction of the groups, moving toward the study’s goals.
Schematically, the objective of the factor and principal component analysis is “to find a way of condensing the information contained in a number of original variables into a smaller set of variables with a minimal loss of information” [13] (p. 16). When selecting the main variables, the technique for building the clusters was applied. Ward’s cluster analysis method, because of its hierarchical technique, assisted in the choice of the number of clusters to be formed. K-means clustering was then used for the definitive structuring of the clusters. In other words, the first step was applied principal component analysis to find the original variables; next and in the second step, standard Z was applied to the original variables to use Ward’s cluster analysis; third, Ward’s cluster analysis (hierarchical) was applied to build a dendrogram and visualize the best cut; finally, with the fourth step, the k-means clustering method was used for final clustering.
Table 2 shows the set of variables used in the factor analysis. The variables express demand (population) in relation to the supply factors of public installed capacity in health.
Factor analysis resulted in 3755 observations. According to Table 3, Factor 1 accounted for 74% of the total variability, while Factor 2 accounted for 14%, making clear the degree of importance (weight) of the first factor, in terms of the data variance, in relation to the second.
Table 4 provides the factorial loads for the selection of the original variables. The selection procedure was by the interpretation of the measurement of sampling adequacy (MSA), in which 0.80 or above is meritorious, 0.70 or above is middling, 0.60 or above is mediocre, 0.50 or above is poor, below 0.50 is unacceptable [13].
Thus, of the 15 variables listed for the grouping, 9 variables were most relevant to the formation of clusters.
The results of Table 4 indicate that the main relevant variables are population, human resource expenditure (SUS), expenditure on primary health care (SUS), expenditure on medium- and high-complexity health care (SUS), primary public outpatient care, medium-complexity public outpatient care, public nursing assistants and technicians, and public nurse and public physician because they register factor loads higher than 0.5. These factors also present the lowest parameters of uniqueness of less than 0.5.
After the selection of the variables, the standard Z score of the original variables was used to construct the dendrogram below (Figure 2). The dendrogram suggests a cut in four clusters that are detailed in the results of this article according to k-means clustering.

3. Results

3.1. Health Expenditure

The analysis of the monetary value of public health expenditure “in” the municipalities showed that human resource expenditure increased from the year 2008 to the year 2015 in all regions and in almost all population strata of the country, constant Brazil (BRL) prices of 2015. The term “in” represents municipal expenditure made from all sources of available health resources—federal, state, and own resources managed by the city [15]. The South, Midwest, and Northeast regions stood out the most, growing above 50% on average, considering the exchange rates of 2008 (USD 0.5450) and 2015 (USD 0.3001). In the South, the effect was basically due to the increase in spending in all cities, but especially in those with a population between 20 and 50 thousand inhabitants. The Northeast region followed the same pattern but with one difference: the cities between 500 thousand and 1 million were those responsible for increasing personnel expenditures. In cities above 1 million inhabitants, there was a 20% drop in expenses under this heading (Table 5).
It is important to note that Brazil has 5570 cities, clustered in 26 states plus one Federal District, which are grouped within five geoeconomic regions—North, Northeast, Midwest, Southeast, and South. The Brazilian geoeconomical regions are North (No), which groups the states of Acre (AC), Amapá (AP), Amazonas (AM), Pará (PA), Rondônia (RO), Roraima (RR), and Tocantins (TO); Northeast (NoE), with Alagoas (AL), Bahia (BA), Ceará (CE), Maranhão (MA), Paraíba (PB), Pernambuco (PE), Piauí (PI), Rio Grande do Norte (RN), and Sergipe (SE) states; Midwest (MiW), with the Federal District (DF) and the states of Goiás (GO), Mato Grosso (MT), and Mato Grosso do Sul (MS); Southeast (SoE), with Espírito Santo (ES), Minas Gerais (MG), Rio de Janeiro (RJ) and São Paulo (SP); and South (So), which includes the states of Paraná (PR), Santa Catarina (SC) and Rio Grande do Sul (RS). The North and Northeast regions of Brazil are historically poor regions and have always had low levels of public health services. Southeast and South are rich regions with considerable levels of service offer. The Midwest is a relatively new region, where occupation effectively started in 1950.
Public investment was lower in relation to human resources; this is due to the particularities of the health sector [16]. The production of services is labor intensive, and its operation consumes a good part (in Brazil, on average, 70% [17] of the establishment’s resources [18]. It grew in all regions, except in the Southeast with a 30% drop. The low investment inversion occurs mainly in the 24 largest cities that make up the medium-large stratum and two larger cities within the large group, Campinas (SP state, SoE region) and Curitiba (capital, PR state, therefore, So region) (Table 6).
Despite their population size, medium-large cities show considerable year-to-year fluctuations in their investment expenditures. Some of the highlights are the cities of Sorocaba (SP, SoE), João Pessoa (capital, PB, NoE), and Duque de Caxias (RJ, SoE), which together drastically reduced their investments, with the former dropping from the millions to the thousands. The cities of Ananindeua (PA, No), Uberlândia (MG, SoE), Ribeirão Preto (SP, SoE), Santo André (SP, SoE), and Campo Grande (capital, MS, MiW) also presented considerable decrease. These variations suggest a certain structural constraint to the continuous and consistent expansion of expenditures, where a large part of these municipalities is still sensitive to federal transfers. This is different in the cases of Campinas (SP, SoE) and Curitiba (PR, So), both cities with a population of more than 1 million inhabitants, which are cities with some stability in their own resources but which show a fall in expenditure.
Despite this, some cities increased investment spending, with the expansion of network service. In the medium-large stratum, the cities of Cuiabá (capital, MG, MiW) and Teresina (capital, PI, NoE) and the large cities of Belém (capital, PA, No), Rio de Janeiro (capital, RJ, SoE), and Porto Alegre (capital, RS, So) doubled their expenditure.
The analysis of the health blocks indicates that there was an increase in primary health care spending in all regions of the country. The Southeast, South, and Midwest regions increased more than half of their expenditures. Cities with less than 20,000 inhabitants and large cities were responsible for this increase; the variation of these groups reached 43% and 165%, respectively (Table 7).
Medium- and high-complexity care contracted in almost all regions, except in the Southeast, an effect caused, in part, by cities with less than 20 thousand inhabitants that do not have such a service. However, others consistently increased their average expenditures, especially in cities with a population between 50 thousand and 500 thousand inhabitants. (Table 8).
In this analysis, two types of increase in public health coverage were observed. One linked to the benefits of investment growth in the same direction as medium- and high-complexity care, and another with a rather negative profile, in which investments fell alongside an increase in medium- and high-complexity care spending, suggesting unplanned commercialization of public services.
The Northeast and Midwest regions were the areas where the greatest increase in spending was observed, specifically in the medium-large and large city strata, where investment increased by the same amount as medium- and high-complexity care spending. On the contrary, the Southeast region was the prime location for the expansion of the medium- and high-complexity care with steep drops in investment, especially in the small-middle city strata. The Southeast region was the only one to grow above 50% of the average municipal expenses in medium- and high-complexity care, going from BRL 13 million to BRL 21 million.
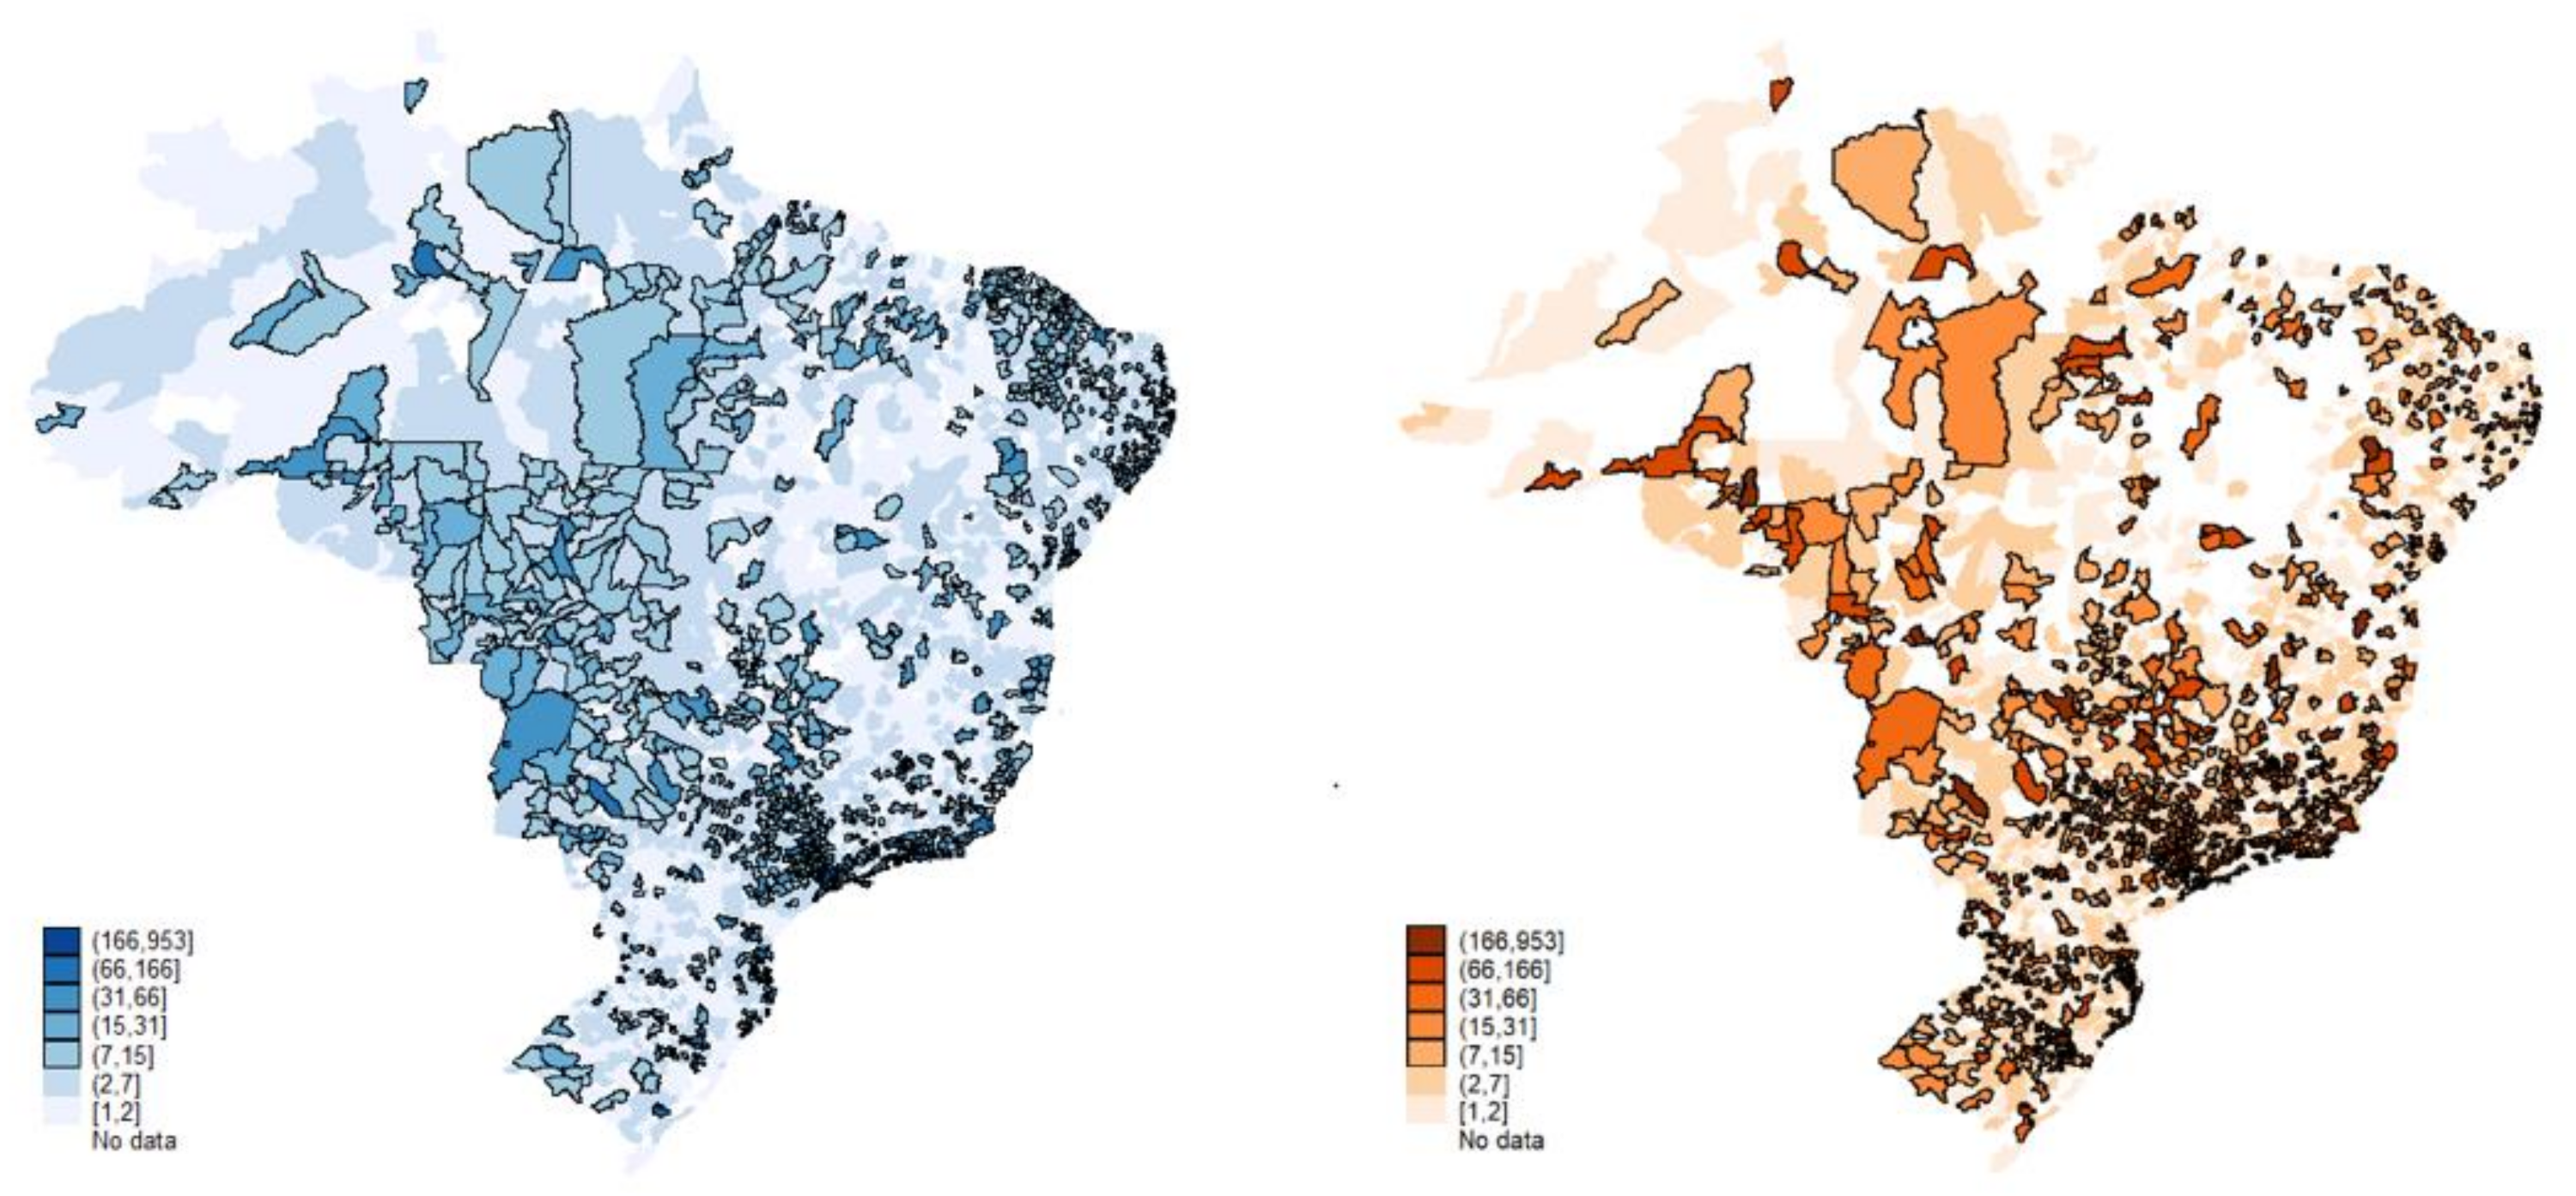
However, the expansion of public spending was largely permitted by the growth of the economy in the period between 2006 and 2014 and the increase of fund-to-fund transfers by the federal government. This has reduced some disparities in the distribution of resources. The years analyzed were marked by the growth of public spending, mainly in primary care and consistently in the strata for medium-/high-complexity care. Without this, perhaps, Figure 3 would present greater imbalances than those already evident.

3.2. Concentration and Imbalance

The public installed capacity in primary care grew by 8000 units across all regions, with the North and the South growing by 22% and 19%, respectively. Between 2008 and 2015, public supply surpassed the private network in absolute and relative terms, as seen in Table 9. However, the change is more due to private reduction than an increase in public supply. Negative changes in the private sector averaged 50% in almost all regions, with the Midwest and South regional changes being more pronounced (57% and 55%, respectively). Across all primary care units, the participation of the private sector showed a strong exit trend, falling from 49 thousand to 23 thousand in the period.
In fact, the average number of public primary health care units per municipality increased in all regions of the country. The North and Northeast regions increased by 2 points (9.5–11.5 and 10.2–12.1, respectively), while the private sector registered a consistent average reduction of its establishments, falling from 21.9 to 12.
The data suggest that there has been great progress in the universalization of primary care by SUS. Regionalization expanded in the regions and municipalities identified by the service, especially in small towns (0 to 50 thousand inhabitants). There was also a gradual inclusion of medium-sized urban centers (100 thousand to 500 thousand inhabitants) and the maintenance in absolute terms of the network in large cities (over 1 million inhabitants) with the dispersal of the establishments (Table 10).
The private sector shows considerable declines, both in absolute and average numbers of primary facilities in all regions and population strata. In almost all regions, falls were above 50%. The only exception was the North region, which already has a small number of primary care units (963 to 870 establishments), with a reduction of approximately 10%.
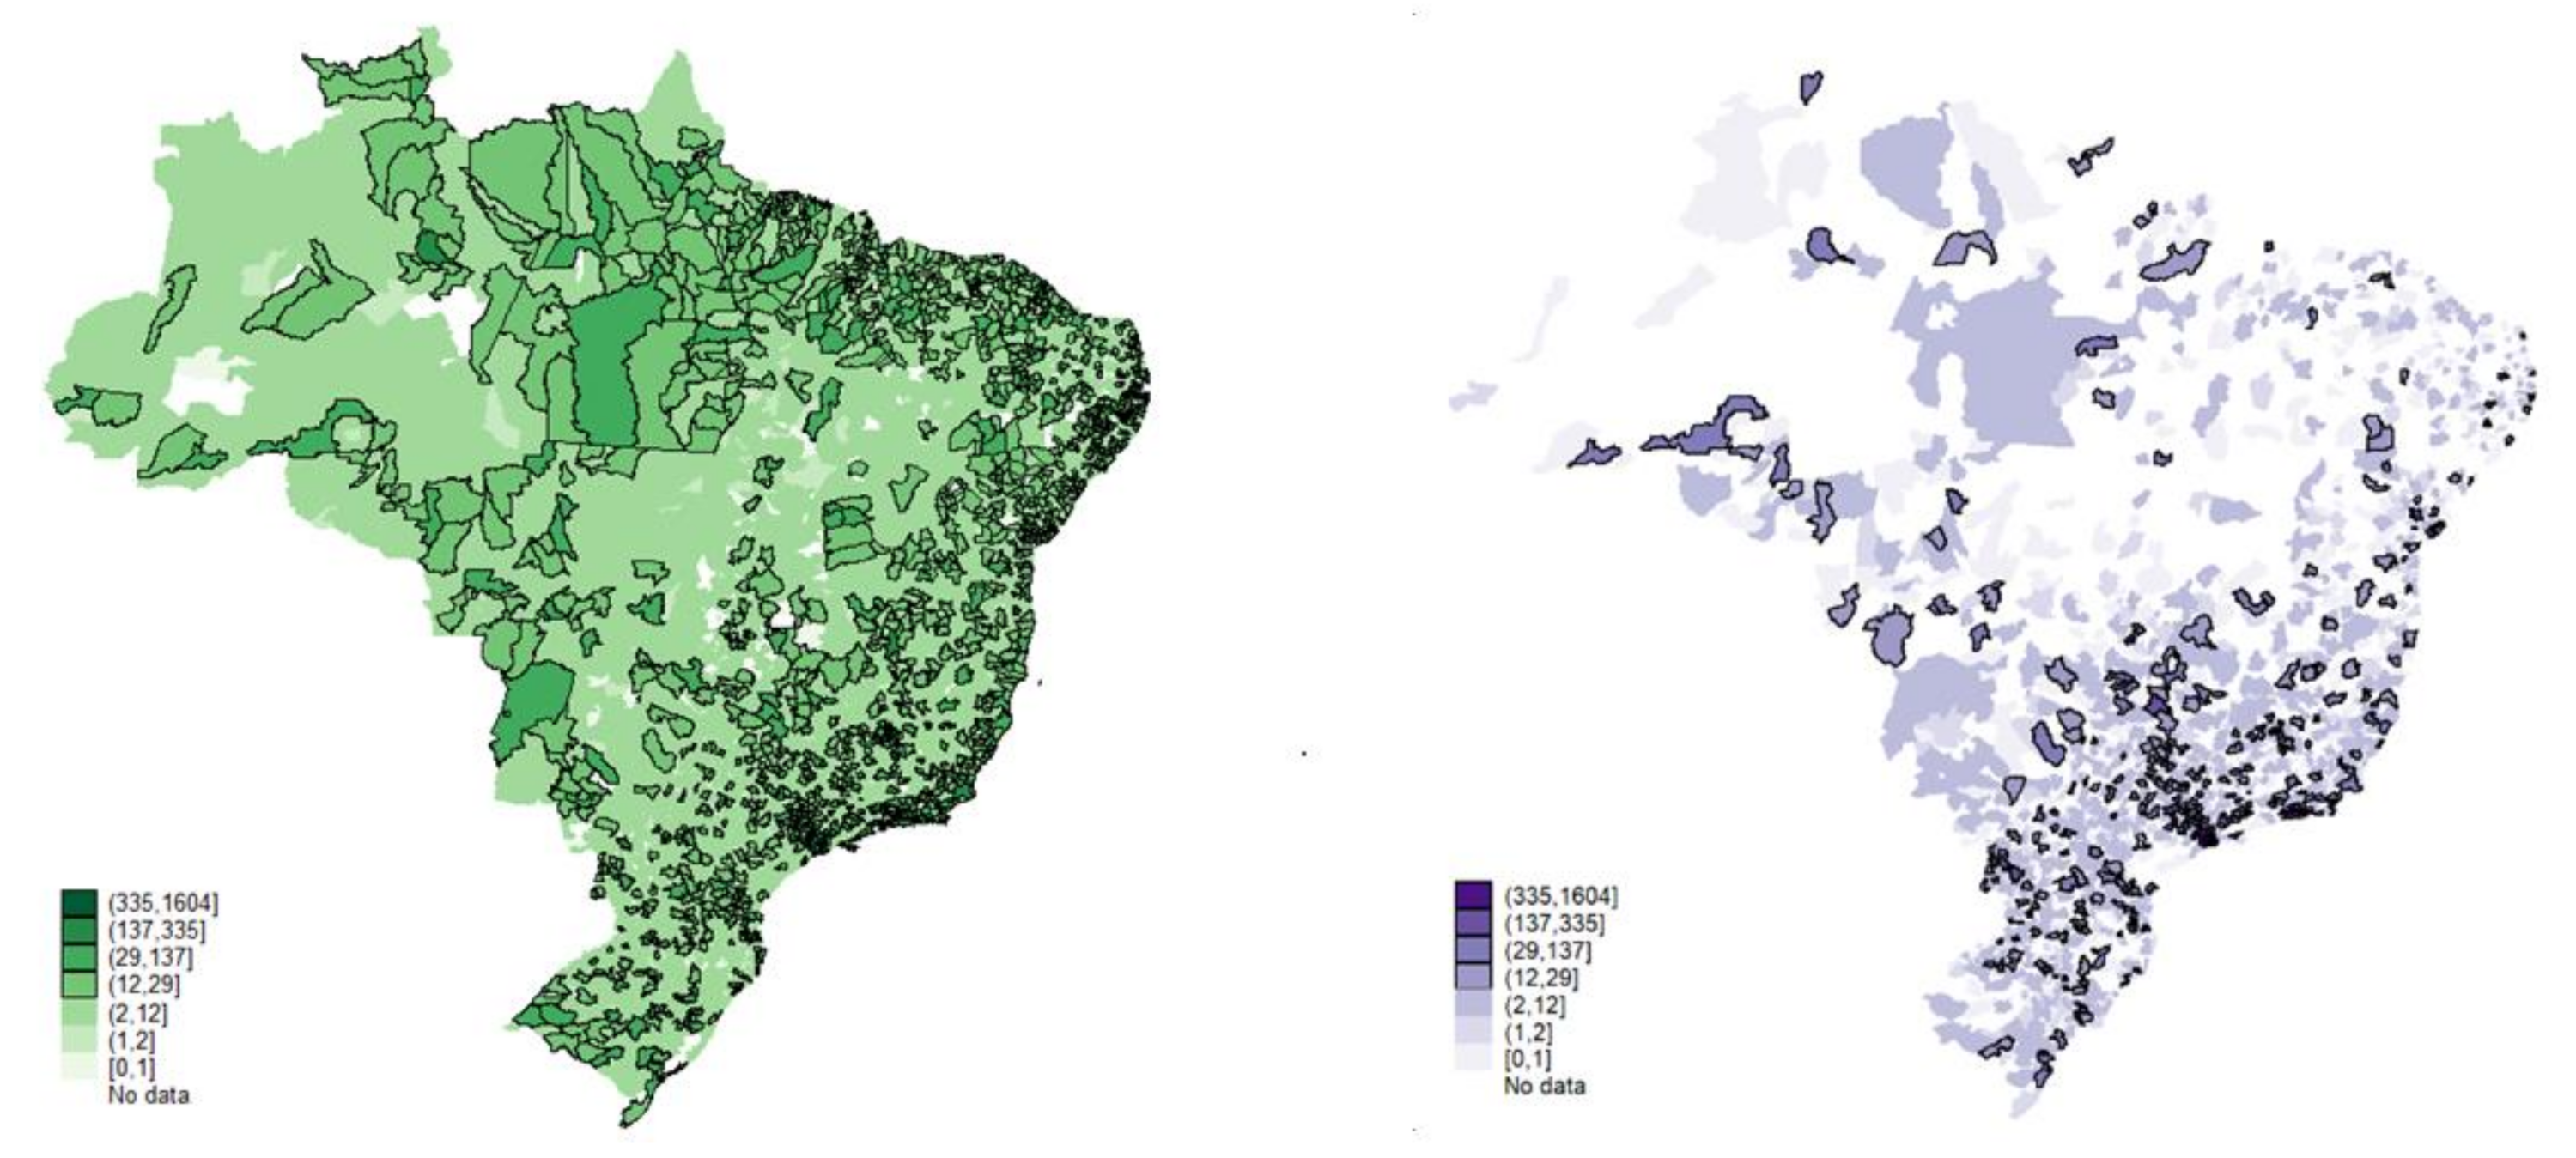
As a result, Figure 4 shows that 70% of the municipalities (mostly cities with up to 20 thousand inhabitants) have, on average, six public primary health care establishments. The municipalities with up to 50 thousand inhabitants have, on average, 14 units, revealing a greater regional homogenization (the term “regional homogenization” refers to the regional disparity network offering service) of the public installed capacity in primary health care, with the geographic inequalities in health outcomes significantly reducing. The geographical visualization allows us to assert that for primary health care, there was, in fact, almost complete universalization of the installed capacity. The low level of voids in primary health care establishments across the country is a sign of this. There are few localities with public health care gaps.
The private sector, on the contrary, presents considerable geographic gaps. The sector has, on average, two primary establishments in the small towns and six in the municipalities with up to 50 thousand inhabitants. This is in the context of a sharp increase in private health insurance [19].
The analysis of the evolution of medium-complexity health care in the period (2008–2015) reveals a consistent growth in the installed regional capacity, mainly in the form of emergency care units (UPAs). Table 11 shows that there was an increase of more than 60% in public medium-complexity health care capacity in all regions. The South and North regions registered more significant expansions in the medium-complexity outpatient health care mode.
This increase in public medium-complexity health care facilities mainly took place in cities with less than 20 thousand inhabitants that expanded their installed capacity by 7696 units, and cities between 20,000 and 50,000 inhabitants, with 3674 new units (Table 12).
In the medium-complexity hospital care mode, the Midwest region is the main highlight with a significant increase of 135% (M/hosp), followed by the Northeast and North regions with 58% and 53%, respectively. With respect to high-complexity care, public hospital establishments have strongly decreased their presence in almost all regions [20]. The overall reduction in the high-complexity hospital care mode was 17% (H/hosp) in total. The Northeast and South regions had the highest contractions of 35% and 42%, respectively. The North region was the only one to generate growth of installed capacity in this period. Cities with 500,000 to 1 million inhabitants and those with more than 1 million inhabitants were responsible for reducing the number of high-complexity care hospitals, especially in the Southeast and Northeast regions.
Table 13 shows that the North region had the greatest expansion in the installed capacity of private units for medium-complexity outpatient care, approximately a 60% expansion, followed by the Midwest region with a 10% increase. Similar to the public sector, in absolute terms, small cities with less than 50 thousand inhabitants were the ones that collaborated most in the growth of private installed capacity for medium-complexity care (Table 14).
The same is true in the high-complexity hospital sphere, which, during 2008–2015, also expanded in absolute and relative terms. The national average growth was 31% (80% in the North region and approximately 50% in the Midwest region). The elevated average of private establishments in almost all modalities in medium- and high-complexity care are the result of imbalances in the network. The analysis of the absolute values in the private sector according to population strata verifies that this expansion was highly concentrated in medium and large cities.
In large cities (above 1 million), the average of private medium-complexity outpatient facilities was eight times higher than the average of the public network (about 20 thousand more units). The network of private medium-complexity care hospitals (M/hosp) also grew in the period, although to a lesser degree to those of high complexity. The North and Midwest regions (36% and 29%, respectively) were the highlights. This expansion was concentrated in small (50,000 to 100,000 inhabitants) and medium-sized cities (100,000 to 500,000 inhabitants). As for high-complexity care (H/hosp), the expansion of the private network was even greater, especially in the North and Southeast regions, whose expansion reached 56% and 17%, respectively.
In summary, the public regionalization of medium-complexity outpatient facilities indicates that there has been decentralized growth in many of the country’s cities, except for the medium-large (500,000 to 1 million) and large (over 1 million) strata, thus covering previously undersupplied regions. The private sector expanded its installed capacity in all modes of medium- and high-complexity care, possibly in a move for higher profit margins.
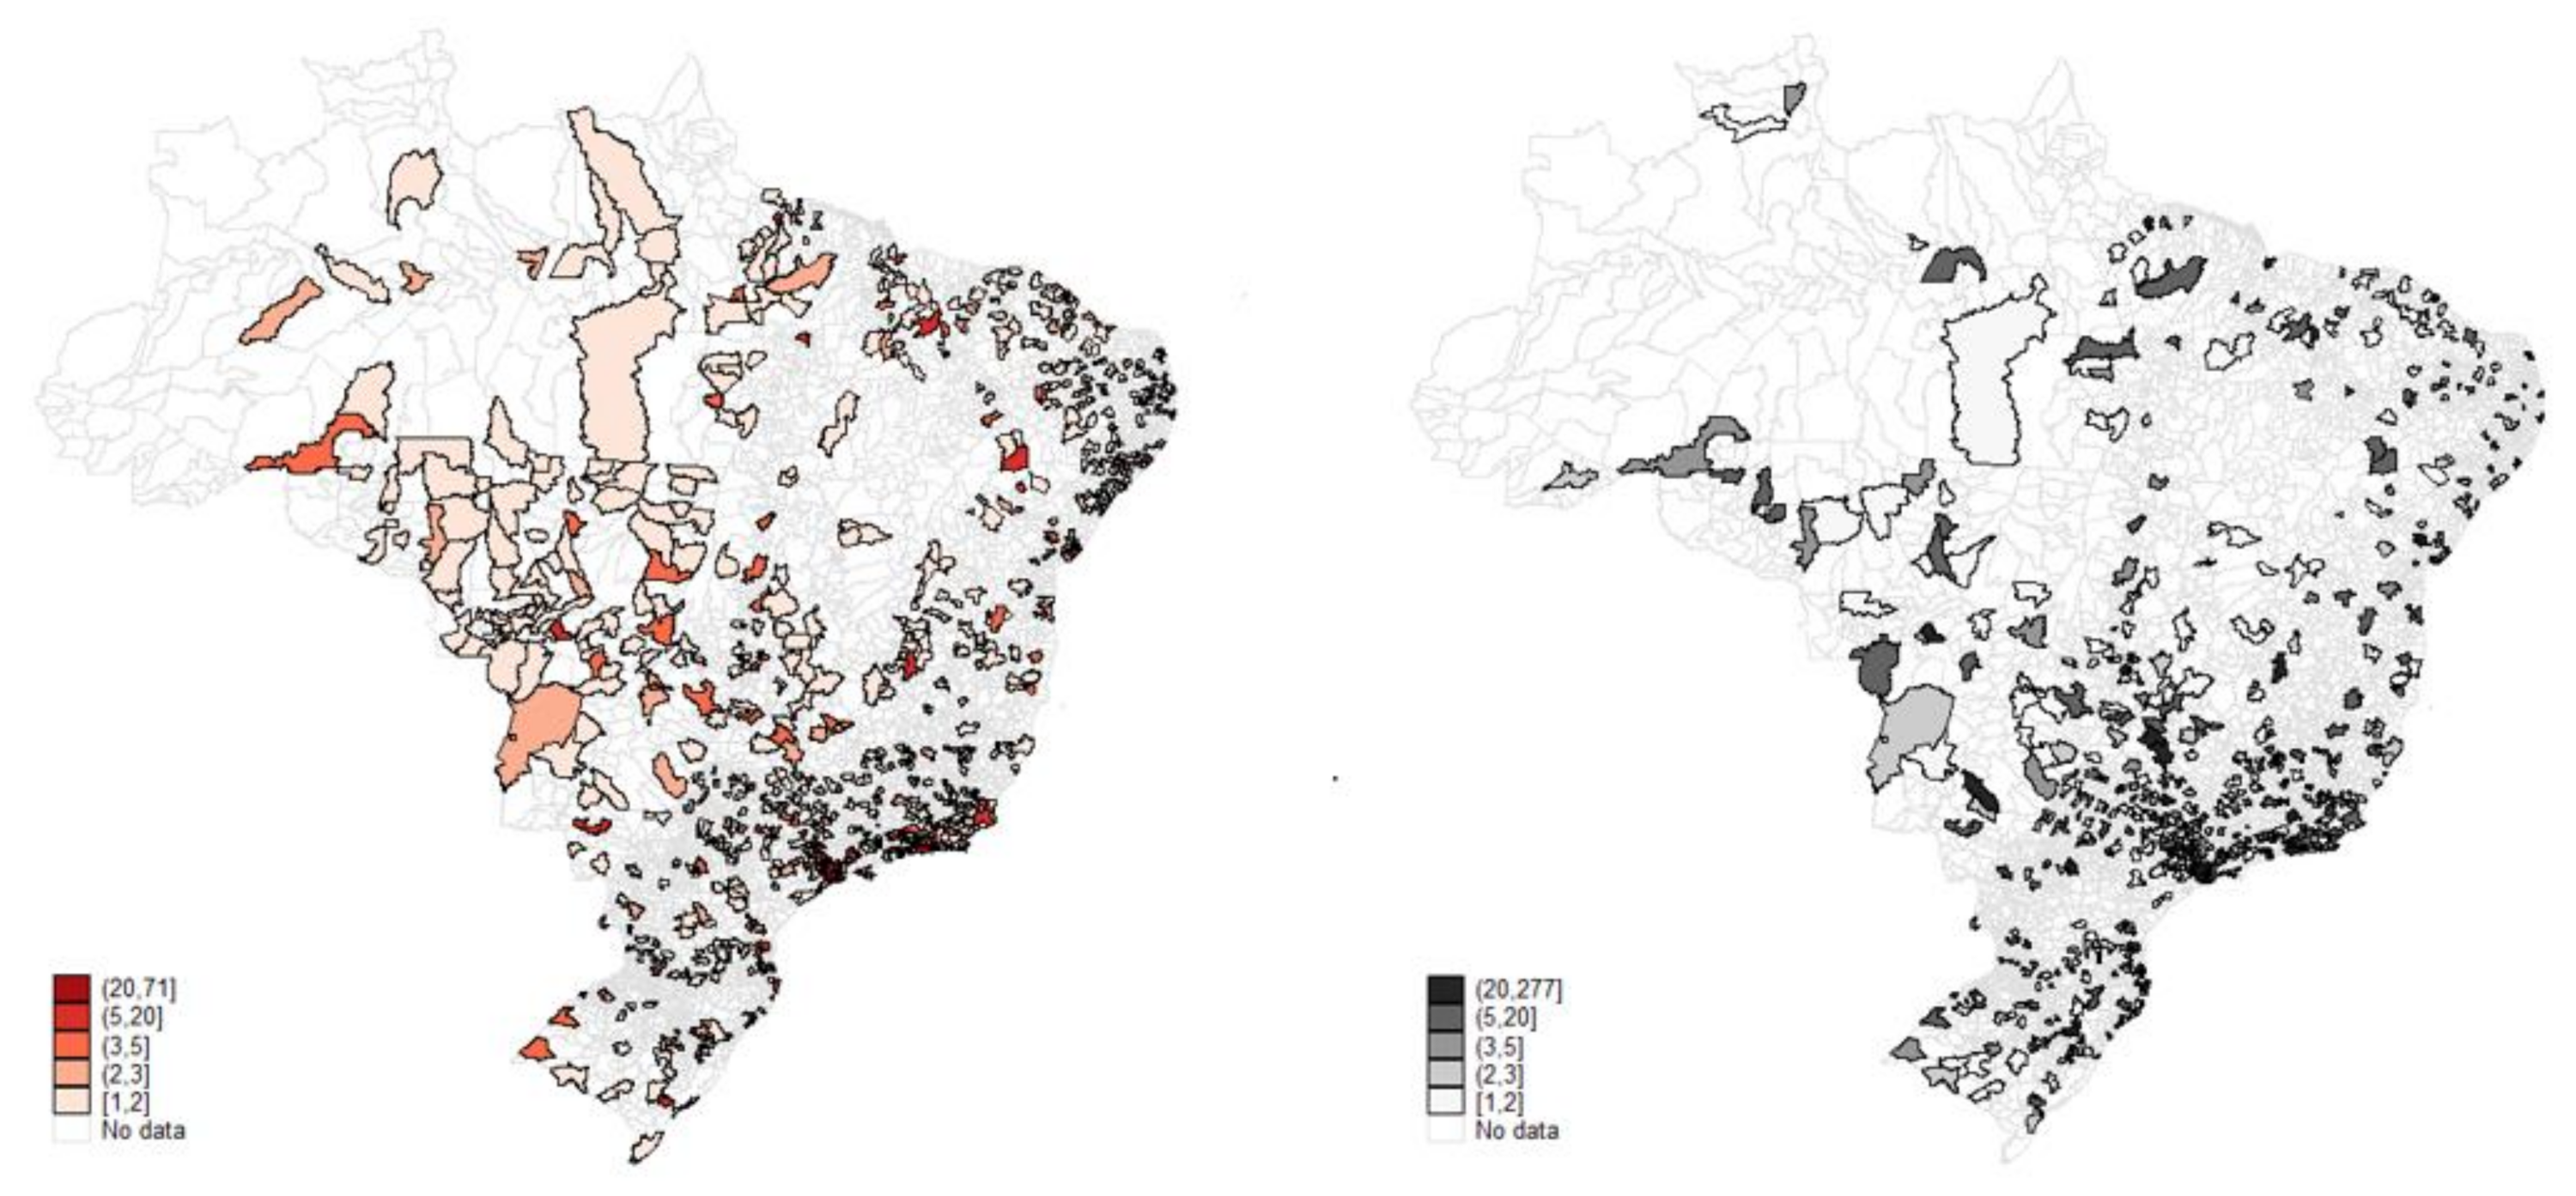
At first glance, the maps (Figure 5 and Figure 6) suggest that the two health care sectors appear to operate in the same localities with a slight reduction in private practice in some regions. However, it must be remembered that the private sector serves only 25% of the Brazilian population, while the public covers 75%. On average, the structures are almost equivalent regionally, with the greatest contrast in the high-complexity care mode, where the public covers most of the country’s territory.

3.3. Work in Health

During the analyzed period, SUS expanded human resources across Brazil. One of the constraints of this process was the Family Health Strategy (Estratégia Saúde da Família-ESF, in Portuguese) Program. Between 1998 and 2010, the ESF program grew rapidly from 4000 teams to over 31,600 and was able to expand coverage from 10.6 million to over 100 million registered people [4].
The Family Health Strategy was inspired by the Community Health Agents Program (Programa de Agentes Comunitários de Saúde-PACS, in Portuguese), a community health initiative piloted in rural areas of Ceará during the 1980s. The Family Health Strategy (ESF) was initially developed in parallel with the PACS, gradually replacing it. It was designed to provide first-contact, comprehensive, and whole-person care coordinated with other health services, emphasizing care that takes place within the context of family and community. In the ESF, multiprofessional health teams (composed of a physician, a nurse, a nurse assistant, and four to six community health workers) are organized by geographic regions, with each team providing primary care to approximately 1,000 families (or about 3500 people) [4].
Increased federal transfers and the expansion of private insurance also contributed to the expansion of health jobs. Public and private health sector job position offers increased in all regions and population strata, and the public occupational profile became more homogeneous between 2008 and 2015. The standard deviation of occupation for the four analyzed health worker groups in the public sector was almost 60% lower than in the private sector, where the North, Northeast, and South regions presented greater homogeneity. In both public and private segments, the growth in employment did not significantly alter the relative composition of the supply of physicians, nurses, nursing assistants, and technicians, but a larger difference can be observed between the number of nurses, nursing assistants, and technicians in the private sector, in a movement possibly caused by occupational substitution (Table 15 and Table 16).
Cities of 0 to 100 thousand inhabitants are largely responsible for the growth in all occupations. The increase in the number employed in the three groups of health professionals (n. assist/tech, nurse, and physician) working in the SUS (136 thousand) was much higher than in the private sphere (23 thousand).
Cities from 0 to 50 thousand inhabitants increased the absolute number of SUS physicians by about 31 thousand, while the private sector created only 539 new jobs. The largest absolute variation in the number of SUS physicians (35,000) was mainly concentrated in the medium-sized cities (100,000 to 500,000 inhabitants), while in the private sector, the expansion was concentrated in cities with more than 1 million inhabitants, with 30,000 more employed (Table 17 and Table 18).
In large cities, the increase in the number of SUS physicians, from 105 thousand to 124 thousand, was accompanied by a drop in the average number of these professionals per city, from 7.5 thousand to 6.5 thousand, suggesting an increase in the number of physicians but less geographically concentrated, thus improving geographical distribution. While in the private sector, the increase in the absolute number of occupations of physicians, from 84 thousand to 115 thousand, across the same stratum suggests a higher concentration of professionals, which increased from 6000 to 8200, that is, the public system is expanding supply in all regions of the country, especially in medium-sized cities, while the private sector is more concentrated in large cities.

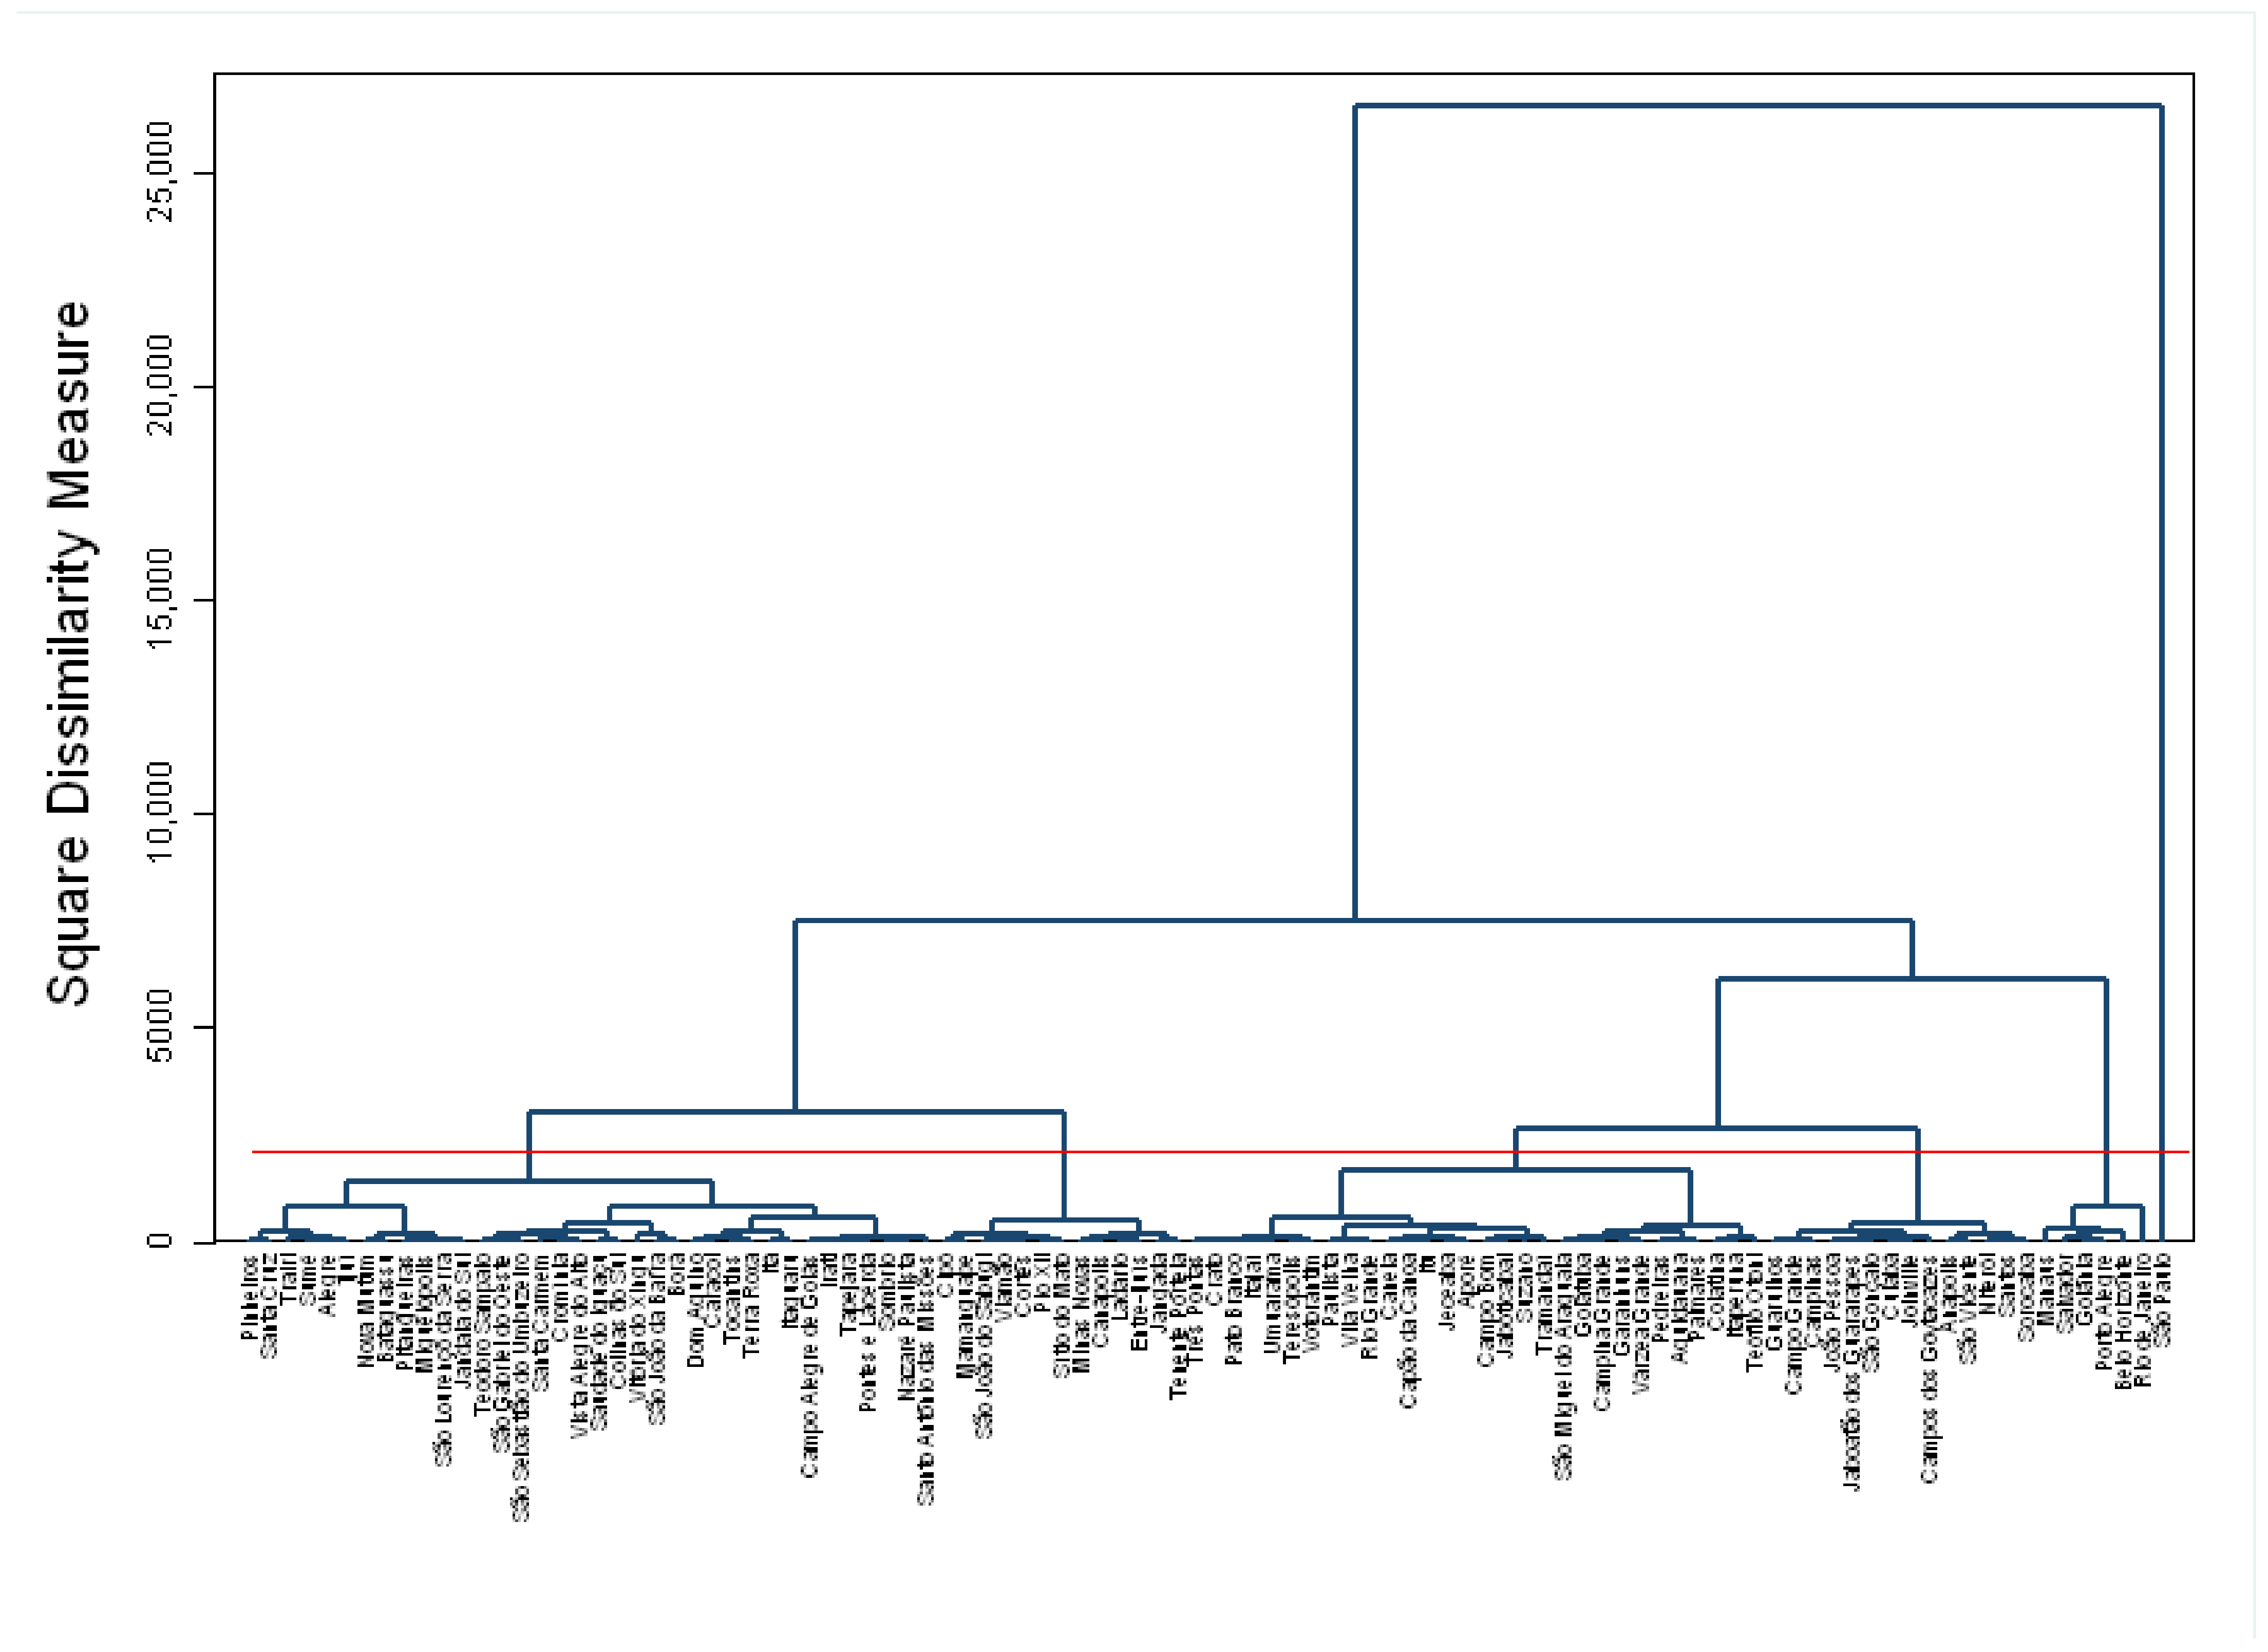
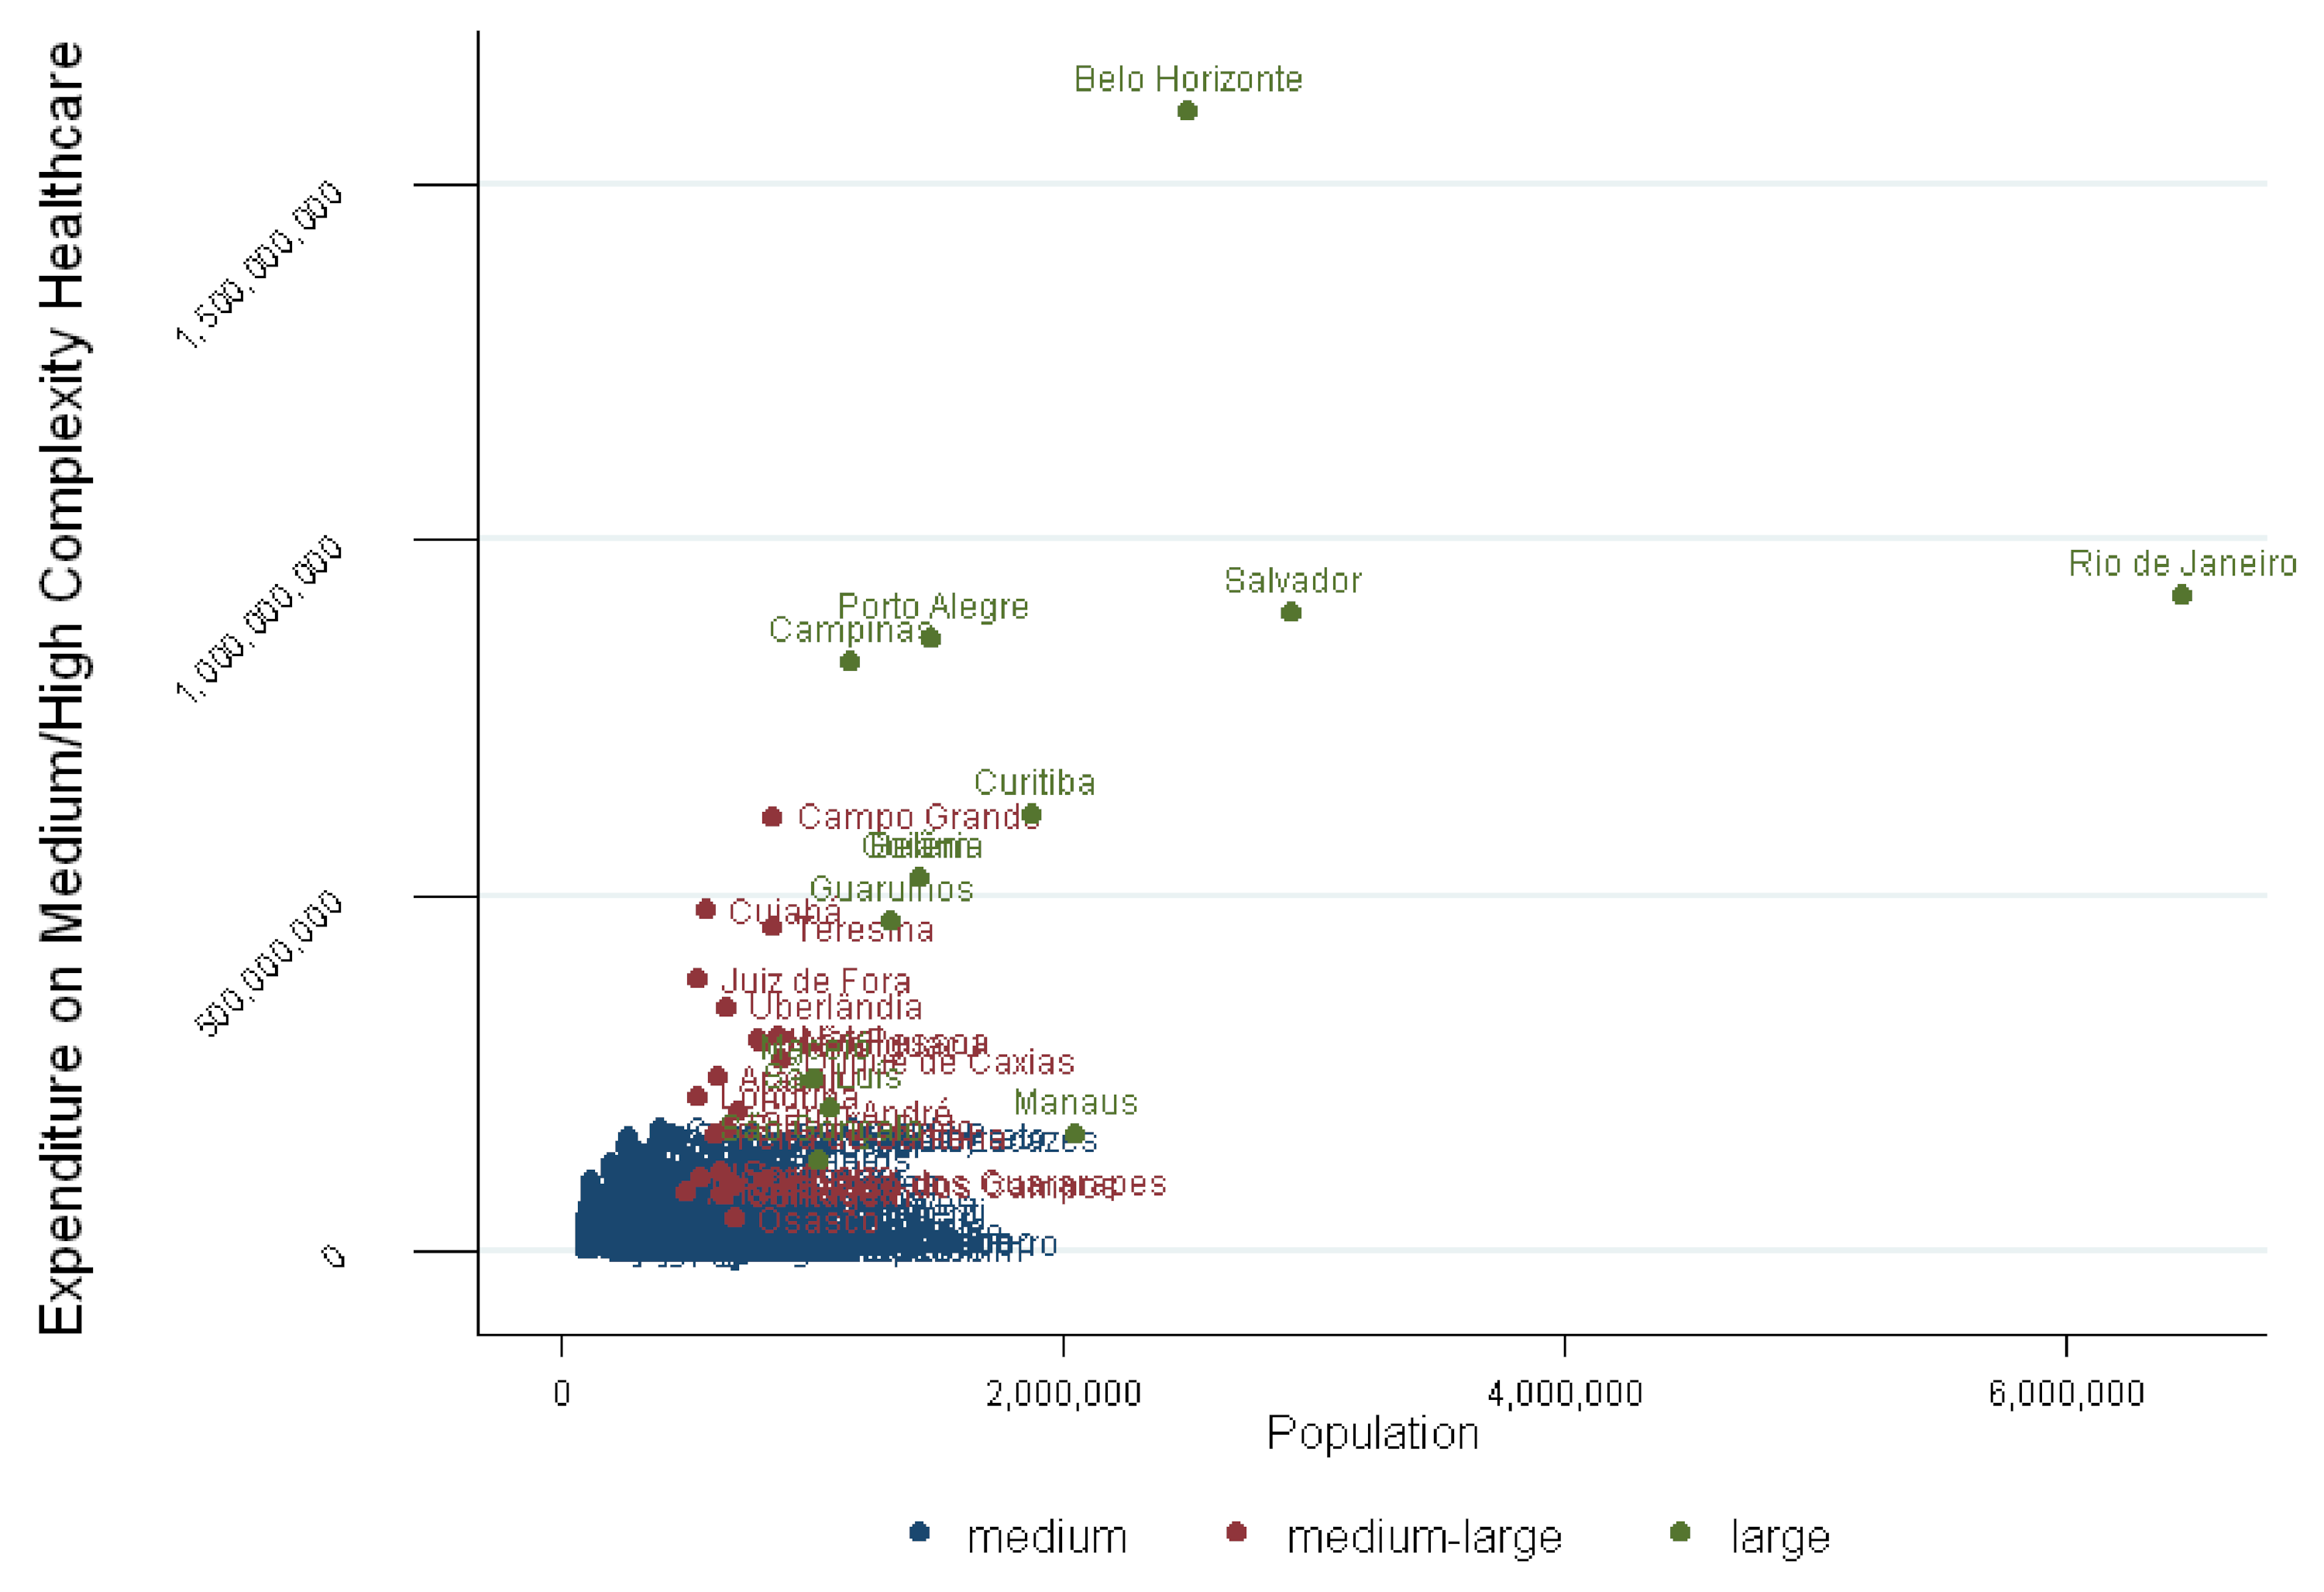
3.4. Cluster Analysis

The SUS clusters reveal a parallel with prevailing regional health theory, according to which the process of regionalization is still in its first steps and facing a serious persistence of gaps in medium- and high-complexity care, in addition to the concentration of full installed capacity in just a few cities. From cluster analysis, we found four groups (Table 19, Table 20, Table 21 and Table 22).
The concentration of installed capacity, which conditions and reflects the access flows to the health network, shows the Southeast region, excluding Espírito Santo, to be extremely dense, along with the cities of Belo Horizonte, São Paulo, and Rio de Janeiro. They invest almost twice the financial resources of the “central cities” cluster, 90% more than the “medium cities” cluster and 40% more than the “small cities” cluster.
The Southeast group’s average spending is BRL 1.5 billion, against BRL 124 million, BRL 31 million, and BRL 5 million in the “central cities”, “medium cities”, and “small towns” groups, respectively. Even with the clearly planned and rational objective of achieving economies of scale, the results indicate that a strong and persistent concentration of the network is still to be found in a small group of cities.
In quantitative terms, the average number of high-complexity outpatient clinics in Belo Horizonte (capital, MG, SoE), São Paulo (capital, SP, SoE), and Rio de Janeiro (capital, RJ, SoE) is four times higher than the central cities group. In this respect, the issue does not necessarily adhere to the logic of the system but rather is disproportionate, because as the technological density of the coverage decreases, the average number and the dispersal of services increases.
Almost every state in Brazil connects to the southeastern region, especially São Paulo, for access to the most complex care services. For myocardial revascularization, only the states of Ceará and Rio Grande do Sul are relatively autonomous. Flowing in the opposite direction and due to extreme isolation, the inhabitants of Rondônia travel to all regions of the country seeking treatment—the flows go from the State of Pará (No), through Rio Grande do Norte (NoE), Goiás (MiW) and São Paulo (SoE) and arrive as far away as Paraná (So) [21].
Moreover, alongside the significant concentration of high-complexity care, the heterogeneity of SUS installed capacity is yet another point that needs to be improved. The k-means reveals that 3243 municipalities did not belong to any group at all, suggesting strong heterogeneity in the distribution of the SUS public offering capacity.

4. Conclusions

In the 30 years of the SUS, the system has been able to almost universalize primary care and consistently advance medium-complexity care. The installed physical capacity and the number of professionals have increased in almost all regions and population strata. The need for greater federal and state participation is a challenge to be met since the regional balance of health supply depends on their actions [22]. The other challenge is overcoming the Fiscal Responsibility Law (FRL); more flexibility for the health sector would contribute to the greater degree of freedom of the public sector to allocate human resources [19]. The law blocks increase in human resource public spending levels in states and municipalities.
The FRL [23], in its section relating to health, limits the expansion of the public network by requiring that human resource expenditure does not exceed 54% of total spending. Therefore, whenever public health policy attempts to increase coverage by continuing to expand service delivery, the FRL obliges local managers to include private participation in public services [4]. The FRL requires most municipalities to direct their expenditure to services provided by third parties, without guaranteeing that these alternatives align any better with SUS precepts [24].
In macro terms, deficiencies in health coverage are due to the segmented public/private mix model [25], public underfunding [26], and delayed regionalization [27], all taking place in a scenario where economic and social stability is a prerequisite for the development of universal services [28]. As a result, improvements in concentration levels of health care and the heterogeneity of installed capacity are dependent on the conditions of this background.
Finally, the study did not analyze the actual health status of the Brazilian population; rather, it analyzed the installed health capacity offered in this prosperous period. In particular, we sought to analyze the dynamics of occupation of health gaps between the public and private sectors. This is the main limitation of the study.

Author Contributions

All authors participated in study conception, design, interpretation, critical revisions, and approved the final manuscript. R.d.S.B. was responsible for microdata compilation, building figures and tables, analyzed the descriptive statistics, multivariate analysis model and wrote manuscripts. E.F. analyzed, reviewed and wrote manuscripts. All authors have read and agreed to the published version of the manuscript.

Funding

This research was funded by the Coordination for the Improvement of Higher Education Personnel (CAPES) and Research and Innovation Support Foundation of Espίrito Santo (FAPES), grant number [83574840/2018]. And the APC was funded by FAPES.

Institutional Review Board Statement

Not applicable.

Informed Consent Statement

Not applicable.

Data Availability Statement

The data presented in this study are public information, available in the Ministry of Health, specifically in the Hospital Information System (SIH-SUS) and Outpatient Information System (SIA-SUS).

Conflicts of Interest

On behalf of all authors, the corresponding author states that there is no conflict of interest.

References

  1. Chamber of Deputies. Constitution of the Federative Republic of Brazil, 3rd ed.; Chamber of Deputies: Brasília, Brazil, 2010; 435p.
  2. Lima, L.D.; Viana, A.L. Descentralização, regionalização e instâncias intergovernamentais no Sistema Único de Saúde. In Ana Luiza d’Ávila Viana; Luciana Dias de Lima. (Org.). Regionalização e Relações Federativas na Política de Saúde do Brasil, 1st ed.; Contra Capa: Rio de Janeiro, Brazil, 2017; Volume 1, pp. 39–63. [Google Scholar]
  3. Brasil, M.D.S. Norma Operacional Básica do Sistema Único de Saúde-SUS, de 6 de Novembro de 1996. Gestão Plena com Responsabilidade pela Saúde do Cidadão; Diário Oficial da União: Brasília, Brazil, 1996.
  4. Macinko, J. A Preliminary Assessment of the Family Health Strategy (FHS) in Brazil; Consultant Report World Bank: Washington, DC, USA, 2011. [Google Scholar]
  5. Gragnolati, M.; Lindelow, M.; Couttolenc, B. Directions in development: Human development. In Twenty Years of Health System Reform in Brazil: An Assessment of the Sistema Unico de Saude (English); World Bank: Washington, DC, USA, 2013. Available online: http://documents.worldbank.org/curated/en/909701468020377135/Twenty-years-of-health-system-reform-in-Brazil-an-assessment-of-the-sistema-unico-de-saude (accessed on 1 March 2018).
  6. Ministry of Health. Ministerial Directive GM/MS 399, 22 February 2006. Promotes the Pact for Health 2006—Consolidation of the SUS and approves the Operational Directives of the Pact; Ministry of Health: Brasília, Brazil, 2006.
  7. The Federal Senate. Constitution of the Federative Republic of Brazil: Constitutional Text of October 5, 1988, with the Alterations Introduced by Constitutional Amendments no. 1/92 through 72/2013 and by Revision Constitutional Amendments no. 1/94 through 6/94; The Federal Senate, Undersecretariat of Technical Publications: Brasilia, Brazil, 2013; Available online: http://www2.senado.leg.br/bdsf/bitstream/handle/id/243334/Constitution_2013.pdf (accessed on 9 January 2018).
  8. Brasil Congresso Nacional, 2012. Lei Complementar nº 141, de 13 de Janeiro de 2012. Regulamenta o § 3º do Art. 198 da Constituição Federal para Dispor Sobre os Valores Mínimos a Serem Aplicados Anualmente pela União, Estados, Distrito Federal e Municípios em Ações e Serviços Públicos de Saúde; Estabelece os Critérios de Rateio dos Recursos de Transferências para a Saúde e as Normas de Fiscalização, Avaliação e Controle das Despesas com Saúde nas 3 (três) Esferas de Governo; Revoga Dispositivos das Leis nos 8.080, de 19 de Setembro de 1990, e 8.689, de 27 de Julho de 1993; e dá Outras Providências. Diário Oficial da União 2012. Available online: http://www.planalto.gov.br/ccivil_03/leis/lcp/lcp141.htm (accessed on 1 March 2018).
  9. Ocké-Reis, C.O. SUS o Desafio de ser único, 1st ed.; Fiocruz: Rio de Janeiro, Brazil, 2012. [Google Scholar]
  10. The World Bank. Um Ajuste Justo: Análise da Eficiência e Equidade do Gasto Público no Brasil: Volume I (Síntese); World Bank Group: Washington, DC, USA, 2017. [Google Scholar]
  11. Brasil Congresso Nacional. Lei Complementar Nº 101, de 4 de Maio de 2000. Lei de Responsabilidade Fiscal. Diário Oficial da União de 05 Maio de 2000; Brasil Congresso Nacional: Brasília, Brazil, 2000. [Google Scholar]
  12. Mendes, E.V. As Redes de Atenção à Saúde; Organização Pan-Americana da Saúde: Brasília, Brazil, 2011. [Google Scholar]
  13. Hair, J.F.; Black, W.C.; Babin, B.J.; Anderson, R.E. Multivariate Data Analysis, 8th ed.Andover: Hampshire, UK, 2018. [Google Scholar]
  14. Oliveira, K.B. Panorama da Oferta de Serviços de Saúde em Estabelecimentos com Atendimento Ambulatorial pelo SUS: O Caso do Rio de Janeiro. Dissertação de Mestrado. Programa de Pós-Graduação em Estudos Populacionais e Pesquisas Sociais da Escola Nacional de Ciências Estatísticas do Instituto Brasileiro de Geografia e Estatística (IBGE); IBGE: Rio de Janeiro, Brazil, 2014. [Google Scholar]
  15. Teixeira, H.V.; Teixeira, M.G. Financiamento da Saúde Pública no Brasil: A experiência do SIOPS; Cadernos de Saúde Coletiva: Rio de Janeiro, Brazil, 2003; Volume 8. [Google Scholar]
  16. Arrow, K.J. Uncertainty and the welfare economics of medical care. Am. Econ. Rev. 1963, 53, 941–973. [Google Scholar]
  17. Instituto Brasileiro de Geografia e Estatística (IBGE). Conta-Satélite de Saúde: Brasil: 2010–2013, Coordenação de Contas Nacionais; IBGE: Rio de Janeiro, Brazil, 2015. [Google Scholar]
  18. Dedecca, C.S. O trabalho no setor saúde. São Paulo Perspectiva 2008, 22, 87–103. [Google Scholar]
  19. Governo do Brasil. Planos de Saúde Têm 48,7 Milhões de Beneficiários em Junho de 2012. Available online: http://www.brasil.gov.br/noticias/saude/2012/10/planos-de-saude-tem-48-7-milhoes-de-beneficiarios-em-junho-de-2012 (accessed on 9 January 2018).
  20. Conselho Federal de Medicina (CFM). 2017. Em Cinco anos, Brasil Perde 23,6 mil Leitos de Internação no SUS. Disponível em. Available online: https://portal.cfm.org.br/index.php?option=com_content&view=article&id=26171:2016-05-17-12-26-58&catid=3 (accessed on 13 August 2017).
  21. Fundação Oswaldo Cruz (Fiocruz). Mapa Saúde Amanhã: Visualizador Cartográfico Interativo Saúde Amanhã (VCI-Saúde Amanhã). Rio de Janeiro. 2018. Available online: http://mapas.saudeamanha.icict.fiocruz.br/ (accessed on 10 January 2018).
  22. Instituto de Pesquisa Econômica Aplicada (IPEA). Desafios da Nação; Comunicados IPEA: Brasília, Brazil, 2018; Volume 1. [Google Scholar]
  23. Dedecca, C.S.; Rosandiski, E.N.; Carvalho, M.S.; Barbieri, C.V. A Dimensão Ocupacional do Setor de Atendimento à Saúde no Brasil. Revista Trabalho, Educação e Saúde; Escola Politécnica de Saúde Joaquim Venâncio: Rio de Janeiro, Brazil, 2005; Volume 3, pp. 123–142. [Google Scholar]
  24. Mendes, Á. Limite de Gasto com Pessoal na Saúde pela LRF: Uma Barreira à Construção do SUS Público, Integral e de Gualidade; Domingueira da Saúde do Idisa: Campinas, Brazil, 2015; Volume 5, pp. 1–4. [Google Scholar]
  25. Bahia, L. Padrões e Mudanças no Financiamento e na Regulação do Sistema de saúde Brasileiro: Impactos Sobre as Relações Entre o Público e o Privado. As Experiências do Brasil e do Quebec; Saberes: Campinas, Brazil, 2010; pp. 99–136. [Google Scholar]
  26. Dain, S. O financiamento Público na Perspectiva da Política Social. Revista Economia e Sociedade, 17; IE-Unicamp: Campinas, Brazil, 2001. [Google Scholar]
  27. Viana, A.L.; Ferreira, M.P.; Cutrim, M.A.B.; Fusaro, E.R.; Souza, M.M.R.; Mourão, L.; Chancharulo, A.P.; Mota, P.H.S. Política de regionalização do SUS em debate: Avanços e impasses da implementação das regiões e redes no Brasil. Novos Caminhos 2017, 15, 1–48. [Google Scholar]
  28. Massuda, A.; Hone, T.; Leles, F.A.G.; Castro, M.C.; Atun, R. The Brazilian health system at crossroads: Progress, crisis and resilience. BMJ Glob. Health 2018, 3, e000829. [Google Scholar] [CrossRef] [PubMed] [Green Version]
Figure 1. Growth and equality. Source: World Bank. GDP, PPP (constant 2011 international USD), [https://databank.worldbank.org/source/world-development-indicators (accessed on 10 August 2019)]. Elaboration: by authors.
Healthcare 09 01380 g001
Figure 2. Dendrogram for Ward’s cluster analysis. The color of the dendrogram line is navy and the cut line is red. Source: Share % of Tax Revenue and Constitutional and Legal Transfers in Total Revenue of the Municipality (excluding deductions); Population Census 2010 and 2015 of the Brazilian Institute of Geography and Statistics (Censo Demográfico 2010 e 2015 do Instituto Brasileiro de Geografia e Estatística-IBGE); Information System on Public Health Budgets–ISPHB (Sistema de Informação sobre Orçamentos Públicos em Saúde-SIOPS); Ministry of Health, National Registry of Health Establishments (Cadastro Nacional dos Estabelecimentos de Saúde do Brasil-CNES); National Occupation Classification (Classificação Nacional de Ocupação-CBO); National Agency for Supplementary Health (Agência Nacional de Saúde Suplementar-ANS). Production: by the authors.
Healthcare 09 01380 g002
Figure 3. Expenditure on medium/high-complexity health care (SUS) by 272 bigger municipalities, 2015. Note: São Paulo is outlier; the city has higher expenditure than all other cities. Scores colors are as follows: medium population in navy; medium-large population in maroon; large population in green. Source: Information System on Public Health Budgets–ISPHB (Sistema de Informação sobre Orçamentos Públicos em Saúde-SIOPS), Ministry of Health. Production: by the authors.
Healthcare 09 01380 g003
Figure 4. Primary public outpatient care (green-left) and primary private outpatient care, 2015. Source: Ministry of Health, National Registry of Health Establishments (Cadastro Nacional dos Estabelecimentos de Saúde do Brasil-CNES); National Agency for Supplementary Health (Agência Nacional de Saúde Suplementar-ANS). Production: by the authors.
Healthcare 09 01380 g004
Figure 5. Medium-complexity public outpatient care (blue-left) and medium-complexity private outpatient Care, 2015. Source: Ministry of Health, National Registry of Health Establishments (Cadastro Nacional dos Estabelecimentos de Saúde do Brasil-CNES); National Agency for Supplementary Health (Agência Nacional de Saúde Suplementar-ANS). Production: by the authors.
Healthcare 09 01380 g005
Figure 6. Higher complexity public outpatient care and higher complexity private outpatient care, 2015. Source: Ministry of Health, National Registry of Health Establishments (Cadastro Nacional dos Estabelecimentos de Saúde do Brasil-CNES); National Agency for Supplementary Health (Agência Nacional de Saúde Suplementar-ANS). Production: by the authors.
Healthcare 09 01380 g006
Table 1. Observation (available), absent (unavailable), and outlier (by municipality).
NVariableAbsentOutlierObservationsSource
1Population 5568IBGE
2Population by age group (% of those over 59 years of age) 5568IBGE
3Tax Revenue/Total Revenue (SUS)1 5567SIOPS
4Percentage of Constitution Transfer Taxes Receipt in relation to Total Municipality Receipt * (SUS)1 5567SIOPS
5Transfer Central Government (Union) to the SUS/Transfer Central Government (Union) 1 5567SIOPS
6Applied Own Resources (Constitutional Amendment 29)1 5567SIOPS
7Resources (n = 3 + 4 + 5 + 6) per inhabitants1 5567SIOPS
8Human Resource Expenditure (SUS)193015248SIOPS
9Investment (SUS)1224065040SIOPS
10Expenditure on Primary Health care (SUS)3151995054SIOPS
11Expenditure on Medium- and High-Complexity Health care (SUS)14643283776SIOPS
12Primary Public Outpatient Care8 5561CNES
13Medium-Complexity Public Outpatient Care166 5403CNES
14High-Complexity Public Outpatient Care4748 820CNES
15Medium-Complexity Public Hospital Care4227 1291CNES
16High-Complexity Public Hospital Care5440 128CNES
17Public Nursing Assistants and Technicians227 5341CBO
18Public Nurse215 5353CBO
19Public Doctor (physician) 217 5351CBO
20Primary Private Outpatient Care3542 2027CNES/ANS
21Medium-Complexity Private Outpatient Care2616 2953CNES/ANS
22High-Complexity Private Outpatient Care4997 571CNES/ANS
23Medium-Complexity Private Hospital Care5003 565CNES/ANS
24High-Complexity Private Hospital Care5371 197CNES/ANS
25Private Nursing Assistants and Technicians4721 847CBO
26Private Nurse4804 764CBO
27Private Doctor (physician) 3500 2068CBO
* Share % of Tax Revenue and Constitutional and Legal Transfers in Total Revenue of the Municipality (excluding deductions); Population Census 2010 and 2015 of the Brazilian Institute of Geography and Statistics (Censo Demográfico 2010 e 2015 do Instituto Brasileiro de Geografia e Estatística-IBGE); Information System on Public Health Budgets–ISPHB (Sistema de Informação sobre Orçamentos Públicos em Saúde-SIOPS); Ministry of Health, National Registry of Health Establishments (Cadastro Nacional dos Estabelecimentos de Saúde do Brasil-CNES); National Occupation Classification (Classificação Nacional de Ocupação-CBO); National Agency for Supplementary Health (Agência Nacional de Saúde Suplementar-ANS). Production: by the authors.
Table 2. Variables to cluster analysis.
NVariable
1Population
2Population by age group (% of those over 59 years of age)
3Tax Revenue/Total Revenue (SUS)
4Percentage of Constitution Transfer Taxes Receipt in relation to Total Municipality Receipt * (SUS)
5Transfer Central Government (Union) to the SUS/Transfer Central Government (Union)
6Applied Own Resources (Constitutional Amendment 29)
7Resources (n = 3 + 4 + 5 + 6) per inhabitants
8Human Resource Expenditure (SUS)
9Expenditure on Primary Health care (SUS)
10Expenditure on Medium- and High-Complexity Health care (SUS)
11Primary Public Outpatient Care
12Medium-Complexity Public Outpatient Care
13Public Nursing Assistants and Technicians
14Public Nurse
15Public Doctor (physician)
Source: Share % of Tax Revenue and Constitutional and Legal Transfers in Total Revenue of the Municipality (excluding deductions); * It is the part of the municipality’s resources that are not its own resources, coming from the central and middle government (federal and state); Population Census 2010 and 2015 of the Brazilian Institute of Geography and Statistics (Censo Demográfico 2010 e 2015 do Instituto Brasileiro de Geografia e Estatística-IBGE); Information System on Public Health Budgets–ISPHB (Sistema de Informação sobre Orçamentos Públicos em Saúde-SIOPS); Ministry of Health, National Registry of Health Establishments (Cadastro Nacional dos Estabelecimentos de Saúde do Brasil-CNES); National Occupation Classification (Classificação Nacional de Ocupação-CBO); National Agency for Supplementary Health (Agência Nacional de Saúde Suplementar-ANS). Production: by the authors.
Table 3. Factor analysis.
FactorEigenvalueDifferenceProportionCumulative
Factor17.94666.41640.74760.7476
Factor21.53020.78700.14390.8915
Factor30.74320.11250.06990.9614
Factor40.63070.50390.05931.0208
Factor50.12680.06300.01191.0327
Factor60.06380.03120.00601.0387
Factor70.03260.03230.00311.0418
Factor80.00030.00450.00001.0418
Factor9−0.00420.0079−0.00041.0414
Factor10−0.01210.0030−0.00111.0403
Factor11−0.01510.0132−0.00141.0388
Factor12−0.02830.0104−0.00271.0362
Factor13−0.03870.0576−0.00361.0325
Factor14−0.09630.1532−0.00911.0235
Factor15−0.2495 −0.02351.0000
Source: Share % of Tax Revenue and Constitutional and Legal Transfers in Total Revenue of the Municipality (excluding deductions); Population Census 2010 and 2015 of the Brazilian Institute of Geography and Statistics (Censo Demográfico 2010 e 2015 do Instituto Brasileiro de Geografia e Estatística-IBGE); Information System on Public Health Budgets–ISPHB (Sistema de Informação sobre Orçamentos Públicos em Saúde-SIOPS); Ministry of Health, National Registry of Health Establishments (Cadastro Nacional dos Estabelecimentos de Saúde do Brasil-CNES); National Occupation Classification (Classificação Nacional de Ocupação-CBO); National Agency for Supplementary Health (Agência Nacional de Saúde Suplementar-ANS). Production: by the authors.
Table 4. Factor analysis.
VariableFactor1Factor2Factor3Factor4Factor5Factor6Factor7Factor8Uniqueness
Population0.970.05−0.180.02−0.14−0.020.020.000.01
Population by age group (% of those over 59 years of age)−0.070.500.00−0.040.08−0.030.090.000.73
Tax Revenue/Total Revenue (SUS)0.390.080.420.29−0.090.00−0.05−0.010.57
Percentage of Constitution Transfer Taxes Receipt in relation to Total Municipality Receipt * (SUS)0.43−0.530.310.140.12−0.010.060.000.40
Transfer Central Government (Union) to the SUS/Transfer Central Government (Union)−0.090.760.030.04−0.02−0.09−0.030.000.40
Applied Own Resources (Constitutional Amendment 29)0.070.130.290.22−0.070.140.010.000.82
Resources (n = 3 + 4 + 5 + 6) per inhabitants0.040.560.240.130.080.030.040.000.60
Human Resource Expenditure (SUS)0.970.07−0.010.02−0.06−0.02−0.070.010.04
Expenditure on Primary Health care (SUS)0.800.11−0.440.280.010.080.020.000.07
Expenditure on Medium- and High-Complexity Health care (SUS)0.940.09−0.180.080.170.05−0.050.000.03
Primary Public Outpatient Care0.89−0.200.070.16−0.05−0.120.040.000.11
Medium-Complexity Public Outpatient Care0.95−0.03−0.030.200.07−0.060.01−0.010.05
Public Nursing Assistants and Technicians0.880.040.24−0.360.04−0.02−0.020.000.03
Public Nurse0.920.080.02−0.31−0.130.070.080.000.02
Public Doctor (physician)0.920.080.12−0.280.090.04−0.03−0.010.04
Source: * Share % of Tax Revenue and Constitutional and Legal Transfers in Total Revenue of the Municipality (excluding deductions); Population Census 2010 and 2015 of the Brazilian Institute of Geography and Statistics (Censo Demográfico 2010 e 2015 do Instituto Brasileiro de Geografia e Estatística-IBGE); Information System on Public Health Budgets–ISPHB (Sistema de Informação sobre Orçamentos Públicos em Saúde-SIOPS); Ministry of Health, National Registry of Health Establishments (Cadastro Nacional dos Estabelecimentos de Saúde do Brasil-CNES); National Occupation Classification (Classificação Nacional de Ocupação-CBO); National Agency for Supplementary Health (Agência Nacional de Saúde Suplementar-ANS). Production: by the authors. Bold: From Factor 1, the measurement of sampling adequacy (MSA) applied was 0.80 to select the original variables.
Table 5. Human resource public expenditure and investment (SUS) by region (municipal average).
Region20082015
Human ResourceInvestmentHuman ResourceInvestment
North6,287,995.51386,747.578,865,348.43522,688.84
Northeast5,122,279.46373,378.447,657,237.77443,252.25
Southeast11,044,496.33896,930.4913,731,783.04635,463.90
South4,128,870.57314,157.007,318,001.24392,144.97
Midwest5,687,828.45419,646.098,550,003.18523,722.04
Total6,829,583.00526,474.449,562,787.52502,806.45
Production: by the authors using the calculator of Brazil’s Central Bank (Bacen). Broad Consumer Price Index (IPCA) of Brazilian Institute of Geography and Statistics (IBGE), cumulative index of 1.5577600 (2008–2015). Constant Brazil (BRL) prices of 2015. The exchange rates of 2008 (USD 0.5450) and 2015 (USD 0.3001).
Table 6. Human resource public expenditure and investment (SUS) by population stratum (municipal average).
ClassificationStratum20082015
Human ResourceInvestmentHuman ResourceInvestment
Very smallPop. ≤ 20,0001,647,784.97194,628.292,416,684.74198,923.42
Small20,000 < pop. ≤ 50,0005,163,202.04431,864.557,739,382.61518,680.74
Small-medium50,000 < pop. ≤ 100,00013,009,326.44964,336.1318,887,393.731,104,100.30
Medium100,000 < pop. ≤ 500,00039,036,283.132,883,016.7158,879,731.522,489,403.92
Medium-large500,000 < pop. ≤ 1 million155,469,020.2612,141,730.53224,991,303.488,165,209.30
LargePop. > 1 million659,658,957.5636,822,941.85530,037,004.9118,555,634.18
Total 6,829,583.00526,474.449,562,787.52502,806.45
Production: by the authors using the calculator of Brazil’s Central Bank (Bacen). Broad Consumer Price Index (IPCA) of Brazilian Institute of Geography and Statistics (IBGE), cumulative index of 1.5577600 (2008–2015). Constant BRL prices of 2015. The exchange rates of 2008 (USD 0.5450) and 2015 (USD 0.3001).
Table 7. Expenditure on primary and medium-/high-complexity health care (SUS) by region (municipal average).
Region20082015
PrimaryMedium/HighPrimaryMedium/High
North4,278,745.219,356,899.645,941,717.708,644,777.30
Northeast4,278,458.189,198,694.664,625,240.426,568,575.50
Southeast5,694,131.7313,372,184.3010,869,535.3221,967,488.92
South3,754,707.8012,680,853.506,742,064.6710,024,791.34
Midwest4,019,066.1210,783,831.806,141,224.2310,320,658.85
Total4,572,140.1311,479,861.127,166,177.8612,392,791.87
Production: by the authors using the calculator of Brazil’s Central Bank (Bacen) to the value actualization of in real terms. Broad Consumer Price Index (IPCA) of Brazilian Institute of Geography and Statistics (IBGE), cumulative index of 1.5577600 (2008–2015). Constant BRL prices of 2015. The exchange rates of 2008 (USD 0.5450) and 2015 (USD 0.3001).
Table 8. Expenditure on primary and medium-/high-complexity health care (SUS) by population stratum (municipal average).
ClassificationStratum20082015
PrimaryMedium/HighPrimaryMedium/High
Very smallPop. ≤ 20,0001,981,679.84799,566.172,832,844.78836,145.48
Small20,000 < pop. ≤ 50,0005,275,363.182,360,388.426,080,622.293,432,995.93
Small-medium50,000 < pop. ≤ 100,0009,245,552.849,587,156.3412,164,499.9515,360,956.73
Medium100,000 < pop. ≤ 500,00024,871,977.7229,802,515.4029,933,352.6047,274,849.48
Medium-large500,000 < pop. ≤ 1 million73,779,468.89162,266,960.2876,283,383.17243,990,809.82
LargePop. > 1 million135,042,042.73590,048,301.64357,684,973.87821,740,560.90
Total 4,572,140.1311,479,861.127,166,177.8612,392,791.87
Production: by the authors using the calculator of Brazil’s Central Bank (Bacen) to the value actualization of in real terms. Broad Consumer Price Index (IPCA) of Brazilian Institute of Geography and Statistics (IBGE), cumulative index of 1.5577600 (2008–2015). Constant BRL prices of 2015. The exchange rates of 2008 (USD 0.5450) and 2015 (USD 0.3001).
Table 9. Primary outpatient care by region.
Region20082015
PublicPrivatePublicPrivate
North42609635179870
Northeast18,030700121,1113287
Southeast17,21825,45318,97611,858
South801712,13495735500
Midwest3340416239351777
Total50,86549,71358,77423,292
Source: Ministry of Health, National Registry of Health Establishments (Cadastro Nacional dos Estabelecimentos de Saúde do Brasil-CNES). Production: by the authors.
Table 10. Primary outpatient care by population stratum.
ClassificationStratum20082015
PublicPrivatePublicPrivate
Very smallPop. ≤ 20,00017,451350922,8711766
Small20,000 < pop. ≤ 50,00012,494708014,5673633
Small-medium50,000 < pop. ≤ 100,0007060802275263567
Medium100,000 < pop. ≤ 500,000895216,14991236471
Medium-large500,000 < pop. ≤ 1 million2168623618543162
LargePop. > 1 million2740871728334693
Total 50,86549,71358,77423,292
Source: Ministry of Health, National Registry of Health Establishments (Cadastro Nacional dos Estabelecimentos de Saúde do Brasil-CNES). Production: by the authors.
Table 11. Medium and higher public outpatient and hospital care by region.
Region20082015
M/outH/outM/hospH/hospM/outH/outM/hospH/hosp
North1032541201323219518415
Northeast53403444806310,45545876041
Southeast838968529610213,187895410102
South1891150551949302487211
Midwest163710210121343519123713
Total18,2891335105221834,32818871663182
Note: medium outpatient (M/out); higher outpatient (H/out); medium hospital (M/hosp); higher hospital (H/hosp). Source: Ministry of Health, National Registry of Health Establishments (Cadastro Nacional dos Estabelecimentos de Saúde do Brasil-CNES). Production: by the authors.
Table 12. Medium and higher public outpatient and hospital care by population stratum.
ClassificationStratum20082015
M/outH/outM/hospH/hospM/outH/outM/hospH/hosp
Very smallPop. ≤ 20,000284779268610,54322366911
Small20,000 < pop. ≤ 50,00033571512189703135138817
Small-medium50,000 < pop. ≤ 100,000301322210617494634413521
Medium100,000 < pop. ≤ 500,000531244315160713157420567
Medium-large500,000 < pop. ≤ 1 million133813410835152012711326
LargePop. > 1 million242230620191315726815340
Total 18,2891335105221834,32818871663182
Note: medium outpatient (M/out); higher outpatient (H/out); medium hospital (M/hosp); higher hospital (H/hosp). Source: Ministry of Health, National Registry of Health Establishments (Cadastro Nacional dos Estabelecimentos de Saúde do Brasil-CNES). Production: by the authors.
Table 13. Medium and higher private outpatient and hospital care by stratum.
Region20082015
Med/OutHigh/OutMed/HospHigh/HospMed/OutHigh/OutMed/HospHigh/Hosp
North18811139914300517513525
Northeast13,9625505348714,224685669120
Southeast47,996184967626639,2562041775346
South15,9205001667614,43166119482
Midwest463529225154508639232480
Total84,3943304172649776,00239542097653
Note: medium outpatient (med/out); higher outpatient (high/out); medium hospital (med/hosp); higher hospital (high/hosp). Ministry of Health, National Registry of Health Establishments (Cadastro Nacional dos Estabelecimentos de Saúde do Brasil-CNES); National Occupation Classification (Classificação Nacional de Ocupação-CBO); National Agency for Supplementary Health (Agência Nacional de Saúde Suplementar-ANS). Production: by the authors.
Table 14. Medium and higher private outpatient and hospital care by population stratum.
ClassificationStratum20082015
M/outH/outM/hospH/hospM/outH/outM/hospH/hosp
Very smallPop. ≤ 20,000295332590418859782
Small20,000 < pop. ≤ 50,00061699815215764422020124
Small-medium50,000 < pop. ≤ 100,00010,5633312013810,25061729356
Medium100,000 < pop. ≤ 500,00027,034117639319821,9941414529243
Medium-large500,000 < pop. ≤ 1 million10,704598289898754672363115
LargePop. > 1 million26,971106963215723,172972633213
Total 84,3943304172649776,00239542097653
Note: medium outpatient (med/out); higher outpatient (high/out); medium hospital (med/hosp); higher hospital (high/hosp). Ministry of Health, National Registry of Health Establishments (Cadastro Nacional dos Estabelecimentos de Saúde do Brasil-CNES); National Occupation Classification (Classificação Nacional de Ocupação-CBO); National Agency for Supplementary Health (Agência Nacional de Saúde Suplementar-ANS). Production: by the authors.
Table 15. Health professionals by region, 2008.
RegionPublicPrivate
n.aux/TechNursePhysiciann.aux/TechNursePhysician
North9961552412,6562771002401
Northeast39,25024,85877,3921531142227,414
Southeast52,30037,424184,95213,0486750126,020
South15,675893742,241228292529,053
Midwest12,886474824,47710062578853
Total130,07281,491341,71818,1449454193,741
Note: auxiliary nurses and technicians (n.aux/tech). Production: Ministry of Health, National Registry of Health Establishments (Cadastro Nacional dos Estabelecimentos de Saúde do Brasil-CNES); National Occupation Classification (Classificação Nacional de Ocupação-CBO); National Agency for Supplementary Health (Agência Nacional de Saúde Suplementar-ANS). Production: by the authors.
Table 16. Health professionals by region, 2015.
RegionPublicPrivate
n.aux/TechNursePhysiciann.aux/TechNursePhysician
North20,91810,23316,49716494144883
Northeast66,05543,27887,3454939225535,441
Southeast119,30173,229242,12542,29018,843169,874
South44,40122,42573,4047209247451,468
Midwest24,91610,81834,419206567913,305
Total275,591159,983453,79058,15224,665274,971
Note: auxiliary nurses and technicians (n.aux/tech). Ministry of Health, National Registry of Health Establishments (Cadastro Nacional dos Estabelecimentos de Saúde do Brasil-CNES); National Occupation Classification (Classificação Nacional de Ocupação-CBO); National Agency for Supplementary Health (Agência Nacional de Saúde Suplementar-ANS). Production: by the authors.
Table 17. Health professionals by population stratum, 2008.
ClassificationStratumPublicPrivate
n.aux/TechNursePhysiciann.aux/TechNursePhysician
Very smallPop. ≤ 20,00018,85110,42520,61640241623
Small20,000 < pop. ≤ 50,00018,20010,34729,1262301126874
Small-medium50,000 < pop. ≤ 100,00015,271807537,44272529213,820
Medium100,000 < pop. ≤ 500,00032,25218,52296,4924096159155,614
Medium-large500,000 < pop. ≤ 1 million15,878964652,4842832139030,825
LargePop. > 1 million29,62024,476105,55810,221604584,985
Total 130,07281,491341,71818,1449454193,741
Note: auxiliary nurses and technicians (n.aux/tech). Ministry of Health, National Registry of Health Establishments (Cadastro Nacional dos Estabelecimentos de Saúde do Brasil-CNES); National Occupation Classification (Classificação Nacional de Ocupação-CBO); National Agency for Supplementary Health (Agência Nacional de Saúde Suplementar-ANS). Production: by the authors.
Table 18. Health professionals by population stratum, 2015.
ClassificationStratumPublicPrivate
n.aux/TechNursePhysiciann.aux/TechNursePhysician
Very smallPop. ≤ 20,00034,81223,45534,6432811833575
Small20,000 < pop. ≤ 50,00036,35121,92546,520111949212,930
Small-medium50,000 < pop. ≤ 100,00034,80718,34453,8793540140723,721
Medium100,000 < pop. ≤ 500,00074,75938,236132,38415,231542080,042
Medium-large500,000 < pop. ≤ 1 million34,13817,60362,0927088260839,520
LargePop. > 1 million60,72440,420124,27230,89314,555115,183
Total 275,591159,983453,79058,15224,665274,971
Note: auxiliary nurses and technicians (n.aux/tech). Ministry of Health, National Registry of Health Establishments (Cadastro Nacional dos Estabelecimentos de Saúde do Brasil-CNES); National Occupation Classification (Classificação Nacional de Ocupação-CBO); National Agency for Supplementary Health (Agência Nacional de Saúde Suplementar-ANS). Production: by the authors.
Table 19. Southeast cluster.
CountyMunicipality
1Belo Horizonte
2Rio de Janeiro
3São Paulo
Note: k-means clustering methodology. Source: Share % of Tax Revenue and Constitutional and Legal Transfers in Total Revenue of the Municipality (excluding deductions); Population Census 2010 and 2015 of the Brazilian Institute of Geography and Statistics (Censo Demográfico 2010 e 2015 do Instituto Brasileiro de Geografia e Estatística-IBGE); Information System on Public Health Budgets–ISPHB (Sistema de Informação sobre Orçamentos Públicos em Saúde-SIOPS); Ministry of Health, National Registry of Health Establishments (Cadastro Nacional dos Estabelecimentos de Saúde do Brasil-CNES); National Occupation Classification (Classificação Nacional de Ocupação-CBO); National Agency for Supplementary Health (Agência Nacional de Saúde Suplementar-ANS). Production: by the authors.
Table 20. Central cities cluster.
CountyMunicipality
1Guarulhos
2Natal
3João Pessoa
4São Luís
5Belém
6Contagem
7Goiânia
8Teresina
9Salvador
10Campos dos Goytacazes
11Porto Alegre
12Curitiba
13Campo Grande
14Maceió
15Aracaju
16Cuiabá
17Joinville
18Manaus
19Campinas
Note: k-means clustering methodology. Source: Share % of Tax Revenue and Constitutional and Legal Transfers in Total Revenue of the Municipality (excluding deductions); Population Census 2010 and 2015 of the Brazilian Institute of Geography and Statistics (Censo Demográfico 2010 e 2015 do Instituto Brasileiro de Geografia e Estatística-IBGE); Information System on Public Health Budgets–ISPHB (Sistema de Informação sobre Orçamentos Públicos em Saúde-SIOPS); Ministry of Health, National Registry of Health Establishments (Cadastro Nacional dos Estabelecimentos de Saúde do Brasil-CNES); National Occupation Classification (Classificação Nacional de Ocupação-CBO); National Agency for Supplementary Health (Agência Nacional de Saúde Suplementar-ANS). Production: by the authors.
Table 21. Medium cities cluster.
CountyMunicipality
1Ananindeua
2Passo Fundo
3Suzano
4Apucarana
5Divinópolis
6Ilhéus
7Cataguases
8Marabá
9Concórdia
10Uberlândia
11Itaguaí
12Jaú
13Araçatuba
14Osasco
15Carapicuíba
16Tatuí
17Vitória
18Itatiba
19Sete Lagoas
20Gravataí
161Várzea Grande
Note: k-means clustering methodology. Source: Share % of Tax Revenue and Constitutional and Legal Transfers in Total Revenue of the Municipality (excluding deductions); Population Census 2010 and 2015 of the Brazilian Institute of Geography and Statistics (Censo Demográfico 2010 e 2015 do Instituto Brasileiro de Geografia e Estatística-IBGE); Information System on Public Health Budgets–ISPHB (Sistema de Informação sobre Orçamentos Públicos em Saúde-SIOPS); Ministry of Health, National Registry of Health Establishments (Cadastro Nacional dos Estabelecimentos de Saúde do Brasil-CNES); National Occupation Classification (Classificação Nacional de Ocupação-CBO); National Agency for Supplementary Health (Agência Nacional de Saúde Suplementar-ANS). Production: by the authors.
Table 22. Small cities cluster.
CountyMunicipality
1Pacatuba
2Charqueadas
3Paraíso do Tocantins
4Ourolândia
5Santa Cruz do Piauí
6São José do Seridó
7Buenópolis
8Rio do Fogo
9Três Marias
10Maués
11Quipapá
12Laje
13Rondon do Pará
14Fernandópolis
15Pedro Canário
16Santo Antônio de Posse
17Ourilândia do Norte
18Alcobaça
19Jaíba
20Curral de Dentro
2144Ninheira
Note: k-means clustering methodology. Source: Share % of Tax Revenue and Constitutional and Legal Transfers in Total Revenue of the Municipality (excluding deductions); Population Census 2010 and 2015 of the Brazilian Institute of Geography and Statistics (Censo Demográfico 2010 e 2015 do Instituto Brasileiro de Geografia e Estatística-IBGE); Information System on Public Health Budgets–ISPHB (Sistema de Informação sobre Orçamentos Públicos em Saúde-SIOPS); Ministry of Health, National Registry of Health Establishments (Cadastro Nacional dos Estabelecimentos de Saúde do Brasil-CNES); National Occupation Classification (Classificação Nacional de Ocupação-CBO); National Agency for Supplementary Health (Agência Nacional de Saúde Suplementar-ANS). Production: by the authors.
Publisher’s Note: MDPI stays neutral with regard to jurisdictional claims in published maps and institutional affiliations.

