
Examination of Electrolyte Replacements in the ICU Utilizing MIMIC-III Dataset Demonstrates Redundant Replacement Patterns


Abstract
:1. Background
2. Materials and Methods
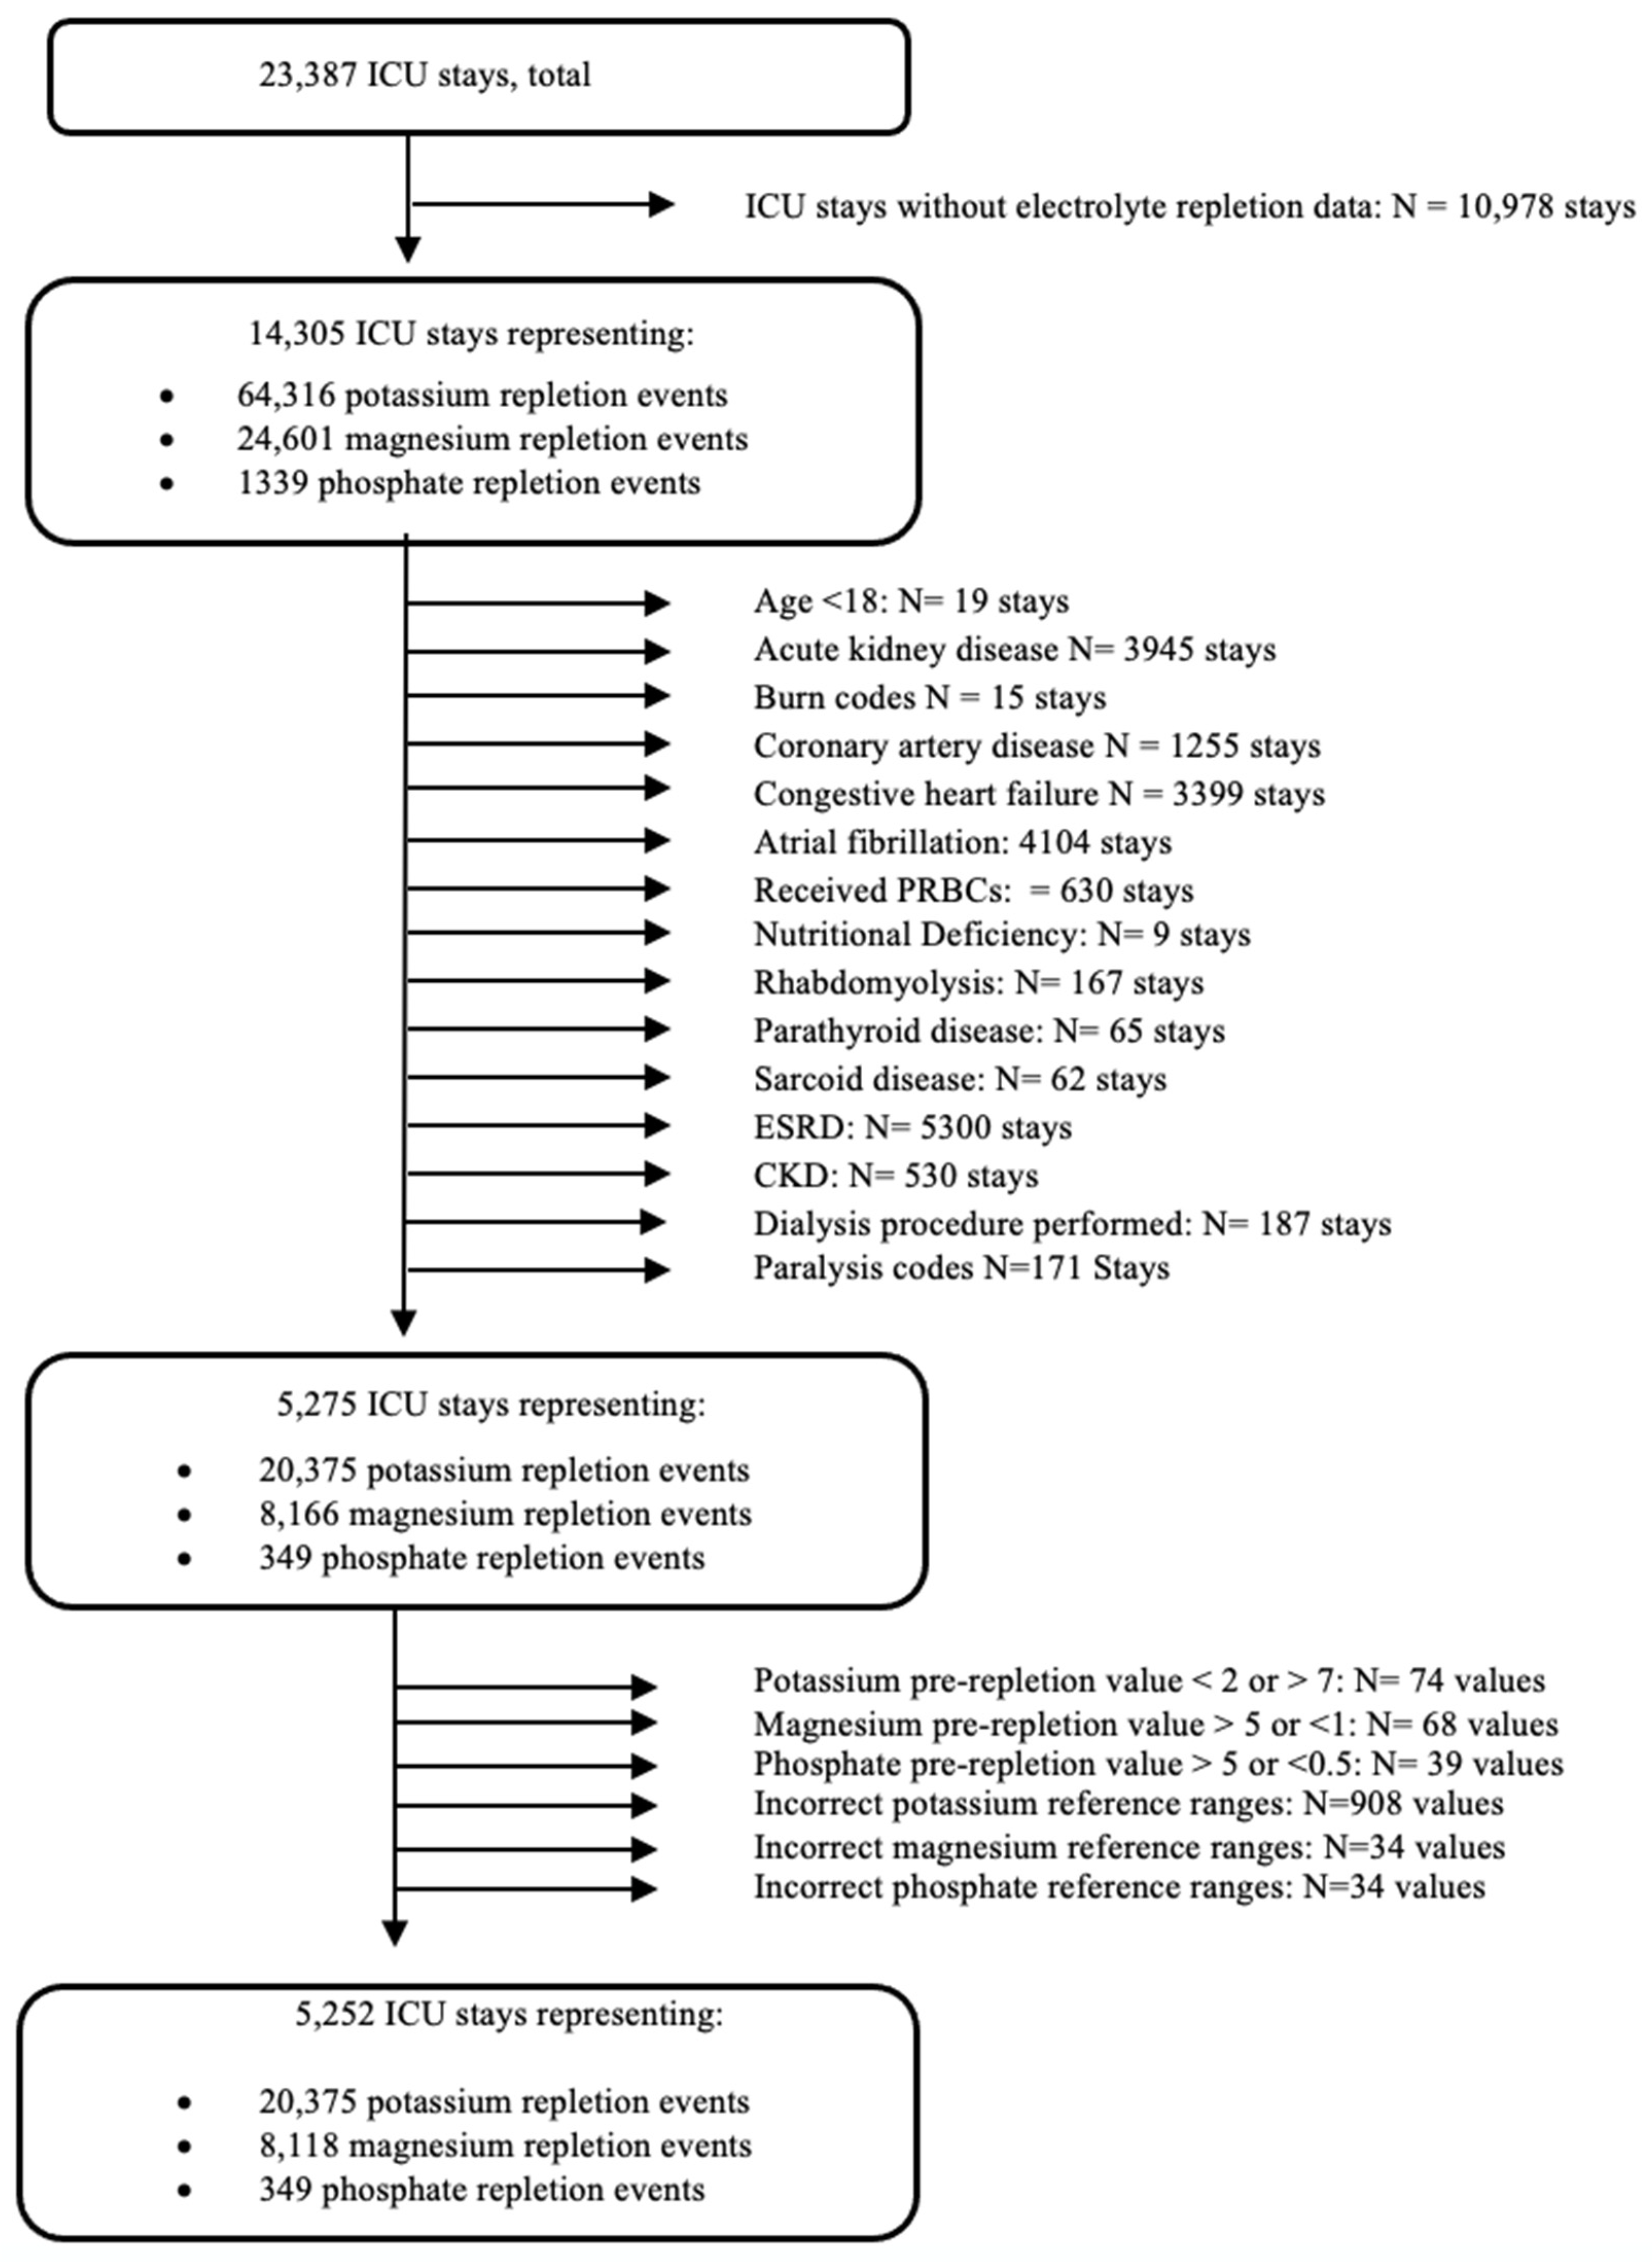
2.1. Sample
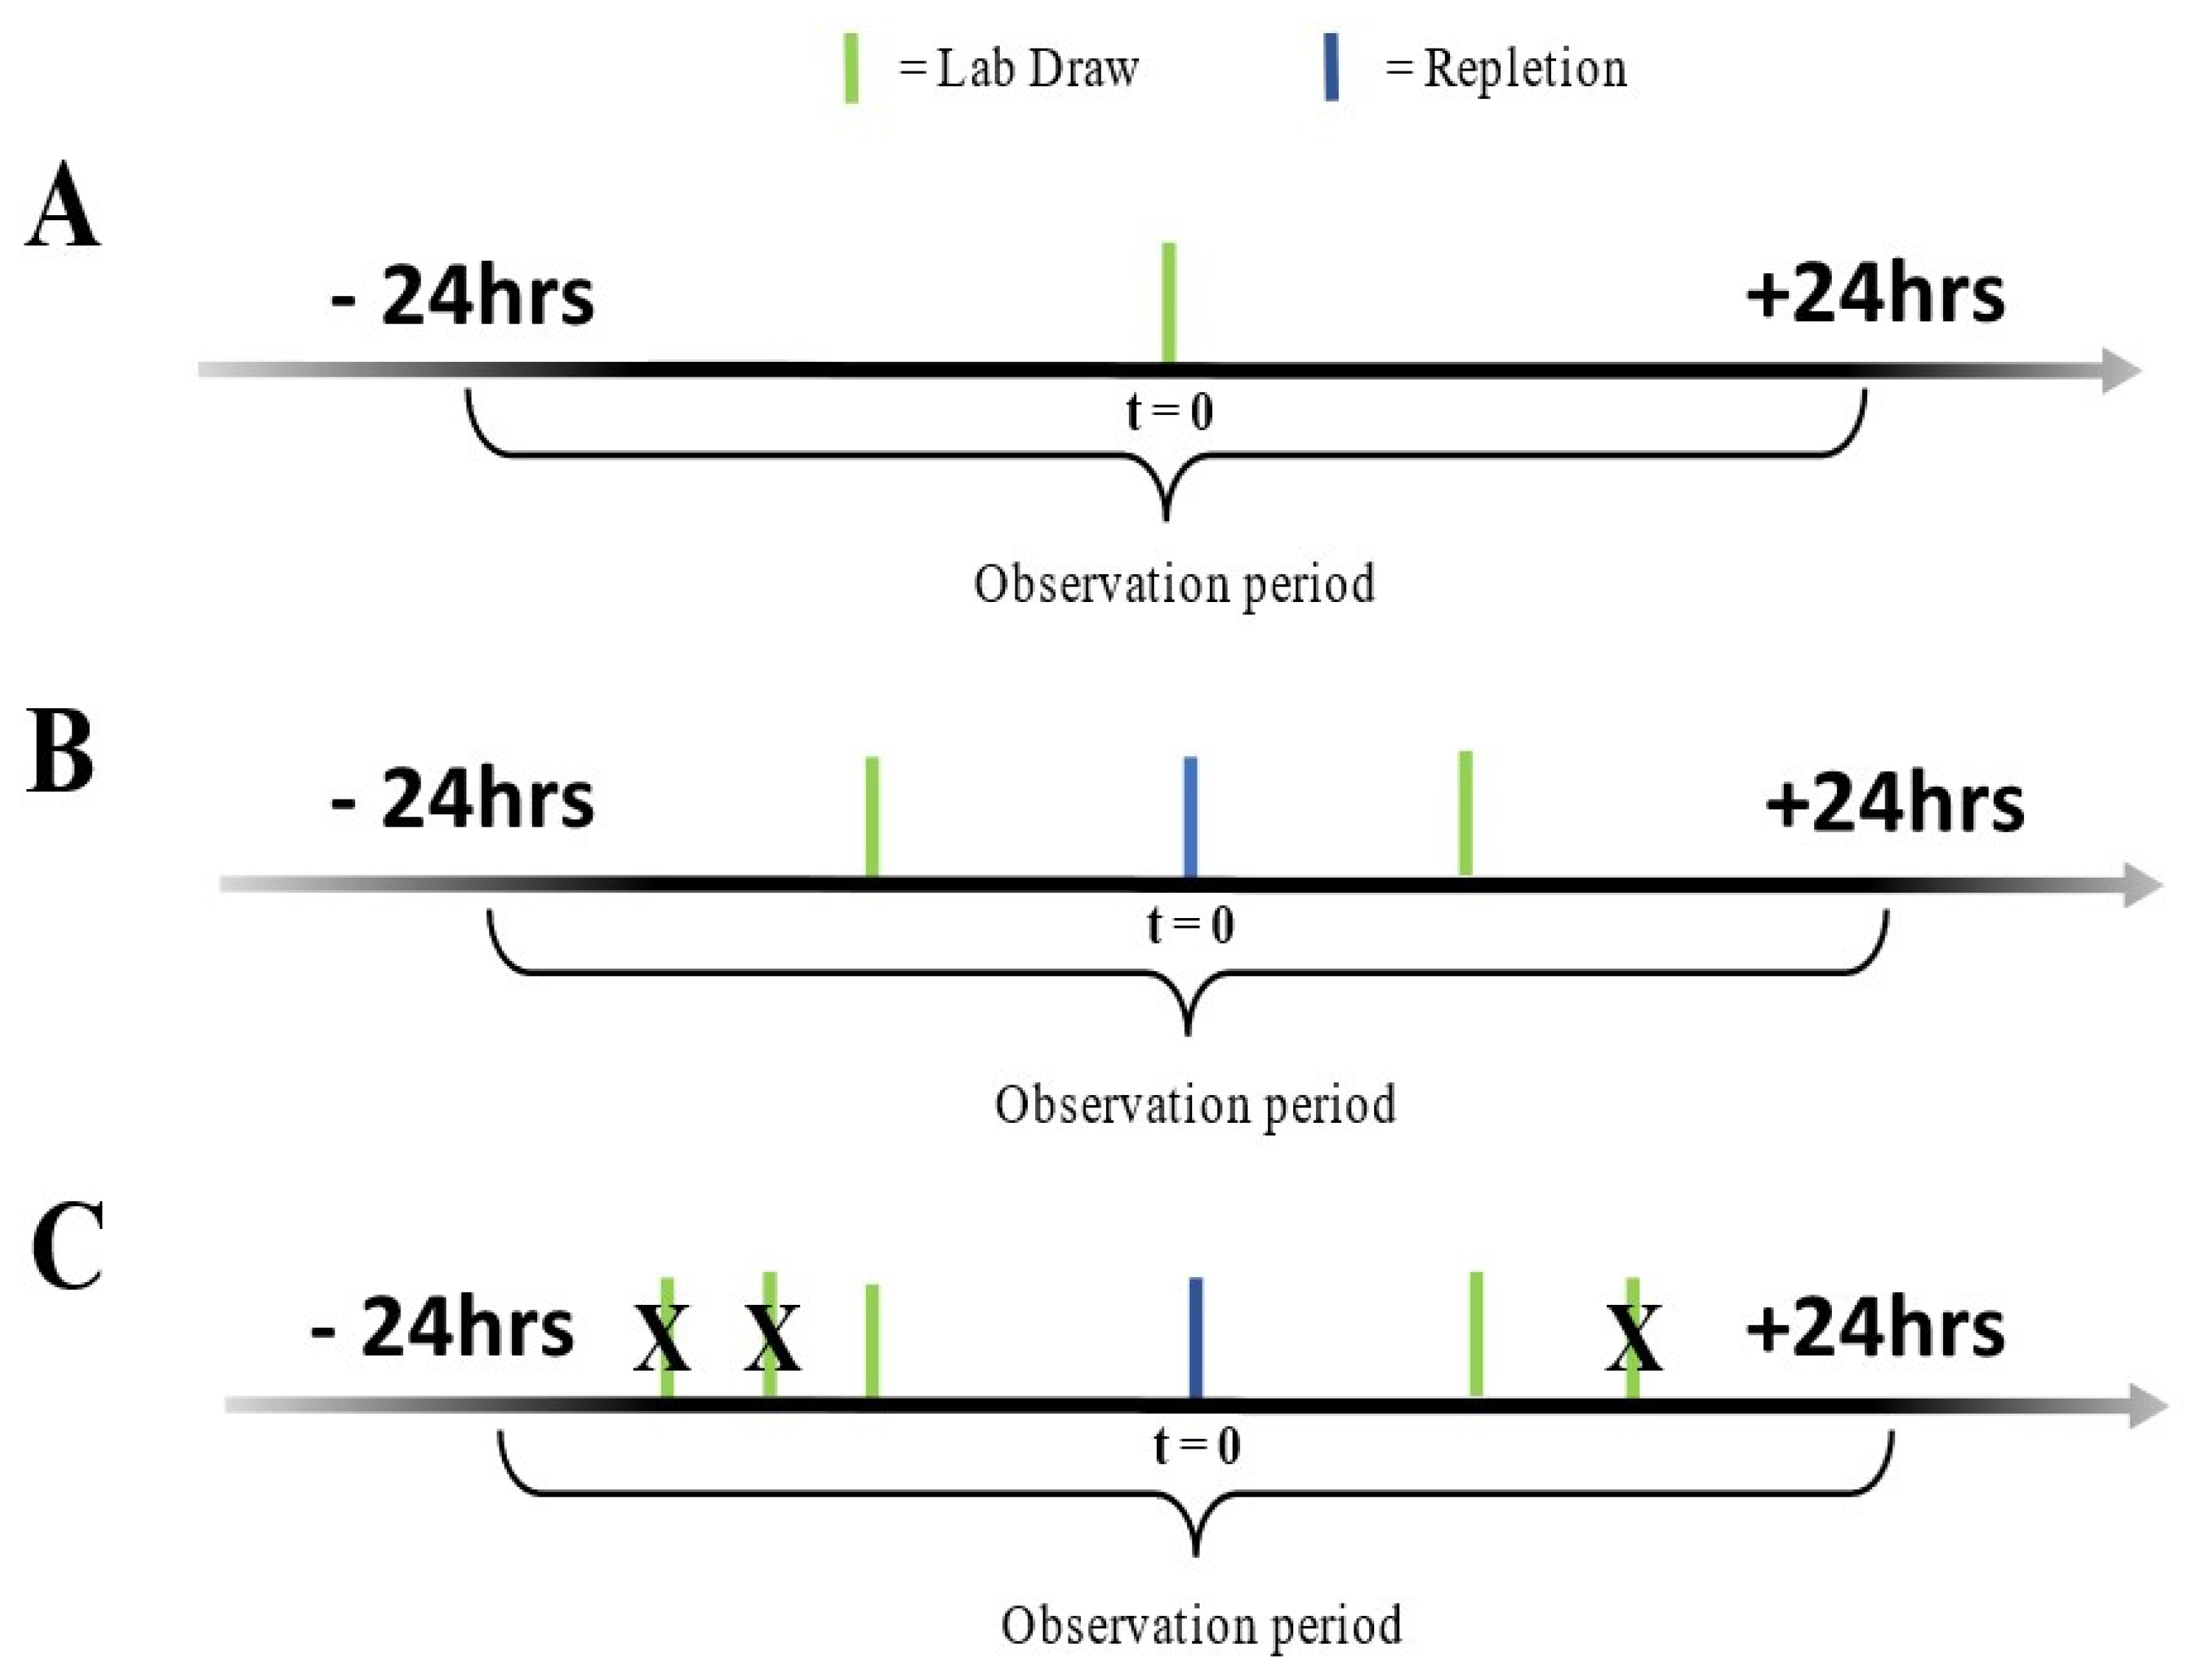
2.2. Study Workflow
2.3. Statistical Analysis
3. Results
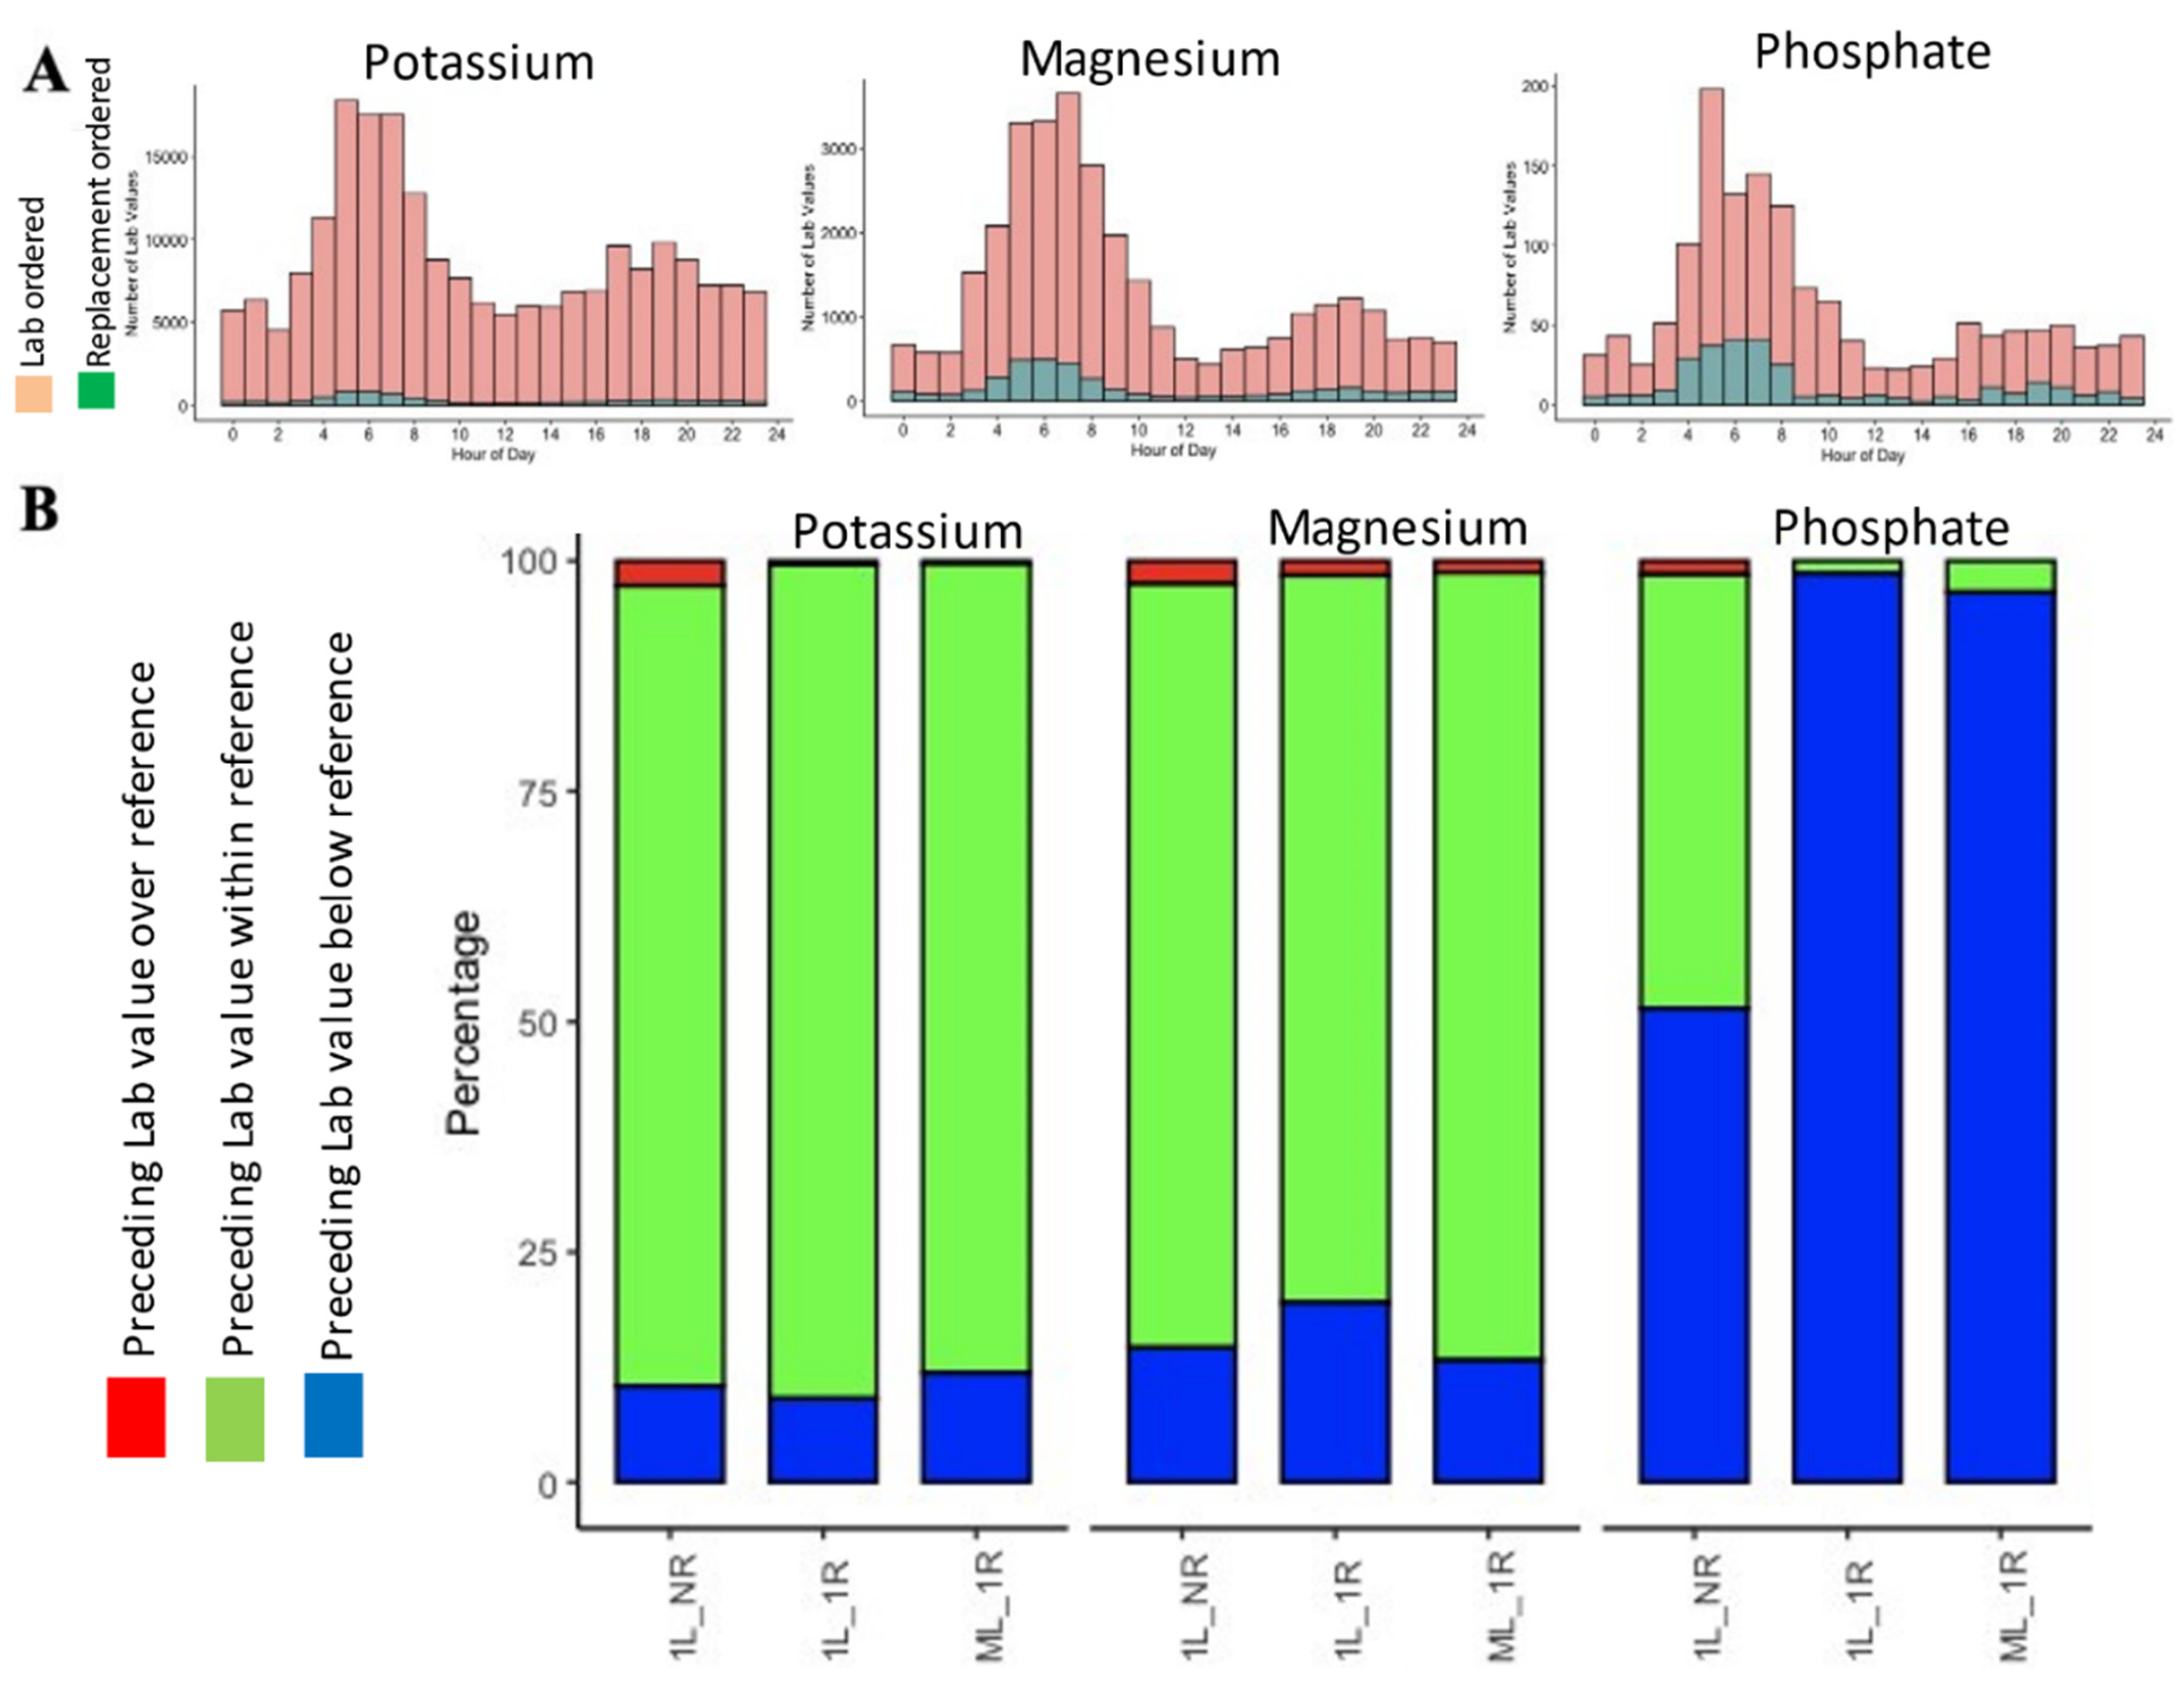
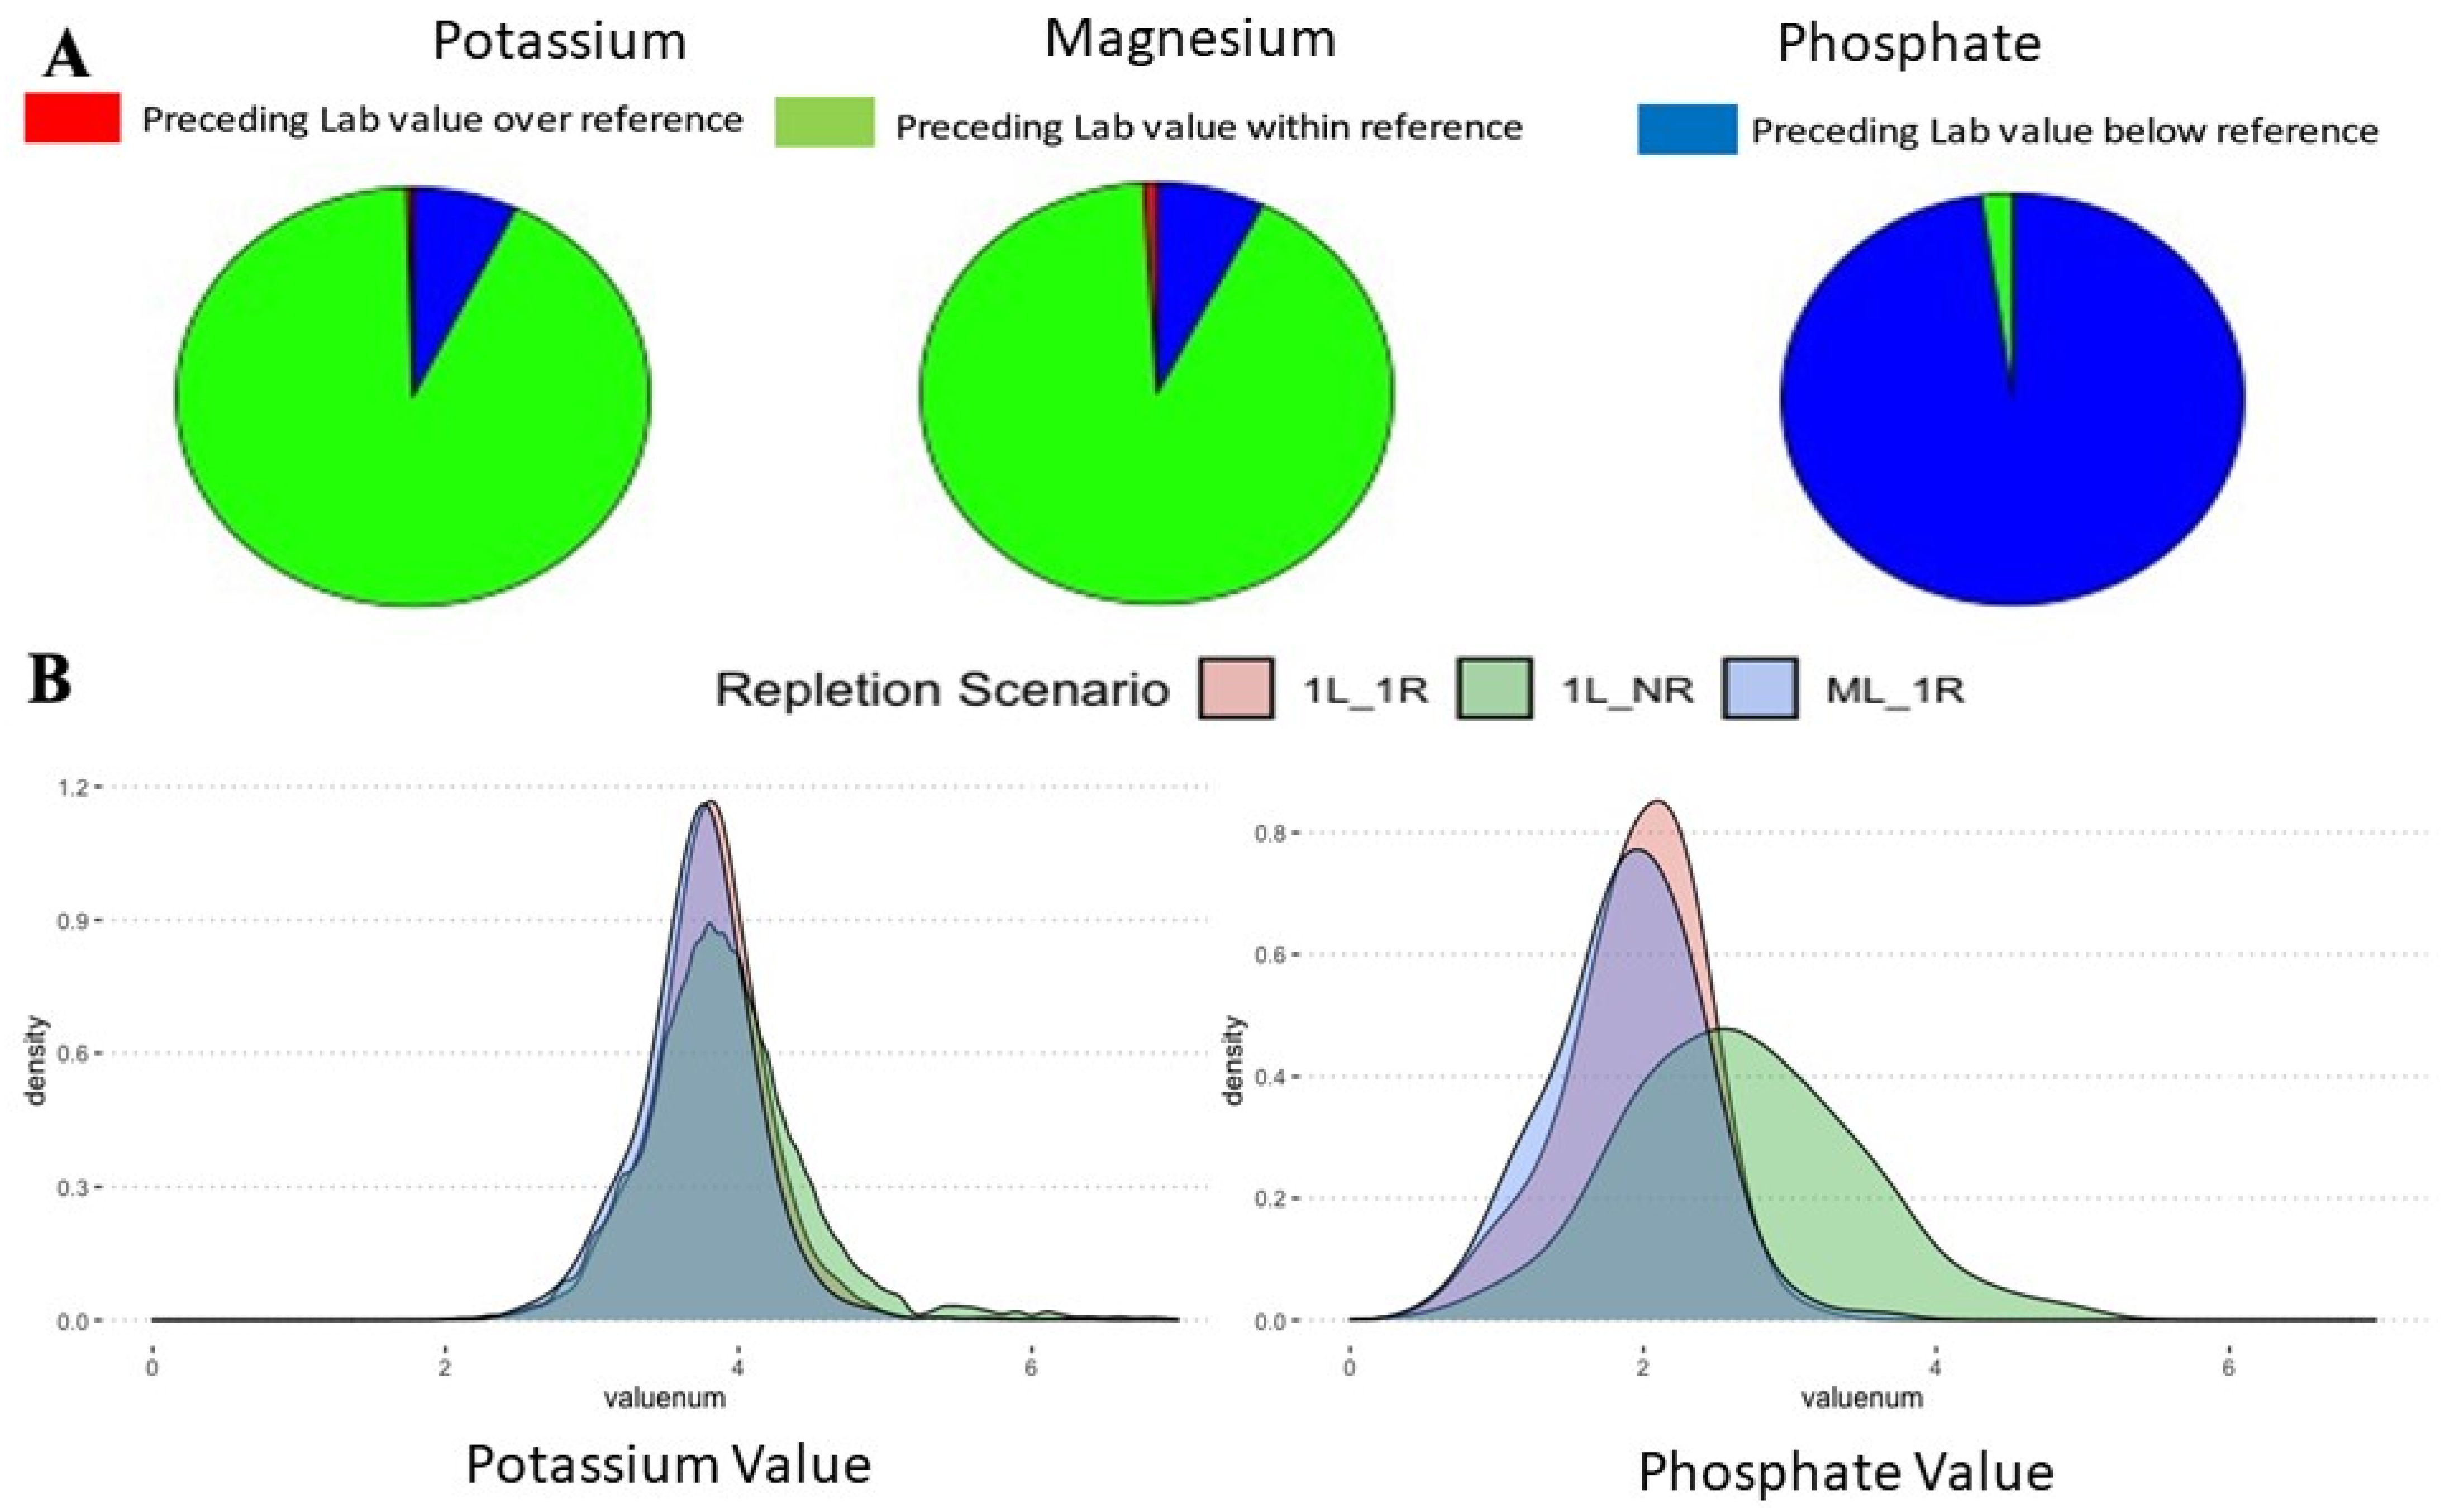
3.1. Relationship between Ordering Serum Electrolyte Replacements and Their Threshold for Replacements
3.2. Investigating Misses and Near Misses among Electrolyte Replacement Patterns
3.3. The Workflow and Triggers in Case of Electrolyte Replacements
3.4. The Effectiveness of Electrolyte Replacement Results in Modest Changes in Post-Repletion Potassium
3.5. The Effect of Clinical Co-Variables and Patient Location on Electrolyte Thresholds
4. Discussion
5. Conclusions
Supplementary Materials
Author Contributions
Funding
Institutional Review Board Statement
Informed Consent Statement
Data Availability Statement
Acknowledgments
Conflicts of Interest
References
- Sedlacek, M.; Schoolwerth, A.C.; Remillard, B.D. Electrolyte disturbances in the intensive care unit. Semin. Dial. 2006, 19, 496–501. [Google Scholar] [CrossRef] [PubMed]
- Parikh, M.; Webb, S.T. Cations: Potassium, calcium, and magnesium. Contin. Educ. Anaesth. Crit. Care Pain 2012, 12, 195–200. [Google Scholar] [CrossRef]
- Svagzdiene, M.; Sirvinskas, E.; Benetis, R.; Raliene, L.; Simatoniene, V. Atrial fibrillation and changes in serum and urinary electrolyte levels after coronary artery bypass grafting surgery. Medicina 2009, 45, 960–970. [Google Scholar] [CrossRef] [Green Version]
- Svagzdiene, M.; Sirvinskas, E. Changes in serum electrolyte levels and their influence on the incidence of atrial fibrillation after coronary artery bypass grafting surgery. Medicina 2006, 42, 208–214. [Google Scholar]
- Cohen, I.; Zimmerman, A.L. Changes in serum electrolyte levels during marathon running. S. Afr. Med. J. 1978, 53, 449–453. [Google Scholar]
- Hypomagnesemia associated with other electrolyte imbalances. Nutr. Rev. 1985, 43, 198–200.
- Zehtabchi, S.; Sinert, R.; Wallace, D.; Caton, M.; Chen, J.; Chang, B.; Lucchesi, M. Is routine electrolyte testing necessary for diabetic patients who present to the emergency department with moderate hyperglycemia? Eur. J. Emerg. Med. 2007, 14, 82–86. [Google Scholar] [CrossRef]
- Arulkumaran, N.; Harrison, D.A.; Brett, S.J. Association between day and time of admission to critical care and acute hospital outcome for unplanned admissions to adult general critical care units: Cohort study exploring the ‘weekend effect’. Br. J. Anaesth. 2017, 118, 112–122. [Google Scholar] [CrossRef] [PubMed] [Green Version]
- Djulbegovic, B.; Hozo, I.; Lyman, G.H. Linking evidence-based medicine therapeutic summary measures to clinical decision analysis. MedGenMed 2000, 2, E6. [Google Scholar]
- Djulbegovic, B.; van den Ende, J.; Hamm, R.M.; Mayrhofer, T.; Hozo, I.; Pauker, S.G. When is rational to order a diagnostic test, or prescribe treatment: The threshold model as an explanation of practice variation. Eur. J. Clin. Investig. 2015, 45, 485–493. [Google Scholar] [CrossRef] [Green Version]
- Polderman, K.H.; Girbes, A.R. Severe electrolyte disorders following cardiac surgery: A prospective controlled observational study. Crit. Care 2004, 8, R459–R466. [Google Scholar] [CrossRef] [Green Version]
- Lancaster, T.S.; Schill, M.R.; Greenberg, J.W.; Moon, M.R.; Schuessler, R.B.; Damiano, R.J.; Melby, S.J., Jr. Potassium and Magnesium Supplementation Do Not Protect Against Atrial Fibrillation After Cardiac Operation: A Time-Matched Analysis. Ann. Thorac. Surg. 2016, 102, 1181–1188. [Google Scholar] [CrossRef] [Green Version]
- Chakraborti, S.; Chakraborti, T.; Mandal, M.; Mandal, A.; Das, S.; Ghosh, S. Protective role of magnesium in cardiovascular diseases: A review. Mol. Cell Biochem. 2002, 238, 163–179. [Google Scholar] [CrossRef]
- Djulbegovic, B.; Guyatt, G.H. Evidence-based practice is not synonymous with delivery of uniform health care. JAMA 2014, 312, 1293–1294. [Google Scholar] [CrossRef] [PubMed]
- Djulbegovic, B.; Hamm, R.M.; Mayrhofer, T.; Hozo, I.; Van den Ende, J. Rationality, practice variation and person-centred health policy: A threshold hypothesis. J. Eval. Clin. Pr. 2015, 21, 1121–1124. [Google Scholar] [CrossRef] [PubMed] [Green Version]
- Peng, T.J.; Andersen, L.W.; Saindon, B.Z.; Giberson, T.A.; Kim, W.Y.; Berg, K.; Novack, V.; Donnino, M.W. American Heart Association’s Get with The Guidelines-Resuscitation I: The administration of dextrose during in-hospital cardiac arrest is associated with increased mortality and neurologic morbidity. Crit. Care 2015, 19, 160. [Google Scholar] [CrossRef] [Green Version]
- Saran, T.; Perkins, G.D.; Javed, M.A.; Annam, V.; Leong, L.; Gao, F.; Stedman, R. Does the prophylactic administration of magnesium sulphate to patients undergoing thoracotomy prevent postoperative supraventricular arrhythmias? A randomized controlled trial. Br. J. Anaesth. 2011, 106, 785–791. [Google Scholar] [CrossRef] [PubMed] [Green Version]
- Biesenbach, P.; Martensson, J.; Lucchetta, L.; Bangia, R.; Fairley, J.; Jansen, I.; Matalanis, G.; Bellomo, R. Pharmacokinetics of Magnesium Bolus Therapy in Cardiothoracic Surgery. J. Cardiothorac. Vasc. Anesth. 2017, 32, 1289–1294. [Google Scholar] [CrossRef]
- Joseph, T.T.; DiMeglio, M.; Huffenberger, A.; Laudanski, K. Behavioural patterns of electrolyte repletion in intensive care units: Lessons from a large electronic dataset. Sci. Rep. 2018, 8, 11915. [Google Scholar] [CrossRef]
- Hozo, I.; Schell, M.J.; Djulbegovic, B. Decision-making when data and inferences are not conclusive: Risk-benefit and acceptable regret approach. Semin. Hematol. 2008, 45, 150–159. [Google Scholar] [CrossRef]
- Djulbegovic, M.; Beckstead, J.; Elqayam, S.; Reljic, T.; Kumar, A.; Paidas, C.; Djulbegovic, B. Thinking Styles and Regret in Physicians. PLoS ONE 2015, 10, e0134038. [Google Scholar]
- da Silva, P.S.L.; Kubo, E.Y.; Junior, E.L.; Fonseca, M.C.M. Does admission time matter in a paediatric intensive care unit? A prospective cohort study. J. Paediatr. Child Health 2021, 57, 1296–1302. [Google Scholar] [CrossRef] [PubMed]
- Kuijsten, H.A.; Brinkman, S.; Meynaar, I.A.; Spronk, P.E.; van der Spoel, J.I.; Bosman, R.J.; de Keizer, N.F.; Abu-Hanna, A.; de Lange, D.W. Hospital mortality is associated with ICU admission time. Intensive Care Med. 2010, 36, 1765–1771. [Google Scholar] [CrossRef] [Green Version]
- Langston, M.C.; Subedi, K.; Fabrizio, C.; Wimmer, N.J.; Choudhry, U.I.; Urrutia, L.E. An examination of cardiovascular intensive care unit mortality based on admission day and time. Heart Lung 2021, 50, 579–586. [Google Scholar] [CrossRef] [PubMed]
- Hijazi, M.; Al-Ansari, M. Protocol-driven vs. physician-driven electrolyte replacement in adult critically ill patients. Ann. Saudi Med. 2005, 25, 105–110. [Google Scholar] [CrossRef] [PubMed]
- Bormanis, J. Development of a massive transfusion protocol. Transfus. Apher. Sci. 2008, 38, 57–63. [Google Scholar] [CrossRef]
- Pearson, D.J.; Sharma, A.; Lospinoso, J.A.; Morris, M.J.; McCann, E.T. Effects of Electrolyte Replacement Protocol Implementation in a Medical Intensive Care Unit. J. Intensive Care Med. 2016, 33, 574–581. [Google Scholar] [CrossRef]
- Kanji, Z.; Jung, K. Evaluation of an electrolyte replacement protocol in an adult intensive care unit: A retrospective before and after analysis. Intensive Crit. Care Nurs. 2009, 25, 181–189. [Google Scholar] [CrossRef]
- Couture, J.; Letourneau, A.; Dubuc, A.; Williamson, D. Evaluation of an electrolyte repletion protocol for cardiac surgery intensive care patients. Can. J. Hosp. Pharm. 2013, 66, 96–103. [Google Scholar] [CrossRef] [Green Version]
- Alexis Ruiz, A.; Wyszynska, P.K.; Laudanski, K. Narrative Review of Decision-Making Processes in Critical Care. Anesth. Analg. 2019, 128, 962–970. [Google Scholar] [CrossRef] [PubMed]
- de Bock, B.A.; Willems, D.L.; Weinstein, H.C. Complexity perspectives on clinical decision making in an intensive care unit. J. Eval. Clin. Pr. 2018, 24, 308–313. [Google Scholar] [CrossRef]
- Roberson, D.; Connell, M.; Dillis, S.; Gauvreau, K.; Gore, R.; Heagerty, E.; Jenkins, K.; Ma, L.; Maurer, A.; Stephenson, J.; et al. Cognitive complexity of the medical record is a risk factor for major adverse events. Perm. J. 2014, 18, 4–8. [Google Scholar] [CrossRef] [PubMed] [Green Version]
- Laudanski, K.; Moon, K.; Singh, A.; Chen, Y.; Restrepo, M. The Characterization of the Toll of Caring for Coronavirus Disease 2019 on ICU Nursing Staff. Crit. Care Explor. 2021, 3, e0380. [Google Scholar] [CrossRef] [PubMed]
- Dunphy, B.C.; Cantwell, R.; Bourke, S.; Fleming, M.; Smith, B.; Joseph, K.S.; Dunphy, S.L. Cognitive elements in clinical decision-making: Toward a cognitive model for medical education and understanding clinical reasoning. Adv. Health Sci. Educ. Theory Pr. 2010, 15, 229–250. [Google Scholar] [CrossRef]
- Cook, D.J. Health professional decision-making in the ICU: A review of the evidence. New Horiz. 1997, 5, 15–19. [Google Scholar]
- Abedini, N.C.; Curtis, J.R. Implementing and Enhancing Multifaceted Systems Interventions to Improve Goals-of-Care Discussions Among Patients with Serious Illness—An Opportunity for Human-Centered Design. JAMA Netw. Open 2021, 4, e2121497. [Google Scholar] [CrossRef]
- Johnson, A.E.; Pollard, T.J.; Shen, L.; Lehman, L.W.; Feng, M.; Ghassemi, M.; Moody, B.; Szolovits, P.; Celi, L.A.; Mark, R.G. MIMIC-III, a freely accessible critical care database. Sci. Data 2016, 3, 160035. [Google Scholar] [CrossRef] [Green Version]
- Kassambara, A. Rstatix. Pipe-Friendly Framework for Basic Statistical Tests, version 0.7.0; 2020. Available online: https://rdrr.io/cran/rstatix/ (accessed on 14 October 2021).
- Wickham, H. ggplot2: Elegant Graphics for Data Analysis; Springer: Berlin/Heidelberg, Germany, 2016. [Google Scholar]
- Orsini, J.; Rajayer, S.; Ahmad, N.; Din, N.; Morante, J.; Malik, R.; Shim, A. Effects of time and day of admission on the outcome of critically ill patients admitted to ICU. J. Community Hosp. Intern. Med. Perspect. 2016, 6, 33478. [Google Scholar] [CrossRef] [PubMed] [Green Version]
- Yergens, D.W.; Ghali, W.A.; Faris, P.D.; Quan, H.; Jolley, R.J.; Doig, C.J. Assessing the association between occupancy and outcome in critically Ill hospitalized patients with sepsis. BMC Emerg. Med. 2015, 15, 31. [Google Scholar] [CrossRef] [Green Version]
- Kassambara, A. Ggpubr: ‘ggplot2’ Based Publication Ready Plots, version 0.4.0; CRAN: Vienna, Austria, 2020. [Google Scholar]
- Wickham, H.; Ruiz, E. Dbplyr: A ‘dplyr’ Back End for Databases, R package version 1.4.4; CRANE: Vienna, Austria, 2020. [Google Scholar]
- Wickham, H.; Ooms, J.; Muller, K. RPostgres: ‘Rcpp’ Interface to ‘PostgreSQL’, R package version 1.2.0; CRANE: Vienna, Austria, 2019. [Google Scholar]
- Xie, Y. Knitr: A General-Purpose Package for Dynamic Report Generation in R, version 1.36; CRANE: Vienna, Austria, 2021. [Google Scholar]
- Dowie, M.; Srinivasan, M. Data Table: Extension of ‘Data Frame‘, 1.14.0 ed.; CRAN: Vienna, Austria, 2021. [Google Scholar]
- Grolemund, G.; Wickham, H. Dates and Times Made Easy with lubridate. J. Stat. Spoft. 2011, 30, 1–25. [Google Scholar]
- Barton, A.B.; Okorodudu, D.E.; Bosworth, H.B.; Crowley, M.J. Clinical Inertia in a Randomized Trial of Telemedicine-Based Chronic Disease Management: Lessons Learned. Telemed. E Health 2018, 24, 742–748. [Google Scholar] [CrossRef] [PubMed]
- Chew, B.H.; Hussain, H.; Supian, Z.A. Is therapeutic inertia present in hyperglycaemia, hypertension and hypercholesterolaemia management among adults with type 2 diabetes in three health clinics in Malaysia? a retrospective cohort study. BMC Fam. Pr. 2021, 22, 111. [Google Scholar]
- Ramarajan, V.; Chima, H.S.; Young, L. Implementation of Later Morning Specimen Draws to Improve Patient Health and Satisfaction. Lab. Med. 2016, 47, e1–e4. [Google Scholar] [CrossRef]
- Tapaskar, N.; Kilaru, M.; Puri, T.S.; Martin, S.K.; Edstrom, E.; Leung, E.; Ahmed, F.; Kondo, R.; Norenberg, A.; Poli, E.; et al. Evaluation of the Order SMARTT: An Initiative to Reduce Phlebotomy and Improve Sleep-Friendly Labs on General Medicine Services. J. Hosp. Med. 2020, 15, 479–482. [Google Scholar] [CrossRef] [PubMed]
- Faisal, A.; Andres, K.; Rind, J.A.K.; Das, A.; Alter, D.; Subramanian, J.; Koehler, T.J.; Parker, J.; Bernicchi, N. Reducing the number of unnecessary routine laboratory tests through education of internal medicine residents. Postgrad. Med. J. 2018, 94, 716–719. [Google Scholar] [CrossRef] [PubMed]
- Konger, R.L.; Ndekwe, P.; Jones, G.; Schmidt, R.P.; Trey, M.; Baty, E.J.; Wilhite, D.; Munshi, I.A.; Sutter, B.M.; Rao, M.; et al. Reduction in Unnecessary Clinical Laboratory Testing Through Utilization Management at a US Government Veterans Affairs Hospital. Am. J. Clin. Pathol. 2016, 145, 355–364. [Google Scholar] [CrossRef] [Green Version]


| Lab Interpretation | N | % | p and d-Cohen as Compared to a Threshold at the Repletion Reference Value | p and d-Cohen as Compared to a Threshold at the Nominal Reference Value | ||
|---|---|---|---|---|---|---|
| Potassium | Non-repletion | Above | 5790 | 2.71 | 6.05 ± 0.83 # [d = 0.52] | ≪0.00001; 3.05 |
| Within | 185,666 | 86.81 | 3.95 ± 0.42 # [d = 0.30] | Nominal | ||
| Below | 22,410 | 10.48 | 3.00 ± 0.26 # [d = 0.08] | ≪0.00001, 2.94 | ||
| Repletion | Above | 27 | 0.38 | 5.69 ± 0.42, | ≪0.00001, 5.20 | |
| Within | 6400 | 89.31 | 3.84 ± 0.31 | Nominal | ||
| Below | 739 | 10.31 | 3.02 ± 0.19 | ≪0.00001, 3.11 | ||
| Magnesium | Non-repletion | Above | 812 | 2.51 | 2.96 ± 0.70 | ≪0.00001, 3.32 |
| Within | 26,823 | 82.88 | 2.03 ± 0.22 # [d = 0.73] | Nominal | ||
| Below | 4729 | 14.61 | 1.38 ± 0.16 # [d = 0.24] | ≪0.00001, 3.4 | ||
| Repletion | Above | 55 | 1.47 | 3.06 ± 0.39 | ≪0.00001, 3.64 | |
| Within | 3041 | 81.24 | 1.90 ± 0.16 | Nominal | ||
| Below | 647 | 17.29 | 1.41 ± 0.12 | ≪0.00001, 3.74 | ||
| Phosphate | Non-repletion | Above | 22 | 1.49 | 4.85 ± 0.49 | ≪0.00001, 4.86 |
| Within | 696 | 47.03 | 3.28 ± 0.34 | Nominal | ||
| Below | 762 | 51.49 | 2.05 ± 0.46 # [d = 0.37] | ≪0.00001, 2.76 | ||
| Repletion | Above | 0 | 0 | 0 | NA | |
| Within | 7 | 2.37 | 3.04 ± 0.28 | Nominal | ||
| Below | 288 | 97.63 | 1.89 ± 0.43 | 0.00002, 3.14 |
| Potassium | Magnesium | Phosphate | ||
|---|---|---|---|---|
| Patient Weight | Coefficient (SD) | 0.001 *** (−0.0003) | 0.0004 (−0.0004) | 0.004 (−0.002) |
| Age | Coefficient (SD) | −0.001 ** (−0.0003) | −0.0004 * (−0.0003) | 0.002 * (−0.001) |
| Sodium | Coefficient (SD) | −0.013 *** (−0.002) | −0.001 (−0.002) | −0.026 ** (−0.01) |
| Anion Gap | Coefficient (SD) | −0.004 * (−0.002) | 0.004 * (−0.002) | −0.011 (−0.012) |
| Creatine | Coefficient (SD) | −0.014 (−0.034) | −0.078 ** (−0.032) | −0.196 (−0.181) |
| BUN | Coefficient (SD) | 0.001 (−0.001) | 0.001 (−0.001) | 0.008 (−0.006) |
| WBC | Coefficient (SD) | 0.001 (−0.001) | 0.0001 (−0.001) | 0.007 (−0.006) |
| Unit | Coefficient (SD) | −0.002 *** (−0.0004) | −0.001 *** (−0.0004) | 0.0002 (−0.002) |
| Magnesium | Coefficient (SD) | 0.018 (−0.019) | 0.070 *** (−0.026) | −0.074 (−0.052) |
| Phosphate | Coefficient (SD) | 0.025 *** (−0.008) | −0.017 ** (−0.008) | 0.043 (−0.059) |
| Chloride | Coefficient (SD) | 0.008 *** (−0.002) | 0.001 (−0.002) | 0.001 (−0.008) |
| Heart Rate | Coefficient (SD) | −0.001 * (−0.0004) | −0.001 *** (−0.0004) | −0.004 ** (−0.002) |
| Respiratory Rate | Coefficient (SD) | −0.004 *** (−0.001) | 0.001 (−0.001) | −0.005 (−0.006) |
| Glucose | Coefficient (SD) | −0.0002 ** (−0.0001) | 0.0002 (−0.0001) | −0.001 (−0.001) |
| Systolic BP | Coefficient (SD) | −0.0002 (−0.0003) | −0.001 (−0.0004) | −0.004 * (−0.002) |
| Potassium | Coefficient (SD) | 0.188 *** (−0.014) | −0.032 ** (−0.015) | 0.096 (−0.064) |
| Constant | Coefficient (SD) | 4.081 *** (−0.228) | 2.070 *** (−0.262) | 5.522 *** (−1.232) |
| Observations | 2761 | 1520 | 165 | |
| R2 | 0.126 | 0.034 | 0.201 | |
| Adjusted R2 | 0.121 | 0.023 | 0.109 | |
| Residual Std. Error | 0.392 (df = 2743) | 0.295 (df = 1502) | 0.443 (df = 147) | |
| F Statistic | 23.322 *** (df = 17; 2743) | 3.090 *** (df = 17; 1502) | 2.175 *** (df = 17; 147) | |
Publisher’s Note: MDPI stays neutral with regard to jurisdictional claims in published maps and institutional affiliations. |
© 2021 by the authors. Licensee MDPI, Basel, Switzerland. This article is an open access article distributed under the terms and conditions of the Creative Commons Attribution (CC BY) license (https://creativecommons.org/licenses/by/4.0/).
Share and Cite
Ghannam, M.; Malihi, P.; Laudanski, K. Examination of Electrolyte Replacements in the ICU Utilizing MIMIC-III Dataset Demonstrates Redundant Replacement Patterns. Healthcare 2021, 9, 1373. https://doi.org/10.3390/healthcare9101373
Ghannam M, Malihi P, Laudanski K. Examination of Electrolyte Replacements in the ICU Utilizing MIMIC-III Dataset Demonstrates Redundant Replacement Patterns. Healthcare. 2021; 9(10):1373. https://doi.org/10.3390/healthcare9101373
Chicago/Turabian StyleGhannam, Mousa, Parasteh Malihi, and Krzysztof Laudanski. 2021. "Examination of Electrolyte Replacements in the ICU Utilizing MIMIC-III Dataset Demonstrates Redundant Replacement Patterns" Healthcare 9, no. 10: 1373. https://doi.org/10.3390/healthcare9101373