
Competitive and Recreational Running Kinematics Examined Using Principal Components Analysis

 ,
,  and
and 
Abstract
:1. Introduction
2. Materials and Methods
2.1. Participants
2.2. Test Protocol
2.3. Data Process and Analysis
2.4. Principal Component Analysis Methods
2.5. Principal Components Numbers
2.6. Statistical Analysis
3. Results
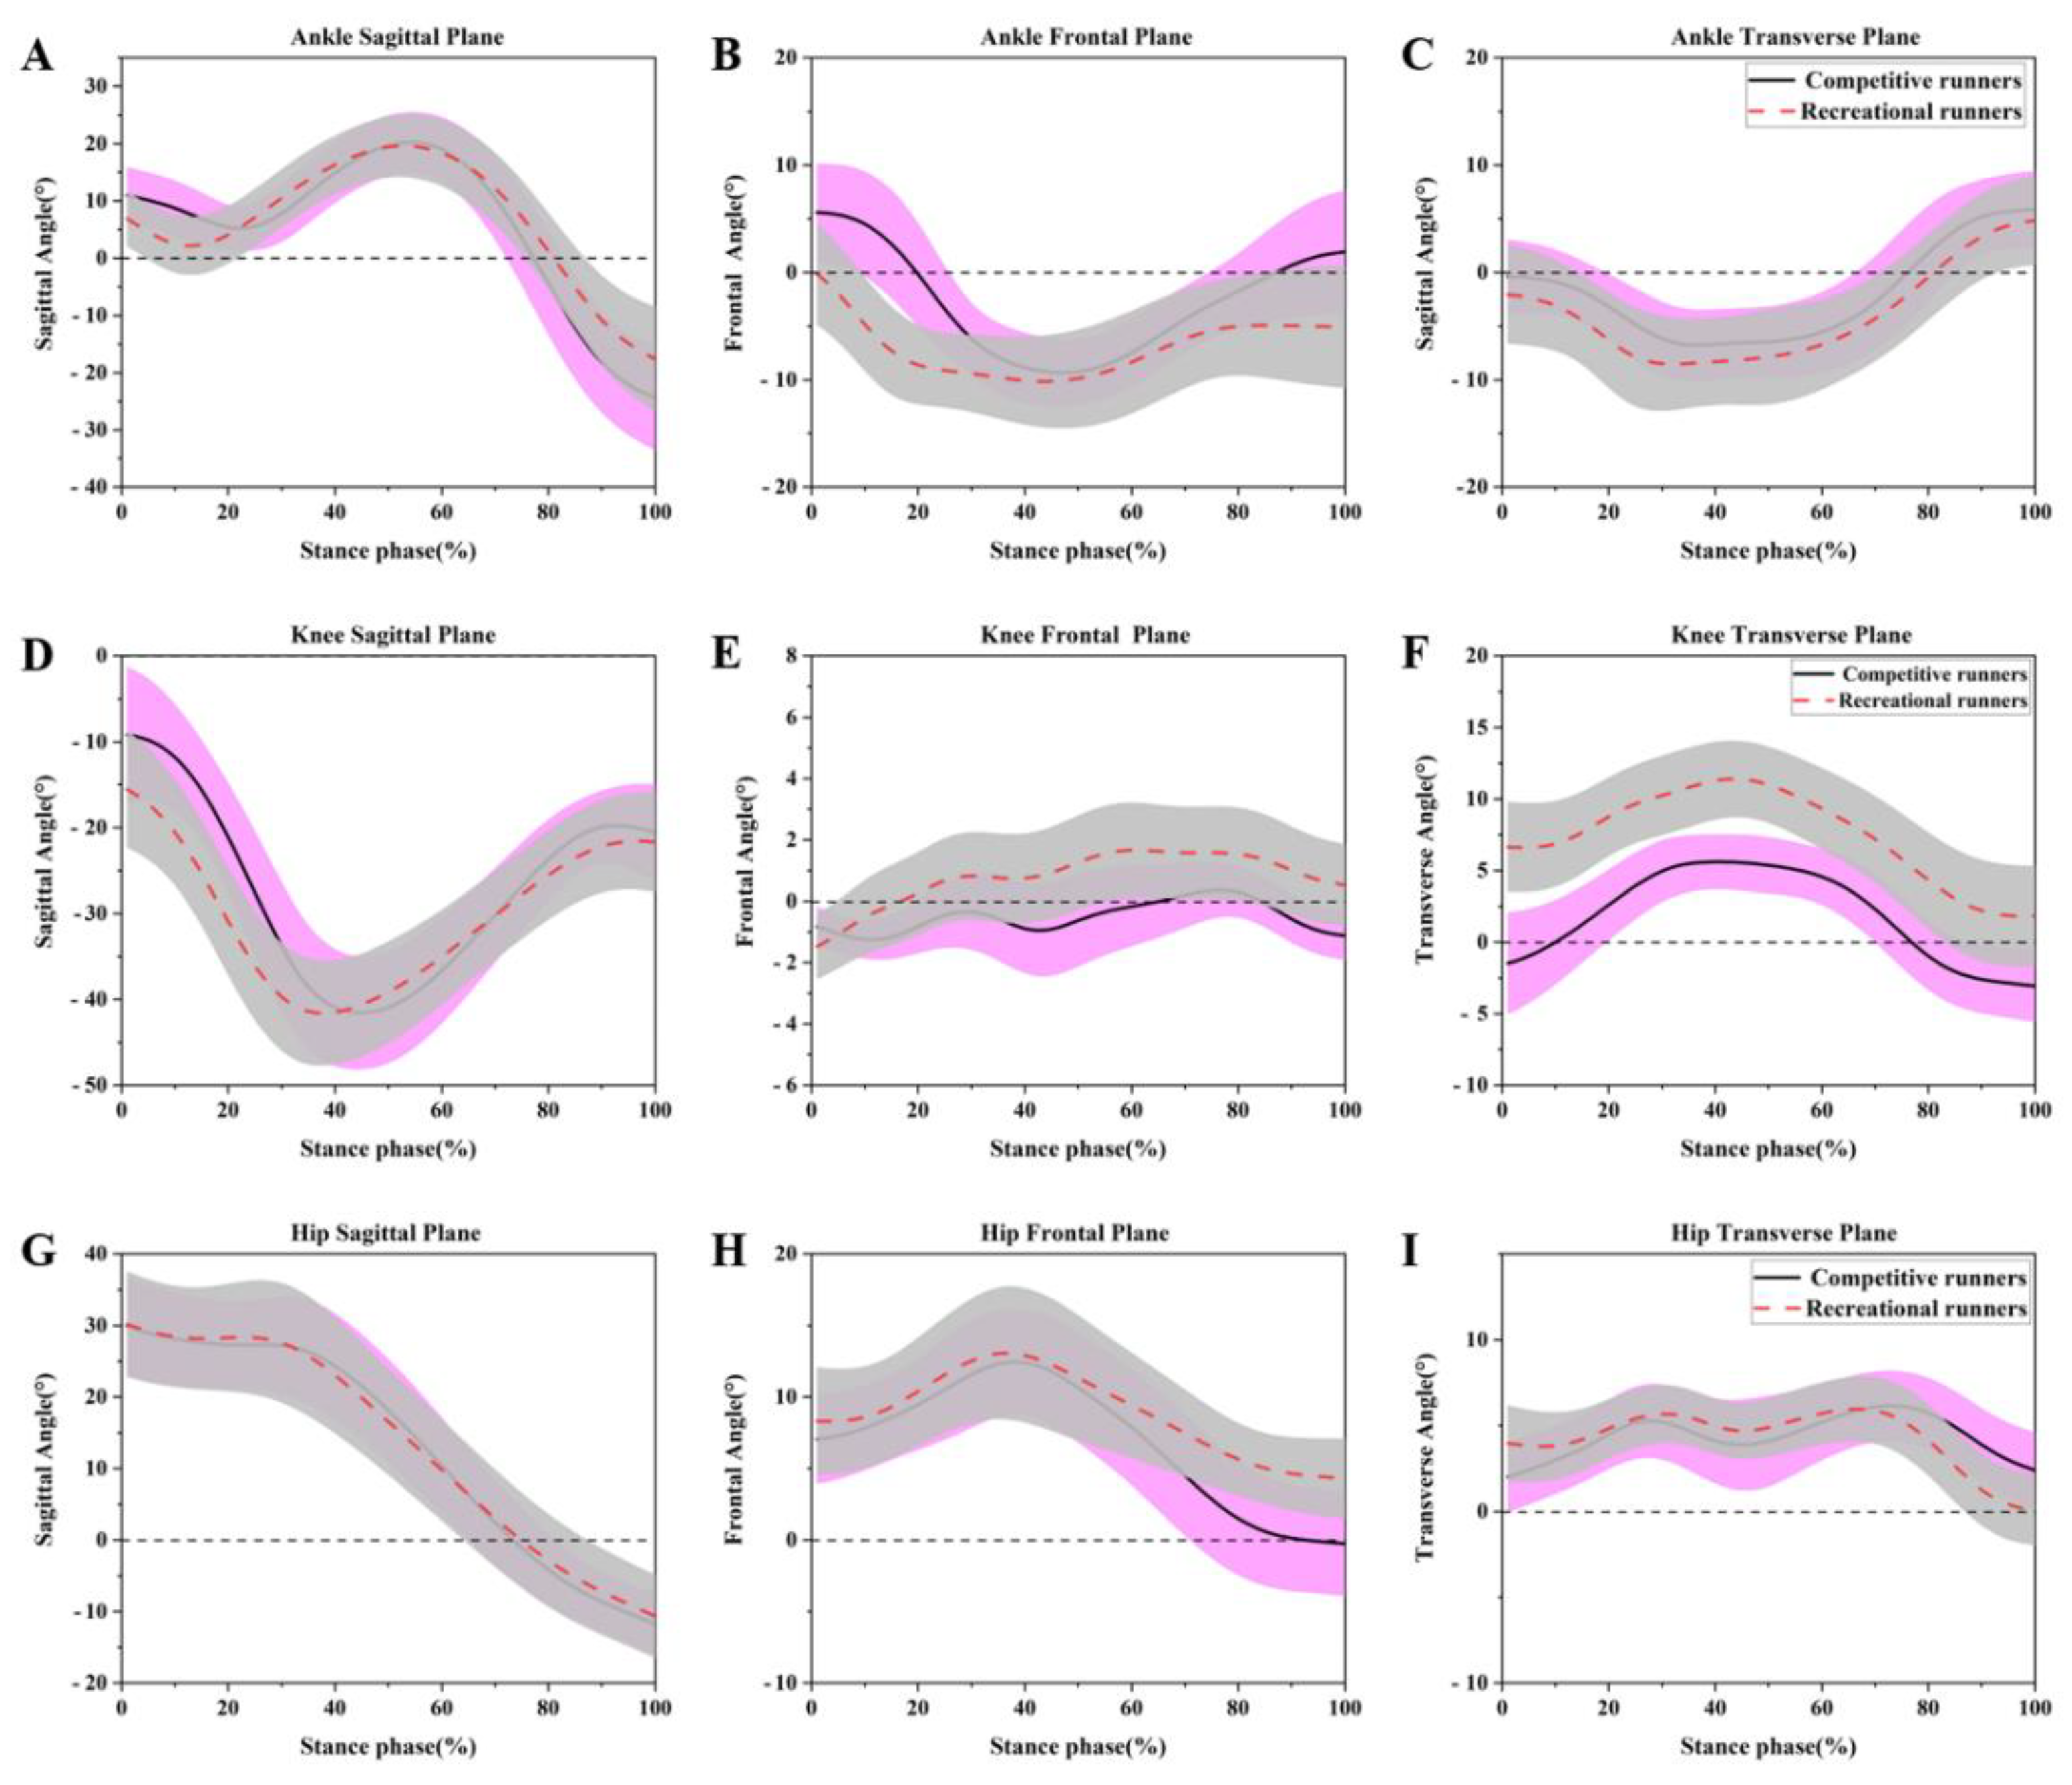
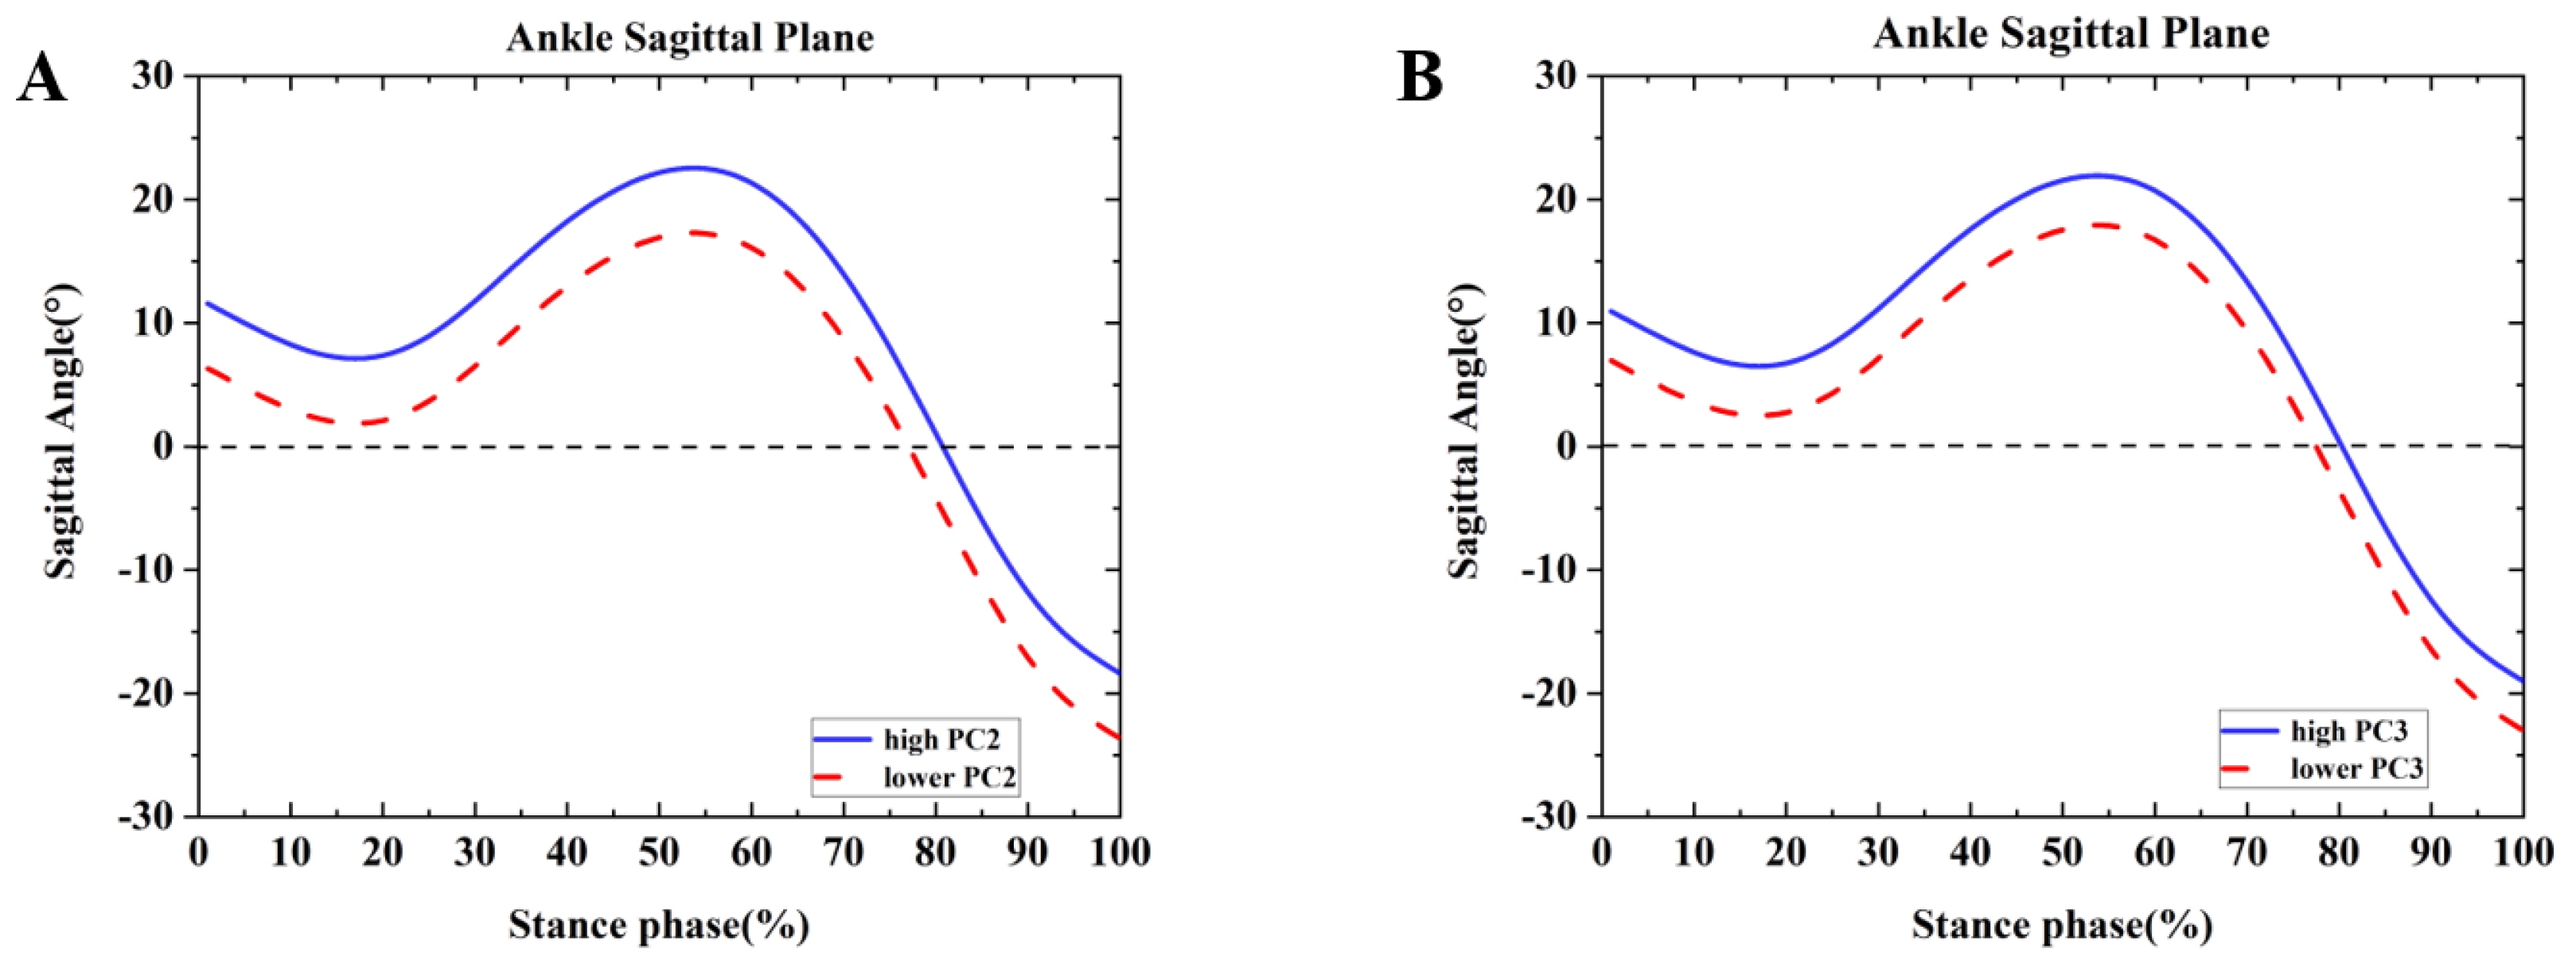
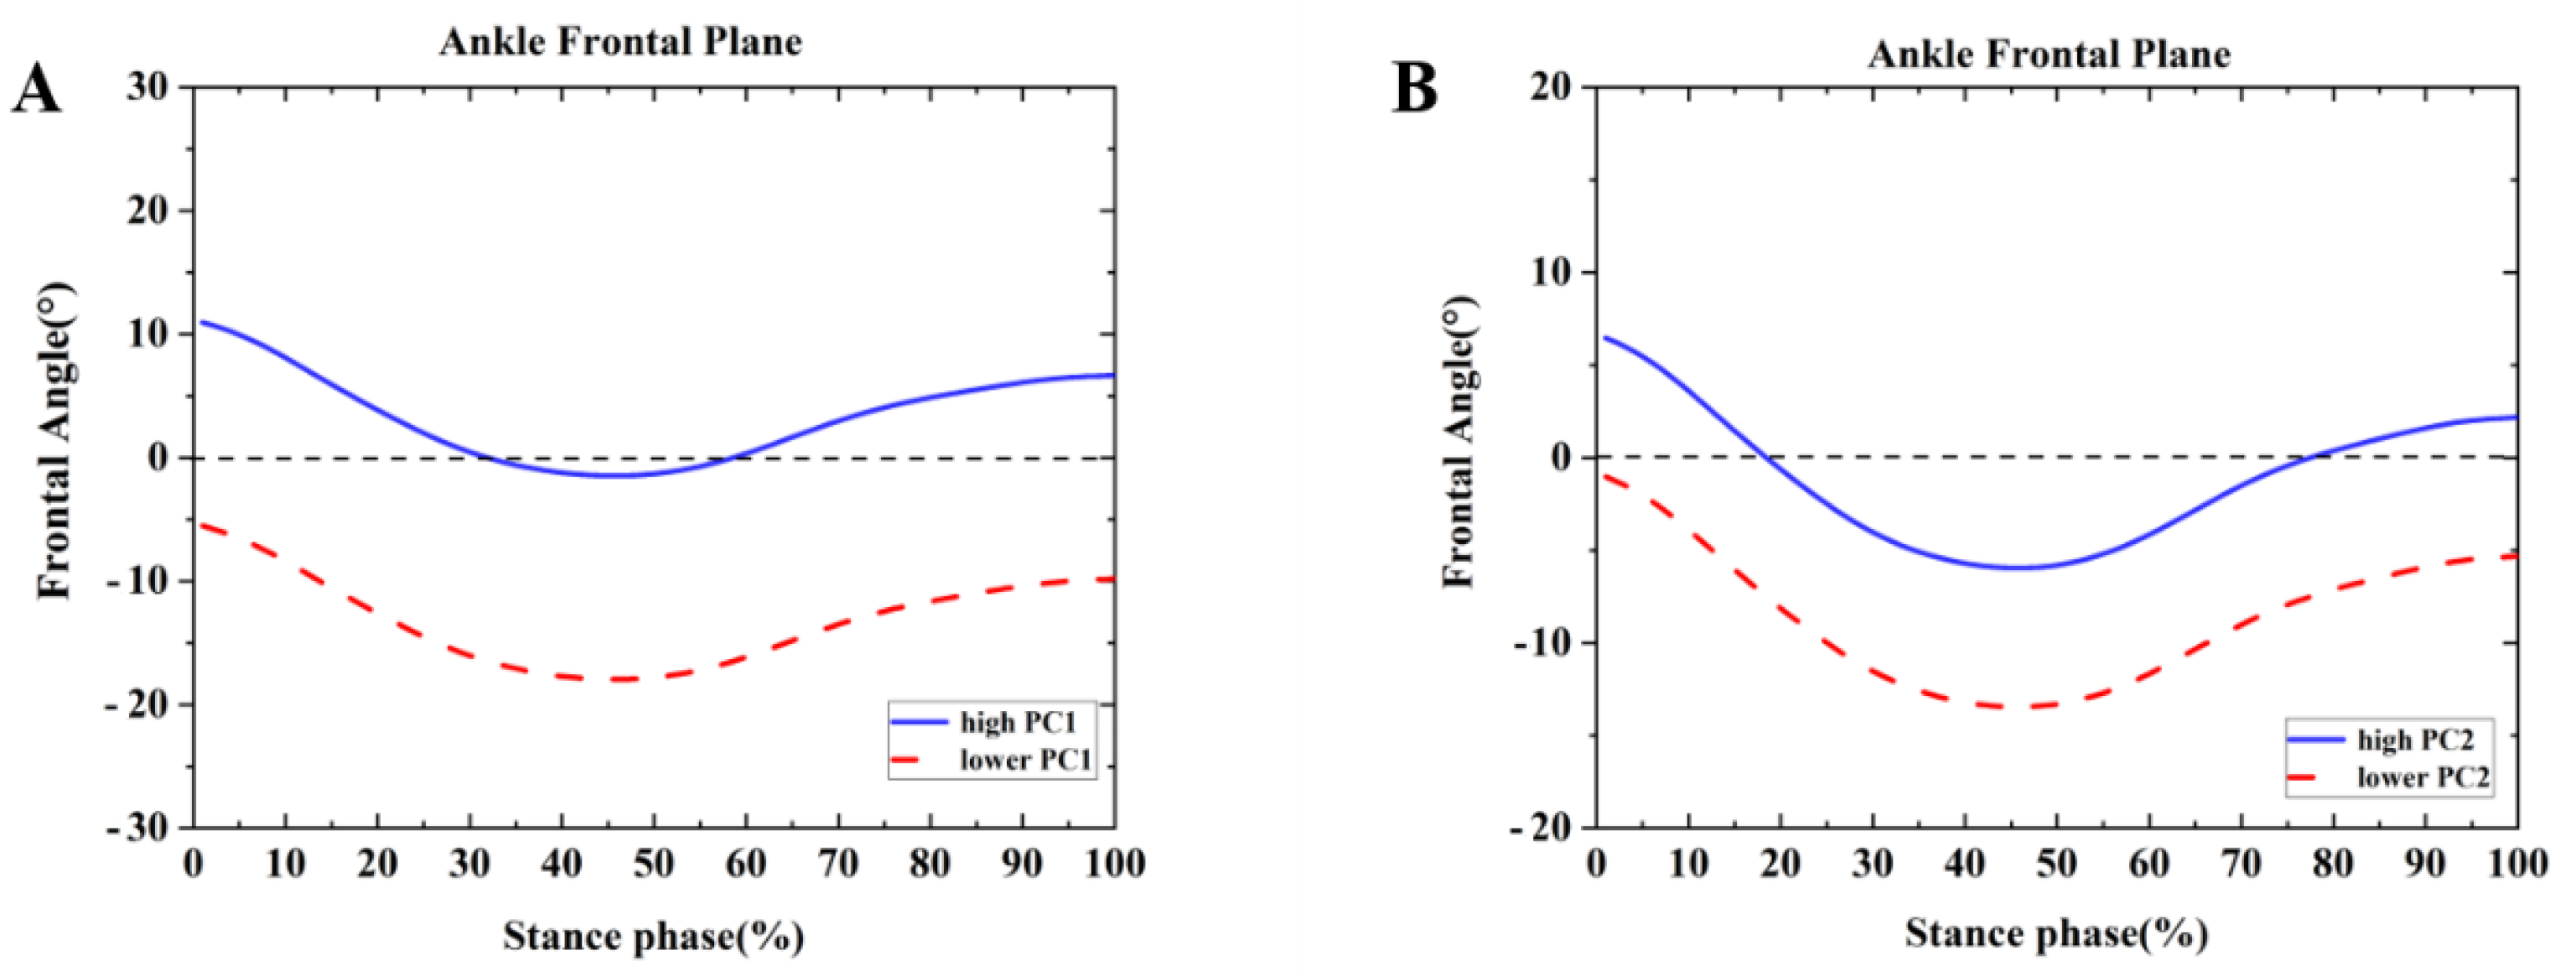
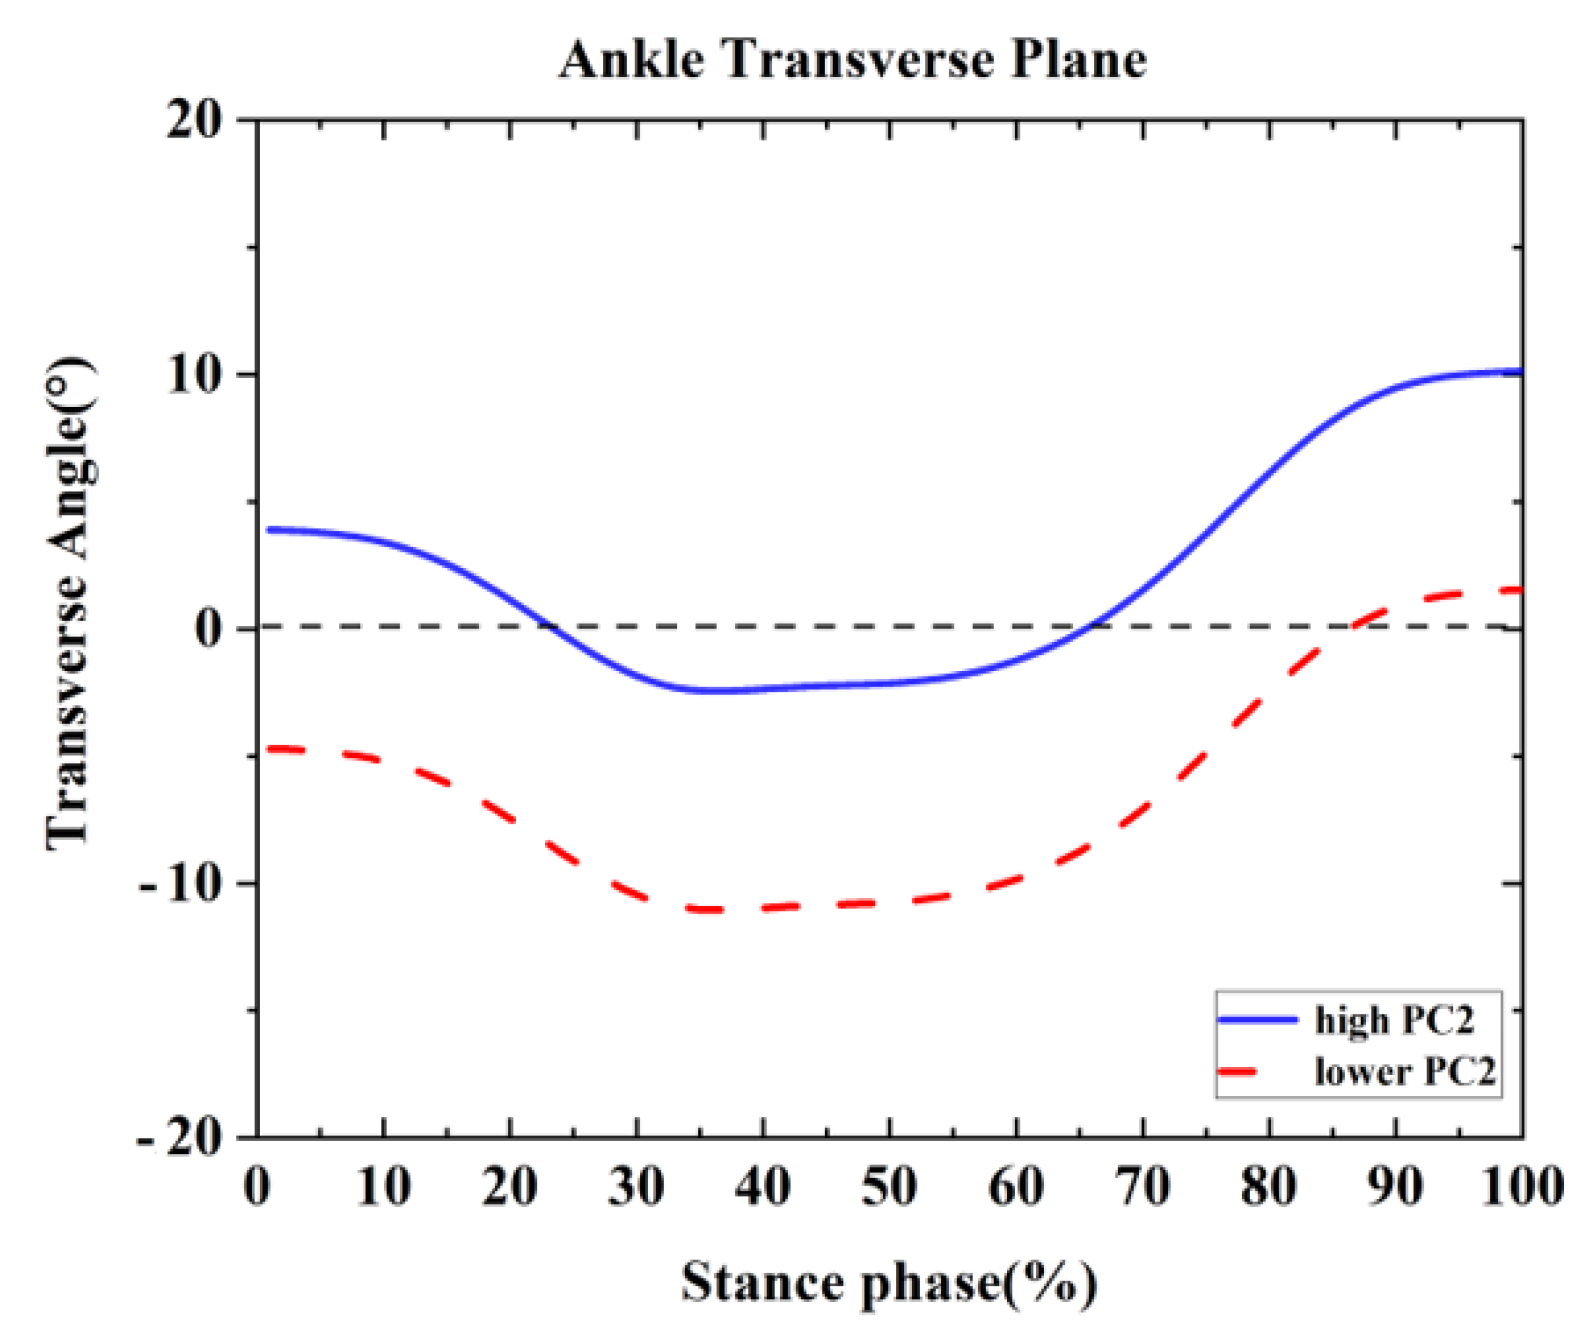
3.1. Ankle Results
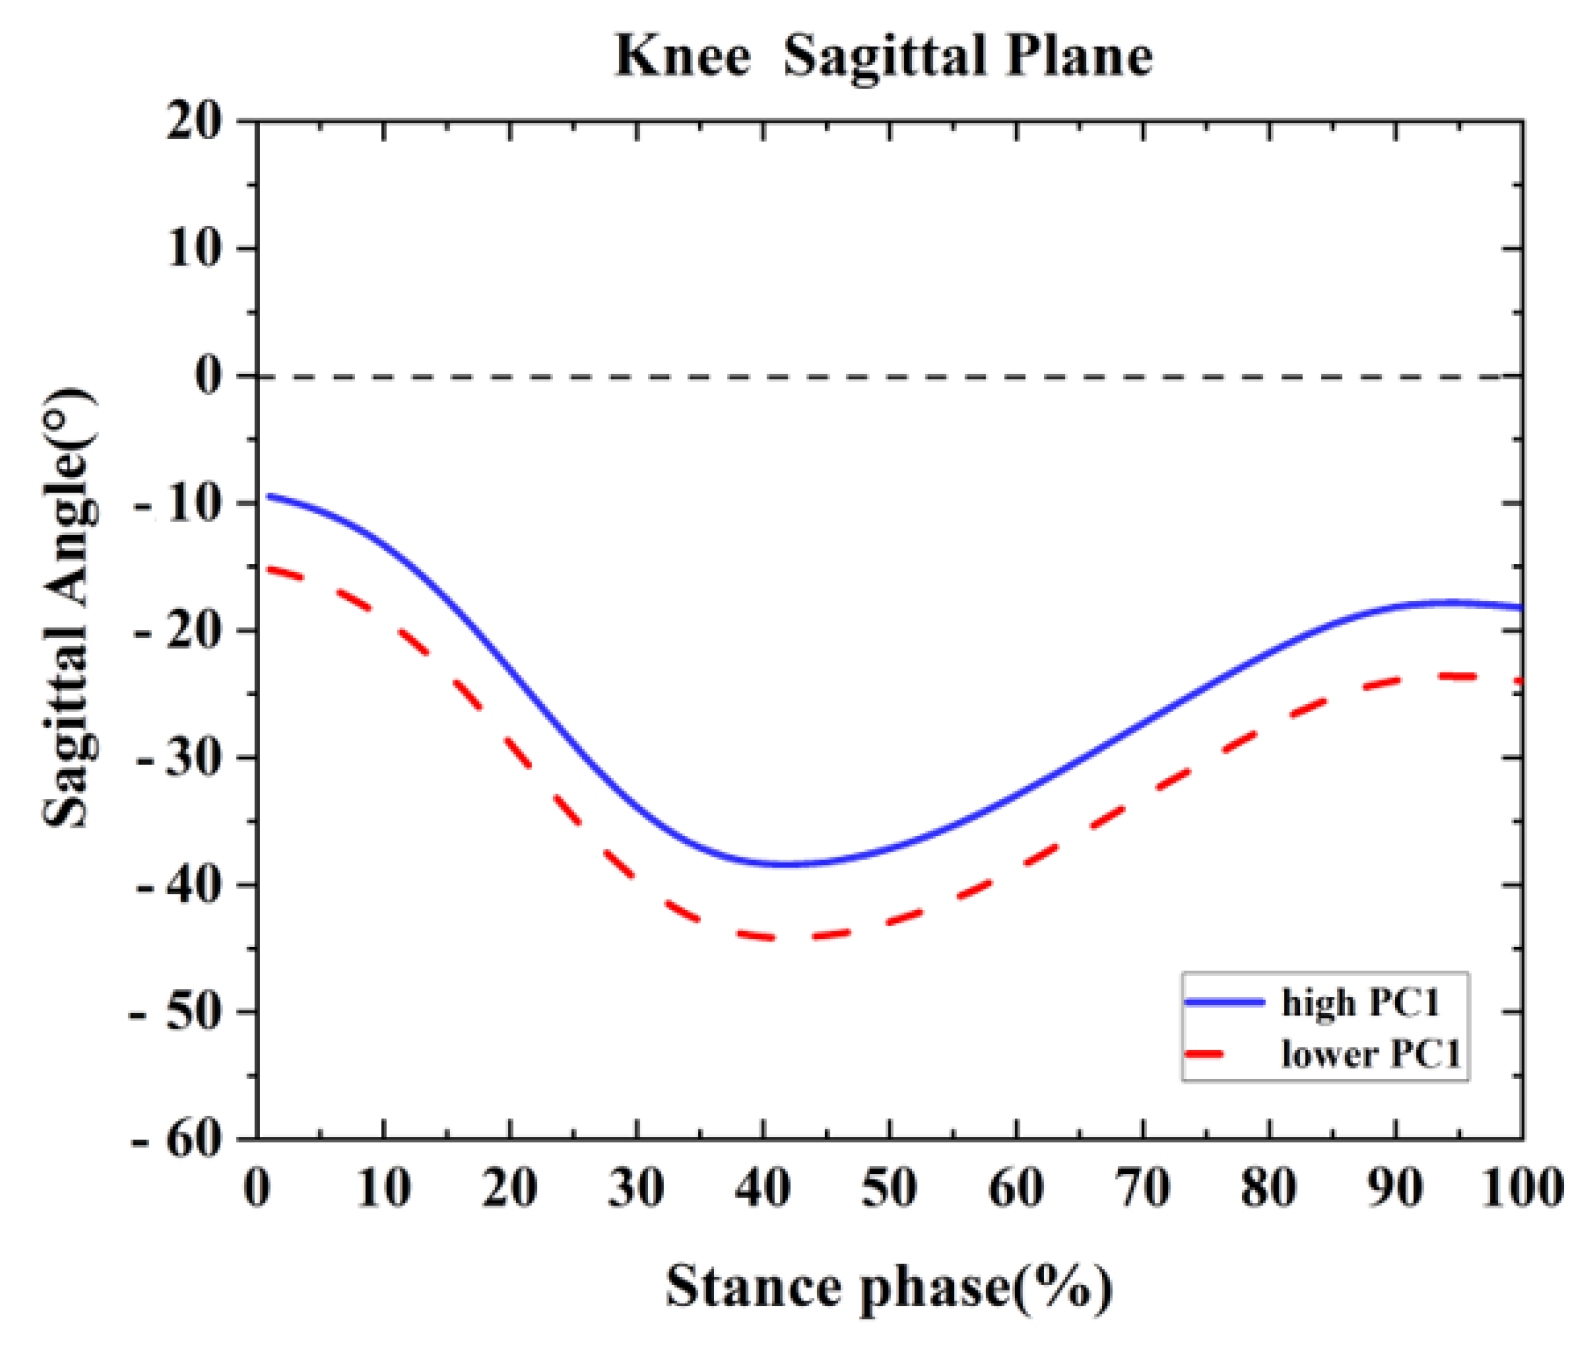
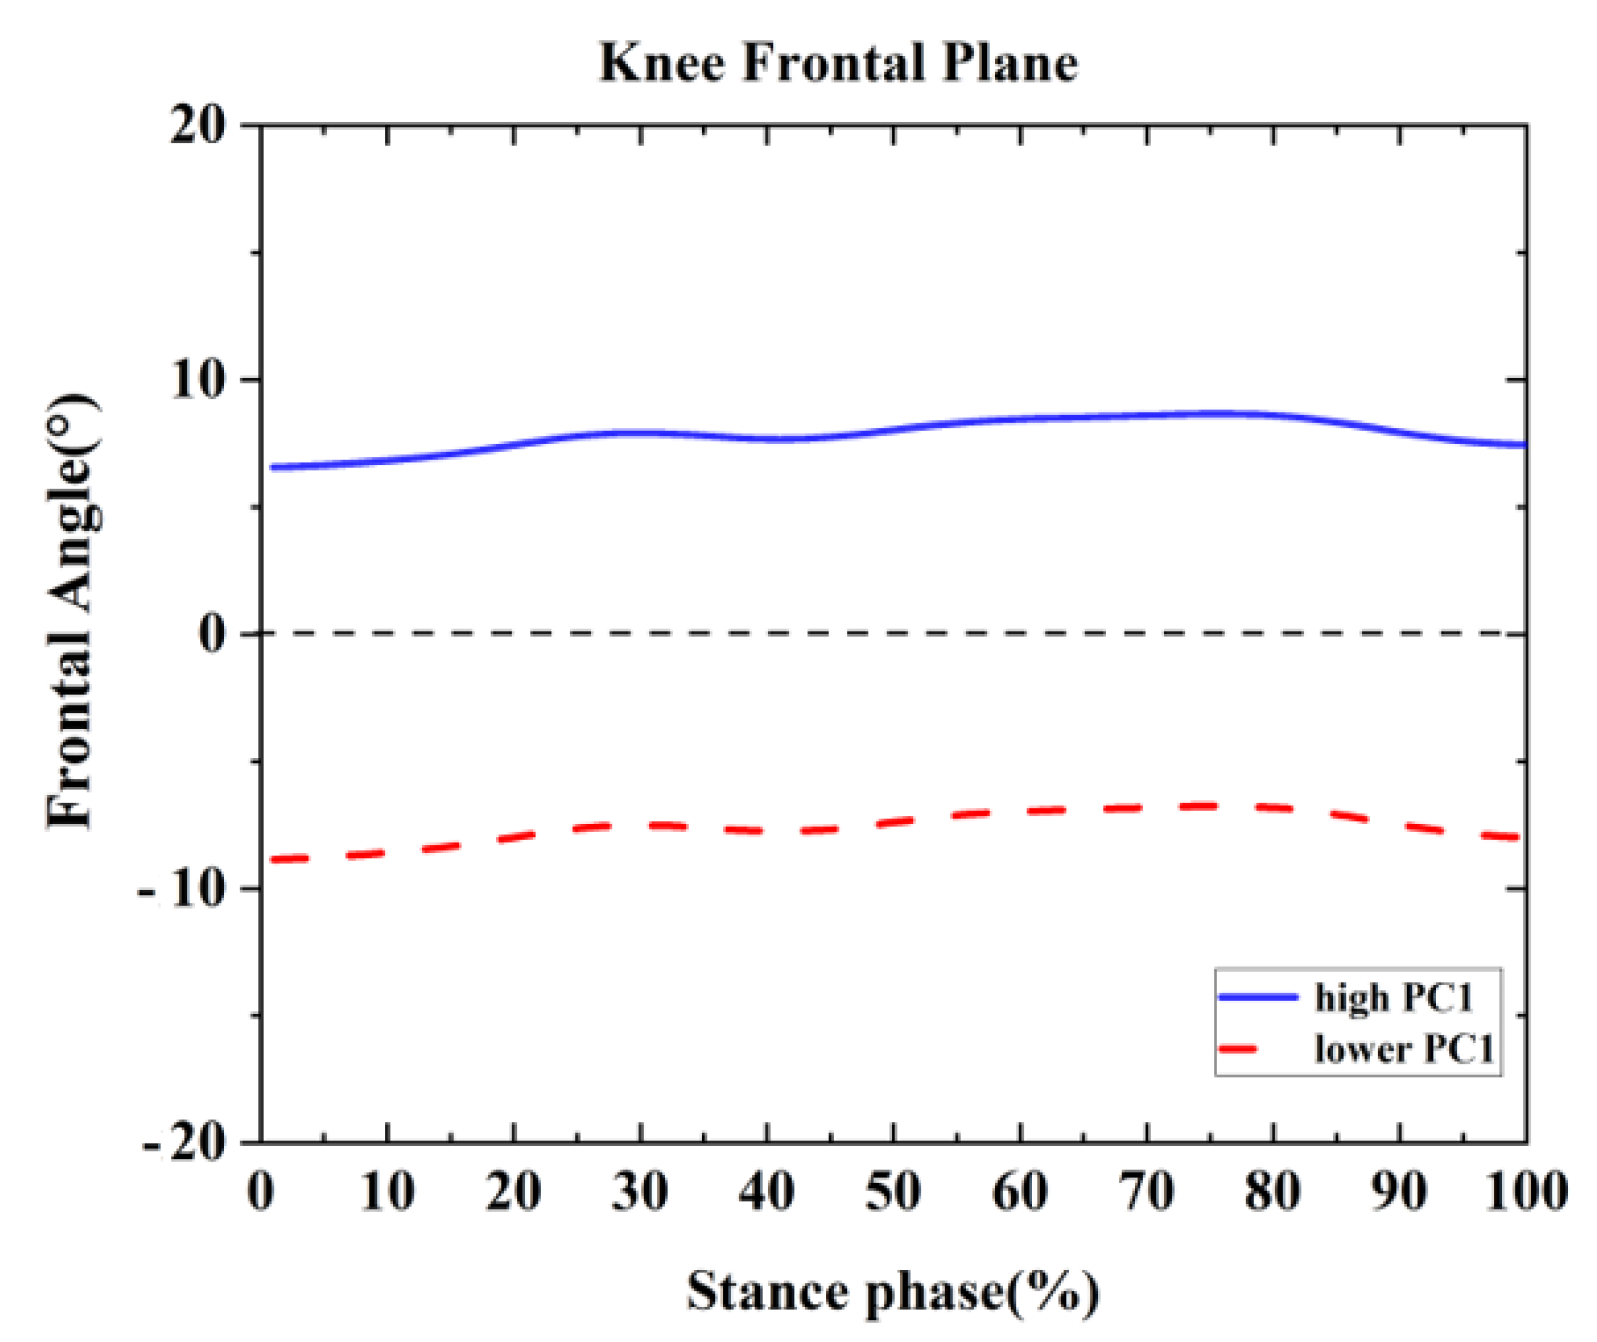
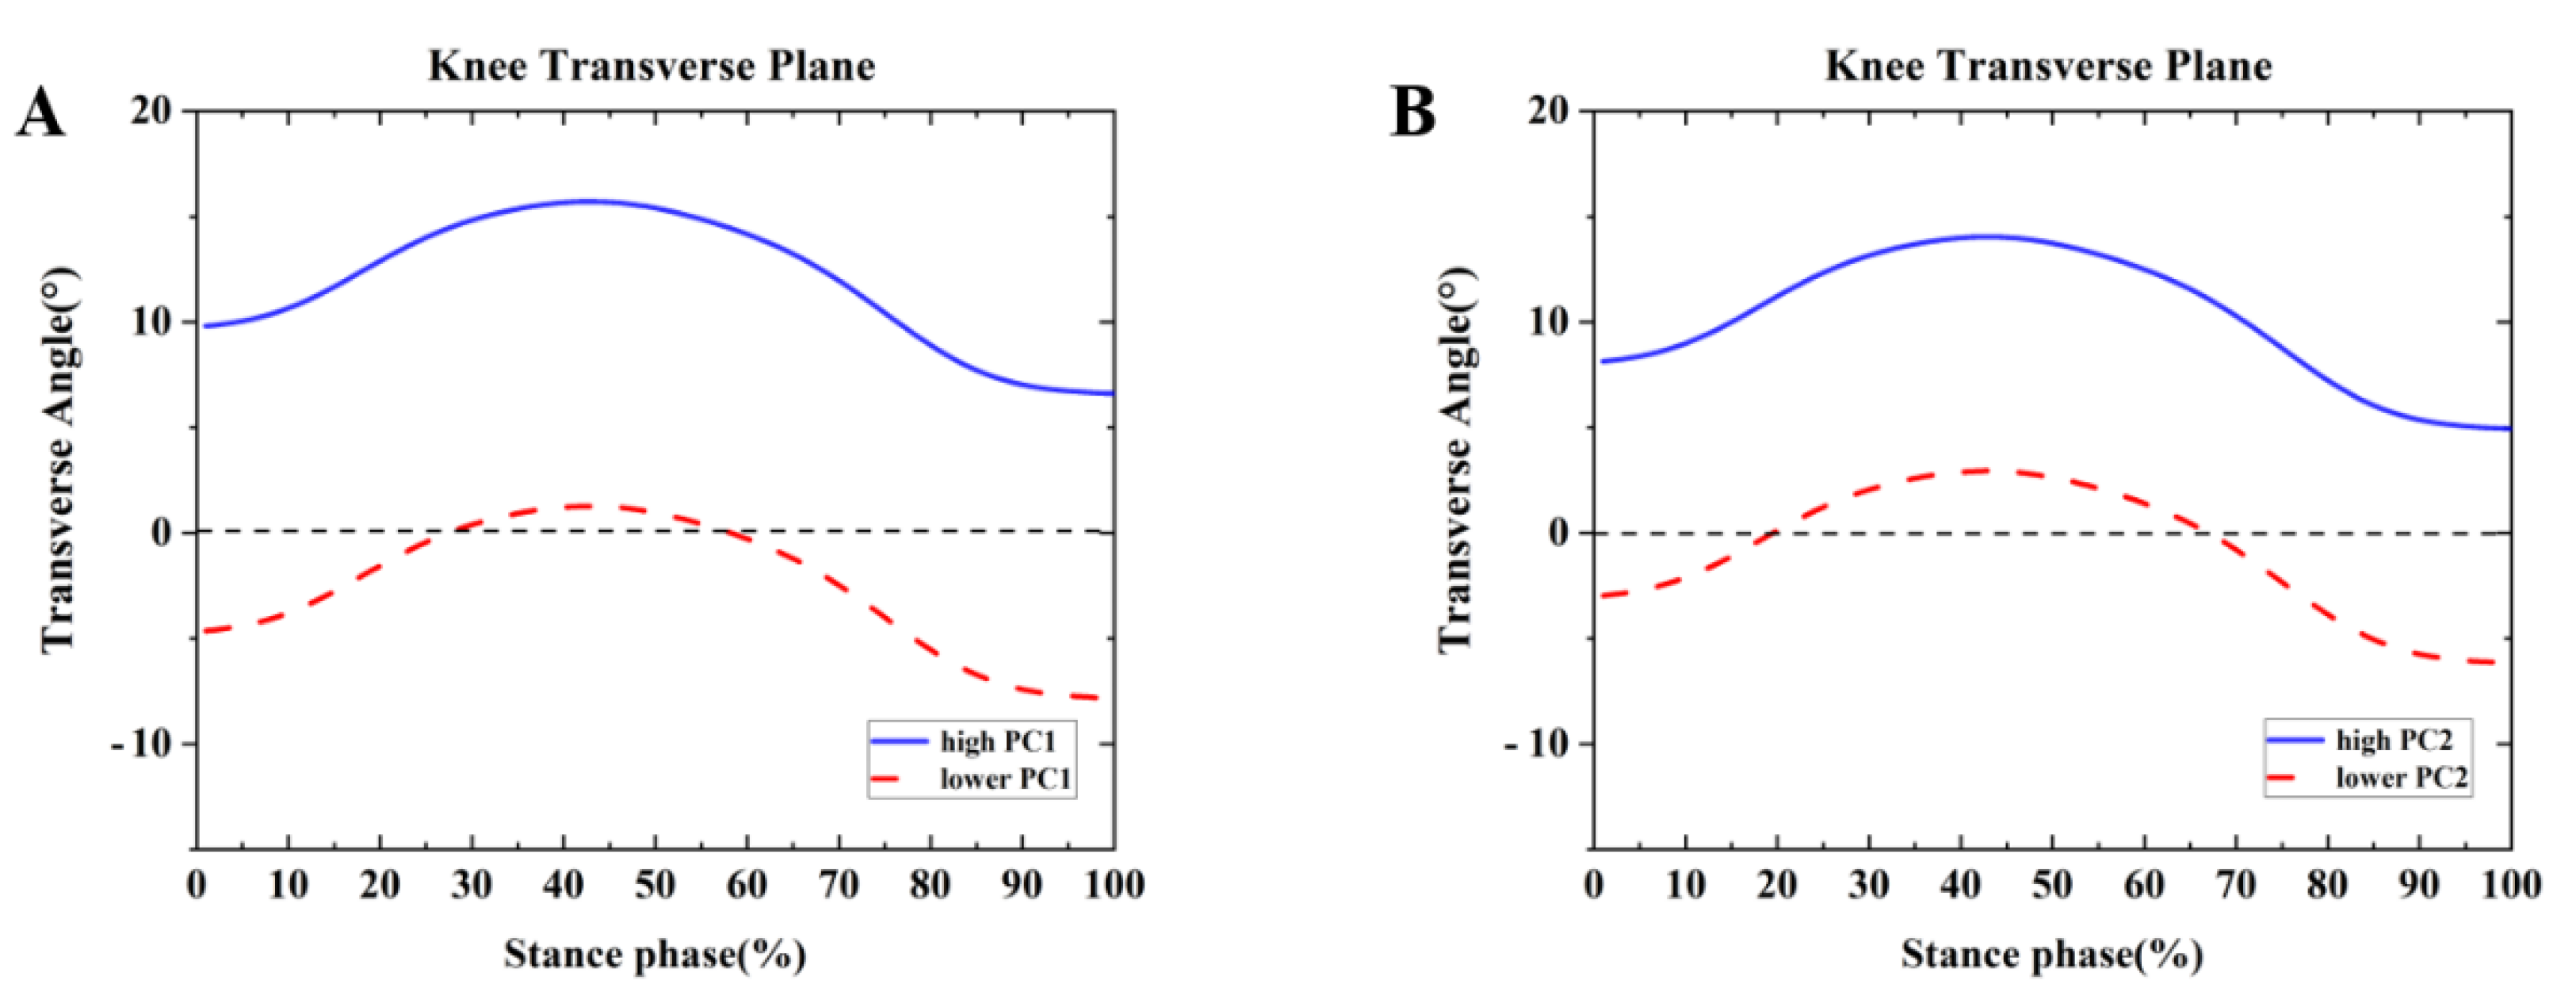
3.2. Knee Results
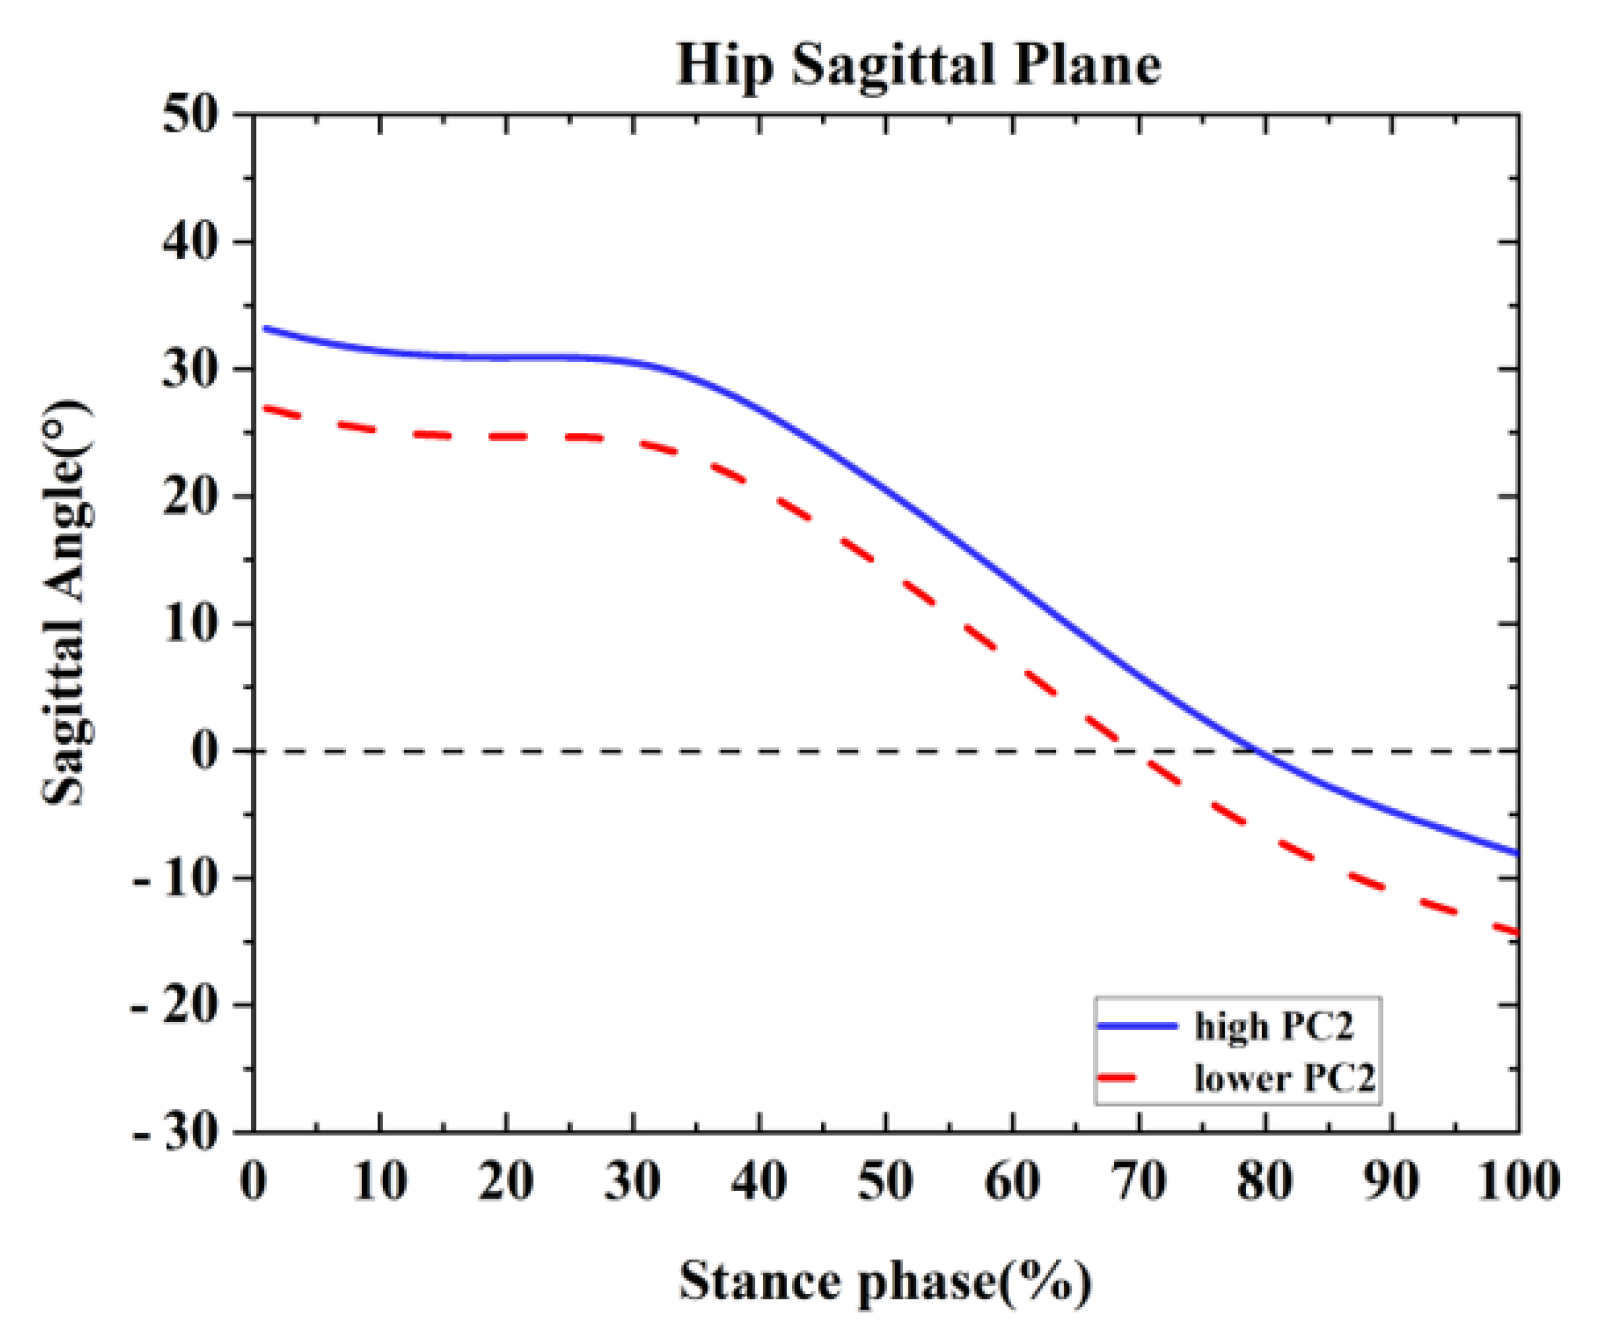
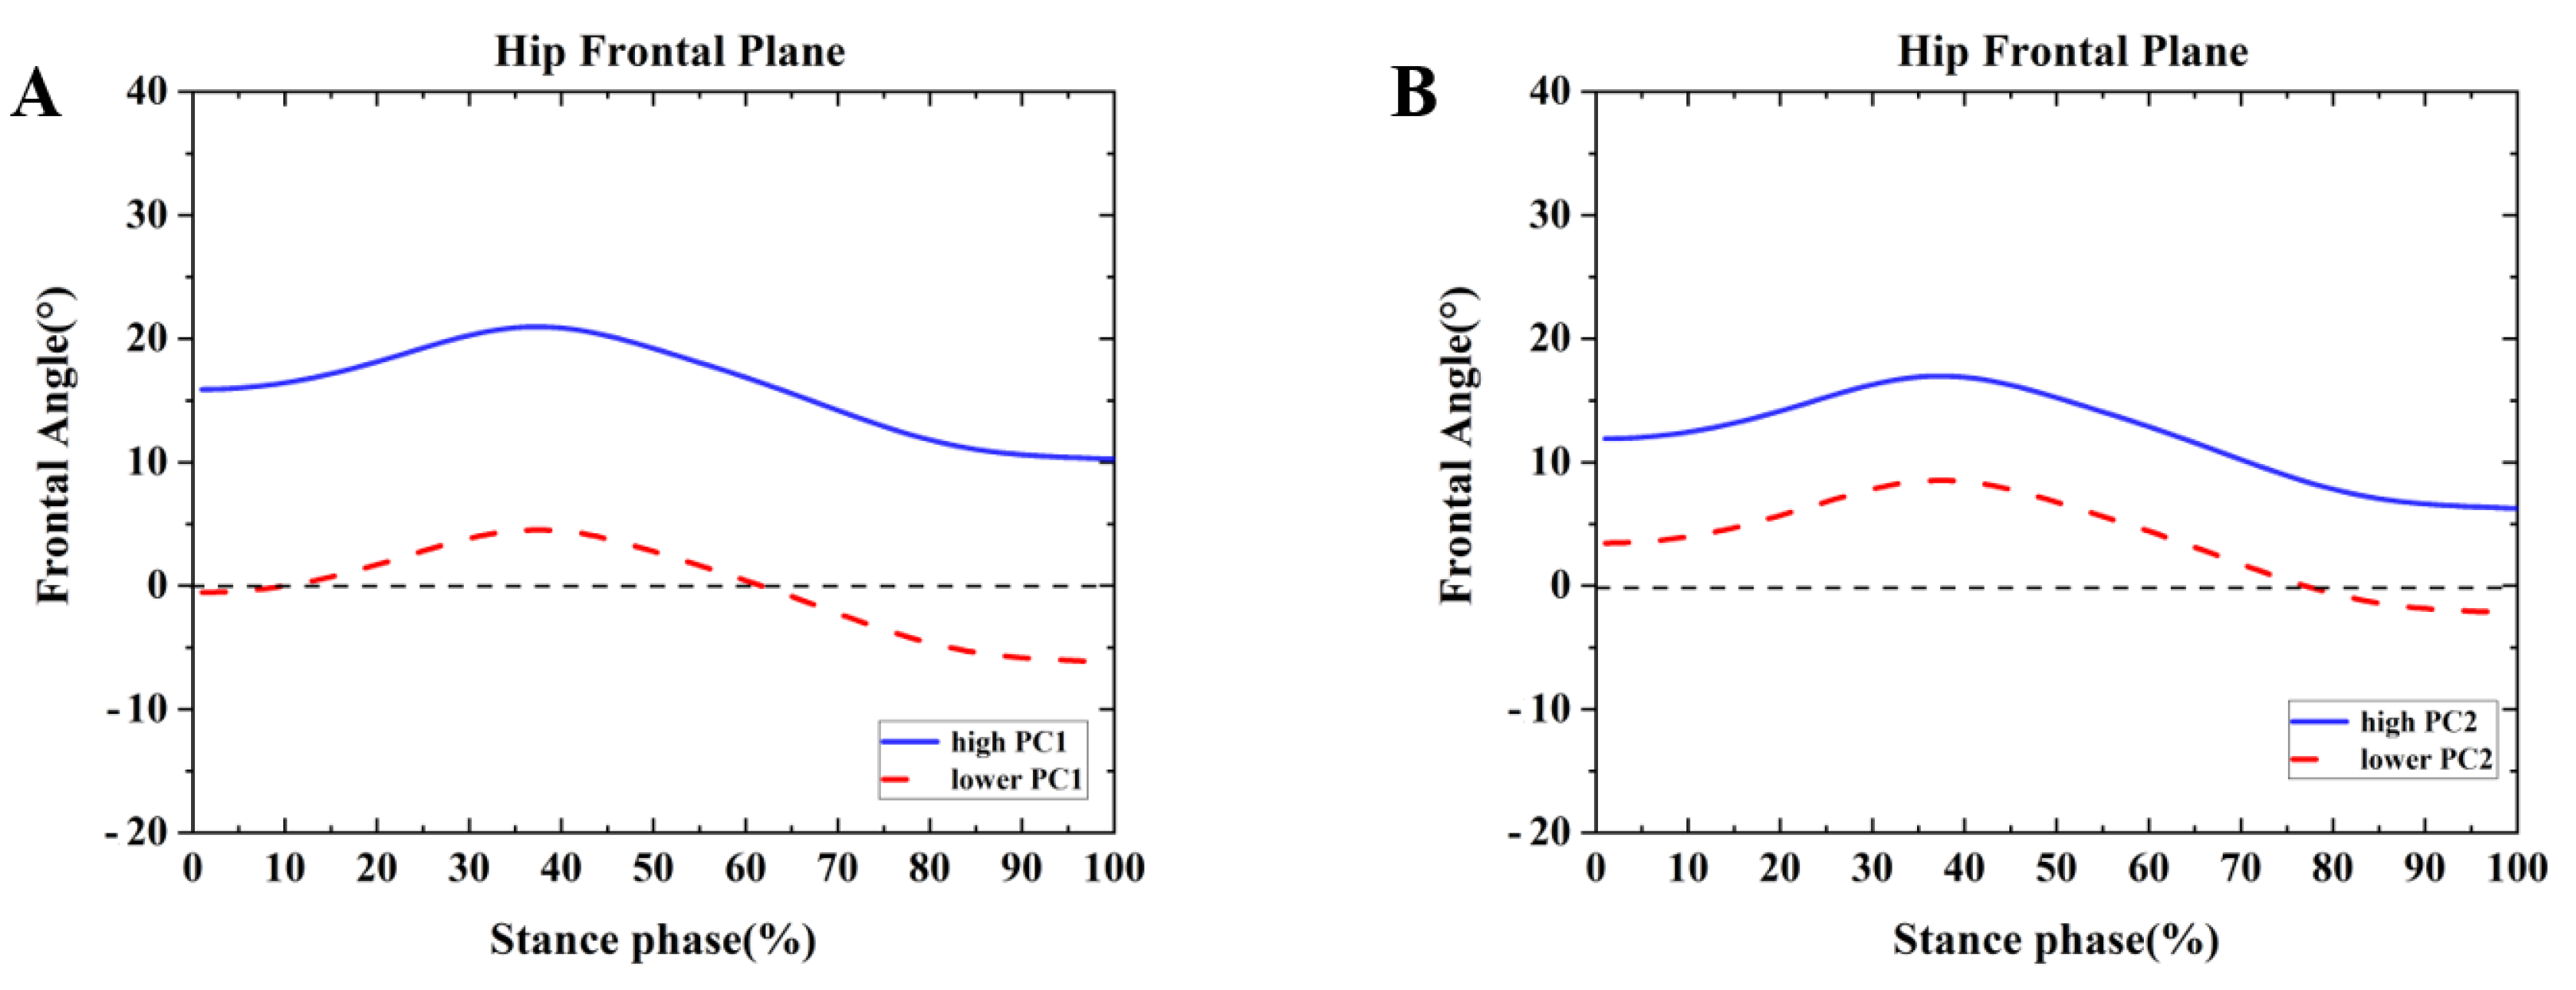
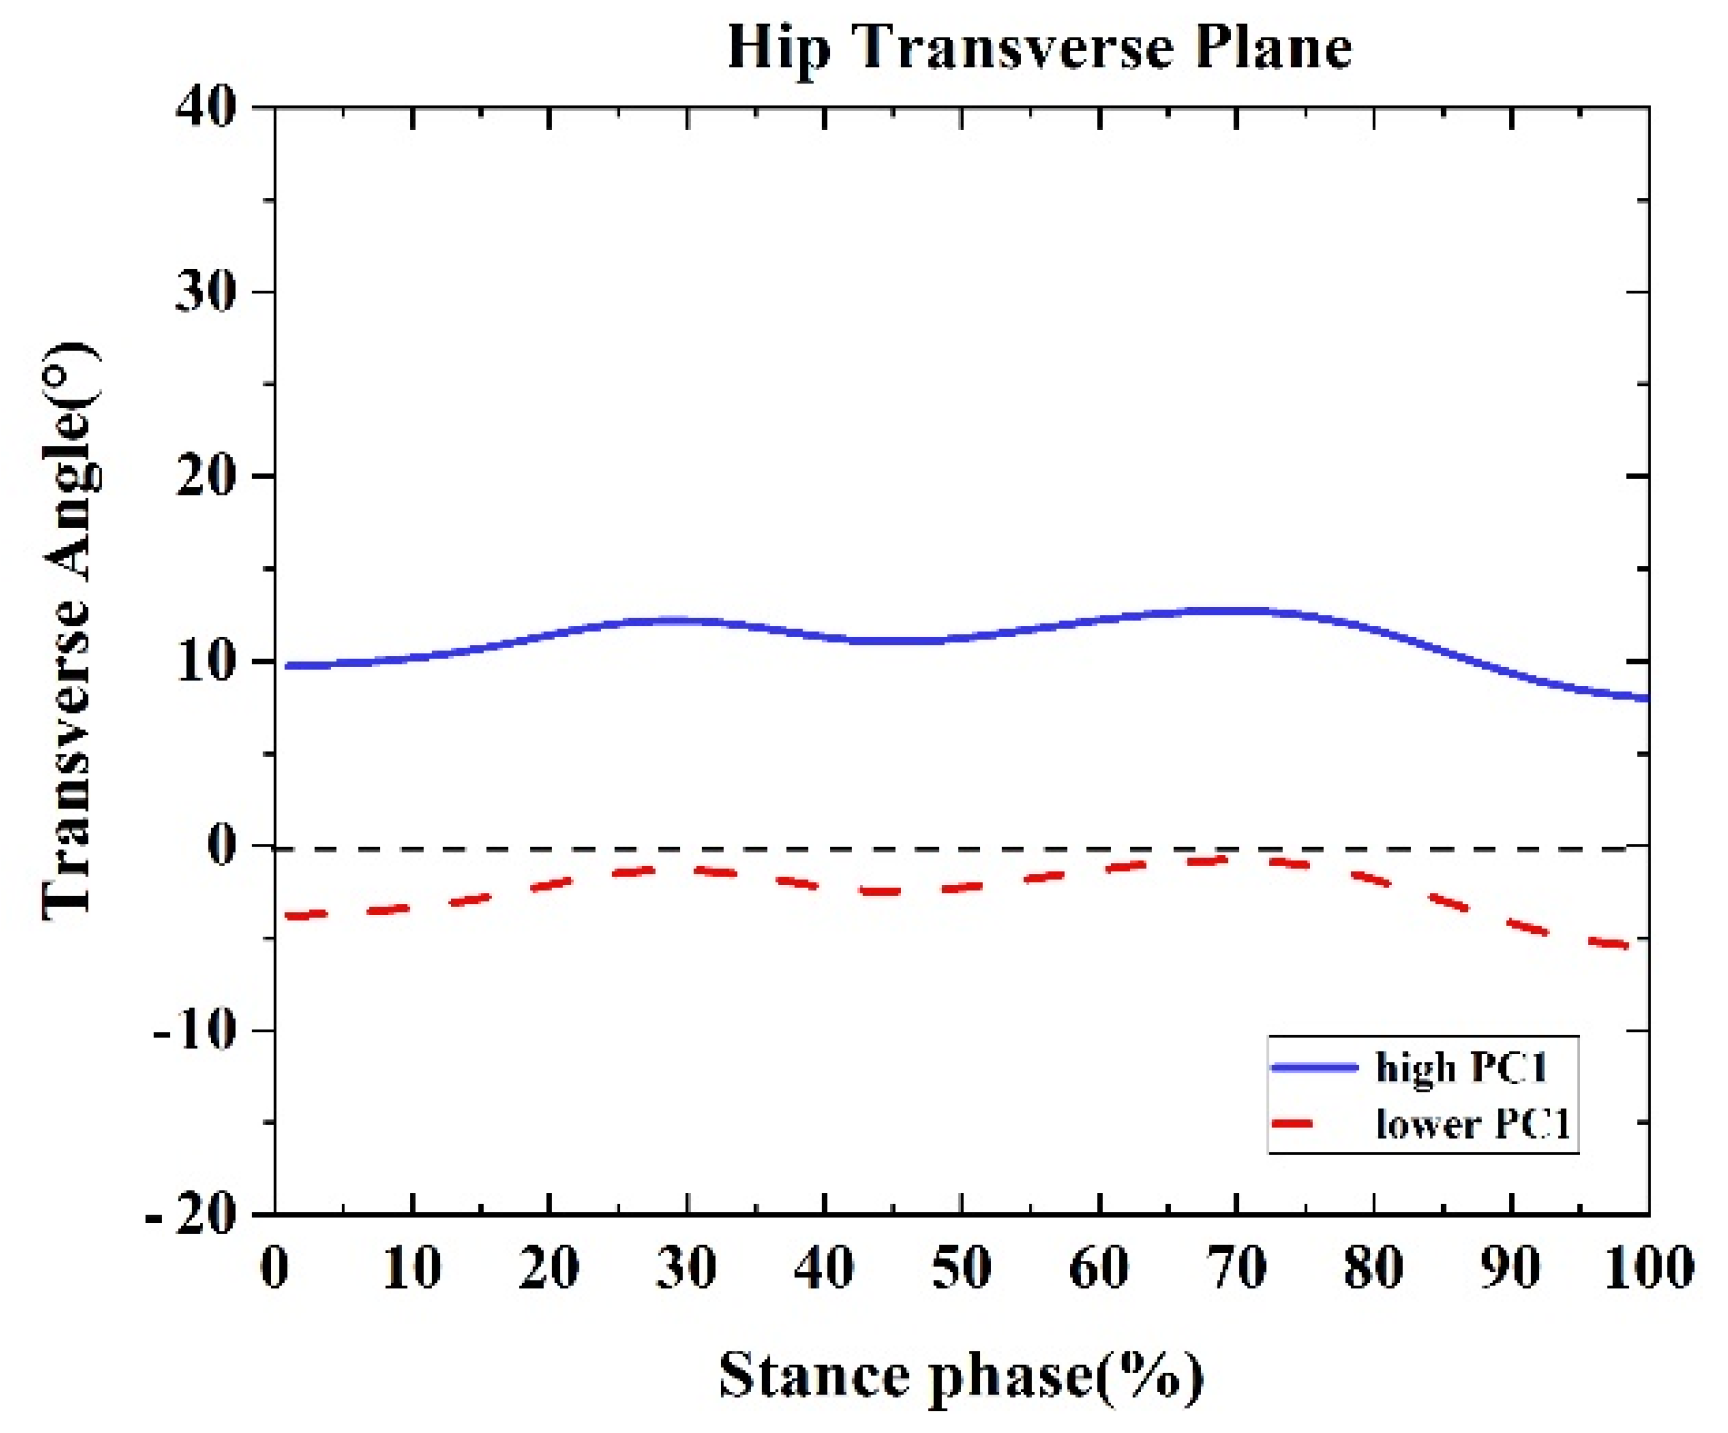
3.3. Hip Results
4. Discussion
5. Conclusions
Author Contributions
Funding
Institutional Review Board Statement
Informed Consent Statement
Data Availability Statement
Conflicts of Interest
References
- Murr, S.; Pierce, B. How Aging Impacts Runners’ Goals of Lifelong Running. Phys. Act. Health 2019, 3, 71–81. [Google Scholar] [CrossRef] [Green Version]
- Souza, R.B.; Powers, C.M. Differences in hip kinematics, muscle strength, and muscle activation between subjects with and without patellofemoral pain. J. Orthop. Sports Phys. 2009, 39, 12–19. [Google Scholar] [CrossRef]
- Lun, V.; Meeuwisse, W.; Stergiou, P.; Stefanyshyn, D. Relation between running injury and static lower limb alignment in recreational runners. Br. J. Sports Med. 2004, 38, 576–580. [Google Scholar] [CrossRef] [PubMed] [Green Version]
- Van Gent, R.; Siem, D.; van Middelkoop, M.; Van Os, A.; Bierma-Zeinstra, S.; Koes, B. Incidence and determinants of lower extremity running injuries in long distance runners: A systematic review. Br. J. Sports Med. 2007, 41, 469–480. [Google Scholar] [CrossRef] [PubMed] [Green Version]
- Tonoli, C.; Cumps, E.; Aerts, I.; Verhagen, E.; Meeusen, R. Running related injuries in long-distance running: Incidence, risk factors and prevention. Sport En Geneeskd. 2010, 43, 12. [Google Scholar] [CrossRef]
- Schmitz, A.; Russo, K.; Edwards, L.; Noehren, B. Do novice runners have weak hips and bad running form? Gait Posture. 2014, 40, 82–86. [Google Scholar] [CrossRef] [Green Version]
- Pink, M.; Perry, J.; Houglum, P.A.; Devine, D.J. Lower extremity range of motion in the recreational sport runner. Am. J. Sports. Med. 1994, 22, 541–549. [Google Scholar] [CrossRef]
- García-Pinillos, F.; García-Ramos, A.; Ramírez-Campillo, R.; Latorre-Román, P.Á.; Roche-Seruendo, L.E. How do spatiotemporal parameters and lower-body stiffness change with increased running velocity? A comparison between novice and elite level runners. J. Hum. Kinet. 2019, 70, 25. [Google Scholar] [CrossRef] [Green Version]
- Maas, E.; De Bie, J.; Vanfleteren, R.; Hoogkamer, W.; Vanwanseele, B. Novice runners show greater changes in kinematics with fatigue compared with competitive runners. Sports Biomech. 2018, 17, 350–360. [Google Scholar] [CrossRef]
- Kim, H.K.; Mirjalili, S.A.; Zhang, Y.; Xiang, L.; Gu, Y.; Fernandez, J. Effect of gender and running experience on lower limb biomechanics following 5 km barefoot running. Sports Biomech. 2021, 1–14. [Google Scholar] [CrossRef]
- Quan, W.; Ren, F.; Sun, D.; Fekete, G.; He, Y. Do Novice Runners Show Greater Changes in Biomechanical Parameters? Appl. Bionics. Biomech. 2021, 1–8. [Google Scholar] [CrossRef]
- Videbæk, S.; Bueno, A.M.; Nielsen, R.O.; Rasmussen, S. Incidence of running-related injuries per 1000 h of running in different types of runners: A systematic review and meta-analysis. Sports Med. 2015, 45, 1017–1026. [Google Scholar] [CrossRef] [PubMed] [Green Version]
- Cavanagh, P.R.; Pollock, M.L.; Landa, J. A biomechanical comparison of elite and good distance runners. Ann. N. Y. Acad. Sci. 1977, 301, 328–345. [Google Scholar] [CrossRef] [PubMed]
- Agresta, C.E.; Peacock, J.; Housner, J.; Zernicke, R.F.; Zendler, J.D. Experience does not influence injury-related joint kinematics and kinetics in distance runners. Gait Posture. 2018, 61, 13–18. [Google Scholar] [CrossRef] [PubMed]
- Clermont, C.A.; Osis, S.T.; Phinyomark, A.; Ferber, R. Kinematic gait patterns in competitive and recreational runners. J. Appl. Biomech. 2017, 33, 268–276. [Google Scholar] [CrossRef] [PubMed]
- Suda, E.Y.; Watari, R.; Matias, A.B.; Sacco, I.C. Recognition of Foot-Ankle Movement Patterns in Long-Distance Runners With Different Experience Levels Using Support Vector Machines. Front. Bioeng. Biotechnol. 2020, 8, 576. [Google Scholar] [CrossRef]
- Phinyomark, A.; Osis, S.; Hettinga, B.A.; Ferber, R. Kinematic gait patterns in healthy runners: A hierarchical cluster analysis. J. Biomech. 2015, 48, 3897–3904. [Google Scholar] [CrossRef]
- Xu, B.; Zhang, X.; Liu, L. The failure detection method of WSN based on PCA-BDA and fuzzy neural network. Wirel. Pers. Commun. 2018, 102, 1657–1667. [Google Scholar] [CrossRef]
- Deluzio, K.J.; Wyss, U.P.; Zee, B.; Costigan, P.A.; Serbie, C. Principal component models of knee kinematics and kinetics: Normal vs. pathological gait patterns. Hum. Mov. Sci. 1997, 16, 201–217. [Google Scholar] [CrossRef]
- Cushion, E.J.; Warmenhoven, J.; North, J.S.; Cleather, D.J. Principal component analysis reveals the proximal to distal pattern in vertical jumping is governed by two functional degrees of freedom. Front. Bioeng. Biotechnol. 2019, 7, 193. [Google Scholar] [CrossRef] [Green Version]
- Lever, J.; Krzywinski, M.; Altman, N. Points of significance: Principal component analysis. Nat. Methods 2017, 14, 641–643. [Google Scholar] [CrossRef] [Green Version]
- Jolliffe, I.T. Springer Series in Statistics; Springer: Berlin, Germany, 2002; Volume 29. [Google Scholar]
- Wrigley, A.T.; Albert, W.J.; Deluzio, K.J.; Stevenson, J.M. Differentiating lifting technique between those who develop low back pain and those who do not. Clin. Biomech. 2005, 20, 254–263. [Google Scholar] [CrossRef] [PubMed]
- Deluzio, K.; Astephen, J. Biomechanical features of gait waveform data associated with knee osteoarthritis: An application of principal component analysis. Gait Posture 2007, 25, 86–93. [Google Scholar] [CrossRef] [PubMed]
- Landry, S.C.; McKean, K.A.; Hubley-Kozey, C.L.; Stanish, W.D.; Deluzio, K.J. Knee biomechanics of moderate OA patients measured during gait at a self-selected and fast walking speed. J. Biomech. 2007, 40, 1754–1761. [Google Scholar] [CrossRef]
- O’Connor, K.M.; Bottum, M.C. Differences in cutting knee mechanics based on principal components analysis. Med. Sci. Sports. Exerc. 2009, 41, 867–878. [Google Scholar] [CrossRef] [PubMed]
- Phinyomark, A.; Hettinga, B.A.; Osis, S.T.; Ferber, R. Gender and age-related differences in bilateral lower extremity mechanics during treadmill running. PLoS ONE 2014, 9, e105246. [Google Scholar] [CrossRef] [PubMed] [Green Version]
- Robbins, S.M.; Renaud, P.J.; Pearsall, D.J. Principal component analysis identifies differences in ice hockey skating stride between high-and low-calibre players. Sports Biomech. 2021, 20, 131–149. [Google Scholar] [CrossRef]
- Xu, D.; Zhou, H.; Baker, J.S.; Bíró, I.; Gu, Y. An investigation of differences in lower extremity biomechanics during single-leg landing from height using bionic shoes and normal shoes. Front. Bioeng. Biotechnol. 2021, 711. [Google Scholar] [CrossRef]
- Zhou, H.; Xu, D.; Chen, C.; Ugbolue, U.C.; Baker, J.S.; Gu, Y. Analysis of Different Stop-Jumping Strategies on the Biomechanical Changes in the Lower Limbs. Appl. Sci. 2021, 11, 4633. [Google Scholar] [CrossRef]
- Jiang, X.; Yang, X.; Zhou, H.; Baker, J.S.; Gu, Y. Prolonged running using bionic footwear influences lower limb biomechanics. Healthcare 2021, 9, 236. [Google Scholar] [CrossRef]
- Collins, T.D.; Ghoussayni, S.N.; Ewins, D.J.; Kent, J.A. A six degrees-of-freedom marker set for gait analysis: Repeatability and comparison with a modified Helen Hayes set. Gait Posture 2009, 30, 173–180. [Google Scholar] [CrossRef] [PubMed]
- Jackson, D.A. Stopping rules in principal components analysis: A comparison of heuristical and statistical approaches. Ecology 1993, 74, 2204–2214. [Google Scholar] [CrossRef]
- Daffertshofer, A.; Lamoth, C.J.; Meijer, O.G.; Beek, P.J. PCA in studying coordination and variability: A tutorial. Clin. Biomech. 2004, 19, 415–428. [Google Scholar] [CrossRef] [PubMed]
- Winter, S.; Gordon, S.; Watt, K. Effects of fatigue on kinematics and kinetics during overground running: A systematic review. J. Sports Med. Phys. Fitnes. 2016, 57, 887–899. [Google Scholar] [CrossRef]
- Taunton, J.E.; Ryan, M.B.; Clement, D.; McKenzie, D.C.; Lloyd-Smith, D.; Zumbo, B. A retrospective case-control analysis of 2002 running injuries. Br. J. Sports Med. 2002, 36, 95–101. [Google Scholar] [CrossRef] [PubMed] [Green Version]
- Ferber, R.; Hreljac, A.; Kendall, K.D. Suspected mechanisms in the cause of overuse running injuries: A clinical review. Sports Health 2009, 1, 242–246. [Google Scholar] [CrossRef] [Green Version]
- Noehren, B.; Pohl, M.B.; Sanchez, Z.; Cunningham, T.; Lattermann, C. Proximal and distal kinematics in female runners with patellofemoral pain. Clin. Biomech. 2012, 27, 366–371. [Google Scholar] [CrossRef] [Green Version]
- Ying, J.; Cen, X.; Yu, P. Effects of Eccentric Exercise on Skeletal Muscle Injury: From An Ultrastructure Aspect: A Review. Phys. Act. Health 2021, 5, 15–20. [Google Scholar] [CrossRef]


| Variables | PC1 (%) | PC2 (%) | PC3 (%) | Total (%) |
|---|---|---|---|---|
| Ankle sagittal plane | 85.1 | 6.9 | 4.0 | 96 |
| Ankle frontal plane | 67.9 | 14.1 | 6.9 | 88.9 |
| Ankle transverse plane | 71.8 | 18.5 | 2.7 | 93 |
| Knee sagittal plane | 80.9 | 8.3 | 3.7 | 92.6 |
| Knee frontal plane | 59.5 | 14.1 | 9.1 | 82.7 |
| Knee transverse plane | 52.1 | 30.8 | 6.2 | 89.1 |
| Hip sagittal plane | 88.46 | 9.72 | 1.14 | 99.32 |
| Hip frontal plane | 67.6 | 17.9 | 6.6 | 92.1 |
| Hip transverse plane | 45.6 | 20.0 | 10.5 | 76.1 |
| Gait Measure | PC | Competitive Runners | Recreational Runners | p-Value | Effect Size |
|---|---|---|---|---|---|
| Ankle Sagittal | PC1 | 0.57(10.04) | 0.57(8.34) | 0.379 | 0.001 |
| PC2 | 2.41(1.03) | −2.41(1.07) | 0.001 * | 0.917 | |
| PC3 | −0.72(1.92) | 0.72(1.82) | 0.001 * | 0.359 | |
| Ankle Frontal | PC1 | 4.15(8.93) | −4.15(4.69) | 0.001 * | 0.503 |
| PC2 | −2.87(2.94) | 2.87(1.75) | 0.001 * | 0.765 | |
| PC3 | 0.20(2.14) | −0.20(3.05) | 0.275 | 0.076 | |
| Ankle Transverse | PC1 | 1.34(8.26) | −1.34(8.51) | 0.024 | 0.158 |
| PC2 | −4.17(1.12) | 4.17(0.93) | 0.001 * | 0.970 | |
| PC3 | −0.15(1.75) | 0.15(1.50) | 0.195 | 0.092 | |
| Knee Sagittal | PC1 | 1.57(9.84) | 0.06(7.80) | 0.013 | 0.085 |
| PC2 | −2.70(1.27) | −0.01(0.57) | 0.001 * | 0.807 | |
| PC3 | 0.05(1.82) | 0.01(2.05) | 0.719 | 0.010 | |
| Knee Frontal | PC1 | 7.53(0.57) | 0.04(2.16) | 0.001 * | 0.921 |
| PC2 | 0.28(4.76) | 0.02(2.35) | 0.285 | 0.034 | |
| PC3 | 0.24(2.09) | 0.01(3.73) | 0.259 | 0.038 | |
| Knee transverse | PC1 | −4.58(5.65) | 4.60(5.52) | 0.001 * | 0.635 |
| PC2 | 3.95(1.67) | −3.94(5.26) | 0.001 * | 0.710 | |
| PC3 | −0.44(3.37) | 0.45(0.86) | 0.012 | 0.178 | |
| Hip sagittal | PC1 | −0.15(9.57) | 0.15(9.28) | 0.824 | 0.016 |
| PC2 | −3.02(0.79) | 3.02(0.66) | 0.001 * | 0.972 | |
| PC3 | 0.20(1.03) | −0.20(1.07) | 0.009 | 0.187 | |
| Hip frontal | PC1 | −2.39(9.23) | 2.39(6.25) | 0.001 * | 0.290 |
| PC2 | 3.85(2.43) | −3.85(0.33) | 0.001 * | 0.911 | |
| PC3 | 0.22(2.27) | −0.22(2.85) | 0.216 | 0.127 | |
| Hip transverse | PC1 | 6.50(2.34) | −6.50(0.98) | 0.001 * | 0.964 |
| PC2 | 0.02(5.29) | −0.02(3.49) | 0.944 | 0.004 | |
| PC3 | −0.61(4.18) | 0.61(1.71) | 0.008 | 0.188 |
Publisher’s Note: MDPI stays neutral with regard to jurisdictional claims in published maps and institutional affiliations. |
© 2021 by the authors. Licensee MDPI, Basel, Switzerland. This article is an open access article distributed under the terms and conditions of the Creative Commons Attribution (CC BY) license (https://creativecommons.org/licenses/by/4.0/).
Share and Cite
Quan, W.; Zhou, H.; Xu, D.; Li, S.; Baker, J.S.; Gu, Y. Competitive and Recreational Running Kinematics Examined Using Principal Components Analysis. Healthcare 2021, 9, 1321. https://doi.org/10.3390/healthcare9101321
Quan W, Zhou H, Xu D, Li S, Baker JS, Gu Y. Competitive and Recreational Running Kinematics Examined Using Principal Components Analysis. Healthcare. 2021; 9(10):1321. https://doi.org/10.3390/healthcare9101321
Chicago/Turabian StyleQuan, Wenjing, Huiyu Zhou, Datao Xu, Shudong Li, Julien S. Baker, and Yaodong Gu. 2021. "Competitive and Recreational Running Kinematics Examined Using Principal Components Analysis" Healthcare 9, no. 10: 1321. https://doi.org/10.3390/healthcare9101321