
The Neglected Factor in the Relationship between Executive Functioning and Obesity: The Role of Motor Control
 , , , , and
Abstract
:1. Introduction
2. Materials and Methods
2.1. Participants
2.2. Materials and Procedure
2.3. Statistical Analyses
3. Results
3.1. Sample Characteristics
3.2. Construction of Hierarchical Regression Models
3.3. Regression on BMI
3.4. Regression on WC
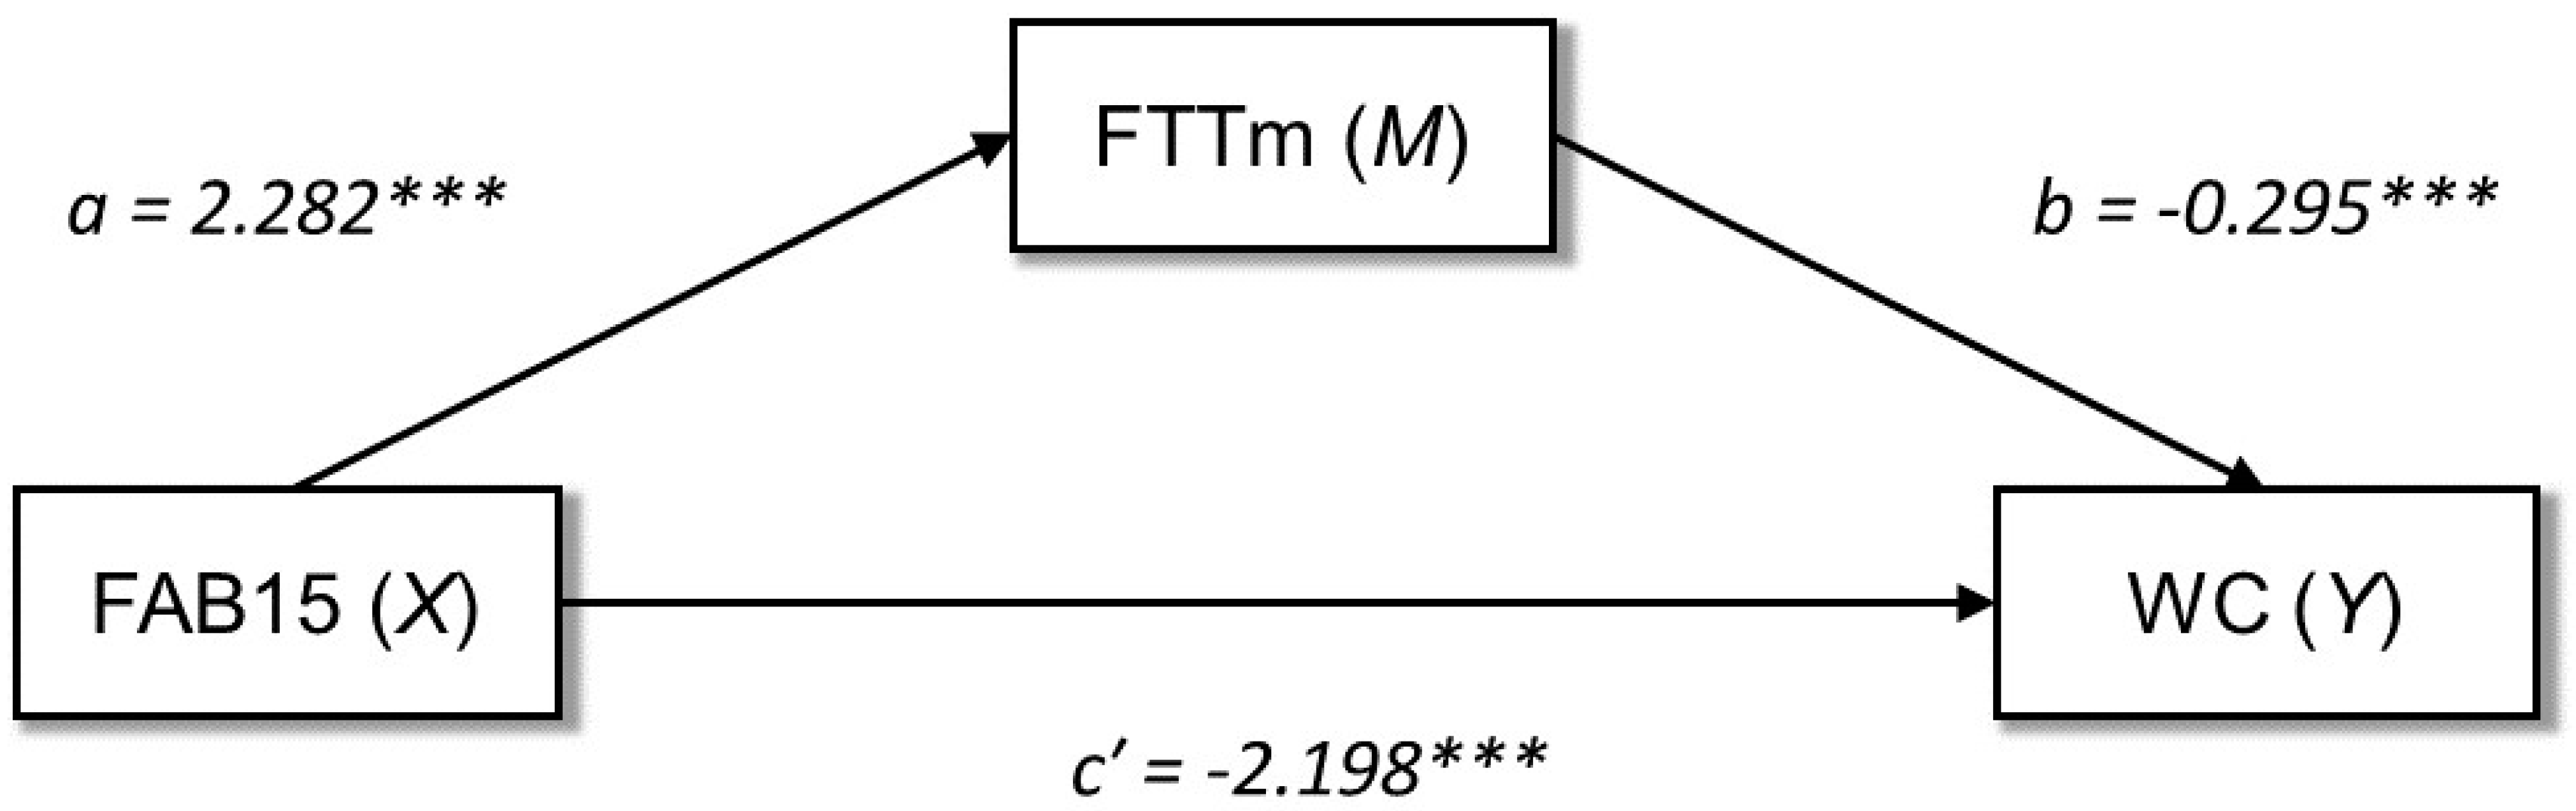
3.5. Mediation Analysis
4. Discussion
5. Conclusions
Author Contributions
Funding
Institutional Review Board Statement
Informed Consent Statement
Data Availability Statement
Acknowledgments
Conflicts of Interest
References
- Benito-León, J.; Mitchell, A.J.; Hernández-Gallego, J.; Bermejo-Pareja, F. Obesity and Impaired Cognitive Functioning in the Elderly: A Population-Based Cross-Sectional Study (NEDICES). Eur. J. Neurol. 2013, 20, 899-e77. [Google Scholar] [CrossRef] [PubMed]
- Miller, A.A.; Spencer, S.J. Obesity and Neuroinflammation: A Pathway to Cognitive Impairment. Brain Behav. Immun. 2014, 42, 10–21. [Google Scholar] [CrossRef]
- Prickett, C.; Brennan, L.; Stolwyk, R. Examining the Relationship between Obesity and Cognitive Function: A Systematic Literature Review. Obes. Res. Clin. Pract. 2015, 9, 93–113. [Google Scholar] [CrossRef] [PubMed]
- Bove, R.M.; Gerweck, A.V.; Mancuso, S.M.; Bredella, M.A.; Sherman, J.C.; Miller, K.K. Association between Adiposity and Cognitive Function in Young Men: Hormonal Mechanisms: Obesity, Hormones, and Cognition in Men. Obesity 2016, 24, 954–961. [Google Scholar] [CrossRef]
- Sellaro, R.; Colzato, L.S. High Body Mass Index Is Associated with Impaired Cognitive Control. Appetite 2017, 113, 301–309. [Google Scholar] [CrossRef] [PubMed]
- Smith, E.; Hay, P.; Campbell, L.; Trollor, J.N. A Review of the Association between Obesity and Cognitive Function across the Lifespan: Implications for Novel Approaches to Prevention and Treatment: Obesity and Cognitive Function across Lifespan. Obes. Rev. 2011, 12, 740–755. [Google Scholar] [CrossRef] [PubMed]
- Burgess, P.W.; Simons, J.S. Theories of Frontal Lobe Executive Function: Clinical Applications. In The Effectiveness of Rehabilitation for Cognitive Deficits; Halligan, P.W., Wade, D.T., Eds.; Oxford University Press: Oxford, UK, 2005; pp. 211–231. ISBN 978-0-19-852654-4. [Google Scholar]
- Gilbert, S.J.; Burgess, P.W. Executive Function. Curr. Biol. 2008, 18, R110–R114. [Google Scholar] [CrossRef]
- Diamond, A. Executive Functions. Annu. Rev. Psychol. 2013, 64, 135–168. [Google Scholar] [CrossRef]
- Ardila, A. On the Evolutionary Origins of Executive Functions. Brain Cogn. 2008, 68, 92–99. [Google Scholar] [CrossRef]
- Yang, Y.; Shields, G.S.; Guo, C.; Liu, Y. Executive Function Performance in Obesity and Overweight Individuals: A Meta-Analysis and Review. Neurosci. Biobehav. Rev. 2018, 84, 225–244. [Google Scholar] [CrossRef]
- Dassen, F.C.M.; Houben, K.; Allom, V.; Jansen, A. Self-Regulation and Obesity: The Role of Executive Function and Delay Discounting in the Prediction of Weight Loss. J. Behav. Med. 2018, 41, 806–818. [Google Scholar] [CrossRef]
- Lyke, J.A.; Spinella, M. Associations among Aspects of Impulsivity and Eating Factors in a Nonclinical Sample. Int. J. Eat. Disord. 2004, 36, 229–233. [Google Scholar] [CrossRef]
- Steward, T.; Mestre-Bach, G.; Vintró-Alcaraz, C.; Lozano-Madrid, M.; Agüera, Z.; Fernández-Formoso, J.A.; Granero, R.; Jiménez-Murcia, S.; Vilarrasa, N.; García-Ruiz-de-Gordejuela, A.; et al. Food Addiction and Impaired Executive Functions in Women with Obesity. Eur. Eat. Disorders. Rev. 2018, 26, 574–584. [Google Scholar] [CrossRef]
- Powell, D.J.H.; McMinn, D.; Allan, J.L. Does Real Time Variability in Inhibitory Control Drive Snacking Behavior? An Intensive Longitudinal Study. Health Psychol. 2017, 36, 356–364. [Google Scholar] [CrossRef]
- Gluck, M.E.; Viswanath, P.; Stinson, E.J. Obesity, Appetite, and the Prefrontal Cortex. Curr. Obes. Rep. 2017, 6, 380–388. [Google Scholar] [CrossRef]
- Riggs, N.; Chou, C.-P.; Spruijt-Metz, D.; Pentz, M.A. Executive Cognitive Function as a Correlate and Predictor of Child Food Intake and Physical Activity. Child Neuropsychol. 2010, 16, 279–292. [Google Scholar] [CrossRef]
- Sims, R.C.; Bennett, N.-K.; Mwendwa, D.T.; Ali, M.K.; Levy, S.-A.T.; Callender, C.O.; Campbell, A.L. Executive Function and Negative Eating Behaviors in Severely Obese African Americans. Ethn. Dis. 2014, 24, 328–334. [Google Scholar]
- Rodrigue, C.; Ouellette, A.-S.; Lemieux, S.; Tchernof, A.; Biertho, L.; Bégin, C. Executive Functioning and Psychological Symptoms in Food Addiction: A Study among Individuals with Severe Obesity. Eat. Weight. Disord 2018, 23, 469–478. [Google Scholar] [CrossRef] [PubMed]
- Beth Spitznagel, M.; Galioto, R.; Limbach, K.; Gunstad, J.; Heinberg, L. Cognitive Function Is Linked to Adherence to Bariatric Postoperative Guidelines. Surg. Obes. Relat. Dis. 2013, 9, 580–585. [Google Scholar] [CrossRef]
- La Marra, M.; Caviglia, G.; Perrella, R. Using Smartphones When Eating Increases Caloric Intake in Young People: An Overview of the Literature. Front. Psychol. 2020, 11, 587886. [Google Scholar] [CrossRef]
- Witbracht, M.G.; Laugero, K.D.; Van Loan, M.D.; Adams, S.H.; Keim, N.L. Performance on the Iowa Gambling Task Is Related to Magnitude of Weight Loss and Salivary Cortisol in a Diet-Induced Weight Loss Intervention in Overweight Women. Physiol. Behav. 2012, 106, 291–297. [Google Scholar] [CrossRef]
- Fitzpatrick, S.; Gilbert, S.; Serpell, L. Systematic Review: Are Overweight and Obese Individuals Impaired on Behavioural Tasks of Executive Functioning? Neuropsychol. Rev. 2013, 23, 138–156. [Google Scholar] [CrossRef]
- Gettens, K.M.; Gorin, A.A. Executive Function in Weight Loss and Weight Loss Maintenance: A Conceptual Review and Novel Neuropsychological Model of Weight Control. J. Behav. Med. 2017, 40, 687–701. [Google Scholar] [CrossRef] [PubMed]
- La Marra, M.; Ilardi, C.R.; Villano, I.; Carosella, M.; Staiano, M.; Iavarone, A.; Chieffi, S.; Messina, G.; Polito, R.; Scarinci, A.; et al. Functional Relationship between Inhibitory Control, Cognitive Flexibility, Psychomotor Speed and Obesity. Brain Sci. 2022, 12, 1080. [Google Scholar] [CrossRef] [PubMed]
- O’Brien, P.D.; Hinder, L.M.; Callaghan, B.C.; Feldman, E.L. Neurological Consequences of Obesity. Lancet Neurol. 2017, 16, 465–477. [Google Scholar] [CrossRef]
- Ho, A.J.; Raji, C.A.; Becker, J.T.; Lopez, O.L.; Kuller, L.H.; Hua, X.; Lee, S.; Hibar, D.; Dinov, I.D.; Stein, J.L.; et al. Obesity Is 442 Linked with Lower Brain Volume in 700 AD and MCI Patients. Neurobiol. Aging 2010, 31, 1326–1339. [Google Scholar] [CrossRef] [PubMed]
- Gustafson, D.; Lissner, L.; Bengtsson, C.; Bjorkelund, C.; Skoog, I. A 24-Year Follow-up of Body Mass Index and Cerebral Atro- 445 phy. Neurology 2004, 63, 1876–1881. [Google Scholar] [CrossRef]
- Nguyen, J.C.D.; Killcross, A.S.; Jenkins, T.A. Obesity and Cognitive Decline: Role of Inflammation and Vascular Changes. Front. Neurosci. 2014, 8, 375. [Google Scholar] [CrossRef]
- Odegaard, J.I.; Chawla, A. Pleiotropic Actions of Insulin Resistance and Inflammation in Metabolic Homeostasis. Science 2013, 339, 172–177. [Google Scholar] [CrossRef]
- Bruun, J.M.; Pedersen, S.B.; Kristensen, K.; Richelsen, B. Effects of Pro-Inflammatory Cytokines and Chemokines on Leptin Production in Human Adipose Tissue in Vitro. Mol. Cell. Endocrinol. 2002, 190, 91–99. [Google Scholar] [CrossRef]
- Trayhurn, P.; Wood, I.S. Adipokines: Inflammation and the Pleiotropic Role of White Adipose Tissue. Br. J. Nutr. 2004, 92, 347–355. [Google Scholar] [CrossRef] [PubMed] [Green Version]
- Pradhan, A.D. C-Reactive Protein, Interleukin 6, and Risk of Developing Type 2 Diabetes Mellitus. JAMA 2001, 286, 327. [Google Scholar] [CrossRef] [PubMed]
- Boeka, A.; Lokken, K. Neuropsychological Performance of a Clinical Sample of Extremely Obese Individuals. Arch. Clin. Neuropsychol. 2008, 23, 467–474. [Google Scholar] [CrossRef]
- Gunstad, J.; Lhotsky, A.; Wendell, C.R.; Ferrucci, L.; Zonderman, A.B. Longitudinal Examination of Obesity and Cognitive Function: Results from the Baltimore Longitudinal Study of Aging. Neuroepidemiology 2010, 34, 222–229. [Google Scholar] [CrossRef] [PubMed]
- Hartanto, A.; Yong, J.; Toh, W. Bidirectional Associations between Obesity and Cognitive Function in Midlife Adults: A Longitudinal Study. Nutrients 2019, 11, 2343. [Google Scholar] [CrossRef] [PubMed]
- Skinner, J.S.; Abel, W.M.; McCoy, K.; Wilkins, C.H. Exploring the “Obesity Paradox” as a Correlate of Cognitive and Physical Function in Community-Dwelling Black and White Older Adults. Ethn. Dis. 2017, 27, 387. [Google Scholar] [CrossRef] [PubMed]
- Volkow, N.D.; Wang, G.-J.; Fowler, J.S.; Telang, F. Overlapping Neuronal Circuits in Addiction and Obesity: Evidence of Systems Pathology. Phil. Trans. R. Soc. B 2008, 363, 3191–3200. [Google Scholar] [CrossRef]
- Monica, D.; Paulo, M.; Appolinário, J.C.; de Freitas, S.R.; Coutinho, G.; Santos, C.; Coutinho, W. Assessment of Executive Functions in Obese Individuals with Binge Eating Disorder. Rev. Bras. Psiquiatr. 2010, 32, 381–388. [Google Scholar] [CrossRef]
- Favieri, F.; Forte, G.; Casagrande, M. The Executive Functions in Overweight and Obesity: A Systematic Review of Neuropsychological Cross-Sectional and Longitudinal Studies. Front. Psychol. 2019, 10, 2126. [Google Scholar] [CrossRef]
- La Marra, M.; Villano, I.; Ilardi, C.R.; Carosella, M.; Staiano, M.; Iavarone, A.; Chieffi, S.; Messina, G.; Polito, R.; Porro, C.; et al. Executive Functions in Overweight and Obese Treatment-Seeking Patients: Cross-Sectional Data and Longitudinal Perspectives. Brain Sci. 2022, 12, 777. [Google Scholar] [CrossRef]
- Artham, S.M.; Lavie, C.J.; Milani, R.V.; Ventura, H.O. The Obesity Paradox: Impact of Obesity on the Prevalence and Prognosis of Cardiovascular Diseases. Postgrad. Med. 2008, 120, 34–41. [Google Scholar] [CrossRef]
- Childers, D.K.; Allison, D.B. The ‘Obesity Paradox’: A Parsimonious Explanation for Relations among Obesity, Mortality Rate and Aging? Int. J. Obes. 2010, 34, 1231–1238. [Google Scholar] [CrossRef]
- Flegal, K.M.; Kit, B.K.; Orpana, H.; Graubard, B.I. Association of All-Cause Mortality With Overweight and Obesity Using Standard Body Mass Index Categories: A Systematic Review and Meta-Analysis. JAMA 2013, 309, 71. [Google Scholar] [CrossRef] [PubMed]
- Monda, V.; La Marra, M.; Perrella, R.; Caviglia, G.; Iavarone, A.; Chieffi, S.; Messina, G.; Carotenuto, M.; Monda, M.; Messina, A. Obesity and Brain Illness: From Cognitive and Psychological Evidences to Obesity Paradox. DMSO 2017, 10, 473–479. [Google Scholar] [CrossRef] [PubMed]
- Hartanto, A.; Yong, J.C. Measurement Matters: Higher Waist-to-Hip Ratio but Not Body Mass Index Is Associated with Deficits in Executive Functions and Episodic Memory. PeerJ 2018, 6, e5624. [Google Scholar] [CrossRef] [PubMed]
- Reinert, K.R.S.; Po’e, E.K.; Barkin, S.L. The Relationship between Executive Function and Obesity in Children and Adolescents: A Systematic Literature Review. J. Obes. 2013, 2013, 820956. [Google Scholar] [CrossRef] [PubMed]
- Gallagher, D.; Visser, M.; Sepulveda, D.; Pierson, R.N.; Harris, T.; Heymsfield, S.B. How Useful Is Body Mass Index for Comparison of Body Fatness across Age, Sex, and Ethnic Groups? Am. J. Epidemiol. 1996, 143, 228–239. [Google Scholar] [CrossRef] [PubMed]
- Rothman, K.J. BMI-Related Errors in the Measurement of Obesity. Int. J. Obes. 2008, 32, S56–S59. [Google Scholar] [CrossRef] [PubMed]
- Stevens, J.; McClain, J.E.; Truesdale, K.P. Selection of Measures in Epidemiologic Studies of the Consequences of Obesity. Int. J. Obes. 2008, 32, S60–S66. [Google Scholar] [CrossRef]
- Janssen, I.; Katzmarzyk, P.T.; Ross, R. Waist Circumference and Not Body Mass Index Explains Obesity-Related Health Risk. Am. J. Clin. Nutr. 2004, 79, 379–384. [Google Scholar] [CrossRef]
- Price, G.M.; Uauy, R.; Breeze, E.; Bulpitt, C.J.; Fletcher, A.E. Weight, Shape, and Mortality Risk in Older Persons: Elevated Waist-Hip Ratio, Not High Body Mass Index, Is Associated with a Greater Risk of Death. Am. J. Clin. Nutr. 2006, 84, 449–460. [Google Scholar] [CrossRef] [PubMed]
- Zhu, S.; Heymsfield, S.B.; Toyoshima, H.; Wang, Z.; Pietrobelli, A.; Heshka, S. Race-Ethnicity–Specific Waist Circumference Cutoffs for Identifying Cardiovascular Disease Risk Factors. Am. J. Clin. Nutr. 2005, 81, 409–415. [Google Scholar] [CrossRef]
- Yoshitake, T.; Kiyohara, Y.; Kato, I.; Ohmura, T.; Iwamoto, H.; Nakayama, K.; Ohmori, S.; Nomiyama, K.; Kawano, H.; Ueda, K.; et al. Incidence and Risk Factors of Vascular Dementia and Alzheimer’s Disease in a Defined Elderly Japanese Population: The Hisayama Study. Neurology 1995, 45, 1161–1168. [Google Scholar] [CrossRef] [PubMed]
- Segura, B.; Jurado, M.Á.; Freixenet, N.; Albuin, C.; Muniesa, J.; Junqué, C. Mental Slowness and Executive Dysfunctions in Patients with Metabolic Syndrome. Neurosci. Lett. 2009, 462, 49–53. [Google Scholar] [CrossRef] [PubMed]
- Dye, L.; Boyle, N.B.; Champ, C.; Lawton, C. The Relationship between Obesity and Cognitive Health and Decline. Proc. Nutr. Soc. 2017, 76, 443–454. [Google Scholar] [CrossRef] [PubMed]
- Ilardi, C.R.; Garofalo, E.; Chieffi, S.; Gamboz, N.; La Marra, M.; Iavarone, A. Daily Exposure to Digital Displays May Affect the Clock-Drawing Test: From Psychometrics to Serendipity. Neurol. Sci. 2020, 41, 3683–3690. [Google Scholar] [CrossRef]
- Rycroft, S.S.; Quach, L.T.; Ward, R.E.; Pedersen, M.M.; Grande, L.; Bean, J.F. The Relationship Between Cognitive Impairment and Upper Extremity Function in Older Primary Care Patients. J. Gerontol. Ser. A 2019, 74, 568–574. [Google Scholar] [CrossRef]
- Monda, V.; Valenzano, A.; Moscatelli, F.; Salerno, M.; Sessa, F.; Triggiani, A.I.; Viggiano, A.; Capranica, L.; Marsala, G.; De Luca, V.; et al. Primary Motor Cortex Excitability in Karate Athletes: A Transcranial Magnetic Stimulation Study. Front. Physiol. 2017, 8, 695. [Google Scholar] [CrossRef]
- Koziol, L.F.; Budding, D.E.; Chidekel, D. From Movement to Thought: Executive Function, Embodied Cognition, and the Cerebellum. Cerebellum 2012, 11, 505–525. [Google Scholar] [CrossRef]
- Koziol, L.F.; Lutz, J.T. From Movement to Thought: The Development of Executive Function. Appl. Neuropsychol. Child 2013, 2, 104–115. [Google Scholar] [CrossRef]
- Ilardi, C.R.; Iavarone, A.; La Marra, M.; Iachini, T.; Chieffi, S. Hand Movements in Mild Cognitive Impairment: Clinical Implications and Insights for Future Research. J. Integr. Neurosci. 2022, 21, 067. [Google Scholar] [CrossRef] [PubMed]
- Slining, M.; Adair, L.S.; Goldman, B.D.; Borja, J.B.; Bentley, M. Infant Overweight Is Associated with Delayed Motor Development. J. Pediatrics 2010, 157, 20–25.e1. [Google Scholar] [CrossRef] [PubMed]
- Kemp, C.; Pienaar, A.E. Relationship between the Body Composition and Motor and Physical Competence of Grade 1 Learners in South Africa. J. Sports Med. Phys. Fitness 2013, 53, 635–643. [Google Scholar] [PubMed]
- D’Hondt, E.; Segers, V.; Deforche, B.; Shultz, S.P.; Tanghe, A.; Gentier, I.; De Bourdeaudhuij, I.; De Clercq, D.; Lenoir, M. The Role of Vision in Obese and Normal-Weight Children’s Gait Control. Gait Posture 2011, 33, 179–184. [Google Scholar] [CrossRef]
- D’Hondt, E.; Deforche, B.; De Bourdeaudhuij, I.; Lenoir, M. Childhood Obesity Affects Fine Motor Skill Performance under Different Postural Constraints. Neurosci. Lett. 2008, 440, 72–75. [Google Scholar] [CrossRef]
- Mehta, R.K.; Shortz, A.E. Obesity-Related Differences in Neural Correlates of Force Control. Eur. J. Appl. Physiol. 2014, 114, 197–204. [Google Scholar] [CrossRef]
- Moore, A.Z.; Caturegli, G.; Metter, E.J.; Makrogiannis, S.; Resnick, S.M.; Harris, T.B.; Ferrucci, L. Difference in Muscle Quality over the Adult Life Span and Biological Correlates in the Baltimore Longitudinal Study of Aging. J. Am. Geriatr. Soc. 2014, 62, 230–236. [Google Scholar] [CrossRef]
- Southall, J.E.; Okely, A.D.; Steele, J.R. Actual and Perceived Physical Competence in Overweight and Nonoverweight Children. Pediatric Exerc. Sci. 2004, 16, 15–24. [Google Scholar] [CrossRef]
- Poulsen, A.A.; Desha, L.; Ziviani, J.; Griffiths, L.; Heaslop, A.; Khan, A.; Leong, G.M. Fundamental Movement Skills and Self-Concept of Children Who Are Overweight. Int. J. Pediatric Obes. 2011, 6, e464–e471. [Google Scholar] [CrossRef]
- Roberts, D.; Veneri, D.; Decker, R.; Gannotti, M. Weight Status and Gross Motor Skill in Kindergarten Children. Pediatric Phys. Ther. 2012, 24, 353–360. [Google Scholar] [CrossRef]
- Mond, J.M.; Stich, H.; Hay, P.J.; Kraemer, A.; Baune, B.T. Associations between Obesity and Developmental Functioning in Pre-School Children: A Population-Based Study. Int. J. Obes. 2007, 31, 1068–1073. [Google Scholar] [CrossRef] [Green Version]
- Krombholz, H. Motor and Cognitive Performance of Overweight Preschool Children. Percept. Mot. Skills 2013, 116, 40–57. [Google Scholar] [CrossRef] [PubMed]
- Gentier, I.; D’Hondt, E.; Shultz, S.; Deforche, B.; Augustijn, M.; Hoorne, S.; Verlaecke, K.; De Bourdeaudhuij, I.; Lenoir, M. Fine and Gross Motor Skills Differ between Healthy-Weight and Obese Children. Res. Dev. Disabil. 2013, 34, 4043–4051. [Google Scholar] [CrossRef] [PubMed]
- Cawley, J.; Spiess, C.K. Obesity and Skill Attainment in Early Childhood. Econ. Hum. Biol. 2008, 6, 388–397. [Google Scholar] [CrossRef] [PubMed]
- Vanden Bosch, M.L.; Robbins, L.B.; Pfeiffer, K.A.; Kazanis, A.S.; Maier, K.S. Demographic, Cognitive, Affective, and Behavioral Variables Associated with Overweight and Obesity in Low-Active Girls. J. Pediatric Nurs. 2014, 29, 576–585. [Google Scholar] [CrossRef]
- Bryant, E.S.; Duncan, M.J.; Birch, S.L. Fundamental Movement Skills and Weight Status in British Primary School Children. Eur. J. Sport Sci. 2014, 14, 730–736. [Google Scholar] [CrossRef] [PubMed]
- Cliff, D.P.; Okely, A.D.; Morgan, P.J.; Jones, R.A.; Steele, J.R.; Baur, L.A. Proficiency Deficiency: Mastery of Fundamental Movement Skills and Skill Components in Overweight and Obese Children. Obesity 2012, 20, 1024–1033. [Google Scholar] [CrossRef] [PubMed]
- Precenzano, F.; Ruberto, M. Sleep Habits in Children Affected by Autism Spectrum Disorders: A Preliminary Case-Control Study. Acta Med. Mediterr. 2017, 33, 405–409. [Google Scholar] [CrossRef]
- Okely, A.D.; Booth, M.L.; Chey, T. Relationships between Body Composition and Fundamental Movement Skills among Children and Adolescents. Res. Q. Exerc. Sport 2004, 75, 238–247. [Google Scholar] [CrossRef]
- Waldstein, S.R.; Katzel, L.I. Interactive Relations of Central versus Total Obesity and Blood Pressure to Cognitive Function. Int. J. Obes. 2006, 30, 201–207. [Google Scholar] [CrossRef]
- Mignardot, J.-B.; Olivier, I.; Promayon, E.; Nougier, V. Obesity Impact on the Attentional Cost for Controlling Posture. PLoS ONE 2010, 5, e14387. [Google Scholar] [CrossRef]
- Wang, C.; Chan, J.S.Y.; Ren, L.; Yan, J.H. Obesity Reduces Cognitive and Motor Functions across the Lifespan. Neural Plast. 2016, 2016, 2473081. [Google Scholar] [CrossRef] [PubMed]
- Sui, S.X.; Ridding, M.C.; Hordacre, B. Obesity Is Associated with Reduced Plasticity of the Human Motor Cortex. Brain Sci. 2020, 10, 579. [Google Scholar] [CrossRef] [PubMed]
- Hsu, C.L.; Voss, M.W.; Best, J.R.; Handy, T.C.; Madden, K.; Bolandzadeh, N.; Liu-Ambrose, T. Elevated Body Mass Index and Maintenance of Cognitive Function in Late Life: Exploring Underlying Neural Mechanisms. Front. Aging Neurosci. 2015, 7, 155. [Google Scholar] [CrossRef] [PubMed]
- Measso, G.; Cavarzeran, F.; Zappalà, G.; Lebowitz, B.D.; Crook, T.H.; Pirozzolo, F.J.; Amaducci, L.A.; Massari, D.; Grigoletto, F. The Mini-mental State Examination: Normative Study of an Italian Random Sample. Dev. Neuropsychol. 1993, 9, 77–85. [Google Scholar] [CrossRef]
- Ilardi, C.R.; Chieffi, S.; Scuotto, C.; Gamboz, N.; Galeone, F.; Sannino, M.; Garofalo, E.; La Marra, M.; Ronga, B.; Iavarone, A. The Frontal Assessment Battery 20 Years Later: Normative Data for a Shortened Version (FAB15). Neurol. Sci. 2022, 43, 1709–1719. [Google Scholar] [CrossRef]
- Siciliano, M.; Chiorri, C.; Battini, V.; Sant’Elia, V.; Altieri, M.; Trojano, L.; Santangelo, G. Regression-Based Normative Data and Equivalent Scores for Trail Making Test (TMT): An Updated Italian Normative Study. Neurol. Sci. 2019, 40, 469–477. [Google Scholar] [CrossRef]
- Monaco, M.; Costa, A.; Caltagirone, C.; Carlesimo, G.A. Forward and Backward Span for Verbal and Visuo-Spatial Data: Standardization and Normative Data from an Italian Adult Population. Neurol. Sci. 2013, 34, 749–754. [Google Scholar] [CrossRef]
- Schatz, P. Finger Tapping Test. In Encyclopedia of Clinical Neuropsychology; Kreutzer, J.S., DeLuca, J., Caplan, B., Eds.; Springer: New York, NY, USA, 2011; pp. 1050–1051. ISBN 978-0-387-79947-6. [Google Scholar]
- Dubois, B.; Slachevsky, A.; Litvan, I.; Pillon, B. The FAB: A Frontal Assessment Battery at Bedside. Neurology 2000, 55, 1621–1626. [Google Scholar] [CrossRef]
- Jacobson, S.C.; Blanchard, M.; Connolly, C.C.; Cannon, M.; Garavan, H. An FMRI Investigation of a Novel Analogue to the Trail-Making Test. Brain Cogn. 2011, 77, 60–70. [Google Scholar] [CrossRef]
- Baddeley, A. Working Memory. Science 1992, 255, 556–559. [Google Scholar] [CrossRef]
- Baddeley, A. Exploring the Central Executive. Q. J. Exp. Psychol. Sect. A 1996, 49, 5–28. [Google Scholar] [CrossRef]
- Kluger, A.; Gianutsos, J.G.; Golomb, J.; Ferris, S.H.; George, A.E.; Franssen, E.; Reisberg, B. Patterns of Motor Impairment in Normal Aging, Mild Cognitive Decline, and Early Alzheimer’ Disease. J. Gerontol. Ser. B Psychol. Sci. Soc. Sci. 1997, 52, P28–P39. [Google Scholar] [CrossRef] [PubMed]
- Jobbágy, Á.; Harcos, P.; Karoly, R.; Fazekas, G. Analysis of Finger-Tapping Movement. J. Neurosci. Methods 2005, 141, 29–39. [Google Scholar] [CrossRef] [PubMed]
- Suzumura, S.; Osawa, A.; Nagahama, T.; Kondo, I.; Sano, Y.; Kandori, A. Assessment of Finger Motor Skills in Individuals with Mild Cognitive Impairment and Patients with Alzheimer’s Disease: Relationship between Finger-to-Thumb Tapping and Cognitive Function. JJCRS 2016, 7, 19–28. [Google Scholar] [CrossRef]
- Witt, S.T.; Laird, A.R.; Meyerand, M.E. Functional Neuroimaging Correlates of Finger-Tapping Task Variations: An ALE Meta-Analysis. NeuroImage 2008, 42, 343–356. [Google Scholar] [CrossRef]
- Veale, J.F. Edinburgh Handedness Inventory—Short Form: A Revised Version Based on Confirmatory Factor Analysis. Laterality Asymmetries Body Brain Cogn. 2014, 19, 164–177. [Google Scholar] [CrossRef]
- Preacher, K.J.; Hayes, A.F. Asymptotic and Resampling Strategies for Assessing and Comparing Indirect Effects in Multiple Mediator Models. Behav. Res. Methods 2008, 40, 879–891. [Google Scholar] [CrossRef]
- Daoud, J.I. Multicollinearity and Regression Analysis. J. Phys. Conf. Ser. 2017, 949, 012009. [Google Scholar] [CrossRef]
- Ilardi, A.; Chieffi, S.; Ilardi, C.R. Predictive Role of Population Density and Use of Public Transport for Major Outcomes of SARS-CoV-2 Infection in the Italian Population: An Ecological Study. J. Res. Health Sci. 2021, 21, e00518. [Google Scholar] [CrossRef]
- Vainik, U.; Dagher, A.; Dubé, L.; Fellows, L.K. Neurobehavioural Correlates of Body Mass Index and Eating Behaviours in Adults: A Systematic Review. Neurosci. Biobehav. Rev. 2013, 37, 279–299. [Google Scholar] [CrossRef] [PubMed] [Green Version]
- Emery, R.L.; Levine, M.D. Questionnaire and Behavioral Task Measures of Impulsivity Are Differentially Associated with Body Mass Index: A Comprehensive Meta-Analysis. Psychol. Bull. 2017, 143, 868–902. [Google Scholar] [CrossRef] [PubMed]
- Marqués-Iturria, I.; Pueyo, R.; Garolera, M.; Segura, B.; Junqué, C.; García-García, I.; José Sender-Palacios, M.; Vernet-Vernet, M.; Narberhaus, A.; Ariza, M.; et al. Frontal Cortical Thinning and Subcortical Volume Reductions in Early Adulthood Obesity. Psychiatry Res. Neuroimaging 2013, 214, 109–115. [Google Scholar] [CrossRef] [PubMed]
- Mueller, K.; Sacher, J.; Arelin, K.; Holiga, Š.; Kratzsch, J.; Villringer, A.; Schroeter, M.L. Overweight and Obesity Are Associated with Neuronal Injury in the Human Cerebellum and Hippocampus in Young Adults: A Combined MRI, Serum Marker and Gene Expression Study. Transl. Psychiatry 2012, 2, e200. [Google Scholar] [CrossRef]
- Gaul, D.; Mat, A.; O’Shea, D.; Issartel, J. Impaired Visual Motor Coordination in Obese Adults. J. Obes. 2016, 2016, 6178575. [Google Scholar] [CrossRef]
- Moscatelli, F.; Messina, G.; Valenzano, A.; Petito, A.; Triggiani, A.I.; Ciliberti, M.A.P.; Monda, V.; Messina, A.; Tafuri, D.; Capranica, L.; et al. Relationship between RPE and Blood Lactate after Fatiguing Handgrip Exercise in Taekwondo and Sedentary Subjects. Biol. Med. 2015, 1, S3008. [Google Scholar] [CrossRef]
- Milner, A.D.; Goodale, M.A. Two Visual Systems Re-Viewed. Neuropsychologia 2008, 46, 774–785. [Google Scholar] [CrossRef]
- Committeri, G.; Galati, G.; Paradis, A.-L.; Pizzamiglio, L.; Berthoz, A.; LeBihan, D. Reference Frames for Spatial Cognition: Different Brain Areas Are Involved in Viewer-, Object-, and Landmark-Centered Judgments About Object Location. J. Cogn. Neurosci. 2004, 16, 1517–1535. [Google Scholar] [CrossRef]
- Zaehle, T.; Jordan, K.; Wüstenberg, T.; Baudewig, J.; Dechent, P.; Mast, F.W. The Neural Basis of the Egocentric and Allocentric Spatial Frame of Reference. Brain Res. 2007, 1137, 92–103. [Google Scholar] [CrossRef]
- Chieffi, S.; Messina, G.; Villano, I.; Messina, A.; Ilardi, C.R.; Monda, M.; Salerno, M.; Sessa, F.; Mollica, M.P.; Cavaliere, G.; et al. Hemispheric Asymmetries in Radial Line Bisection: Role of Retinotopic and Spatiotopic Factors. Front. Psychol. 2018, 9, 2200. [Google Scholar] [CrossRef]
- Chieffi, S.; Castaldi, C.; Di Maio, G.; La Marra, M.; Messina, A.; Monda, V.; Villano, I. Attentional Bias in the Radial and Vertical Dimensions of Space. Comptes Rendus. Biol. 2019, 342, 97–100. [Google Scholar] [CrossRef] [PubMed]
- Chieffi, S.; Messina, G.; La Marra, M.; Iavarone, A.; Viggiano, A.; De Luca, V.; Monda, M. Distractor interference in visual motor tasks. Hor. Neurosci. Res. 2014, 13, 151–160. [Google Scholar]
- Ilardi, C.R.; Iavarone, A.; Villano, I.; Rapuano, M.; Ruggiero, G.; Iachini, T.; Chieffi, S. Egocentric and Allocentric Spatial Representations in a Patient with Bálint-like Syndrome: A Single-Case Study. Cortex 2021, 135, 10–16. [Google Scholar] [CrossRef]
- Astafiev, S.V.; Shulman, G.L.; Stanley, C.M.; Snyder, A.Z.; Van Essen, D.C.; Corbetta, M. Functional Organization of Human Intraparietal and Frontal Cortex for Attending, Looking, and Pointing. J. Neurosci. 2003, 23, 4689–4699. [Google Scholar] [CrossRef] [PubMed]
- Connolly, J.D.; Andersen, R.A.; Goodale, M.A. FMRI Evidence for a “parietal Reach Region” in the Human Brain. Exp. Brain Res. 2003, 153, 140–145. [Google Scholar] [CrossRef] [PubMed]
- Karnath, H.-O.; Perenin, M.-T. Cortical Control of Visually Guided Reaching: Evidence from Patients with Optic Ataxia. Cereb. Cortex 2005, 15, 1561–1569. [Google Scholar] [CrossRef] [PubMed]
- Wolpert, D.M.; Goodbody, S.J.; Husain, M. Maintaining Internal Representations: The Role of the Human Superior Parietal Lobe. Nat. Neurosci. 1998, 1, 529–533. [Google Scholar] [CrossRef]
- Wolpert, D.M.; Miall, R.C.; Kawato, M. Internal Models in the Cerebellum. Trends Cogn. Sci. 1998, 2, 338–347. [Google Scholar] [CrossRef]
- Bastian, A.J. Learning to Predict the Future: The Cerebellum Adapts Feedforward Movement Control. Curr. Opin. Neurobiol. 2006, 16, 645–649. [Google Scholar] [CrossRef]
- Chieffi, S.; Iavarone, A.; La Marra, M.; Messina, G.; Villano, I.; Ranucci, S.; Messina, A.; Piombino, L.; Dalia, C.; Monda, M. Memory for proprioceptive targets in bulimia nervosa. J. Psychiatry 2015, 18, 2. [Google Scholar] [CrossRef]
- Villano, I.; Ilardi, C.R.; Arena, S.; Scuotto, C.; Gleijeses, M.G.; Messina, G.; Messina, A.; Monda, V.; Monda, M.; Iavarone, A.; et al. Obese Subjects without Eating Disorders Experience Binge Episodes Also Independently of Emotional Eating and Personality Traits among University Students of Southern Italy. Brain Sci. 2021, 11, 1145. [Google Scholar] [CrossRef] [PubMed]
- Chieffi, S.; Messina, A.; Villano, I.; Valenzano, A.A.; Nigro, E.; La Marra, M.; Cibelli, G.; Monda, V.; Salerno, M.; Tafuri, D.; et al. The Use of Velocity Information in Movement Reproduction. Front. Psychol. 2017, 8, 983. [Google Scholar] [CrossRef] [PubMed] [Green Version]
- Hotamisligil, G.S.; Shargill, N.S.; Spiegelman, B.M. Adipose Expression of Tumor Necrosis Factor-α: Direct Role in Obesity-Linked Insulin Resistance. Science 1993, 259, 87–91. [Google Scholar] [CrossRef] [PubMed]
- Visser, M. Elevated C-Reactive Protein Levels in Overweight and Obese Adults. JAMA 1999, 282, 2131. [Google Scholar] [CrossRef]
- Yudkin, J.S.; Stehouwer, C.D.A.; Emeis, J.J.; Coppack, S.W. C-Reactive Protein in Healthy Subjects: Associations with Obesity, Insulin Resistance, and Endothelial Dysfunction: A Potential Role for Cytokines Originating From Adipose Tissue? ATVB 1999, 19, 972–978. [Google Scholar] [CrossRef]
- Ouchi, N.; Parker, J.L.; Lugus, J.J.; Walsh, K. Adipokines in Inflammation and Metabolic Disease. Nat. Rev. Immunol. 2011, 11, 85–97. [Google Scholar] [CrossRef]
- Monda, M.; Messina, G.; Mangoni, C.; De Luca, B. Resting Energy Expenditure and Fat-Free Mass Do Not Decline during Aging in Severely Obese Women. Clin. Nutr. 2008, 27, 657–659. [Google Scholar] [CrossRef]
- De Fusco, C.; Messina, A.; Monda, V.; Viggiano, E.; Moscatelli, F.; Valenzano, A.; Esposito, T.; Sergio, C.; Cibelli, G.; Monda, M.; et al. Osteopontin: Relation between Adipose Tissue and Bone Homeostasis. Stem Cells Int. 2017, 2017, 4045238. [Google Scholar] [CrossRef]
- Chieffi, S.; Villano, I.; Messina, A.; Monda, V.; La Marra, M.; Messina, G.; Monda, M. Involvement of orexin in sleep disorders and neurodegenerative diseases. Curr. Top. Pept. 2015, 16, 49–54. [Google Scholar]
- Cavaliere, G.; Viggiano, E.; Trinchese, G.; De Filippo, C.; Messina, A.; Monda, V.; Valenzano, A.; Cincione, R.I.; Zammit, C.; Cimmino, F.; et al. Long Feeding High-Fat Diet Induces Hypothalamic Oxidative Stress and Inflammation, and Prolonged Hypothalamic AMPK Activation in Rat Animal Model. Front. Physiol. 2018, 9, 818. [Google Scholar] [CrossRef]
- Anstey, K.J.; Cherbuin, N.; Budge, M.; Young, J. Body Mass Index in Midlife and Late-Life as a Risk Factor for Dementia: A Meta-Analysis of Prospective Studies: BMI and Risk of Dementia. Obes. Rev. 2011, 12, e426–e437. [Google Scholar] [CrossRef]
- Messina, A.; Monda, V.; Avola, R.; Moscatelli, F.; Avalenzano, A.N.; Villano, I.; Ruberto, M.; Monda, E.; Marra, M.L.; Tafuri, D.; et al. Role Of The Orexin System On Arousal, Attention, Feeding Behaviour And Sleep Disorders. Acta Med. Mediterr. 2017, 33, 645–649. [Google Scholar] [CrossRef]
- Villano, I.; La Marra, M.; Di Maio, G.; Monda, V.; Chieffi, S.; Guatteo, E.; Messina, G.; Moscatelli, F.; Monda, M.; Messina, A. Physiological Role of Orexinergic System for Health. Int. J. Environ. Res. Public Health 2022, 19, 8353. [Google Scholar] [CrossRef] [PubMed]
- Lee, Y.-H.; Martin, J.M.; Maple, R.L.; Tharp, W.G.; Pratley, R.E. Plasma Amyloid-β Peptide Levels Correlate with Adipocyte Amyloid Precursor Protein Gene Expression in Obese Individuals. Neuroendocrinology 2009, 90, 383–390. [Google Scholar] [CrossRef]
- Jahangiri, A.; Wilson, P.G.; Hou, T.; Brown, A.; King, V.L.; Tannock, L.R. Serum Amyloid A Is Found on ApoB-Containing Lipoproteins in Obese Humans with Diabetes: SAA Lipoprotein Distribution. Obesity 2013, 21, 993–996. [Google Scholar] [CrossRef] [PubMed]
- Serrano-Pozo, A.; Frosch, M.P.; Masliah, E.; Hyman, B.T. Neuropathological Alterations in Alzheimer Disease. Cold Spring Harb. Perspect. Med. 2011, 1, a006189. [Google Scholar] [CrossRef] [PubMed]
- Skoog, I.; Wallin, A.; Fredman, P.; Hesse, C.; Aevarsson, O.; Karlsson, I.; Gottfries, C.G.; Blennow, K. A Population Study on Blood-Brain Barrier Function in 85-Year-Olds: Relation to Alzheimer’s Disease and Vascular Dementia. Neurology 1998, 50, 966–971. [Google Scholar] [CrossRef]


| Mean | SD | Range | |
|---|---|---|---|
| MMSE a | 29.21 | 1.22 | 23–30 |
| FAB15 a | 13.63 | 1.54 | 7–15 |
| TMT-A, seconds a | 37.89 | 18.79 | 15–100 |
| TMT-B, seconds a | 95.10 | 42.53 | 20–239 |
| TMT(B-A), seconds a | 57.91 | 31.38 | 2–151 |
| DSB a | 6.05 | 1.43 | 4–8 |
| FTTm | 63.42 | 12.23 | 16.80–91.40 |
| Predictors | R2 for Model | F For Model | R2 Change | F for R2 Change | |
|---|---|---|---|---|---|
| Outcome: BMI | |||||
| 1 | Sex, age, education | 0.223 | F(3, 326) = 21.704 *** | 0.223 | F(3, 326) = 21.704 *** |
| 2 | Sex, age, education, FAB15 | 0.226 | F(4, 325) = 16.498 *** | 0.003 | F(1, 325) = 0.906 |
| 3 | Sex, age, education, FAB15, TMT(B-A), DSB | 0.230 | F(6, 323) = 11.122 *** | 0.004 | F(2, 323) = 0.512 |
| 4 | Sex, age, education, FAB15, TMT(B-A), DSB, FTTm | 0.238 | F(7, 322) = 9.929 *** | 0.008 | F(1, 322) = 0.126 |
| Outcome: WC | |||||
| 1 | Sex, age, education | 0.408 | F(3, 326) = 54.895 *** | 0.408 | F(3, 326) = 54.895 *** |
| 2 | Sex, age, education, FAB15 | 0.427 | F(4, 325) = 44.363 *** | 0.019 | F(1, 325) = 7.967 *** |
| 3 | Sex, age, education, FAB15, TMT(B-A), DSB | 0.434 | F(6, 323) = 30.151 *** | 0.007 | F(2, 323) = 1.417 |
| 4 | Sex, age, education, FAB15, TMT(B-A), DSB, FTTm | 0.458 | F(7, 322) = 28.353 *** | 0.024 | F(1, 322) = 10.378 *** |
| Predictors | B | 95% CI for B | SE | t | p-Value | VIF | Tol. | ||
|---|---|---|---|---|---|---|---|---|---|
| LL | UL | ||||||||
| Outcome: | BMI | ||||||||
| Stage 1 | Sex | −1.533 | −2.363 | −0.703 | 0.421 | −3.640 | <0.001 | 0.991 | 1.009 |
| Age | 0.061 | 0.036 | 0.086 | 0.013 | 4.834 | <0.001 | 0.990 | 1.010 | |
| Education | −0.323 | −0.451 | −0.196 | 0.065 | −4.994 | <0.001 | 0.991 | 1.009 | |
| Stage 2 | Sex | −1.564 | −2.396 | −0.731 | 0.423 | −3.701 | <0.001 | 0.985 | 1.015 |
| Age | 0.066 | 0.039 | 0.093 | 0.014 | 4.812 | <0.001 | 0.833 | 1.200 | |
| Education | −0.351 | −0.490 | −0.211 | 0.071 | −4.950 | <0.001 | 0.829 | 1.207 | |
| FAB15 | −0.175 | −0.158 | 0.539 | 0.184 | −0.952 | 0.342 | 0.704 | 1.420 | |
| Stage 3 | Sex | −1.585 | −2.421 | −0.750 | 0.424 | −3.738 | <0.001 | 0.982 | 1.018 |
| Age | 0.060 | 0.030 | 0.090 | 0.015 | 3.897 | <0.001 | 0.669 | 1.494 | |
| Education | −0.327 | −0.479 | −0.176 | 0.077 | −4.260 | <0.001 | 0.708 | 1.412 | |
| FAB15 | −0.221 | −0.168 | 0.610 | 0.197 | −1.119 | 0.264 | 0.617 | 1.621 | |
| TMT(B-A) | 0.006 | −0.010 | 0.021 | 0.008 | 0.727 | 0.468 | 0.685 | 1.459 | |
| DSB | −0.126 | −0.465 | 0.213 | 0.172 | −0.731 | 0.466 | 0.759 | 1.318 | |
| Stage 4 | Sex | −1.945 | −2.897 | −0.993 | 0.483 | −4.025 | <0.001 | 0.752 | 1.329 |
| Age | 0.050 | 0.017 | 0.083 | 0.017 | 3.025 | 0.003 | 0.572 | 1.750 | |
| Education | −0.326 | −0.477 | −0.175 | 0.077 | −4.257 | <0.001 | 0.708 | 1.412 | |
| FAB15 | −0.215 | −0.173 | 0.603 | 0.197 | −1.091 | 0.276 | 0.617 | 1.622 | |
| TMT(B-A) | 0.004 | −0.012 | 0.019 | 0.008 | 0.460 | 0.646 | 0.666 | 1.502 | |
| DSB | −0.116 | −0.454 | 0.223 | 0.172 | −0.673 | 0.502 | 0.758 | 1.320 | |
| FTTm | −0.042 | −0.095 | 0.012 | 0.027 | −1.538 | 0.126 | 0.568 | 1.760 | |
| Outcome: | WC | ||||||||
| Stage 1 | Sex | −10.369 | −12.831 | −7.907 | 1.250 | −8.296 | <0.001 | 1.007 | 0.993 |
| Age | 0.294 | 0.221 | 0.367 | 0.037 | 7.937 | <0.001 | 1.003 | 0.997 | |
| Education | −0.988 | −1.377 | −0.600 | 0.197 | −5.011 | <0.001 | 1.008 | 0.992 | |
| Stage 2 | Sex | −10.465 | −12.893 | −8.037 | 1.233 | −8.491 | <0.001 | 1.008 | 0.992 |
| Age | 0.334 | 0.257 | 0.412 | 0.039 | 8.527 | <0.001 | 1.155 | 0.866 | |
| Education | −1.233 | −1.653 | −0.814 | 0.213 | −5.793 | <0.001 | 1.209 | 0.827 | |
| FAB15 | −1.503 | −2.553 | −0.454 | 0.533 | −2.823 | 0.005 | 1.371 | 0.729 | |
| Stage 3 | Sex | −10.486 | −12.924 | −8.049 | 1.237 | −8.477 | <0.001 | 1.019 | 0.982 |
| Age | 0.325 | 0.238 | 0.412 | 0.044 | 7.349 | <0.001 | 1.469 | 0.681 | |
| Education | −1.217 | −1.676 | −0.758 | 0.233 | −5.221 | <0.001 | 1.454 | 0.688 | |
| FAB15 | −1.827 | −2.942 | −0.712 | 0.566 | −3.229 | 0.001 | 1.553 | 0.644 | |
| TMT(B-A) | −0.003 | −0.049 | 0.043 | 0.023 | −0.130 | 0.897 | 1.502 | 0.666 | |
| DSB | −0.848 | −1.856 | 0.161 | 0.512 | −1.657 | 0.099 | 1.335 | 0.749 | |
| Stage 4 | Sex | −12.642 | −15.371 | −9.912 | 1.385 | −9.125 | <0.001 | 1.328 | 0.753 |
| Age | 0.254 | 0.159 | 0.350 | 0.048 | 5.249 | <0.001 | 1.841 | 0.543 | |
| Education | −1.168 | −1.619 | −0.717 | 0.229 | −5.099 | <0.001 | 1.461 | 0.685 | |
| FAB15 | −1.746 | −2.841 | −0.652 | 0.556 | −3.144 | 0.002 | 1.556 | 0.643 | |
| TMT(B-A) | −0.011 | −0.057 | 0.034 | 0.023 | −0.494 | 0.622 | 1.521 | 0.658 | |
| DSB | −0.840 | −1.829 | 0.149 | 0.502 | −1.673 | 0.096 | 1.335 | 0.749 | |
| FTTm | −0.255 | −0.410 | −0.099 | 0.079 | −3.221 | 0.001 | 1.788 | 0.559 | |
Publisher’s Note: MDPI stays neutral with regard to jurisdictional claims in published maps and institutional affiliations. |
© 2022 by the authors. Licensee MDPI, Basel, Switzerland. This article is an open access article distributed under the terms and conditions of the Creative Commons Attribution (CC BY) license (https://creativecommons.org/licenses/by/4.0/).
Share and Cite
La Marra, M.; Messina, A.; Ilardi, C.R.; Verde, G.; Amato, R.; Esposito, N.; Troise, S.; Orlando, A.; Messina, G.; Monda, V.; et al. The Neglected Factor in the Relationship between Executive Functioning and Obesity: The Role of Motor Control. Healthcare 2022, 10, 1775. https://doi.org/10.3390/healthcare10091775
La Marra M, Messina A, Ilardi CR, Verde G, Amato R, Esposito N, Troise S, Orlando A, Messina G, Monda V, et al. The Neglected Factor in the Relationship between Executive Functioning and Obesity: The Role of Motor Control. Healthcare. 2022; 10(9):1775. https://doi.org/10.3390/healthcare10091775
Chicago/Turabian StyleLa Marra, Marco, Antonietta Messina, Ciro Rosario Ilardi, Giuseppe Verde, Raffaella Amato, Nadia Esposito, Simona Troise, Antonella Orlando, Giovanni Messina, Vincenzo Monda, and et al. 2022. "The Neglected Factor in the Relationship between Executive Functioning and Obesity: The Role of Motor Control" Healthcare 10, no. 9: 1775. https://doi.org/10.3390/healthcare10091775