
Comparison of the Effect of Endurance, Strength, and Endurance-Strength Training on Inflammatory Markers and Adipokines Levels in Overweight and Obese Adults: Systematic Review and Meta-Analysis of Randomised Trials

 ,
,  , , , and
Abstract
:1. Introduction
2. Materials and Methods
2.1. Protocol and Registration
2.2. Information Sources and Search Strategy
- #1—(obesity OR overweight [Title, Abstract, Keyword])
- #2—(endurance training OR strength training OR exercise [Title, Abstract, Keyword])
- #3—#1 AND #2
- #4—#3 AND (Trials AND English [Filter])
- #1—(obesity OR overweight [MeSH Terms])
- #2—(endurance training OR strength training OR exercise [MeSH Terms])
- #3—#1 AND #2
- #4—#3 AND (humans AND English [Filter])
- #1—(obesity OR overweight [Article title, Abstract, Keywords])
- #2—(endurance training OR strength training OR exercise [Article title, Abstract, Keywords])
- #3—#1 AND #2
- #4—#3 AND (Article AND English [Filter])
- #1—(obesity OR overweight [Topic])
- #2—(endurance training OR strength training OR exercise [Topic])
- #3—#1 AND #2
- #4—#3 AND (Article AND English [Filter])
2.3. Eligibility Criteria
- Types of studies: randomised trial;
- Language: articles published in English;
- Population: free-living adult (≥18 years old) overweight and obese subjects (overweightness, obesity, or one of the following criteria should be listed in the inclusion criteria: body mass index (BMI) ≥25 kg/m2 [30] (≥23 kg/m2 for Asian populations [31]), waist circumference (WC) ≥80 cm for women and ≥94 cm for men [32], and percentage of fat mass (%FM) >32% for women and 25% for men [33], or equivalent) of either gender and without restrictions based on the ethnicity of study participants, location of study, or sample size;
- Types of interventions: studies that compare the effects of ET vs. ST training, or/and ET vs. CT, or/and ST vs. CT on inflammatory markers or adipokine levels without any dietary consultation or intervention (study populations should be instructed not to change dietary habits and should not take any dietary supplements), with a duration for the intervention of at least two weeks;
- Outcomes: only the studies which assessed at least one of the following outcomes were included:
- Inflammatory parameters and proinflammatory cytokines (1. CRP, 2. IL-6, 3. TNF-α levels);
- Adipokines (1. leptin, 2. adiponectin, 3. visfatin levels).
- Types of studies: non-randomised trials, uncontrolled trials, observational studies, cohort studies, cross-sectional studies, case-control, case-series, case-report studies, editorial letters, systematic reviews, meta-analyses, conference reports, studies available only as abstracts, and studies with animal models;
- Language: articles published in any language other than English;
- Population: children, adolescents, pregnant and breastfeeding women, subjects with rare comorbidities, and subjects living in non-public (closed-type) houses where subjects cannot freely decide on their eating habits or where all residents received the same diet.
2.4. Study Selection

2.5. Data Collection Process
2.6. Data Item
- General information: title of the articles, author list, journal name, publication year, country, and continent;
- Characteristics of the study: study name and design (parallel or cross-over randomised trial) and inclusion and exclusion criteria;
- Characteristics of the study population: number of subjects who were included, randomised, and completed the trial (total and for each group separately), age, sex, ethnicity, overweight and/or obesity diagnosis methods;
- Type of intervention: type of training, training volume, training intensity, training frequency, duration of the training, time of intervention, training supervision;
- Type of outcomes measured: pre-intervention and post-intervention values of each outcome, changes (Δ) for each outcome (post-intervention minus pre-intervention values).
2.7. Risk of Bias of Individual Studies
2.8. Statistical Analysis
3. Results
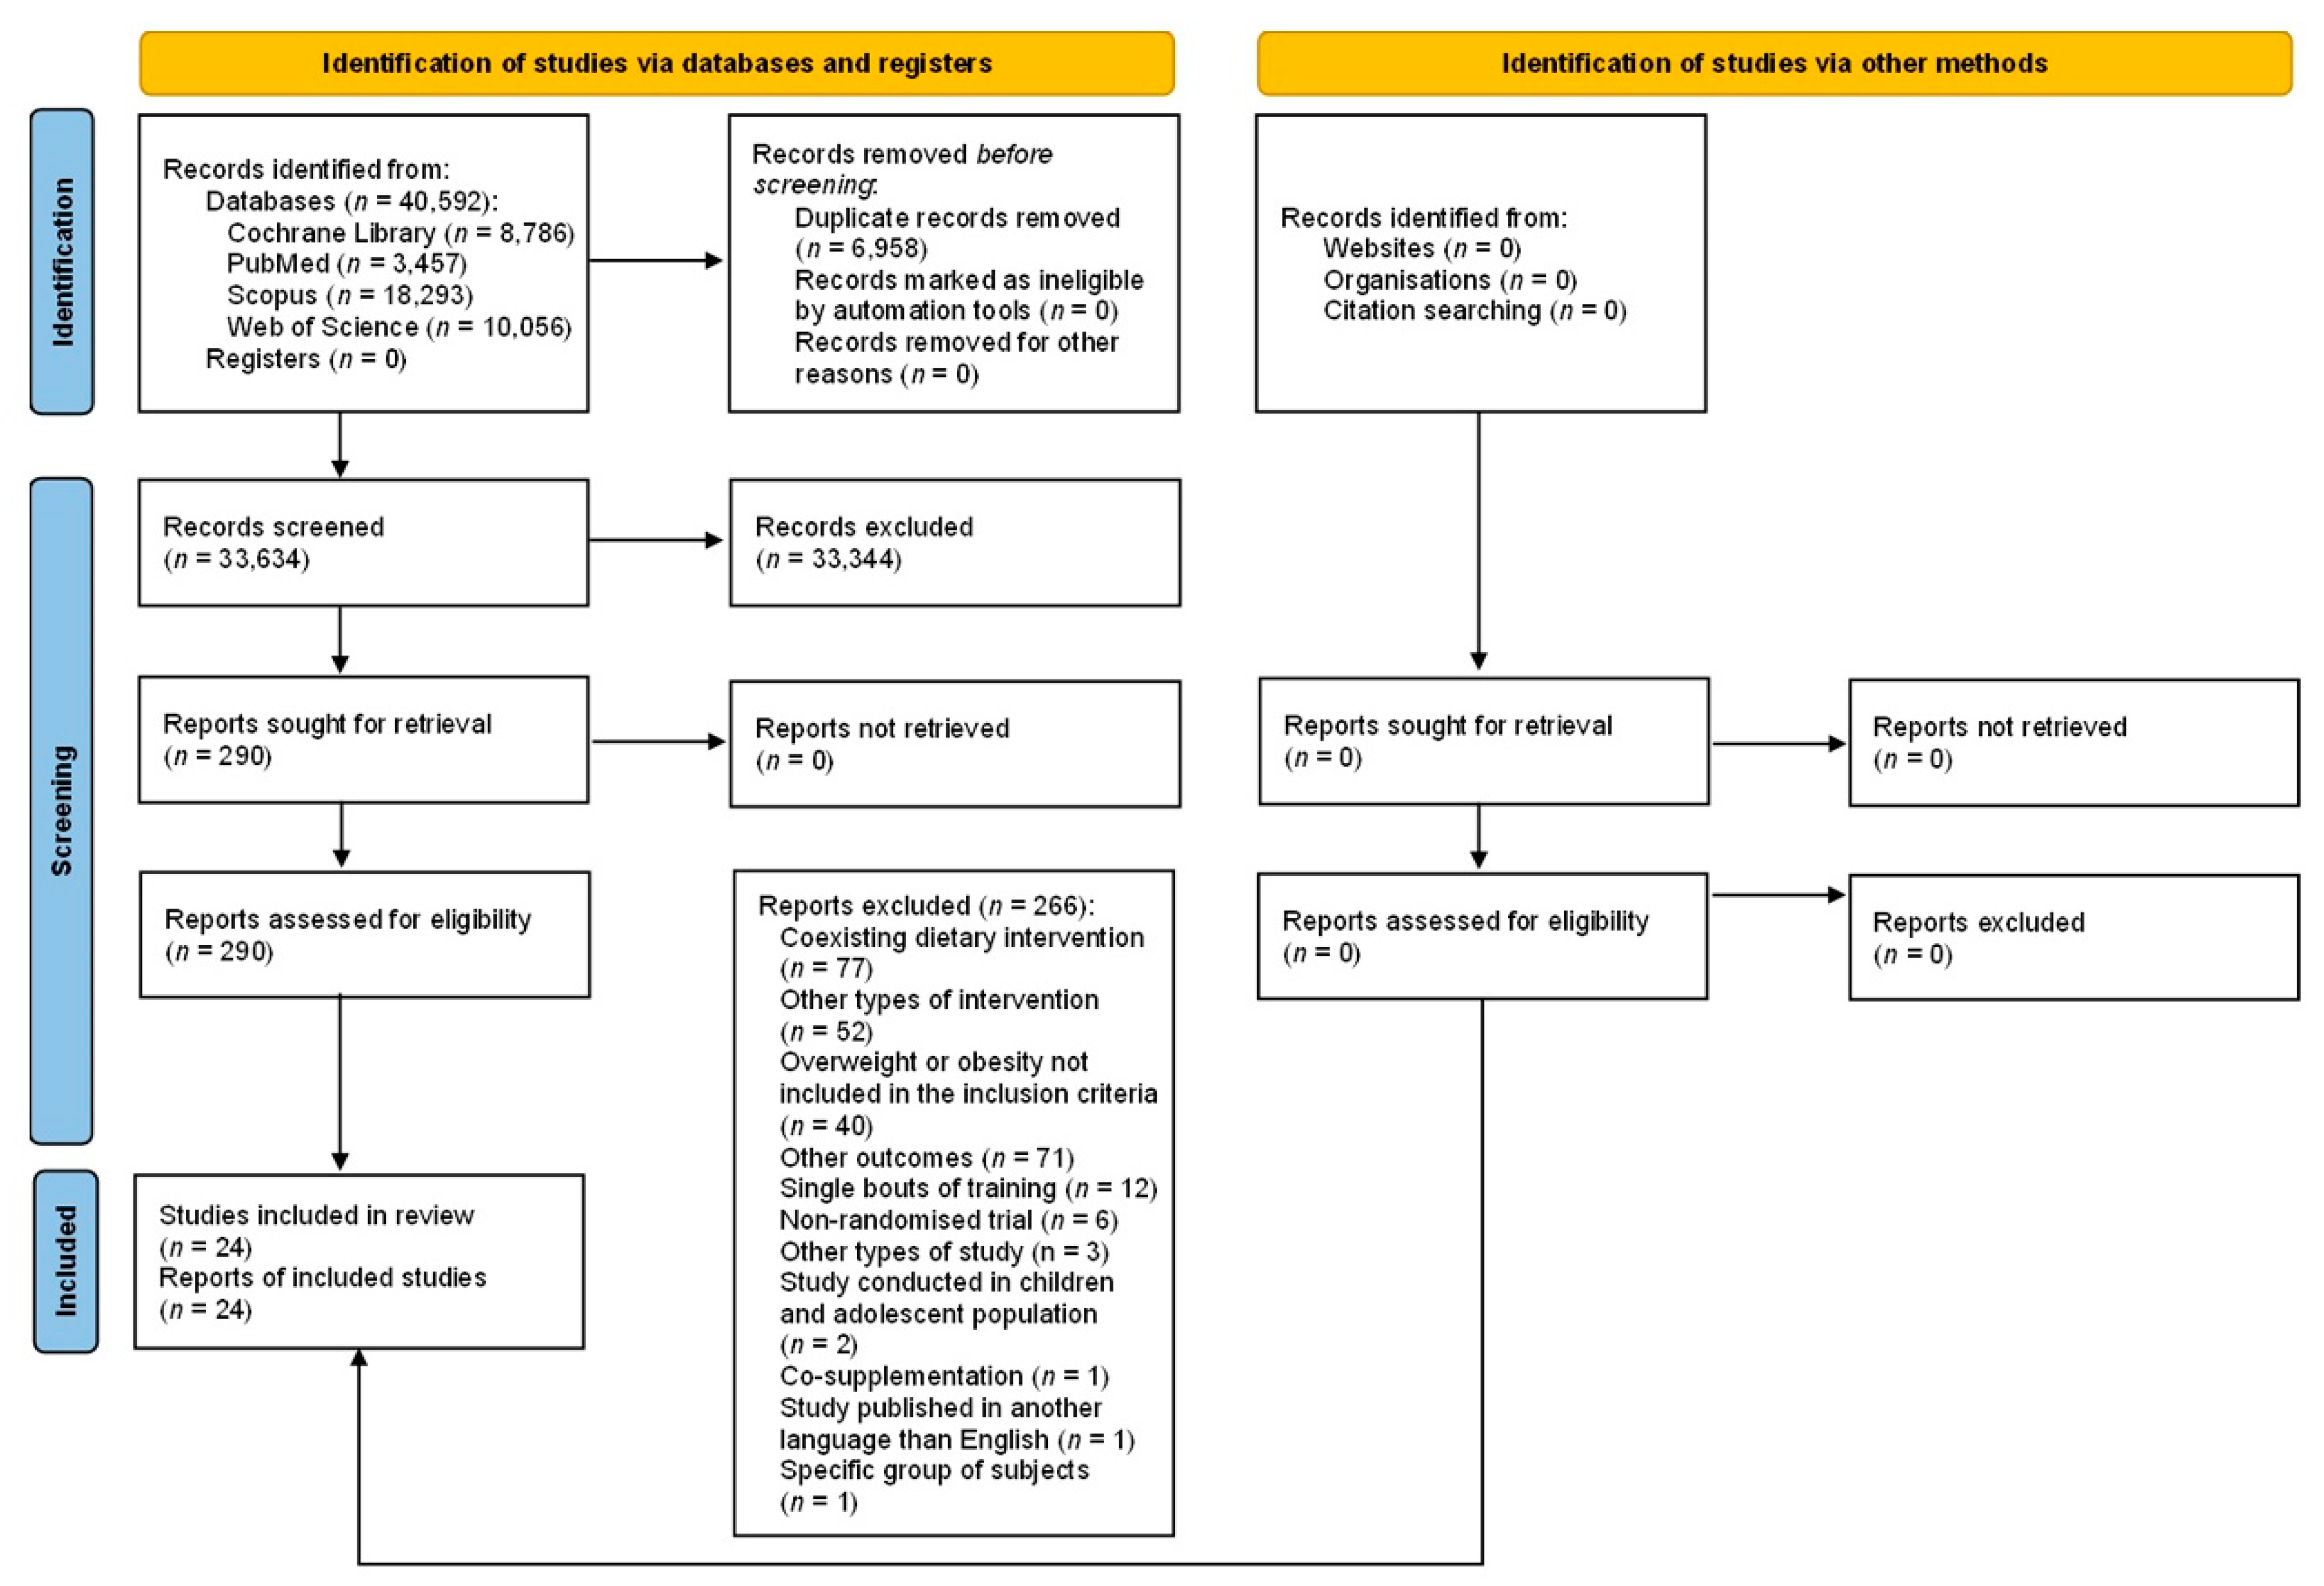
3.1. Search Results
3.2. Characteristics of Included Studies
3.3. Characteristics of Study Participants

| Author | Year | Country (Region) | Groups | n Included | n Completed | Studied Population | Obesity/Overweight Definition | Age [Years] | Sex [% of Women] |
|---|---|---|---|---|---|---|---|---|---|
| Jamka et al. [23] | 2021 | Poland (Europe) | ET CT | 52 49 | 44 41 | Abdominally obese women | BMI ≥ 30 kg/m2 and WC > 80 cm and %FM ≥ 32% | 55 ± 7 1 55 ± 7 1 | 100 |
| Kang et al. [24] | 2020 | South Korea (Asia) | ET ST | 21 20 | 21 20 | Post-menopausal obese women | %FM > 30% | 56.67 ± 5.43 1 52.50 ± 7.65 1 | 100 |
| Mohammad Rahimi et al. [20] | 2020 | Iran (Asia) | ET ST CT CG | 10 11 12 11 | 10 10 10 10 | Sedentary obese men with metabolic syndrome | BMI: 30–40 kg/m2 | 44.8 ± 4.8 1 46.1 ± 5.1 1 44.9 ± 4.2 1 46.4 ± 5.1 1 | 0 |
| Banitalebi et al. [46] | 2019 | Iran (Asia) | ET CT CG | 17 17 18 | 14 14 14 | Overweight or obese women with T2DM | BMI: 25–48 kg/m2 | 55.36 ± 5.94 1 54.14 ± 5.43 1 55.71 ± 6.40 1 | 100 |
| Christensen et al. [21] | 2019 | Denmark (Europe) | ET ST CG | 16 16 18 | 14 13 12 | Inactive subjects with abdominal obesity | WHR ≥ 0.5 and/or WC ≥ 88 cm for women or WC ≥ 102 cm for men | 39 ± 14 1 38 ± 14 1 47 ± 12 1 | 75 |
| Nunes et al. [47] a | 2019 | Brazil (South America) | ET CT | 13 13 | 13 13 | Obese postmenopausal women with no history of physical training practice | %FM > 40% | 62.3 (58.2–66.5) 2 62.9 (57.6–68.2) 2 | 100 |
| Ratajczak et al. [14] | 2019 | Poland (Europe) | ET CT | 22 22 | 22 17 | Women with simple obesity | BMI ≥ 30 kg/m2 and WC > 80 cm and %FM ≥ 33% | 51 ± 8 1 49 ± 10 1 | 100 |
| Martins et al. [48] a | 2018 | Brazil (South America) | ET CT | 14 14 | 8 8 | Overweight women with high risk for TDM2, no exercising for at least 6 months | BMI > 24.9 kg/m2 and %FM > 40% | 64.3 ± 6.7 1 65.0 ± 6.3 1 | 100 |
| Oh et al. [19] | 2017 | Japan (Asia) | ET 3 ET 4 ST | 21 19 20 | 20 13 19 | Obese sedentary men with nonalcoholic fatty liver disease and no exercise habits | %FM > 25% | 48.2 ± 2.3 5 48.6 ± 1.8 5 51.2 ± 1.9 5 | 0 |
| Soori et al. [18] | 2017 | Iran (Asia) | ET ST CT CG | 8 8 8 8 | NI | Postmenopausal sedentary obese women | BMI ≥ 30 kg/m2 | 45–60 6,7 | 100 |
| Shahram et al. [17] | 2016 | Iran (Asia) | ET ST CG | 30 | NI | Sedentary young study women | BMI ≥ 25 kg/m2 | 22.4 ± 1.64 1 22.3 ± 1.41 1 22.77 ± 1.63 1 | 100 |
| Tayebi et al. [37] | 2016 | Iran (Asia) | ET ST CT | 12 12 12 | 11 9 12 | Non-athlete men with obesity | %FM > 25% | 21.48 ± 1.46 1,8 | 0 |
| Nikseresht et al. [38] | 2014 | Iran (Asia) | ET ST CG | 12 12 10 | NI | Sedentary overweight or obese men with no regular exercise with no history of any medical condition | BMI > 25 kg/m2 | 39.6 ± 3.7 1 40.4 ± 5.2 1 38.9 ± 4.1 1 | 0 |
| Donges et al. [16] | 2013 | Australia (Australia) | ET ST CT CG | 13 13 13 8 | 13 13 13 8 | Sedentary overweight middle-aged men | NI | 45.4 ± 1.7 5 51.7 ± 2.1 5 46.2 ± 1.4 5 49.5 ± 2.6 5 | 0 |
| Ho et al. [39] | 2013 | Australia (Australia) | ET ST CT CG | 19 22 20 19 | 15 16 17 16 | Sedentary to lightly active overweight or obese subjects | BMI ≥ 25 and ≤40 kg/m2 | 55 8 (44–62) 6 52 8 (43–59) 6 53 8 (43–64) 6 52 8 (40–66) 6 | 84 |
| Kadoglou et al. [15] | 2013 | Greece (Europe) | ET ST CT CG | 25 25 25 25 | 21 23 22 24 | Overweight or obese subjects with T2DM | BMI ≥ 25 kg/m2 | 58.3 ± 5.4 1 56.1 ± 5.3 1 57.9 ± 6.5 1 57.9 ± 7.2 1 | 72 |
| Venojärvi et al. [40] | 2013 | Finland (Europe) | ET ST CG | 48 49 47 | 39 36 40 | Overweight and obese middle-aged men with impaired glucose tolerance | BMI: 25.1–34.9 kg/m2 | 55 ± 6.2 1 54 ± 6.1 1 54 ± 7.2 1 | 0 |
| Asad et al. [41,42] | 2012 | Iran (Asia) | ET ST CT CG | 12 9 13 10 | 12 9 13 10 | Sedentary healthy male college students | NI | 22 ± 0.89 1 21 ± 1.57 1 21.38 ± 2.6 1 21.44 ± 1.13 1 | 0 |
| Stensvold et al. [43] | 2012 | Norway (Europe) | ET ST CG | 11 11 11 | 11 10 10 | Inactive subjects with metabolic syndrome | BMI ≥ 30 kg/m2 or WC ≥ 80 cm for women or WC ≥ 94 cm for men | 49.9 ± 10.1 1 50.9 ± 7.6 1 47.3 ± 10.2 1 | 23 |
| Sukala et al. [22] | 2012 | New Zealand (Australia) | ET ST | 13 13 | 9 9 | Subjects with T2DM and visceral obesity | WC ≥ 88 cm for women or WC ≥ 102 cm for men | 51 ± 4 1 48 ± 6 1 | 72 |
| Jorge et al. [25] | 2011 | Brazil (South America) | ET ST CT CG | 12 12 12 12 | NI 8 | Overweight or obese subjects with T2DM | BMI: 25–40 kg/m2 | 52.09 ± 8.71 1 54.1 ± 8.94 1 57.90 ± 8.06 1 53.42 ± 9.82 1 | 62 |
| Ahmadizad et al. [44] | 2007 | Iran (Asia) | ET ST CG | 8 8 8 | NI | Sedentary obese healthy men | NI | 41.3 ± 5.1 1 40.9 ± 3.2 1 38.6 ± 3.2 1 | 0 |
| Hara et al. [45] | 2005 | Japan (Asia) | ET CT CG | 7 7 7 | 7 7 7 | Young obese men | BMI > 25 kg/m2 | 19.7 ± 1.3 1 18.4 ± 0.5 1 19.4 ± 1.0 1 | 0 |
3.4. Characteristics of the Study Intervention
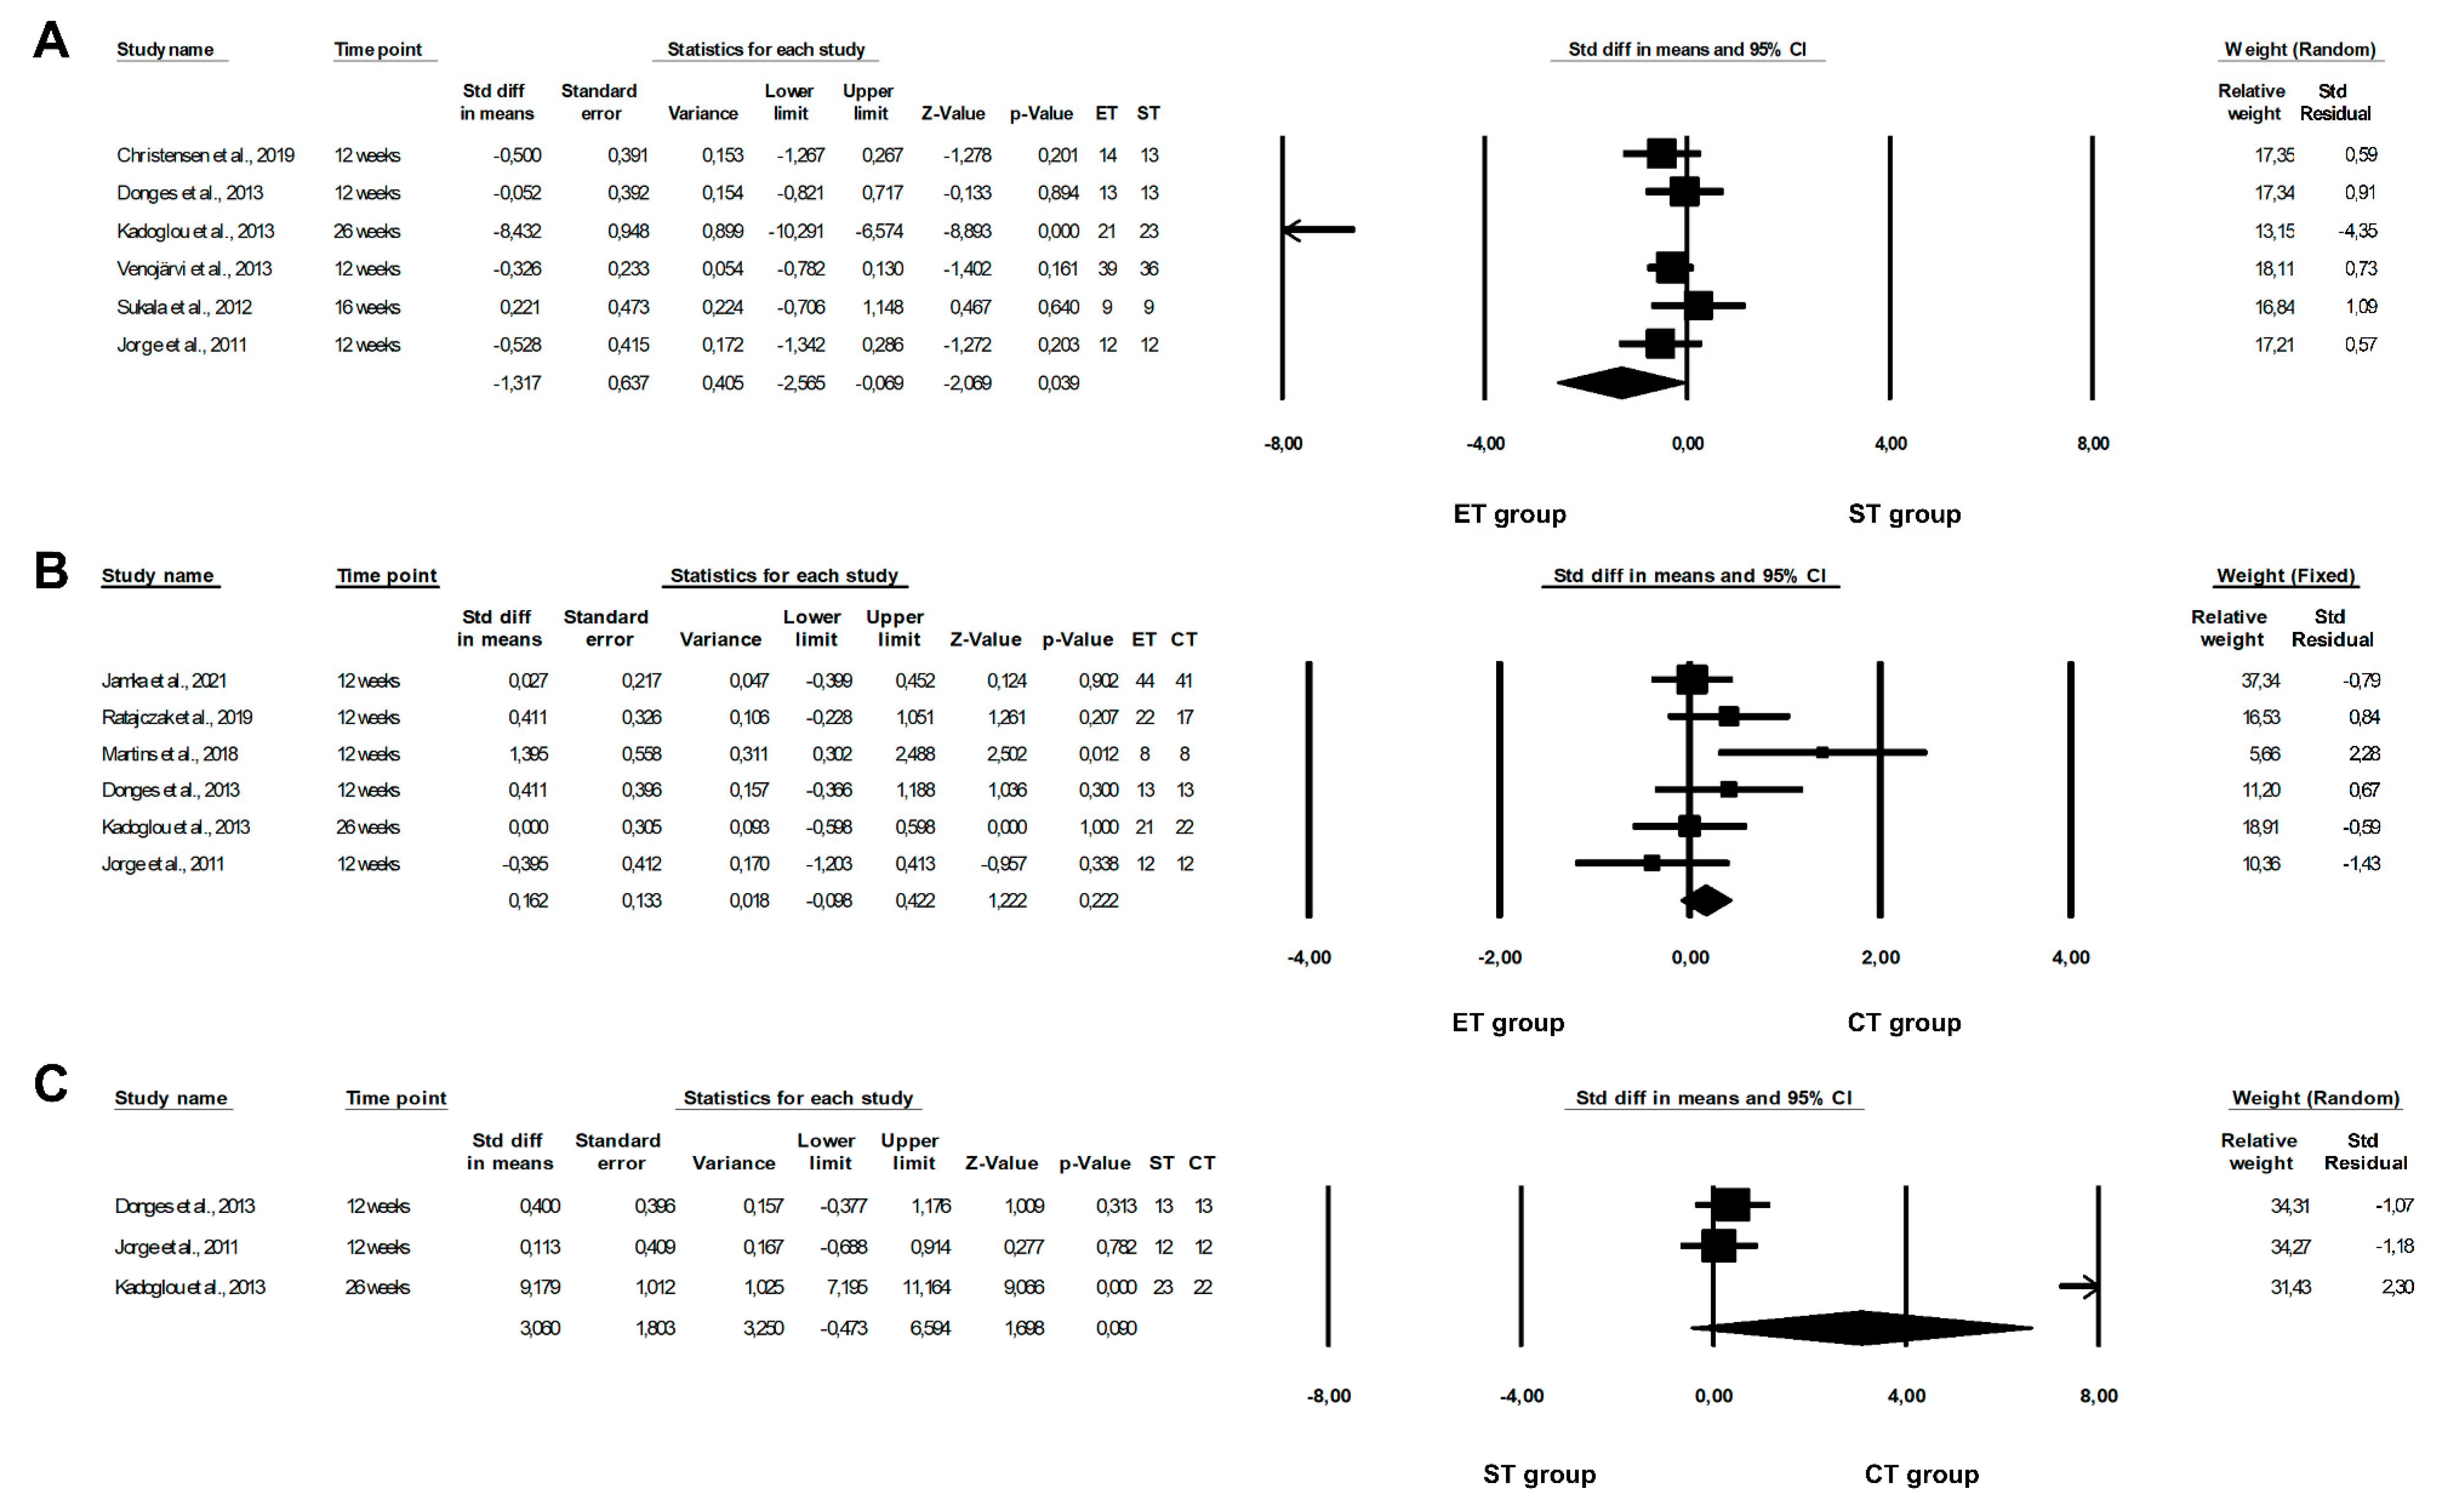
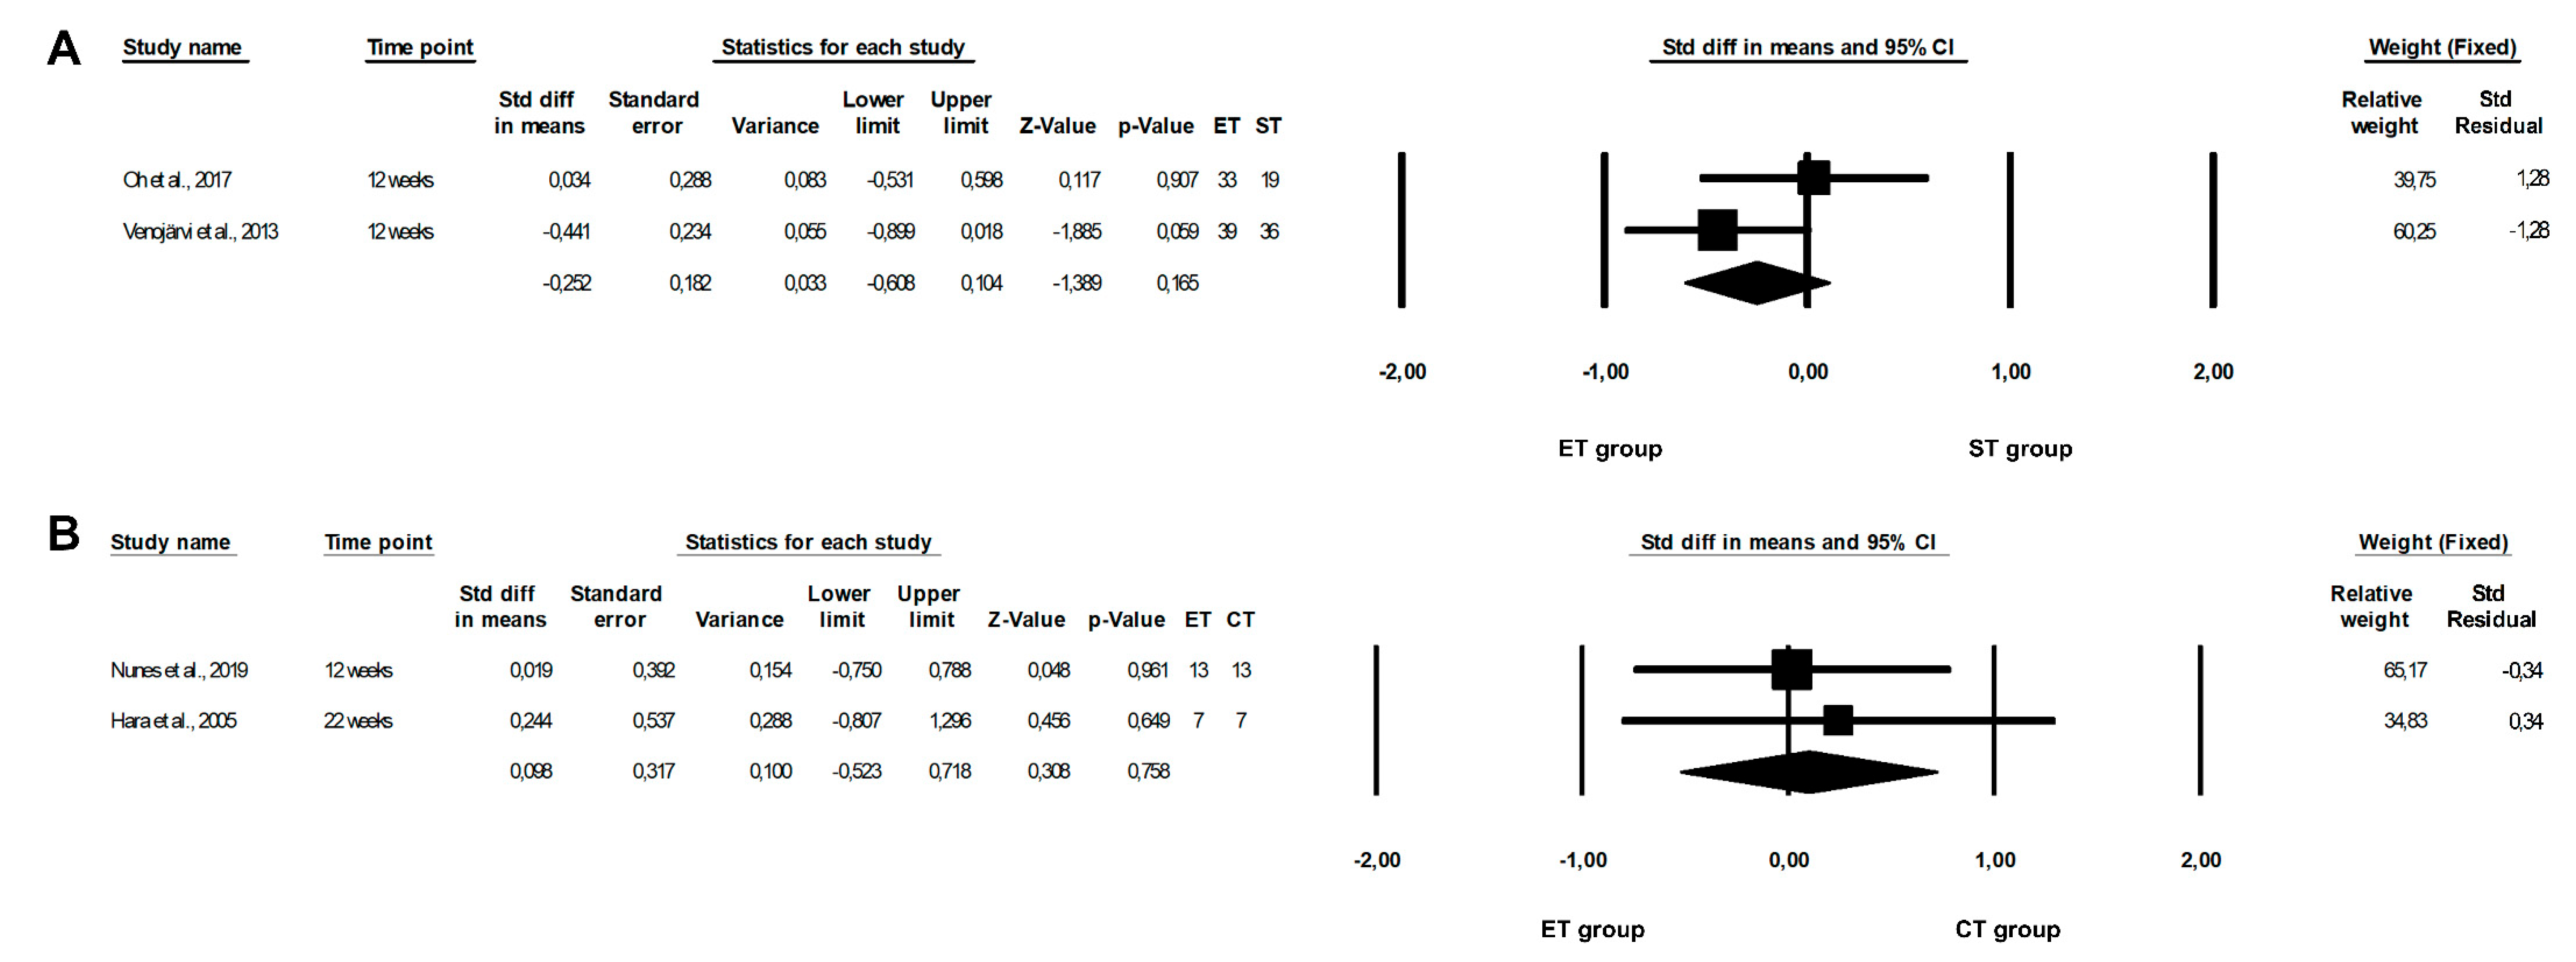
3.5. Effect of Physical Training on CRP Concentrations
| Author | Year | Groups | Characteristic of Groups/Training (Including Volume) | Intensity of Training [%] | Duration of Training [Min] | Frequency of Training [Days per Week] | Time of Intervention [Weeks] | Supervision |
|---|---|---|---|---|---|---|---|---|
| Jamka et al. [23] | 2021 | ET | Cycling on ergometer | 50–70% of HR max | 60 | 3 | 12 | Yes |
| CT | ET: Cycling on ergometer ST: Exercises with a barbell and a gymnastic ball; the goal number of repetitions per set was 16 in barbell curls and 30 in barbell squats; between the series, 10–15 s pauses were taken | ET: 50–70% of HR max ST: 50–60% of 1 RM | ||||||
| Kang et al. [24] | 2020 | ET | Endurance exercise performed on a treadmill | 50–60% of HR reserve | 50 | 3 | 12 | Yes |
| ST | 3 sets of 7 exercises with a 1 min rest between sets and a 1 min rest between the different exercises: squat and lunge for the lower body, chest press and vertical fly for the chest, lat pull-downs and long pulls for the back, and crunches for the abdomen | 55–65% of 1 RM | 60 | |||||
| Mohammad Rahimi et al. [20] | 2020 | ET | 4 × 4 min intervals of walking/running on a treadmill, with 3 min exercise between each interval | 90% of HR peak (intervals) 70% of HR peak (between intervals) | 43 | 3 | 12 | Yes |
| ST | 2–3 sets of 7 weight machine exercises of 8–20 repetitions: lateral pull-down, chest press, seated row, triceps push-down, knee flexion, knee extension, and leg press | 40–80% of 1 RM 1 | 45 | |||||
| CT | Exercises were similar to the practices of the other two groups | ET: 90% of HR peak (intervals) 70% of HR peak (between intervals) ST: 40–80% of 1 RM 1 | ET: 43 ST: 45 | |||||
| CG | The group was advised not to change their physical activity levels throughout the intervention | N/A | N/A | N/A | ||||
| Banitalebi et al. [46] | 2019 | ET | Sprint interval training performed on cycle ergometers at a pedaling rate of 20 rpm | 60–70% of HR max 1 | 50 1 | 3 | 10 | Yes |
| CT | ET: Treadmill or cycle ergometer ST: 1–3 set of 5 exercises of 10–15 repetitions with 10–15 RM 1 and 2–3 min rest between sets 1; training was performed on weight stack machines and included bilateral leg press, lateral pull-down, bench press, bilateral biceps curl, and bilateral triceps push down | ET: 60–70% of HR max 1 ST:NI | ||||||
| CG | Continued their usual medical care and received diabetes recommendations for self-management | N/A | N/A | N/A | ||||
| Christensen et al. [21] | 2019 | ET | High intensive interval exercise performed on an ergometer bicycle | NI | 45 | 3 | 12 | Yes |
| ST | 3–5 sets of 10 exercises | 60–80% of 1 RM 1 | ||||||
| CG | No intervention | N/A | N/A | N/A | ||||
| Nunes et al. [47] a Martins et al. [48] a | 2019 2018 | ET | High-intensity interval bodyweight training; 10 sets of vigorous exercises (30 s of stair climbing and 30 s of body weight squats) interspersed by 60 s of a light walk 2 | >85% of HR max + recovery at 60–70% of HR max | 36 | 3 | 12 | Yes |
| CT | ET: Moderate walking ST: 1–3 sets of 5 strength exercises of 8–12 repetitions 1 with 1.5 min rest intervals between the sets and exercises (half squat, bench press, leg curl, rowing machine, and unilateral leg extension) | ET: 70% of HR max ST: 70% of 1 RM 2 | 68 (including 30 min of ET2) | |||||
| Ratajczak et al. [14] | 2019 | ET | Training on cycle ergometers | 60–80% of HR max | 60 | 3 | 13 | Yes |
| CT | ET: Similar as described for ET ST: Exercises using a neck barbell and gymnastics ball; on Mondays, upper limb exercises were performed with a neck barbell; Wednesdays involved spine-stabilizing exercises, deep muscle-forming exercises, and balance-adjusting exercises with a gymnastic ball; on Fridays, lower limb exercises with a neck barbell were carried out; the number of repetitions was systematically increased with the increase in subject’s muscle strength | ET: 60–80% of HR max ST: 50–60% of 1 RM | 60 (ET: 25 + ST: 20 + warm up: 5 + cool down: 10) | |||||
| Oh et al. [19] | 2017 | ET 3 | 3 sets of 3 min cycling with a 2 min active rest between sets, energy expenditure: 180 kcal | 80–85% of VO2 max (rest at 50% of VO2 max) | 13 | 3 | 12 | Yes |
| ET 4 | Cycling, energy expenditure: 360 kcal | 60–65% of VO2 max | 40 | |||||
| ST | Consisted of sit-ups, leg presses, leg extensions, leg curls, chest presses, seated rows, and pull-down, energy expenditure: 180 kcal | To 60% of 1 RM for lower body exercises 30–60% of 1 RM for upper body exercises | NI | |||||
| Soori et al. [18] | 2017 | ET | Water-based training: swimming or walking in the water | 40–60% of HR max 1 | 45 | 3 | 10 | Yes |
| ST | 3 sets of 6 dynamic exercises with free weights of 10–12 repetitions: bench press, lateral pull-down, rowing, leg press, and hip flexion and extension | 40–60% of 1 RM 1 | ||||||
| CT | ET: Swimming ST: 2 sets of 10–12 repetitions of resistance exercises described in the ST group | ET: 40–60% of HR max ST: 40–60% of 1 RM 1 | 44 (ET: 22 + ST: 22) | |||||
| CG | No intervention | N/A | N/A | N/A | ||||
| Shahram et al. [17] | 2016 | ET | Continues raining, distance:1600–3200 m | 60–75% of target HR | NI | 3 | 12 | NI |
| ST | Circuit weight training in 11 stations and included 4 sets with 12 RM | 50–60% of 1 RM | ||||||
| CG | No intervention | N/A | ||||||
| Tayebi et al. [37] | 2016 | ET | Running program | 65–85% of HR max 1 | 25–40 1 | 3 | 8 | NI |
| ST | 6 sets of 5 exercises of 3–12 repetitions: leg press, knee extension, lat pulldown, biceps curls, and dead lift | 50–80% of 1 RM | NI | |||||
| CT | ET: Similar as described for ET ST: 3 sets of 5 listed in the ST group exercises, 4–12 repetitions | ET: 65–85% of HR max 1 ST: 50–80% of 1 RM | ||||||
| Nikseresht et al. [38] | 2014 | ET | Running on a treadmill; 4 sets of 4 min with 3 min recovery intervals | 80–90% of HR max (recovery intervals at 55–65% of HR max) | 25 5 | 3 | 12 | Yes |
| ST | 1–4 sets of 12 exercises of 2–20 repetitions with 1–7 min of rest period: knee extension, bench press, incline bench press, seated row, dead lift, pulley crunches, lat pull-downs, calf raise, hamstring curl, press behind neck, upright row, and arm curl | 40–95% of 1 RM | 40–65 | |||||
| CG | Continued their normal sedentary life | N/A | N/A | N/A | ||||
| Donges et al. [16] | 2013 | ET | Cycling with elliptical cross training | 75–80% of HR max | 40–60 1 | 3 | 12 | Yes |
| ST | Whole-body training program, including chest and shoulder press, seated rows, lat pulldown, leg press, leg curls, lunges, machine squats, and deadlifts; 3–4 sets × 8–10 of each exercise | 75–80% of 1 RM 1 | NI | |||||
| CT | ET: Similar as described for ET ST: 1.5–2 × 8–10 of each exercise described in the ST group | ET: 75–80% of HR max ST: 75–80% of 1 RM 1 | ET: 20–30 ST:NI | |||||
| CG | No intervention | N/A | N/A | N/A | ||||
| Ho et al. [39] | 2013 | ET | Treadmill walking | 60% of HR reserve ± 10 beats/min | 30 | 5 | 12 | No |
| ST | 4 sets of 5 exercises of 8–12 repetitions at 10 RM of leg press, leg curl, leg extension, bench press, and rear deltoid row | NI | ||||||
| CT | ET: Similar as described for ET ST: 2 sets of 8–12 repetitions at 10 RM of exercises described in the ST group | ET: 60% of HR reserve ± 10 beats/min ST: NI | 30 (ET: 15 + ST: 15) | |||||
| CG | No exercise; subjects were requested to continue their normal physical activity and received a placebo dietary supplement only | N/A | N/A | N/A | ||||
| Kadoglou et al. [15] | 2013 | ET | Walking or running on a treadmill, cycling or calisthenics | 60–75% of HR max | 60 | 4 | 26 | Yes |
| ST | 2–3 sets of 8 types of exercises of 8–10 repetitions: seated leg press, knee extension, knee flexion, chest press, lat pulldown, overhead press, biceps curl, and triceps extension | 60–80% of 1 RM | 60 1,2 | |||||
| CT | CT: combined training as in endurance training group and strength training group with following pattern weekly: 1 session of ET programme; 1 session of ST; and 2 sessions combining the types of exercise of both ET and ST in the same session | ET: 60–75% of HR max ST: 60–80% of 1 RM | 55 1,2 | |||||
| CG | Subjects were encouraged to perform self-controlled, leisure-time physical activity (e.g., walking briskly, cycling outdoors) | Low-to-moderate intensity | 150/week | N/A | ||||
| Venojärvi et al. [40] | 2013 | ET | Nordic walking consisted of warm-up exercises including walking for 5 min and stretching of main muscle groups in addition to walking with poles; after the pole walking, the main muscle groups were stretched for 5 min for cool-down | 55–75% of HR reserve 1 | 60 | 3 | 12 | Yes |
| ST | Started with warm-up exercises including cycling or rowing with ergometer for 5 min and stretching of main muscle groups. After that the main part of programme was performed by using regular strength equipment, and training focus was on strength and power exercises of the lower extremities and trunk; muscles of the upper extremities were also trained. Muscle contractions were performed with maximal or high velocity, and external loads were 50–85% from exercise-specific maximal strength, which was determined by the 5RM; At the end of every session, subjects cooled down by cycling or rowing with the ergometer for 5 min and by stretching the main muscle groups | 50–85% from exercise-specific maximal strength, which was determined by the 5 RM | ||||||
| CG | No intervention | N/A | N/A | N/A | ||||
| Asad et al. [41,42] | 2012 | ET | Running program | 65–85% of HR max 1 | 25–40 1 | 3 | 8 | NI |
| ST | 3 sets of 10–15 repetitions 1 of weight training exercise with machines and free loads; the training program contained upper body training and lower body training, such as: bench press, sitting and standing up with halter, leg extension, leg flexion, and leg press, and rowing | NI | NI | |||||
| CT | Trained the sum of ET and ST groups | ET: 65–85% of HR max 1 ST:NI | ET: 25–40 1 + ST:NI | |||||
| CG | No intervention | N/A | N/A | N/A | ||||
| Stensvold et al. [43] | 2012 | ET | Endurance interval training: treadmill walking or running (self-selected); consisted of 4 intervals of 4 min at and 3 min active recovery period | Intervals: 90–95% of HR peak Recovery period: 70% of HR peak | 43 | 3 | 12 | Yes |
| ST | 3 sets of 8–12 repetitions; consisted of two different programmes including different muscle groups; the following exercises were performed twice weekly (program 1): low row, bench press, and hack lift; the alternative program was performed once each week (program 2): deltoid exercise (lateral raise exercise), triceps pulldown, biceps curl, and low-row and core exercises (plank exercise) | 60–80% of 1 RM 1 | 40–50 6 | |||||
| CT | ET twice a week and ST once a week | ET: 90–95% of HR peak ST: 60–80% of 1 RM 1 | ET: 43 ST: 40–50 6 | |||||
| CG | No intervention | N/A | N/A | N/A | ||||
| Sukala et al. [22] | 2012 | ET | Exercises on a cycle ergometer | 65–85% of HR reserve 1 | 40–60 1 | 3 | 16 | Yes |
| ST | 2–3 sets of 8 exercises of 6–8 repetition with 1 min rest between sets and exercises; exercises were performed using machine weights targeting all the major muscle groups of the body and included: seated leg press, knee extension, knee flexion, chest press, lat pulldown, overhead press, biceps curl, and triceps extension | NI | ||||||
| Jorge et al. [25] | 2011 | ET | Cycling.programme | HR corresponding to the lactate threshold | 60 | 3 | 12 | Yes |
| ST | Focused on the large muscle groups and consisted of a 7-exercise circuit as follows: leg press, bench press, lat pull down, seated rowing, shoulder press, abdominal curls, and knee curls | NI | ||||||
| CT | Consisted of ST interchanged with ET performed at the same intensity and half the volume of the ET and ST groups | ET: HR corresponding to the lactate threshold ST:NI | ||||||
| CG | Light stretching exercises | N/A | N/A | |||||
| Ahmadizad et al. [44] | 2007 | ET | Continuous running | 75–85% of HR max | 20–30 1 | 3 | 12 | Yes |
| ST | 4 sets of circuit weight training for 11 stations; the maximum numbers of repetitions in each station was 12; exercises involving the upper and lower body | 50–60% of 1 RM | 50–60 | |||||
| CG | No intervention | N/A | N/A | N/A | ||||
| Hara et al. [45] | 2005 | ET | Training on treadmills and cycle ergometers | 40.8–54.8% of VO2 max | 30–45 | 3 | 8 | NI |
| CT | ET: Similar as described for ET ST: Included the following types of exercise: arm curl, triceps extension, and shoulder press for upper-limb training; squat, leg press, leg curl, leg extension, and calf raise for lower-limb training; and bench press, seated butterfly, lat pull-down, trunk curl, back extension, and dead lift for trunk training. Participants selected 2 types each from the upper and lower limb training options, and 3 from trunk training choices, and thus performed 7 exercises in each training session; 3 sets for each exercise consisting of 10 repetitions | ET: 40.8–54.8% of VO2 max ST: 80% of 1 RM | 80–90 (ET: 30 + ST: 50–60) | ET: 3 + ST: 2–3 | 22 | |||
| CG | No intervention | N/A | N/A | N/A | NI |
| Author | Year | Group | CRP [mg/L] | IL-6 [pg/mL] | TNF-α [pg/mL] | ||||||
|---|---|---|---|---|---|---|---|---|---|---|---|
| Pre | Post | Changes | Pre | Post | Changes | Pre | Post | Changes | |||
| Jamka et al. [23] | 2021 | ET | 3.87 ± 3.76 2 | 4.34 ± 4.63 2 | 0.47 ± 2.86 2 | 2.19 ± 1.54 2 | 2.34 ± 1.60 2 | 0.16 ± 1.79 2 | 40 ± 52 2 | 36 ± 48 2 | −3 ± 12 2 |
| CT | 3.95 ± 3.85 2 | 4.22 ± 4.29 2 | 0.27 ± 2.99 2 | 1.78 ± 0.91 2 | 2.16 ± 1.14 2 | 0.39 ± 1.11 2 | 38 ± 49 2 | 40 ± 51 2 | 2 ± 16 2 | ||
| p 1 | CT: p = 0.03 (pre vs.post) | ET: p = 0.003 (pre vs. post) | |||||||||
| Kang et al. [24] | 2020 | ET | NI | NI | 20.11 ± 2.6 2,3 | 22.34 ± 3.2 2,3,4 24.57 ± 4.1 2,3,5 | NI | NI | NI | NI | |
| ST | 22.15 ± 5.4 2,3 | 24.2 ± 6.9 2,3,4 27.37 ± 5.6 2,3,5 | |||||||||
| p 1 | ET: p < 0.01, ST: p < 0.05 (pre vs. middle) ET, ST: p < 0.001 (pre vs. post) ET, ST: p < 0.01 (middle vs. post) | ||||||||||
| Banitalebi et al. [46] | 2019 | ET | NI | NI | NI | 1.89 ± 0.95 2 | 1.21 ± 1.11 2 | −0.67 | NI | NI | NI |
| CT | 2.03 ± 1.08 2 | 1.50 ± 1.32 2 | −0.52 | ||||||||
| CG | 2.12 ± 1.24 2 | 1.88 ± 2.01 2 | −0.23 | ||||||||
| p 1 | p = 0.002 (time) p = 0.009 (group × time) | ||||||||||
| Christensen et al. [21] | 2019 | ET | NI | 33.6 (1.05–66.15) 6 | 0.0 (−32.55–32.55) 6 3 (−76–83)% 6,7 | NI | 0.7 (0.4–1.1) 6 | 0.0 (−0.4–0.3) 6 −2 (−52–49)% 6,7 | NI | 2.4 (2.0–2.8) 6 | 0.1 (−0.3–0.5) 6 5.8 (−6.5–18.1)% 6,7 |
| ST | 61.95 (28.35–96.6) 6 | 28.35 (−5.25–63) 6 64 (−19–147)% 6,7 | 1.1 (0.7–1.5) 6 | 0.4 (0.0–0.8) 6 70 (16–124)% 6,7 | 2.5 (2.0–2.9) 6 | 0.2 (−0.3–0.6) 6 7.7 (−5.1–20.6)% 6,7 | |||||
| CG | 32.55 (−4.2–69.3) 6 | −1.05 (−37.8–35.7) 6 8 (−82–98)% 6,7 | 0.8 (0.4–1.2) 6 | 0.1 (−0.3–0.5) 6 30 (−26–87)% 6,7 | 2.4 (1.9–2.9) 6 | 0.1 (−0.4–0.6) 6 4.8 (−9.2–18.9)% 6,7 | |||||
| Nunes et al. [47] a | 2019 | ET | NI | NI | NI | 1.4 (0.7–2.0) 8 | 2.6 (1.4–3.9) 8 | 1.2 (0.4–2.1) 8 85.7 (28.6–149.9)% 7,8,9 | NI | NI | NI |
| CT | 1.8 (0.6–3.1) 8 | 1.7 (1.0–2.4) 8 | −0.1 (−1.1–0.9) 8 −5.6 (−61.1–50.4)% 7,8,9 | ||||||||
| p 1 | p = 0.037 (time × group) | ||||||||||
| Ratajczak et al. [14] | 2019 | ET | 4.18 ± 2.50 2 | 3.45 ± 2.50 2 | NI | NI | NI | NI | NI | NI | NI |
| CT | 3.49 ± 3.20 2 | 2.52 ± 1.90 2 | |||||||||
| p 1 | CT: p < 0.05 (pre vs. post) | ||||||||||
| Martins et al. [48] a | 2018 | ET | 0.5 ± 0.5 2 | 0.7 ± 0.6 2 | 40.0% 7,9 | 1.4 ± 1.1 2 | 2.6 ± 2.2 2 | 85.7% 7,9 | NI | NI | NI |
| CT | 0.1 ± 0.1 2 | 0.1 ± 0.1 2 | 0% 7,9 | 1.3 ± 1.8 2 | 1.2 ± 1.1 2 | −7.7% 7,9 | |||||
| Oh et al. [19] | 2017 | ET 10 | NI | NI | NI | NI | NI | −0.35 | NI | NI | −0.068 12 |
| ET 11 | 1.06 | 0.003 12 | |||||||||
| ST | 0.63 | 0.092 12 | |||||||||
| Shahram et al. [17] | 2016 | ET | NI | NI | NI | 7.16 ± 0.15 2 | 2.71 ± 0.14 2 | NI | 12.31 ± 0.23 2 | 9.16 ± 0.19 2 | NI |
| ST | 7.10 ± 0.21 2 | 2.84 ± 0.34 2 | 12.25 ± 0.27 2 | 9.21 ± 0.24 2 | |||||||
| CG | 7.19 ± 0.15 2 | 7.26 ± 0.13 2 | 12.80 ± 0.24 2 | 12.06 ± 0.25 2 | |||||||
| p 1 | p < 0.05 (pre vs. post) | p < 0.05 (pre vs. post) | |||||||||
| Nikseresht et al. [38] | 2014 | ET | NI | NI | NI | NI | NI | NI | 2.99 ± 0.64 2 | 2.60 ± 0.54 2 | −11.9% 7 |
| ST | 3.00 ± 0.46 2 | 2.66 ± 0.53 2 | −10.7% 7 | ||||||||
| CG | 2.90 ± 0.74 2 | 2.96 ± 0.64 2 | NI | ||||||||
| p 1 | ET: p = 0.01 (pre vs. post, changes) ST: p = 0.04 (pre vs. post, changes) p = 0.025 (time) | ||||||||||
| Donges et al. [16] | 2013 | ET | 2.25 ± 0.37 13 | 2.33 ± 0.21 13 | 3 ± 13% 7,13 | 1.94 ± 0.31 13 | 1.28 ± 0.26 13 | –34 ± 11% 7,13 | 4.42 ± 0.33 13 | 3.29 ± 0.29 13 | −26 ± 10% 7,13 |
| ST | 2.21 ± 0.30 13 | 2.38 ± 0.31 13 | 8 ± 9% 7,13 | 2.74 ± 0.69 13 | 1.84 ± 0.53 13 | –33 ± 18% 7,13 | 7.14 ± 0.43 13 | 6.23 ± 0.32 13 | −12 ± 5% 7,13 | ||
| CT | 1.88 ± 0.27 13 | 1.91 ± 0.34 13 | 1 ± 14% 7,13 | 2.35 ± 0.31 13 | 1.91 ± 0.26 13 | –19 ± 6% 7,13 | 5.21 ± 0.66 13 | 4.39 ± 0.41 13 | −16 ± 10% 7,13 | ||
| CG | 1.60 ± 0.09 13 | 1.89 ± 0.32 13 | 18 ± 19% 7,13 | 1.93 ± 0.60 13 | 1.88 ± 0.94 13 | –3 ± 19% 7,13 | 6.11 ± 0.25 13 | 6.19 ± 0.33 13 | 1 ± 7% 7,13 | ||
| p 1 | ET, ST, CT: p < 0.05 (pre vs. post) | ET, ST, CT: p < 0.05 (pre vs. post) ET vs. ST, CG: p < 0.05 (pre, post-hoc) | |||||||||
| Ho et al. [39] | 2013 | ET | NI | NI | NI | 2.5 (0.0–8.5) 14 | NI | NI | 14.6 (8.1–23.3) 14 | NI | −20.8% 7 |
| ST | 2.3 (0.0–7.4) 14 | 12.0 (6.4–20.0) 14 | −26.9% 7 | ||||||||
| CT | 2.3 (0.0–12.4) 14 | 12.6 (4.3–25.8) 14 | −32.6% 7 | ||||||||
| CG | 3.0 (0.0–13.1) 14 | 10.2 (4.9–17.0) 14 | NI | ||||||||
| p 1 | ET: p = 0.011, ST: p = 0.0001, CT: p = 0.003 (pre vs. post) CT vs. CG: p = 0.025 15 (changes, post-hoc) | ||||||||||
| Kadoglou et al. [15] | 2013 | ET | 0.15 ± 0.04 2,16 | NI | −0.05 ± 0.01 2,16 −33.3 ± 6.7% 7,9,2 | NI | NI | NI | NI | NI | NI |
| ST | 0.15 ± 0.03 2,16 | 0.011 ± 0.003 2,16 7.3 ± 2% 2,7 | |||||||||
| CT | 0.14 ± 0.05 2,16 | −0.05 ± 0.009 2,16 −35.7 ± 6.4% 2,7,9 | |||||||||
| CG | 0.15 ± 0.04 2,16 | 0.01 ± 0.02 2,16 6.7 ± 13.3% 2,7,9 | |||||||||
| p 1 | p < 0.001 (changes) ET, CT: p < 0.05 (pre vs. post) CT, ET vs. ST; ET vs. CG: p < 0.001, CT vs. CG: p = 0.003 (change, post-hoc) | ||||||||||
| Venojärvi et al. [40] | 2013 | ET | 2.2 ± 0.4 13,16 | NI | −0.5 ± 0.4 13,16 | 11.5 ± 3.3 13 | NI | −0.4 ± 0.9 13 | 5.6 ± 0.4 13 | NI | −0.2 ± 0.3 13 |
| ST | 1.6 ± 0.3 13,16 | 0.3 ± 0.4 13,16 | 7.6 ± 2.3 13 | 0.3 ± 0.5 13 | 5.5 ± 0.8 13 | −0.2 ± 0.4 13 | |||||
| CG | 1.4 ± 0.2 13,16 | −0.1 ± 0.3 13,16 | 4.0 ± 1.1 13 | 0.7 ± 0.8 13 | 4.6 ± 0.3 13 | 0.5 ± 0.2 13 | |||||
| p 1 | p = 0.050 (change) | p = 0.016 (pre) CG vs. ET: p = 0.015 17 (pre, post-hoc) | |||||||||
| Stensvold et al. [43] | 2012 | ET | NI | NI | −0.10 (1.15–−4.71) 3,18 | NI | NI | 0.2 (−3.5–0.8) 3,18 | NI | NI | −0.13 (0.53–(−1.16)) 18 |
| ST | 0.37 (2.38–(−1.72)) 3,18 | 0.3 (−5.4–7.2) 3,18 | 3.9 ± 0.8 2 | 4.3 ± 0.9 2 | 0.40 (1.04–(−0.15)) 18 | ||||||
| CG | 0.59 (1.43–(−4.51)) 3,18 | 0.1 (−0.3–0.8) 3,18 | NI | NI | 0.49 (1.09–(−0.99)) 18 | ||||||
| p 1 | ST: p = 0.014 (pre vs. post) ET vs. ST: p = 0.032, ET vs. CG: p = 0.039 (post, post-hoc) | ||||||||||
| Sukala et al. [22] | 2012 | ET | 0.8 ± 0.4 2,12 | 0.6 ± 0.4 2,12 | −0.2 ± 0.4 2,12 | NI | NI | NI | NI | NI | NI |
| ST | 0.6 ± 0.5 2,12 | 0.5 ± 0.5 2,12 | −0.2 ± 0.5 2,12 | ||||||||
| Jorge et al. [25] | 2011 | ET | 14.35 ± 4.51 2,16 | 12.95 ± 3.41 2,16 | NI | 21.15 ± 1.44 2 | 21.06 ± 1.36 2 | NI | 2.38 ± 1.31 2 | 2.46 ± 1.26 2 | NI |
| ST | 16.55 ± 2.55 2,16 | 14.39 ± 1.80 2,16 | 21.39 ± 2.60 2 | 26.11 ± 18.43 2 | 2.91 ± 2.44 2 | 4.76 ± 5.18 2 | |||||
| CT | 15.64 ± 3.86 2,16 | 14.14 ± 2.56 2,16 | 20.93 ± 0.86 2 | 20.23 ± 0.83 2 | 3.47 ± 1.40 2 | 3.10 ± 1.08 2 | |||||
| CG | 15.05 ± 4.22 2,16 | 12.24 ± 4.31 2,16 | 23.69 ± 9.81 2 | 21.29 ± 0.91 2 | 2.29 ± 0.46 2 | 2.74 ± 1.10 2 | |||||
| p 1 | p < 0.05 (pre vs. post) | ||||||||||
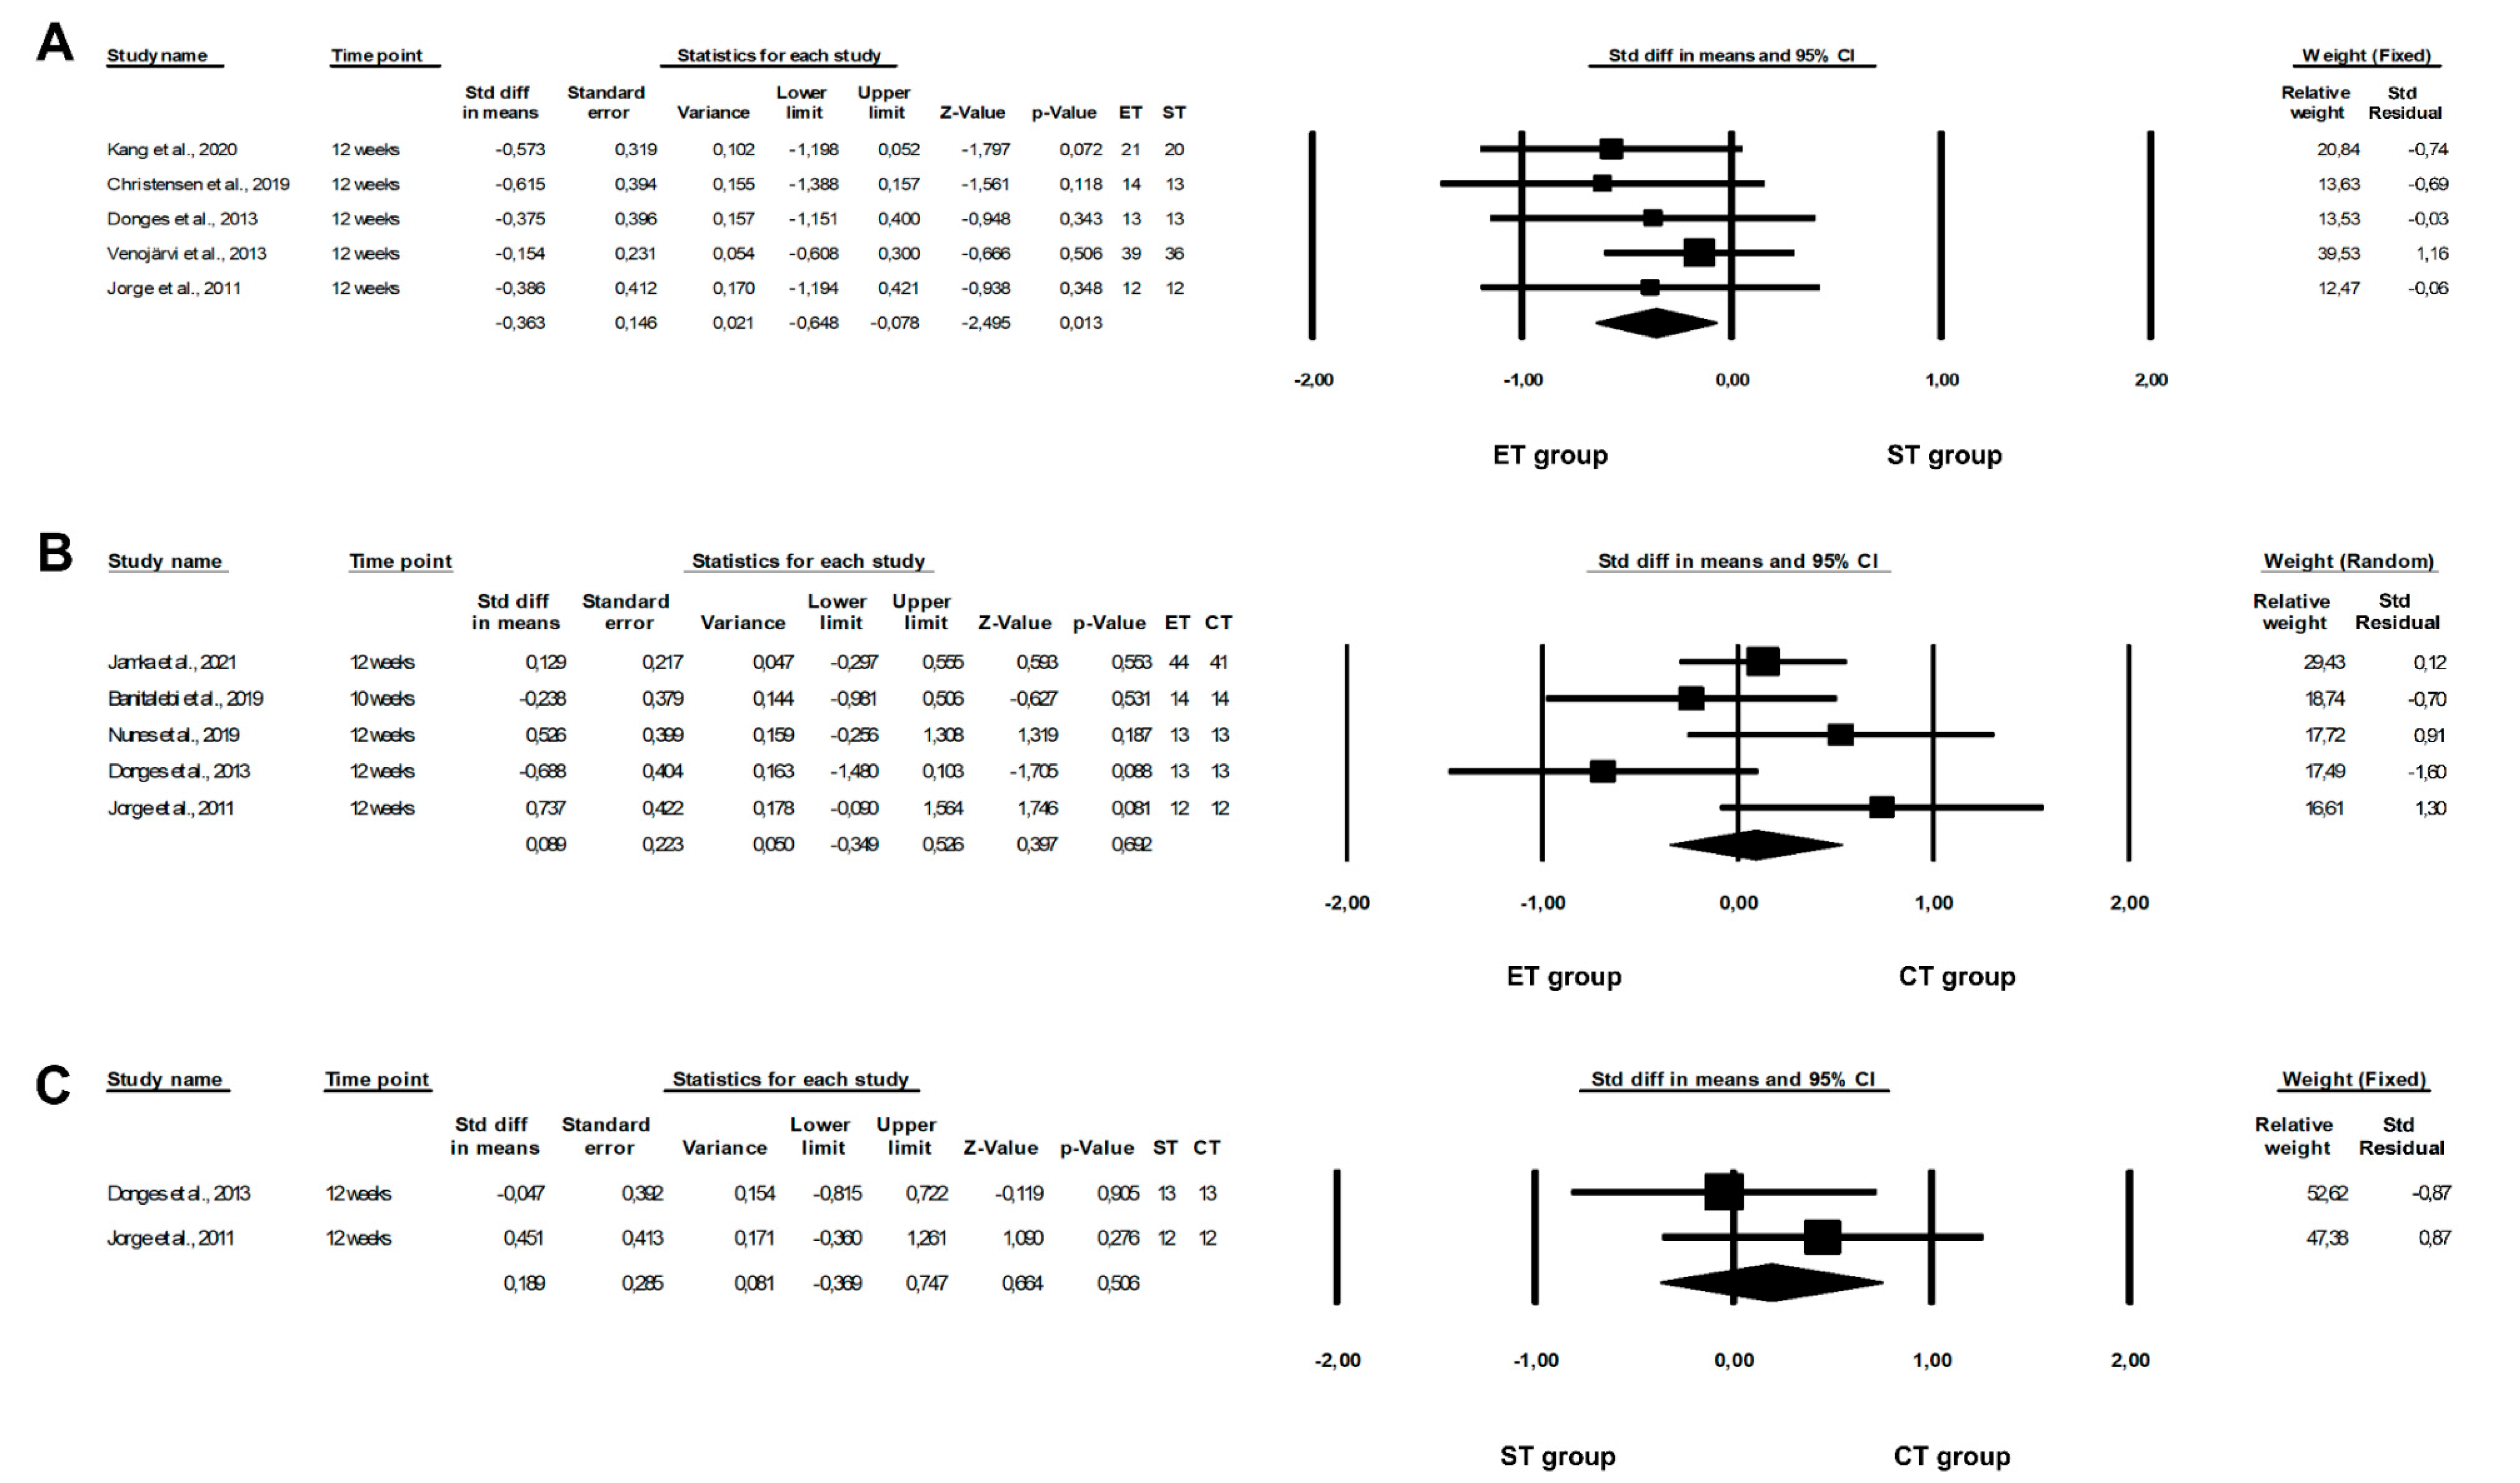
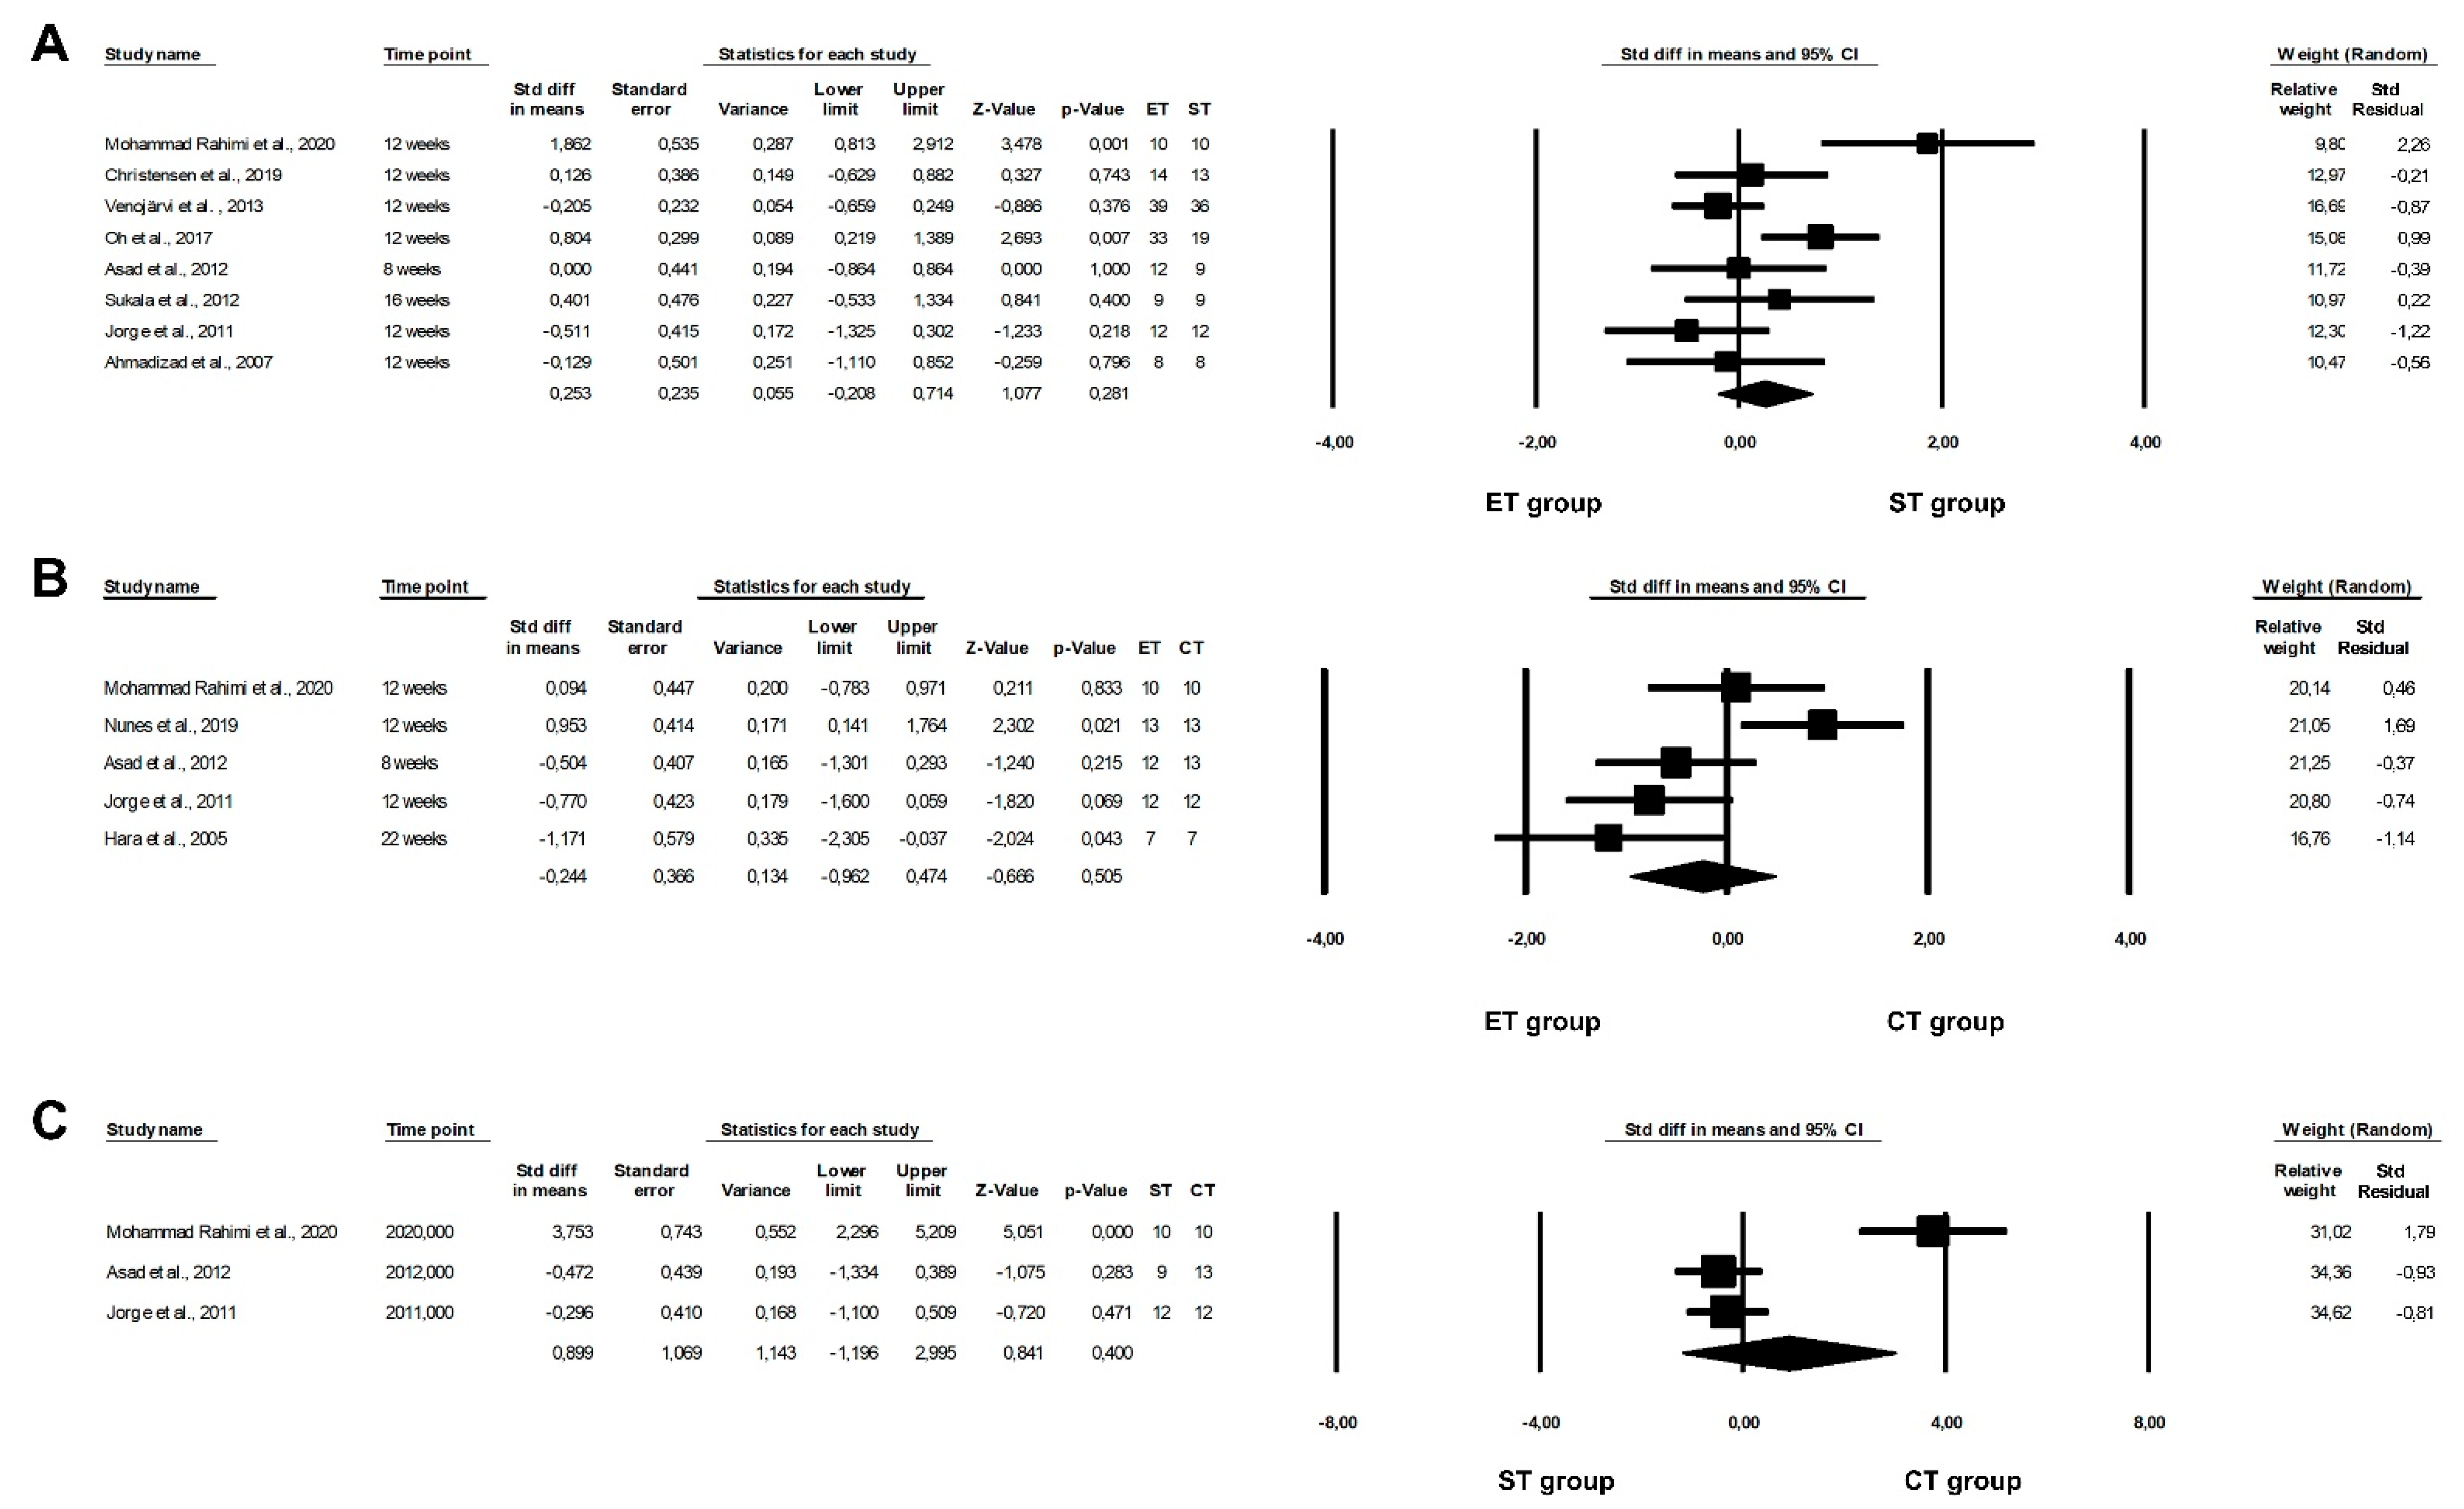
3.6. Effect of Physical Training on IL-6 Concentrations
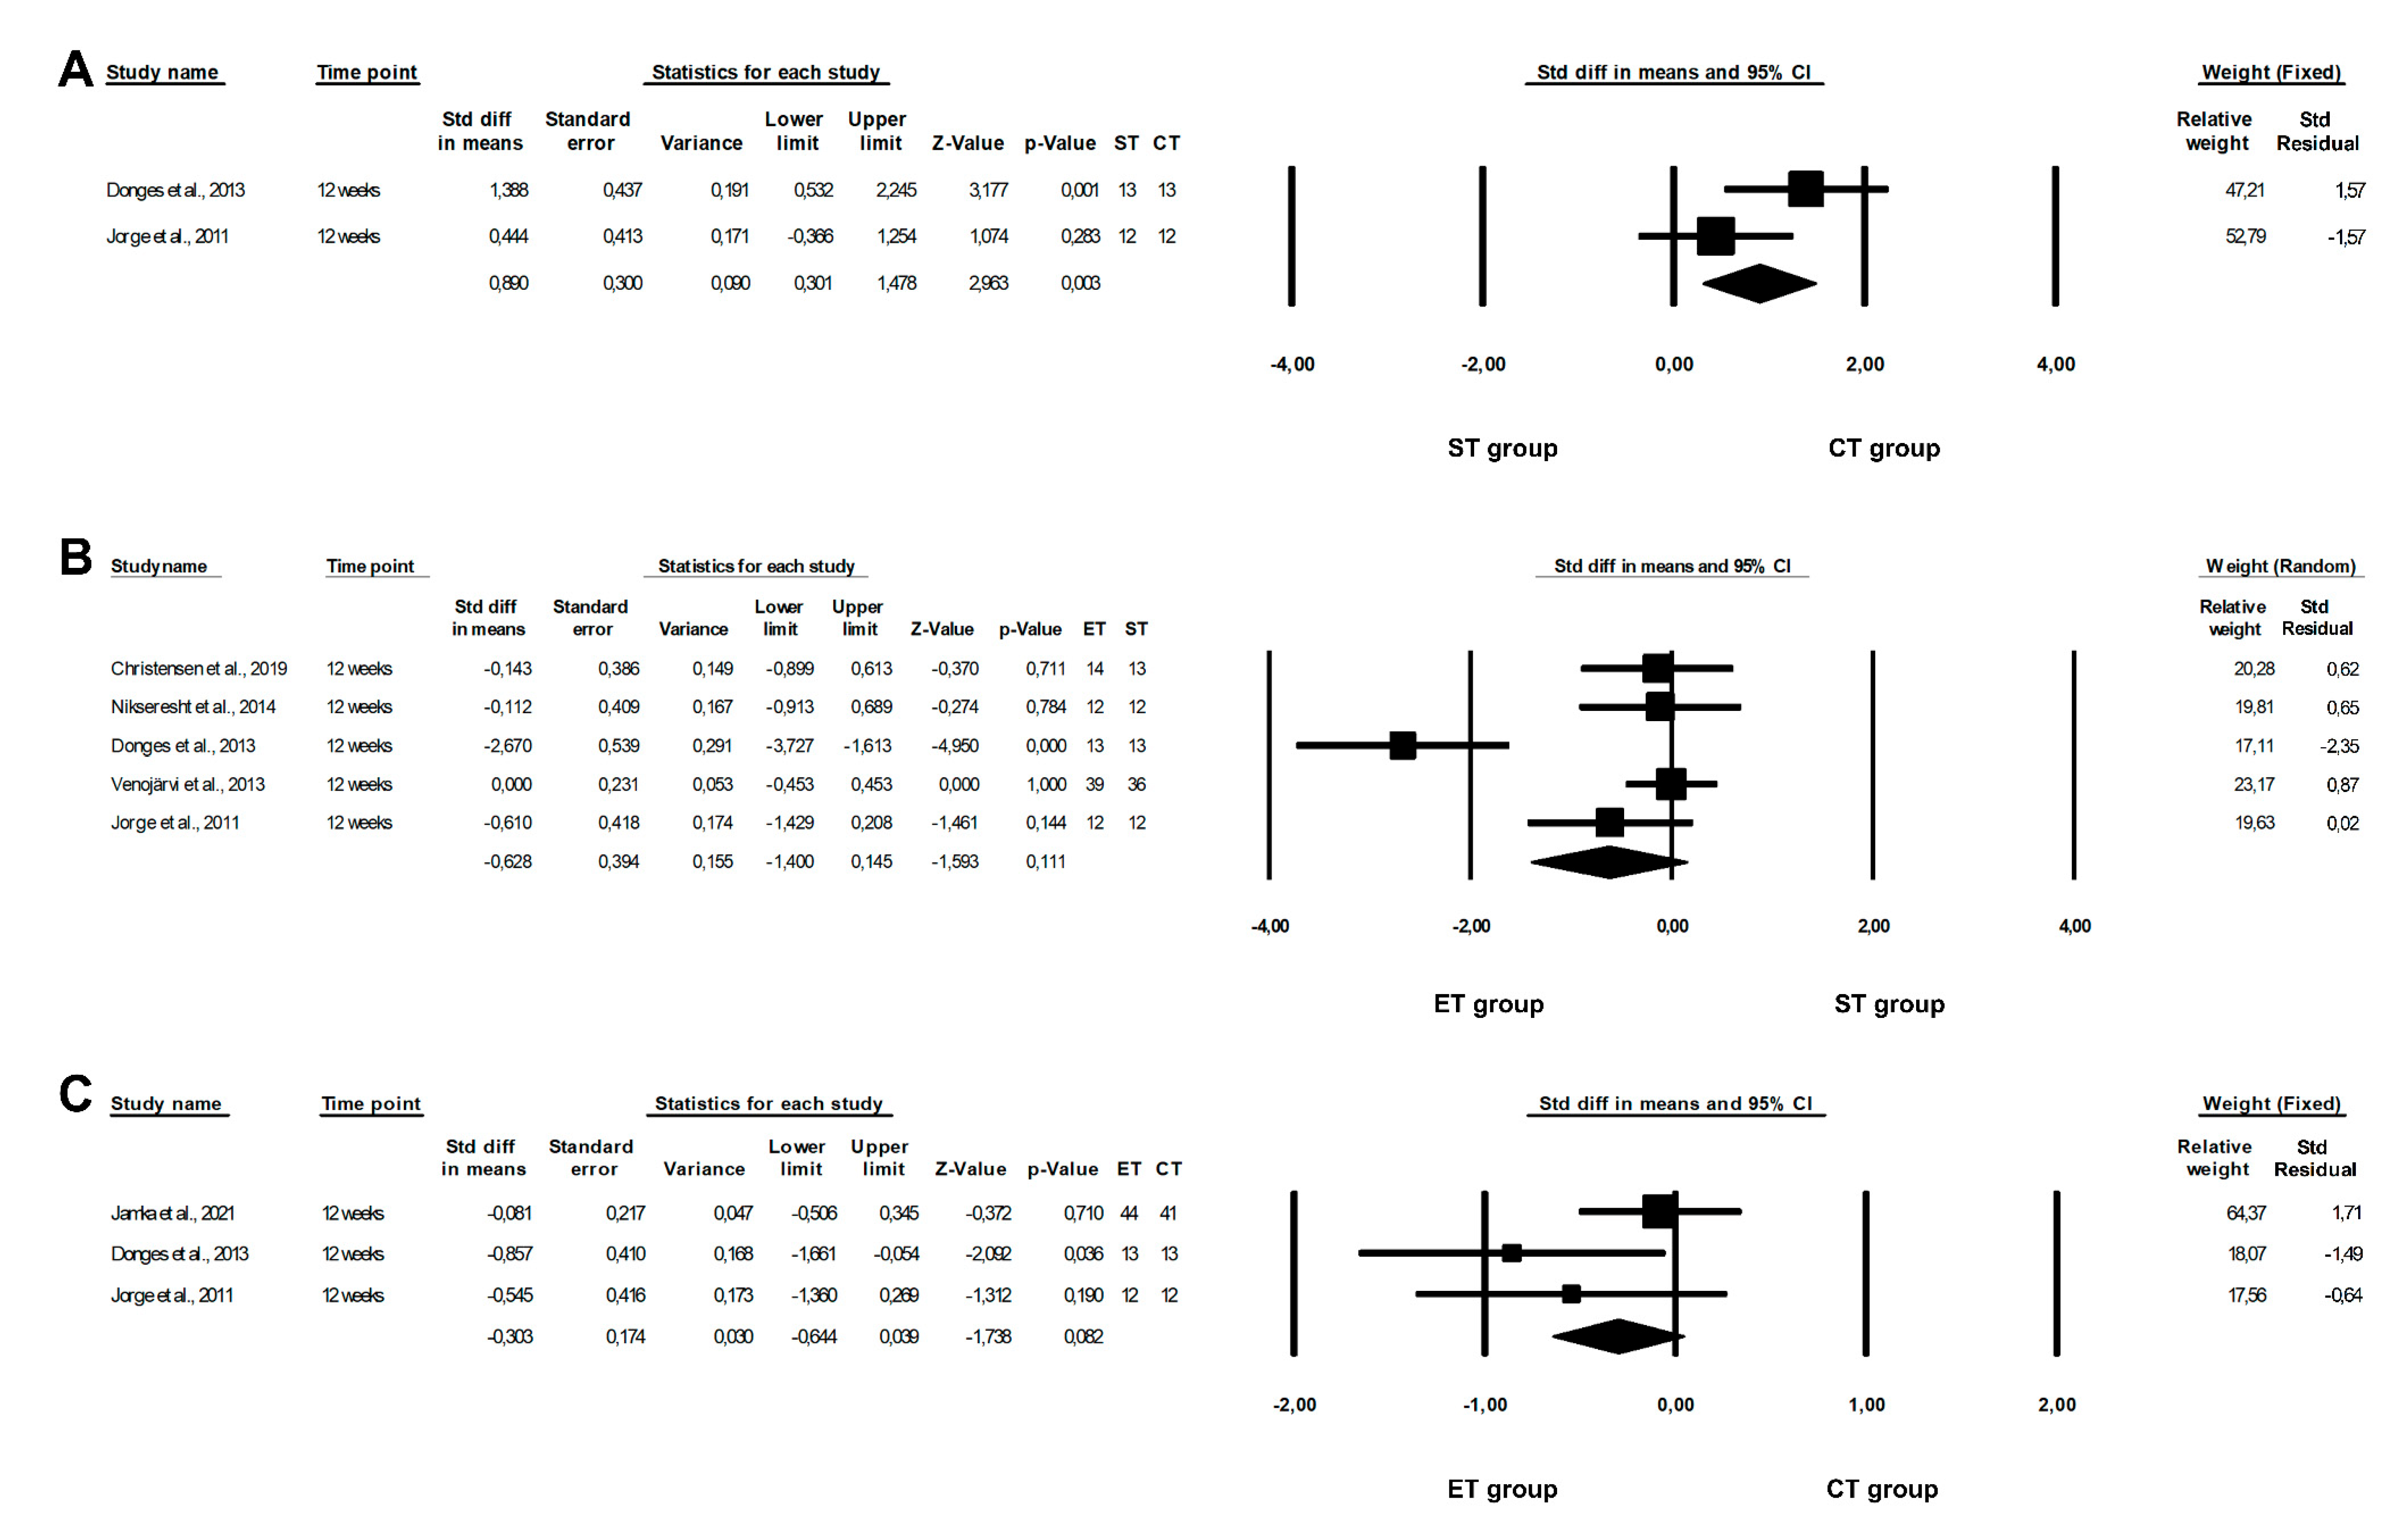
3.7. Effect of Physical Training on TNF-α Concentrations


3.8. Effect of Physical Training on Leptin Levels
3.9. Effect of Physical Training on Adiponectin Levels
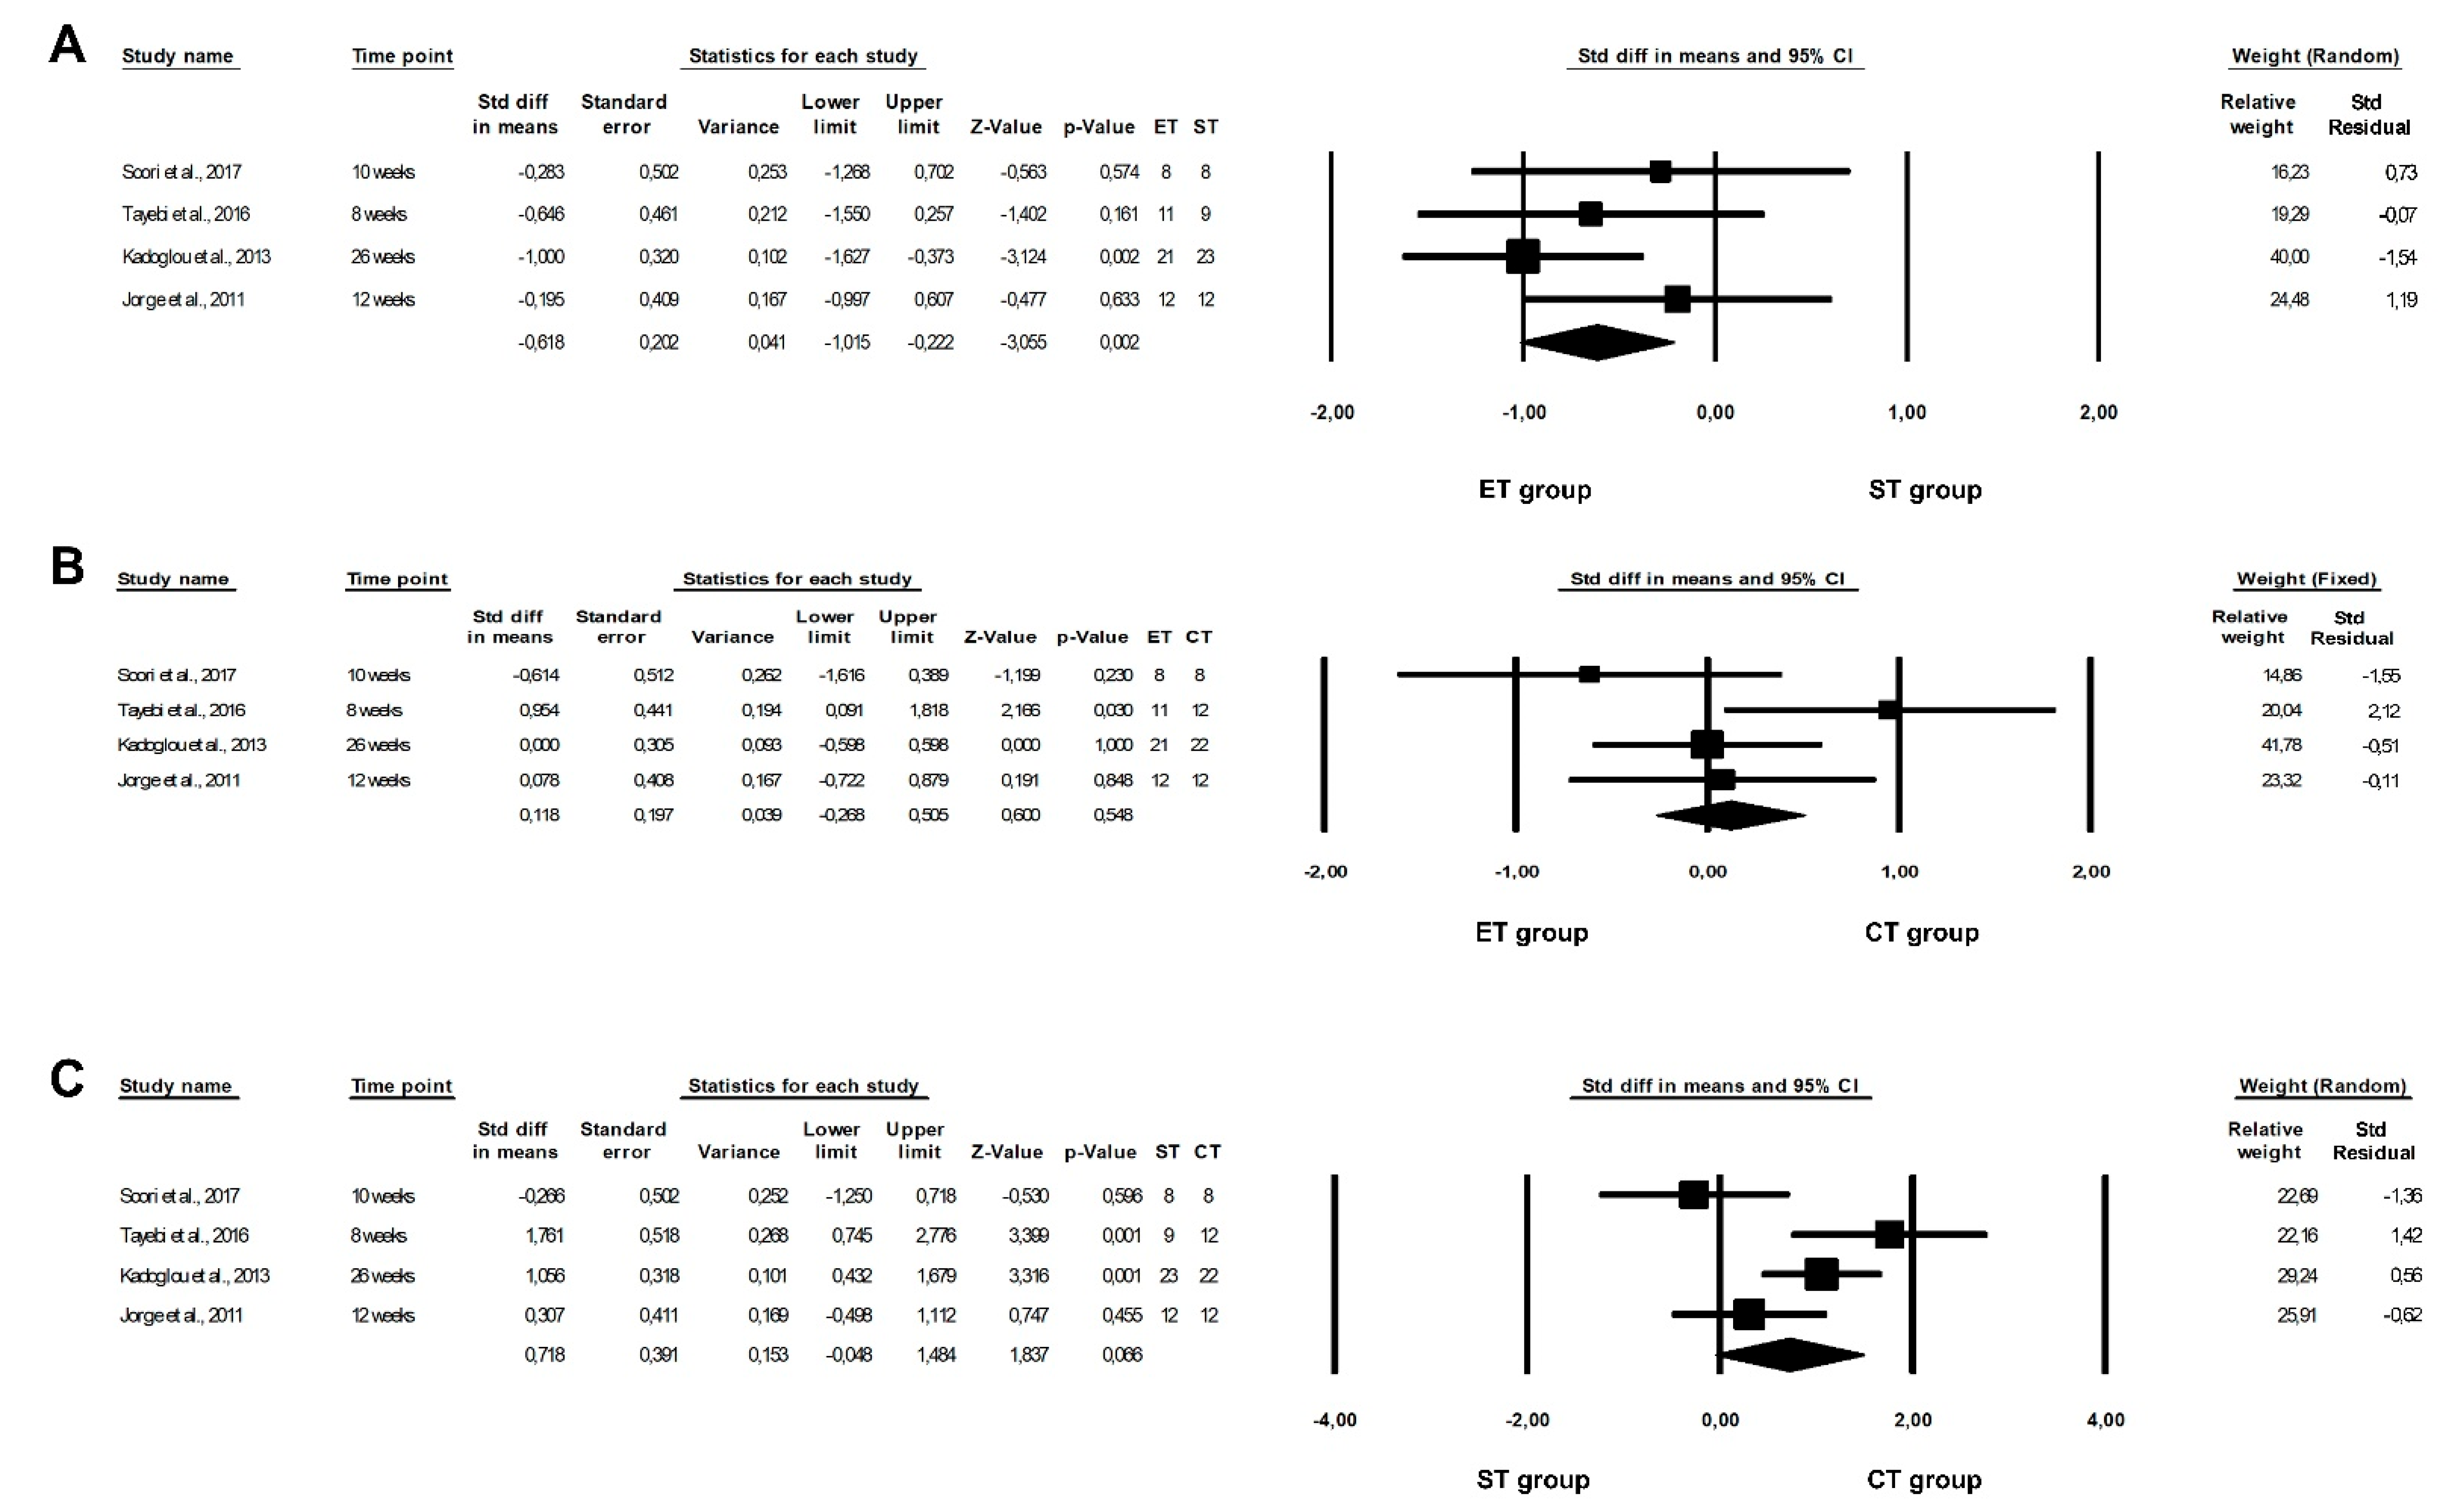
3.10. Effect of Physical Training on Visfatin Levels
| Author | Year | Group | Leptin [µg/mL] | Adiponectin [µg/mL] | Visfatin [ng/mL] | ||||||
|---|---|---|---|---|---|---|---|---|---|---|---|
| Pre | Post | Changes | Pre | Post | Changes | Pre | Post | Changes | |||
| Mohammad Rahimi et al. [20] | 2020 | ET | NI | NI | NI | 2660 ± 820 2,3,4 | 6520 ± 990 2,3,4 | 3860 2 (145.1% 5) | NI | NI | NI |
| ST | 2790 ± 940 2,3,4 | 4420 ± 1250 2,3,4 | 1670 2 (59.85% 5) | ||||||||
| CT | 2700 ± 690 2,3,4 | 6440 ± 680 2,3,4 | 3700 2 (137.04% 5) | ||||||||
| CG | 2660 ± 820 2,3,4 | 2700 ± 860 2,3,4 | NI | ||||||||
| p 1 | ET, ST, CT: p <0.05 (pre vs. post) ET, ST, CT vs. CG, CT vs. ST, ET vs. ST: p < 0.05 (time × group interaction, post-hoc) | ||||||||||
| Christensen et al. [21] | 2019 | ET | NI | NI | NI | NI | 17.30 (14.94–19.65) 2,6 | −0.69 (−3.04–1.67) 2,6 | NI | NI | NI |
| −2.5 7 (−17.112.2)% 5,6 | |||||||||||
| ST | 16.79 (14.40–19.21) 2,6 | −1.20 (−3.62–1.23) 2,6 | |||||||||
| −9.5 7 (−24.7–5.7)% 5,6 | |||||||||||
| CT | 17.50 (14.81–20.18) 2,6 | −0.49 (−3.17–2.20) 2,6 | |||||||||
| 1.0 7 (−15.8–17.8)% 5,6 | |||||||||||
| Nunes et al. [47] | 2019 | ET | 22.57 (16.13–29.02) 2,8 | 17.59 (11.16–24.02) 2,8 | −4.98 (−9.78–(−0.19)) 2,8 | 4.35 (3.02–5.68) 2,8 | 4.71 (3.59–5.82) 2,8 | 0.35 (−0.96–1.67) 2,8 | NI | NI | NI |
| −28.38 (−55.59–(−1.06))% 2,5,8 | 8.12 (−7.84–13.58)% 2,5,8 | ||||||||||
| CT | 21.33 (15.17–27.49) 2,8 | 17.42 (12.91–21.92) 2,8 | −3.91 (−11.62–3.80) 2,8 | 5.12 (4.02–6.23) 2,8 | 3.00 (1.96–4.05) 2,8 | −2.12 (−3.59–(−0.65))2,8 | |||||
| −18.34 (−54.49–17.8)% 2,5,8 | −41.37 (−70.05–(−12.69))% 2,5,8 | ||||||||||
| p 1 | p = 0.043 (time) | p = 0.012 (time × group) | |||||||||
| Oh et al. [19] | 2017 | ET 9 | NI | NI | −2.18 ± 0.89 4,11 −3.2% 5 | NI | NI | −0.016 ± 0.01 4,12 | NI | NI | NI |
| ET 10 | −1.45 ± 1.01 4,11 | −0.011 ± 0.018 4,12 | |||||||||
| ST | −1.92 ± 0.68 4,11 −14.3% 5 | −0.026 ± 0.021 4,12 | |||||||||
| p 1 | ET 9, ST: p < 0.05 (pre vs. post) | ||||||||||
| Soori et al. [18] | 2017 | ET | NI | NI | NI | NI | NI | NI | 2.2 ± 0.8 4,11 | 1.6 ± 0.6 4,11 | −0.62 2 −28.3% 5 |
| ST | 1.7 ± 1 4,11 | 1.8 ± 0.84,11 | NI | ||||||||
| CT | 2.8 ± 0.9 4,11 | 2 ± 0.7 4,11 | −0.86 2 −30.7% 5 | ||||||||
| CG | 2 ± 0.9 4,11 | 1.7 ± 0.3 4,11 | NI | ||||||||
| p 1 | p = 0.04 (post) CT: p = 0.003 (pre vs. post) ET: p = 0.045 (pre vs. post) CT vs. ET: p < 0.002 (post) CT vs. CG: p < 0.018 (post) | ||||||||||
| Tayebi et al. [37] | 2016 | ET | NI | NI | NI | NI | NI | NI | NI | 9.8 ± 0.4 4,13 | NI |
| ST | 10.7 ± 0.5 4,13 | ||||||||||
| CT | 8.7 ± 0.3 4,13 | ||||||||||
| p 1 | p = 0.005 (post) ST vs. CT: p = 0.004 (changes, post-hoc) | ||||||||||
| Kadoglou et al. [15] | 2013 | ET | NI | NI | NI | NI | NI | NI | 35 ± 8 4,11 | 24 ± 9 4,11 | NI |
| ST | 31 ± 8 4,11 | 33 ± 9 4,11 | |||||||||
| CT | 36 ± 8 4,11 | 24 ± 8 4,11 | |||||||||
| CG | 31 ± 8 4,11 | 30 ± 9 4,11 | |||||||||
| p 1 | p < 0.05 (changes, post-hoc) ET, CT vs. CG: p < 0.05, ET, CT vs. ST: p < 0.05 | ||||||||||
| Venojärvi et al. [40] | 2013 | ET | 14.1 ± 2.8 14 | NI | −3.8 ± 1.2 14 | 11.2 ± 1.3 14 | NI | 0.0 ± 0.8 14 | NI | NI | NI |
| ST | 11.5 ± 1.4 14 | −0.9 ± 0.9 14 | 10.4 ± 1.1 14 | 0.9 ± 0.6 14 | |||||||
| CG | 7.6 ± 1.3 14 | −0.2 ± 0.9 14 | 12.1 ± 1.5 14 | 0.2 ± 0.7 14 | |||||||
| p 1 | p = 0.009 (pre) p = 0.001 (changes) ET vs. CG: p = 0.015 7, ST vs. CG: p = 0.036 7 (pre, post-hoc) ET vs. CG: p = 0.001 7 (changes, post-hoc) | ||||||||||
| Asad et al. [41,42] | 2012 | ET | NI | NI | NI | 16.67 ± 2.35 11 | 17.56 ± 1.51 11 | NI | NI | NI | NI |
| ST | 16.67 ± 2.35 11 | 17.56 ± 1.51 11 | |||||||||
| CT | 17.00 ± 5.37 11 | 20.38 ± 7.61 11 | |||||||||
| CG | 20.30 ± 8.35 11 | 18.80 ± 2.69 11 | |||||||||
| Sukala et al. [22] | 2012 | ET | NI | NI | NI | 6.7 ± 3.3 11 | 6.7 ± 3.2 11 | 0.1 ± 2.2 11 | NI | NI | NI |
| ST | 5.6 ± 1.9 11 | 5.6 ± 2.2 11 | 0.0 ± 1.4 11 | ||||||||
| Jorge et al. [25] | 2011 | ET | NI | NI | NI | 5.58 ± 5.73 11 | 3.38 ± 2.22 11 | NI | 112.24 ± 45.83 11 | 131.54 ± 58.38 11 | NI |
| ST | 4.45 ± 4.12 11 | 5.13 ± 4.30 11 | 112.11 ± 42.85 11 | 142.25 ± 51.04 11 | |||||||
| CT | 5.98 ± 3.43 11 | 6.58 ± 5.44 11 | 116.19 ± 75.41 11 | 127.46 ± 45.22 11 | |||||||
| CG | 5.07 ± 5.50 11 | 3.75 ± 2.93 11 | 103.57 ± 55.06 11 | 134.12 ± 72.06 11 | |||||||
| p 1 | ET, ST, CT, CG: p < 0.05 15 (pre vs. post) | ||||||||||
| Ahmadizad et al. [44] | 2007 | ET | NI | NI | NI | 9.5 ± 3.4 4,11 | 9.45 ± 1.1 4,11 | NI | NI | NI | NI |
| ST | 11.3 ± 1.4 4,11 | 9.7 ± 2.5 4,11 | |||||||||
| CG | 10.3 ± 1.9 4,11 | 12.1 ± 4.4 4,11 | |||||||||
| Hara et al. [45] | 2005 | ET | 7.3 ± 2.8 11 | 6.0 ± 2.6 11 | NI | 3.7 ± 2.2 11 | 4.0 ± 1.9 11 | NI | NI | NI | NI |
| CT | 5.9 ± 2.0 11 | 5.4 ± 2.3 11 | 6.2 ± 2.0 11 | 6.6 ± 2.5 11 | |||||||
| CG | 8.8 ± 2.3 11 | 8.6 ± 2.5 11 | 4.0 ± 1.2 11 | 4.2 ± 1.3 11 | |||||||
| p 1 | ET: p < 0.05 (pre vs. post) ET vs. ST, CG: p < 0.05 (pre, post-hoc) | CT vs. CG, ET: p < 0.05 (pre, post-hoc) | |||||||||


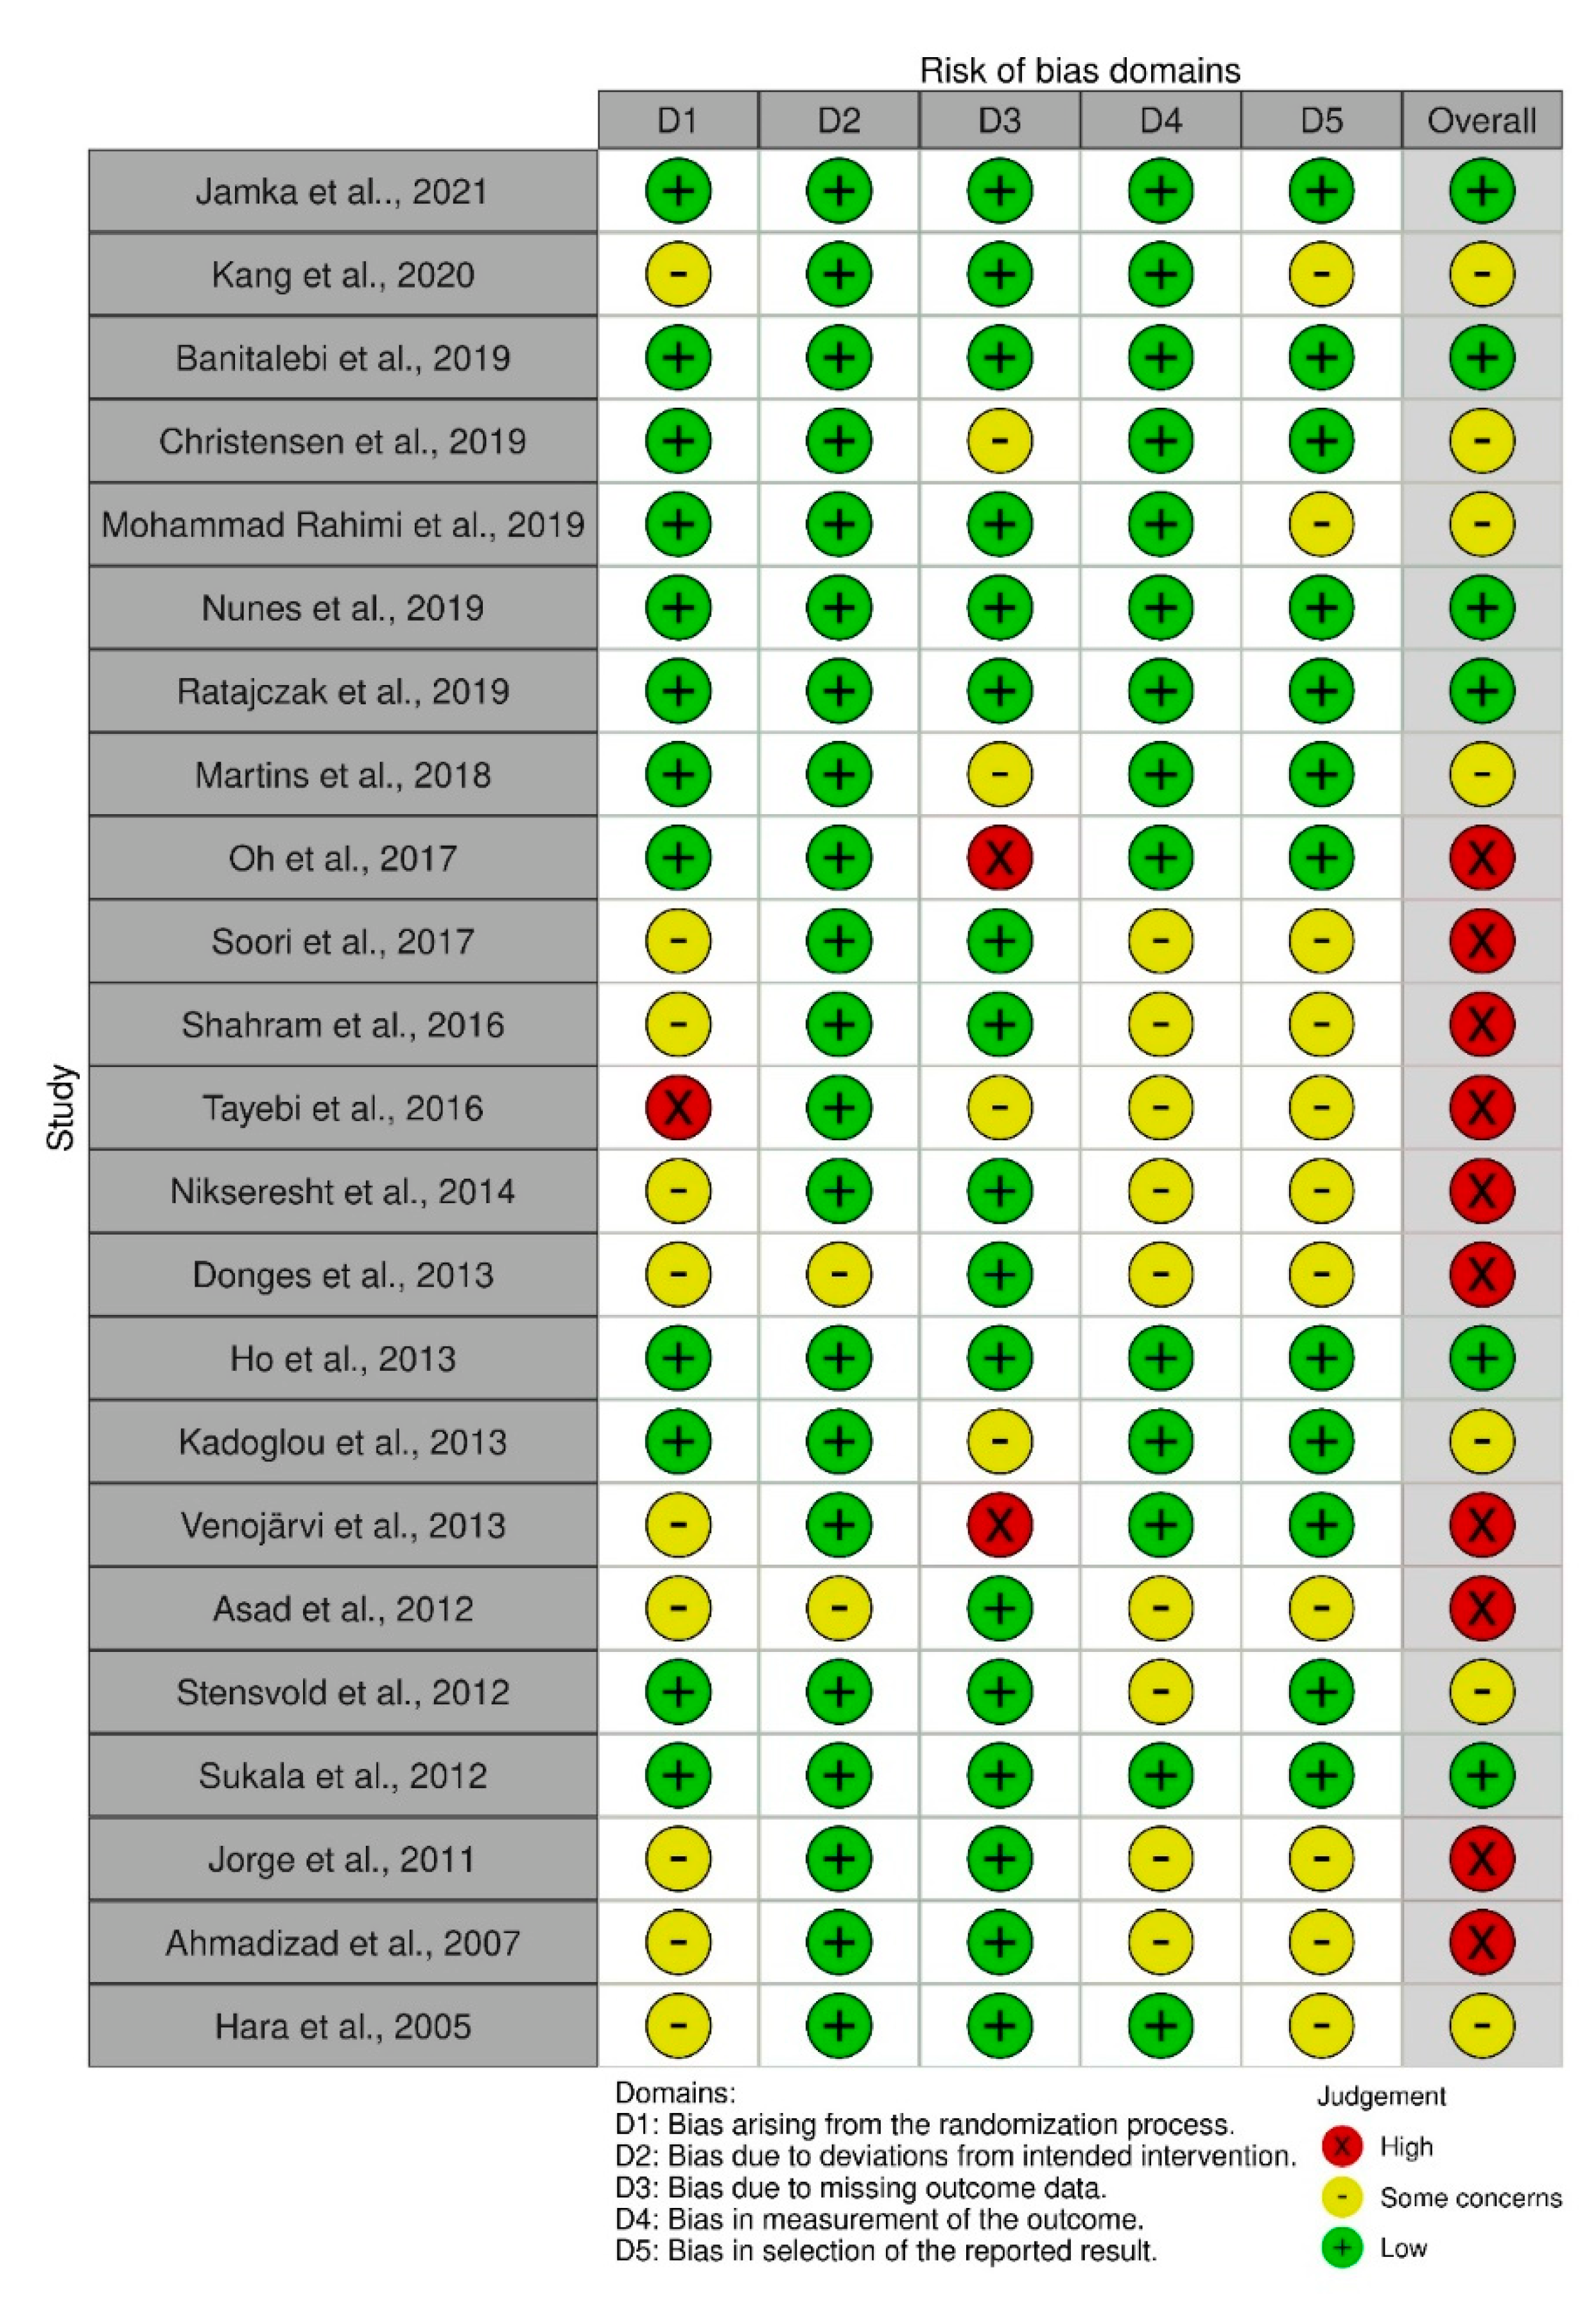
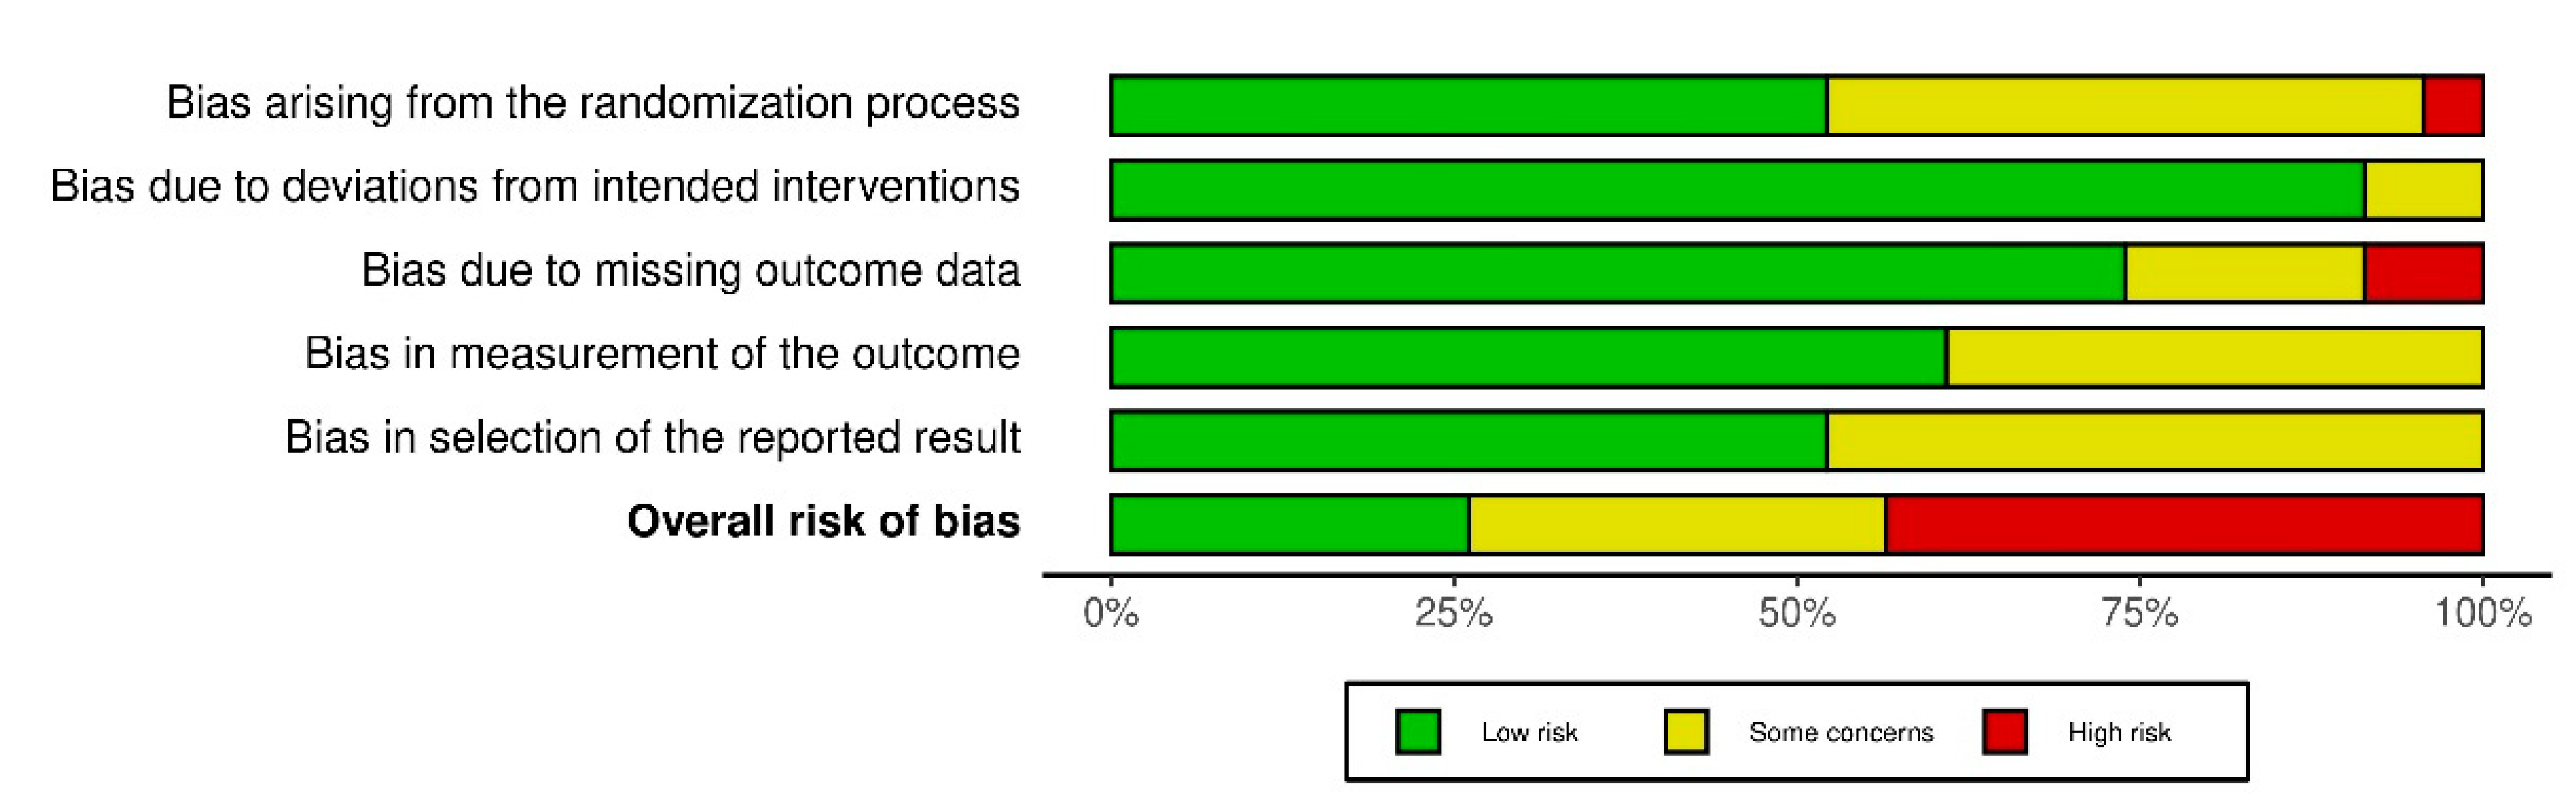
3.11. Risk of Bias
4. Discussion
5. Conclusions
Supplementary Materials
Author Contributions
Funding
Institutional Review Board Statement
Informed Consent Statement
Data Availability Statement
Conflicts of Interest
References
- Chooi, Y.C.; Ding, C.; Magkos, F. The Epidemiology of obesity. Metabolism 2019, 92, 6–10. [Google Scholar] [CrossRef] [Green Version]
- Abarca-Gómez, L.; Abdeen, Z.A.; Hamid, Z.A.; Abu-Rmeileh, N.M.; Acosta-Cazares, B.; Acuin, C.; Adams, R.J.; Aekplakorn, W.; Afsana, K.; Aguilar-Salinas, C.A.; et al. Worldwide trends in body-mass index, underweight, overweight, and obesity from 1975 to 2016: A pooled analysis of 2416 population-based measurement studies in 128.9 million children, adolescents, and adults. Lancet 2017, 390, 2627–2642. [Google Scholar] [CrossRef] [Green Version]
- Galani, C.; Schneider, H. Prevention and treatment of obesity with lifestyle interventions: Review and meta-analysis. Int. J. Public Health 2007, 52, 348–359. [Google Scholar] [CrossRef] [PubMed]
- Kim, B.; Kim, S. Influences of resistance versus aerobic exercise on physiological and physical fitness changes in previously inactive men with obesity: A prospective, single-blinded randomized controlled trial. Diabetes Metab. Syndr. Obes. Targets Ther. 2020, 13, 267–276. [Google Scholar] [CrossRef] [PubMed] [Green Version]
- Zeng, J.; Peng, L.; Zhao, Q.; Chen, Q.G. Effects over 12 weeks of different types and durations of exercise intervention on body composition of young women with obesity. Sci. Sports 2021, 36, 45–52. [Google Scholar] [CrossRef]
- Skrypnik, D.; Bogdański, P.; Mądry, E.; Karolkiewicz, J.; Ratajczak, M.; Kryściak, J.; Pupek-Musialik, D.; Walkowiak, J. Effects of endurance and endurance strength training on body composition and physical capacity in women with abdominal obesity. Obes. Facts 2015, 8, 175–187. [Google Scholar] [CrossRef] [PubMed]
- Marzolini, S.; Oh, P.I.; Brooks, D. Effect of combined aerobic and resistance training versus aerobic training alone in individuals with coronary artery disease: A meta-analysis. Eur. J. Prev. Cardiol. 2012, 19, 81–94. [Google Scholar] [CrossRef] [PubMed]
- Bruunsgaard, H. Physical Activity and Modulation of Systemic Low-Level Inflammation. J. Leukoc. Biol. 2005, 78, 819–835. [Google Scholar] [CrossRef] [Green Version]
- Haffner, S.M. Abdominal adiposity and cardiometabolic risk: Do we have all the answers? Am. J. Med. 2007, 120, S10–S16. [Google Scholar] [CrossRef]
- Achari, A.E.; Jain, S.K. Adiponectin, a therapeutic target for obesity, diabetes, and endothelial dysfunction. Int. J. Mol. Sci. 2017, 18, 1321. [Google Scholar] [CrossRef] [Green Version]
- Ouchi, N.; Parker, J.L.; Lugus, J.J.; Walsh, K. Adipokines in inflammation and metabolic disease. Nat. Rev. Immunol. 2011, 11, 85–97. [Google Scholar] [CrossRef]
- Nicklas, B.J.; Ambrosius, W.; Messier, S.P.; Miller, G.D.; Penninx, B.W.J.H.; Loeser, R.F.; Palla, S.; Bleecker, E.; Pahor, M. Diet-induced weight loss, exercise, and chronic inflammation in older, obese adults: A randomized controlled clinical trial. Am. J. Clin. Nutr. 2004, 79, 544–551. [Google Scholar] [CrossRef]
- Kyröläinen, H.; Hackney, A.C.; Salminen, R.; Repola, J.; Häkkinen, K.; Haimi, J. Effects of combined strength and endurance training on physical performance and biomarkers of healthy young women. J. Strength Cond. Res. 2018, 32, 1554–1561. [Google Scholar] [CrossRef]
- Ratajczak, M.; Skrypnik, D.; Bogdański, P.; Madry, E.; Walkowiak, J.; Szulińska, M.; Maciaszek, J.; Kręgielska-Narożna, M.; Karolkiewicz, J. Effects of endurance and endurance–strength training on endothelial function in women with obesity: A randomized trial. Int. J. Environ. Res. Public. Health 2019, 16, 4291. [Google Scholar] [CrossRef] [Green Version]
- Kadoglou, N.P.E.; Fotiadis, G.; Kapelouzou, A.; Kostakis, A.; Liapis, C.D.; Vrabas, I.S. The differential anti-inflammatory effects of exercise modalities and their association with early carotid atherosclerosis progression in patients with type 2 diabetes. Diabet. Med. 2013, 30, e41. [Google Scholar] [CrossRef]
- Donges, C.E.; Duffield, R.; Guelfi, K.J.; Smith, G.C.; Adams, D.R.; Edge, J.A. Comparative effects of single-mode vs. duration-matched concurrent exercise training on body composition, low-grade inflammation, and glucose regulation in sedentary, overweight, middle-aged men. Appl. Physiol. Nutr. Metab. Physiol. 2013, 38, 779–788. [Google Scholar] [CrossRef]
- Shahram, S.; Elham, Y.; Abdolali, B. The effect of endurance and resistance training on inflammatory cytokines in sedentary young women. Acta Med. Mediterr. 2016, 32, 999–1002. [Google Scholar]
- Soori, R.; Rezaeian, N.; Khosravi, N.; Ahmadizad, S.; Taleghani, H.M.; Jourkesh, M.; Stannard, S.R. Effects of water-based endurance training, resistance training, and combined water and resistance training programs on visfatin and icam-1 levels in sedentary obese women. Sci. Sports 2017, 32, 144–151. [Google Scholar] [CrossRef]
- Oh, S.; So, R.; Shida, T.; Matsuo, T.; Kim, B.; Akiyama, K.; Isobe, T.; Okamoto, Y.; Tanaka, K.; Shoda, J. High-intensity aerobic exercise improves both hepatic fat content and stiffness in sedentary obese men with nonalcoholic fatty liver disease. Sci. Rep. 2017, 7, 43029. [Google Scholar] [CrossRef] [Green Version]
- Mohammad Rahimi, G.R.; Bijeh, N.; Rashidlamir, A. Effects of exercise training on serum preptin, undercarboxylated osteocalcin and high molecular weight adiponectin in adults with metabolic syndrome. Exp. Physiol. 2020, 105, 449–459. [Google Scholar] [CrossRef]
- Christensen, R.H.; Wedell-Neergaard, A.S.; Lehrskov, L.L.; Legaard, G.E.; Dorph, E.; Larsen, M.K.; Launbo, N.; Fagerlind, S.R.; Seide, S.K.; Nymand, S.; et al. Effect of aerobic and resistance exercise on cardiac adipose tissues: Secondary analyses from a randomized clinical trial. JAMA Cardiol. 2019, 4, 778–787. [Google Scholar] [CrossRef] [PubMed]
- Sukala, W.R.; Page, R.; Rowlands, D.S.; Krebs, J.; Lys, I.; Leikis, M.; Pearce, J.; Cheema, B.S. South pacific islanders resist type 2 diabetes: Comparison of aerobic and resistance training. Eur. J. Appl. Physiol. 2012, 112, 317–325. [Google Scholar] [CrossRef] [PubMed]
- Jamka, M.; Bogdański, P.; Krzyżanowska-Jankowska, P.; Miśkiewicz-Chotnicka, A.; Karolkiewicz, J.; Duś-Żuchowska, M.; Mądry, R.; Lisowska, A.; Gotz-Więckowska, A.; Iskakova, S.; et al. Endurance training depletes antioxidant system but does not affect endothelial functions in women with abdominal obesity: A randomized trial with a comparison to endurance-strength training. J. Clin. Med. 2021, 10, 1639. [Google Scholar] [CrossRef] [PubMed]
- Kang, S.; Park, I.B.; Lim, S.-T. Changing levels of myokines after aerobic training and resistance training in post-menopausal obese females: A randomized controlled trial. Sustainability 2020, 12, 8413. [Google Scholar] [CrossRef]
- Jorge, M.L.M.P.; Oliveira, V.N.D.; Resende, N.M.; Paraiso, L.F.; Calixto, A.; Diniz, A.L.D.; Resende, E.S.; Ropelle, E.R.; Carvalheira, J.B.; Espindola, F.S.; et al. The effects of aerobic, resistance, and combined exercise on metabolic control, inflammatory markers, adipocytokines, and muscle insulin signaling in patients with type 2 diabetes mellitus. Metabolism 2011, 60, 1244–1252. [Google Scholar] [CrossRef]
- Zheng, G.; Qiu, P.; Xia, R.; Lin, H.; Ye, B.; Tao, J.; Chen, L. Effect of aerobic exercise on inflammatory markers in healthy middle-aged and older adults: A systematic review and meta-analysis of randomized controlled trials. Front. Aging Neurosci. 2019, 11, 98. [Google Scholar] [CrossRef] [Green Version]
- Page, M.J.; McKenzie, J.E.; Bossuyt, P.M.; Boutron, I.; Hoffmann, T.C.; Mulrow, C.D.; Shamseer, L.; Tetzlaff, J.M.; Akl, E.A.; Brennan, S.E.; et al. The PRISMA 2020 Statement: An updated guideline for reporting systematic reviews. PLoS Med. 2021, 18, e1003583. [Google Scholar] [CrossRef]
- Higgins, J.; Thomas, J.; Chandler, J.; Cumpston, M.; Li, T.; Page, M.; Welch, V. Cochrane Handbook for Systematic Reviews of Interventions Version 6.1 (Updated September 2020). Available online: https://training.cochrane.org/handbook/current (accessed on 14 March 2022).
- Jamka, M.; Makarewicz, A.; Śmidowicz, A.; Geltz, J.; Kokot, M.; Kaczmarek, N.; Mądry, E.; Walkowiak, J. Comparison of the Effect of Endurance, Strength and Endurance-Strength Training in Overweight and Obese Adults; PROSPERO 2020 CRD42020183252. Available online: https://www.crd.york.ac.uk/prospero/display_record.php?RecordID=183252 (accessed on 15 March 2022).
- World Health Organization. Body Mass Index—BMI. Available online: https://www.euro.who.int/en/health-topics/disease-prevention/nutrition/a-healthy-lifestyle/body-mass-index-bmi (accessed on 10 March 2022).
- Jih, J.; Mukherjea, A.; Vittinghoff, E.; Nguyen, T.T.; Tsoh, J.Y.; Fukuoka, Y.; Bender, M.S.; Tseng, W.; Kanaya, A.M. Using appropriate body mass index cut points for overweight and obesity among Asian Americans. Prev. Med. 2014, 65, 1–6. [Google Scholar] [CrossRef] [Green Version]
- World Health Organization. Waist Circumference and Waist-Hip Ratio: Report of a WHO Expert Consultation; World Health Organization: Geneva, Switzerland, 2008. [Google Scholar]
- American Council on Exercise ACE. Fit|Percent body fat calculator. Available online: https://www.acefitness.org/education-and-resources/lifestyle/tools-calculators/percent-body-fat-calculator/ (accessed on 10 March 2022).
- Sterne, J.A.C.; Savović, J.; Page, M.J.; Elbers, R.G.; Blencowe, N.S.; Boutron, I.; Cates, C.J.; Cheng, H.-Y.; Corbett, M.S.; Eldridge, S.M.; et al. RoB 2: A Revised tool for assessing risk of bias in randomised trials. BMJ 2019, 366, 14898. [Google Scholar] [CrossRef] [Green Version]
- Hozo, S.P.; Djulbegovic, B.; Hozo, I. Estimating the mean and variance from the median, range, and the size of a sample. BMC Med. Res. Methodol. 2005, 5, 13. [Google Scholar] [CrossRef] [Green Version]
- Digitize Graphs and Plots—GetData Graph Digitizer—Graph Digitizing Software. Available online: http://getdata-graph-digitizer.com/ (accessed on 8 March 2022).
- Tayebi, S.M.; Saeidi, A.; Khosravi, M. Single and concurrent effects of endurance and resistance training on plasma visfatin, insulin, glucose and insulin resistance of non-athlete men with obesity. Ann. Appl. Sport Sci. 2016, 4, 21–31. [Google Scholar] [CrossRef] [Green Version]
- Nikseresht, M.; Agha-Alinejad, H.; Azarbayjani, M.A.; Ebrahim, K. Effects of nonlinear resistance and aerobic interval training on cytokines and insulin resistance in sedentary men who are obese. J. Strength Cond. Res. 2014, 28, 2560–2568. [Google Scholar] [CrossRef] [PubMed]
- Ho, S.S.; Dhaliwal, S.S.; Hills, A.P.; Pal, S. Effects of chronic exercise training on inflammatory markers in Australian overweight and obese individuals in a randomized controlled trial. Inflammation 2013, 36, 625–632. [Google Scholar] [CrossRef]
- Venojärvi, M.; Wasenius, N.; Manderoos, S.; Heinonen, O.J.; Hernelahti, M.; Lindholm, H.; Surakka, J.; Lindström, J.; Aunola, S.; Atalay, M.; et al. Nordic walking decreased circulating chemerin and leptin concentrations in middle-aged men with impaired glucose regulation. Ann. Med. 2013, 45, 162–170. [Google Scholar] [CrossRef]
- Asad, M.; Ravasi, A.A.; Faramarzi, M.; Pournemati, P. The effects of three training methods endurance, resistance and concurrent on adiponectin resting levels in overweighed untrained men. Bratisl. Med. J. 2012, 113, 664–668. [Google Scholar] [CrossRef] [Green Version]
- Asad, M.R.; Ferdosi, M.H.; Yoosefi, Z. The effects of three training methods endurance, resistance and concurrent on adiponectin resting levels in overweighed untrained men. Procedia Soc. Behav. Sci. 2012, 46, 440–444. [Google Scholar] [CrossRef] [Green Version]
- Stensvold, D.; Slørdahl, S.A.; Wisløff, U. Effect of exercise training on inflammation status among people with metabolic syndrome. Metab. Syndr. Relat. Disord. 2012, 10, 267–272. [Google Scholar] [CrossRef] [Green Version]
- Ahmadizad, S.; Haghighi, A.H.; Hamedinia, M.R. Effects of resistance versus endurance training on serum adiponectin and insulin resistance index. Eur. J. Endocrinol. 2007, 157, 625–631. [Google Scholar] [CrossRef]
- Hara, T.; Fujiwara, H.; Nakao, H.; Mimura, T.; Yoshikawa, T.; Fujimoto, S. Body composition is related to increase in plasma adiponectin levels rather than training in young obese men. Eur. J. Appl. Physiol. 2005, 94, 520–526. [Google Scholar] [CrossRef]
- Banitalebi, E.; Kazemi, A.R.; Faramarzi, M.; Nasiri, S.; Haghighi, M.M. Effects of sprint interval or combined aerobic and resistance training on myokines in overweight women with type 2 diabetes: A randomized controlled trial. Life Sci. 2019, 217, 101–109. [Google Scholar] [CrossRef]
- Nunes, P.R.P.; Martins, F.M.; Souza, A.P.; Carneiro, M.A.S.; Nomelini, R.S.; Michelin, M.A.; Murta, E.F.C.; Oliveira, E.P.D.; Orsatti, F.L. Comparative effects of high-intensity interval training with combined training on physical function markers in obese postmenopausal women: A randomized controlled trial. Menopause 2019, 26, 1242–1249. [Google Scholar] [CrossRef]
- Martins, F.M.; de Paula Souza, A.; Nunes, P.R.P.; Michelin, M.A.; Murta, E.F.C.; Resende, E.A.M.R.; de Oliveira, E.P.; Orsatti, F.L. High-intensity body weight training is comparable to combined training in changes in muscle mass, physical performance, inflammatory markers and metabolic health in postmenopausal women at high risk for type 2 diabetes mellitus: A randomized controlled clinical trial. Exp. Gerontol. 2018, 107, 108–115. [Google Scholar] [CrossRef] [PubMed]
- Gregg, E.W.; Gerzoff, R.B.; Thompson, T.J.; Williamson, D.F. Intentional weight loss and death in overweight and obese U.S. adults 35 years of age and older. Ann. Intern. Med. 2003, 138, 383–389. [Google Scholar] [CrossRef] [PubMed] [Green Version]
- Nishimura, S.; Manabe, I.; Nagai, R. Adipose tissue inflammation in obesity and metabolic syndrome. Discov. Med. 2009, 8, 55–60. [Google Scholar]
- Calabro, P.; Chang, D.W.; Willerson, J.T.; Yeh, E.T.H. Release of C-reactive protein in response to inflammatory cytokines by human adipocytes: Linking obesity to vascular inflammation. J. Am. Coll. Cardiol. 2005, 46, 1112–1113. [Google Scholar] [CrossRef] [Green Version]
- Yarizadeh, H.; Eftekhar, R.; Anjom-Shoae, J.; Speakman, J.R.; Djafarian, K. The effect of aerobic and resistance training and combined exercise modalities on subcutaneous abdominal fat: A systematic review and meta-analysis of randomized clinical trials. Adv. Nutr. 2020, 12, 179–196. [Google Scholar] [CrossRef]
- Hayashino, Y.; Jackson, J.L.; Hirata, T.; Fukumori, N.; Nakamura, F.; Fukuhara, S.; Tsujii, S.; Ishii, H. Effects of exercise on C-reactive protein, inflammatory cytokine and adipokine in patients with type 2 diabetes: A meta-analysis of randomized controlled trials. Metabolism 2014, 63, 431–440. [Google Scholar] [CrossRef]
- Monteiro-Junior, R.S.; de Tarso Maciel-Pinheiro, P.; da Matta Mello Portugal, E.; da Silva Figueiredo, L.F.; Terra, R.; Carneiro, L.S.F.; Rodrigues, V.D.; Nascimento, O.J.M.; Deslandes, A.C.; Laks, J. Effect of exercise on inflammatory profile of older persons: Systematic review and meta-analyses. J. Phys. Act. Health 2018, 15, 64–71. [Google Scholar] [CrossRef]
- Meneses-Echávez, J.F.; Correa-Bautista, J.E.; González-Jiménez, E.; Schmidt Río-Valle, J.; Elkins, M.R.; Lobelo, F.; Ramírez-Vélez, R. The effect of exercise training on mediators of inflammation in breast cancer survivors: A systematic review with meta-analysis. Cancer Epidemiol. Biomark. Prev. 2016, 25, 1009–1017. [Google Scholar] [CrossRef] [Green Version]
- Khalafi, M.; Symonds, M.E.; Akbari, A. The impact of exercise training versus caloric restriction on inflammation markers: A systemic review and meta-analysis. Crit. Rev. Food Sci. Nutr. 2021, 62, 4226–4241. [Google Scholar] [CrossRef]
- Khalafi, M.; Malandish, A.; Rosenkranz, S.K. The impact of exercise training on inflammatory markers in postmenopausal women: A systemic review and meta-analysis. Exp. Gerontol. 2021, 150, 111398. [Google Scholar] [CrossRef] [PubMed]
- Sardeli, A.V.; Tomeleri, C.M.; Cyrino, E.S.; Fernhall, B.; Cavaglieri, C.R.; Chacon-Mikahil, M.P.T. Effect of resistance training on inflammatory markers of older adults: A meta-analysis. Exp. Gerontol. 2018, 111, 188–196. [Google Scholar] [CrossRef] [PubMed]
- Cadore, E.L.; Pinto, R.S.; Bottaro, M.; Izquierdo, M. Strength and endurance training prescription in healthy and frail elderly. Aging Dis. 2014, 5, 183–195. [Google Scholar] [CrossRef] [PubMed]
- Brooks, G.A. Bioenergetics of exercising humans. Compr. Physiol. 2012, 2, 537–562. [Google Scholar] [CrossRef]
- Peterson, M.D.; Rhea, M.R.; Sen, A.; Gordon, P.M. Resistance exercise for muscular strength in older adults: A meta-analysis. Ageing Res. Rev. 2010, 9, 226–237. [Google Scholar] [CrossRef] [Green Version]
- Gäbler, M.; Prieske, O.; Hortobágyi, T.; Granacher, U. The effects of concurrent strength and endurance training on physical fitness and athletic performance in youth: A systematic review and meta-analysis. Front. Physiol. 2018, 9, 1057. [Google Scholar] [CrossRef] [Green Version]
- Galic, S.; Oakhill, J.S.; Steinberg, G.R. Adipose tissue as an endocrine organ. Mol. Cell. Endocrinol. 2010, 316, 129–139. [Google Scholar] [CrossRef]
- Berndt, J.; Klöting, N.; Kralisch, S.; Kovacs, P.; Fasshauer, M.; Schön, M.R.; Stumvoll, M.; Blüher, M. Plasma visfatin concentrations and fat depot-specific mRNA expression in humans. Diabetes 2005, 54, 2911–2916. [Google Scholar] [CrossRef] [Green Version]
- Yu, N.; Ruan, Y.; Gao, X.; Sun, J. Systematic review and meta-analysis of randomized, controlled trials on the effect of exercise on serum leptin and adiponectin in overweight and obese individuals. Horm. Metab. Res. 2017, 49, 164–173. [Google Scholar] [CrossRef] [Green Version]
- Costa, R.R.; Buttelli, A.C.K.; Vieira, A.F.; Coconcelli, L.; de Lima Magalhães, R.; Delevatti, R.S.; Kruel, L.F.M. Effect of strength training on ipid and inflammatory outcomes: Systematic review with meta-analysis and meta-regression. J. Phys. Act. Health 2019, 16, 477–491. [Google Scholar] [CrossRef]
- Rostás, I.; Pótó, L.; Mátrai, P.; Hegyi, P.; Tenk, J.; Garami, A.; Illés, A.; Solymár, M.; Pétervári, E.; Szűcs, Á.; et al. In middle-aged and old obese patients, training intervention reduces leptin level: A meta-analysis. PLoS ONE 2017, 12, e0182801. [Google Scholar] [CrossRef]
- García-Hermoso, A.; Ramírez-Vélez, R.; Ramírez-Campillo, R.; Peterson, M.D.; Martínez-Vizcaíno, V. Concurrent aerobic plus resistance exercise versus aerobic exercise alone to improve health outcomes in paediatric obesity: A systematic review and meta-analysis. Br. J. Sports Med. 2018, 52, 161–166. [Google Scholar] [CrossRef] [Green Version]
- Ackel-D’Elia, C.; Carnier, J.; Bueno, C.R.; Campos, R.M.S.; Sanches, P.L.; Clemente, A.P.G.; Tufik, S.; de Mello, M.T.; Dâmaso, A.R. Effects of different physical exercises on leptin concentration in obese adolescents. Int. J. Sports Med. 2014, 35, 164–171. [Google Scholar] [CrossRef] [Green Version]
- Madsen, E.L.; Rissanen, A.; Bruun, J.M.; Skogstrand, K.; Tonstad, S.; Hougaard, D.M.; Richelsen, B. Weight loss larger than 10% is needed for general improvement of levels of circulating adiponectin and markers of inflammation in obese subjects: A 3-year weight loss study. Eur. J. Endocrinol. 2008, 158, 179–187. [Google Scholar] [CrossRef] [Green Version]
- Vivekananda, L.; Faizuddin, M. Effect of weight reduction on the serum adiponectin and tumor necrosis factor-α levels and the clinical parameters of obese patients with and without periodontal disease. J. Int. Soc. Prev. Community Dent. 2019, 9, 166–171. [Google Scholar] [CrossRef]
- Weltman, A.; Pritzlaff, C.J.; Wideman, L.; Considine, R.V.; Fryburg, D.A.; Gutgesell, M.E.; Hartman, M.L.; Veldhuis, J.D. Intensity of acute exercise does not affect serum leptin concentrations in young men. Med. Sci. Sports Exerc. 2000, 32, 1556–1561. [Google Scholar] [CrossRef] [Green Version]
- Nindl, B.C.; Kraemer, W.J.; Arciero, P.J.; Samatallee, N.; Leone, C.D.; Mayo, M.F.; Hafeman, D.L. Leptin concentrations experience a delayed reduction after resistance exercise in men. Med. Sci. Sports Exerc. 2002, 34, 608–613. [Google Scholar] [CrossRef]
- Fatouros, I.G.; Tournis, S.; Leontsini, D.; Jamurtas, A.Z.; Sxina, M.; Thomakos, P.; Manousaki, M.; Douroudos, I.; Taxildaris, K.; Mitrakou, A. Leptin and adiponectin responses in overweight inactive elderly following resistance training and detraining are intensity related. J. Clin. Endocrinol. Metab. 2005, 90, 5970–5977. [Google Scholar] [CrossRef] [Green Version]
- Saunders, T.J.; Palombella, A.; McGuire, K.A.; Janiszewski, P.M.; Després, J.-P.; Ross, R. Acute exercise increases adiponectin levels in abdominally obese men. J. Nutr. Metab. 2012, 2012, 148729. [Google Scholar] [CrossRef] [Green Version]
- van Aggel-Leijssen, D.P.; van Baak, M.A.; Tenenbaum, R.; Campfield, L.A.; Saris, W.H. Regulation of average 24 h human plasma leptin level; the influence of exercise and physiological changes in energy balance. Int. J. Obes. Relat. Metab. Disord. J. Int. Assoc. Study Obes. 1999, 23, 151–158. [Google Scholar] [CrossRef] [Green Version]
- Jamurtas, A.Z.; Stavropoulos-Kalinoglou, A.; Koutsias, S.; Koutedakis, Y.; Fatouros, I. Adiponectin, resistin, and visfatin in childhood obesity and exercise. Pediatr. Exerc. Sci. 2015, 27, 454–462. [Google Scholar] [CrossRef]
- Seo, D.-I.; So, W.-Y.; Ha, S.; Yoo, E.-J.; Kim, D.; Singh, H.; Fahs, C.A.; Rossow, L.; Bemben, D.A.; Bemben, M.G.; et al. Effects of 12 weeks of combined exercise training on visfatin and metabolic syndrome factors in obese middle-aged women. J. Sports Sci. Med. 2011, 10, 222–226. [Google Scholar]
- Taghian, F.; Zolfaghary, M.; Hedayati, M. Effect of 12 weeks aerobic exercise on visfatin level and insulin resistance in obese women. Razi J. Med. Sci. 2014, 20, 35–44. [Google Scholar]
- Brema, I.; Hatunic, M.; Finucane, F.; Burns, N.; Nolan, J.J.; Haider, D.; Wolzt, M.; Ludvik, B. Plasma visfatin is reduced after aerobic exercise in early onset type 2 diabetes Mellitus. Diabetes Obes. Metab. 2008, 10, 600–602. [Google Scholar] [CrossRef]


Publisher’s Note: MDPI stays neutral with regard to jurisdictional claims in published maps and institutional affiliations. |
© 2022 by the authors. Licensee MDPI, Basel, Switzerland. This article is an open access article distributed under the terms and conditions of the Creative Commons Attribution (CC BY) license (https://creativecommons.org/licenses/by/4.0/).
Share and Cite
Makarewicz, A.; Jamka, M.; Geltz, J.; Śmidowicz, A.; Kokot, M.; Kaczmarek, N.; Mądry, E.; Walkowiak, J. Comparison of the Effect of Endurance, Strength, and Endurance-Strength Training on Inflammatory Markers and Adipokines Levels in Overweight and Obese Adults: Systematic Review and Meta-Analysis of Randomised Trials. Healthcare 2022, 10, 1098. https://doi.org/10.3390/healthcare10061098
Makarewicz A, Jamka M, Geltz J, Śmidowicz A, Kokot M, Kaczmarek N, Mądry E, Walkowiak J. Comparison of the Effect of Endurance, Strength, and Endurance-Strength Training on Inflammatory Markers and Adipokines Levels in Overweight and Obese Adults: Systematic Review and Meta-Analysis of Randomised Trials. Healthcare. 2022; 10(6):1098. https://doi.org/10.3390/healthcare10061098
Chicago/Turabian StyleMakarewicz, Aleksandra, Małgorzata Jamka, Jakub Geltz, Angelika Śmidowicz, Marta Kokot, Nina Kaczmarek, Edyta Mądry, and Jarosław Walkowiak. 2022. "Comparison of the Effect of Endurance, Strength, and Endurance-Strength Training on Inflammatory Markers and Adipokines Levels in Overweight and Obese Adults: Systematic Review and Meta-Analysis of Randomised Trials" Healthcare 10, no. 6: 1098. https://doi.org/10.3390/healthcare10061098