
Assessing Hospital Resource Utilization with Application to Imaging for Patients Diagnosed with Prostate Cancer

 ,
,  , , , and
Abstract
:1. Introduction
2. Materials and Methods
2.1. Data
2.2. Statistical Analysis
3. Results
3.1. Descriptive Statistics
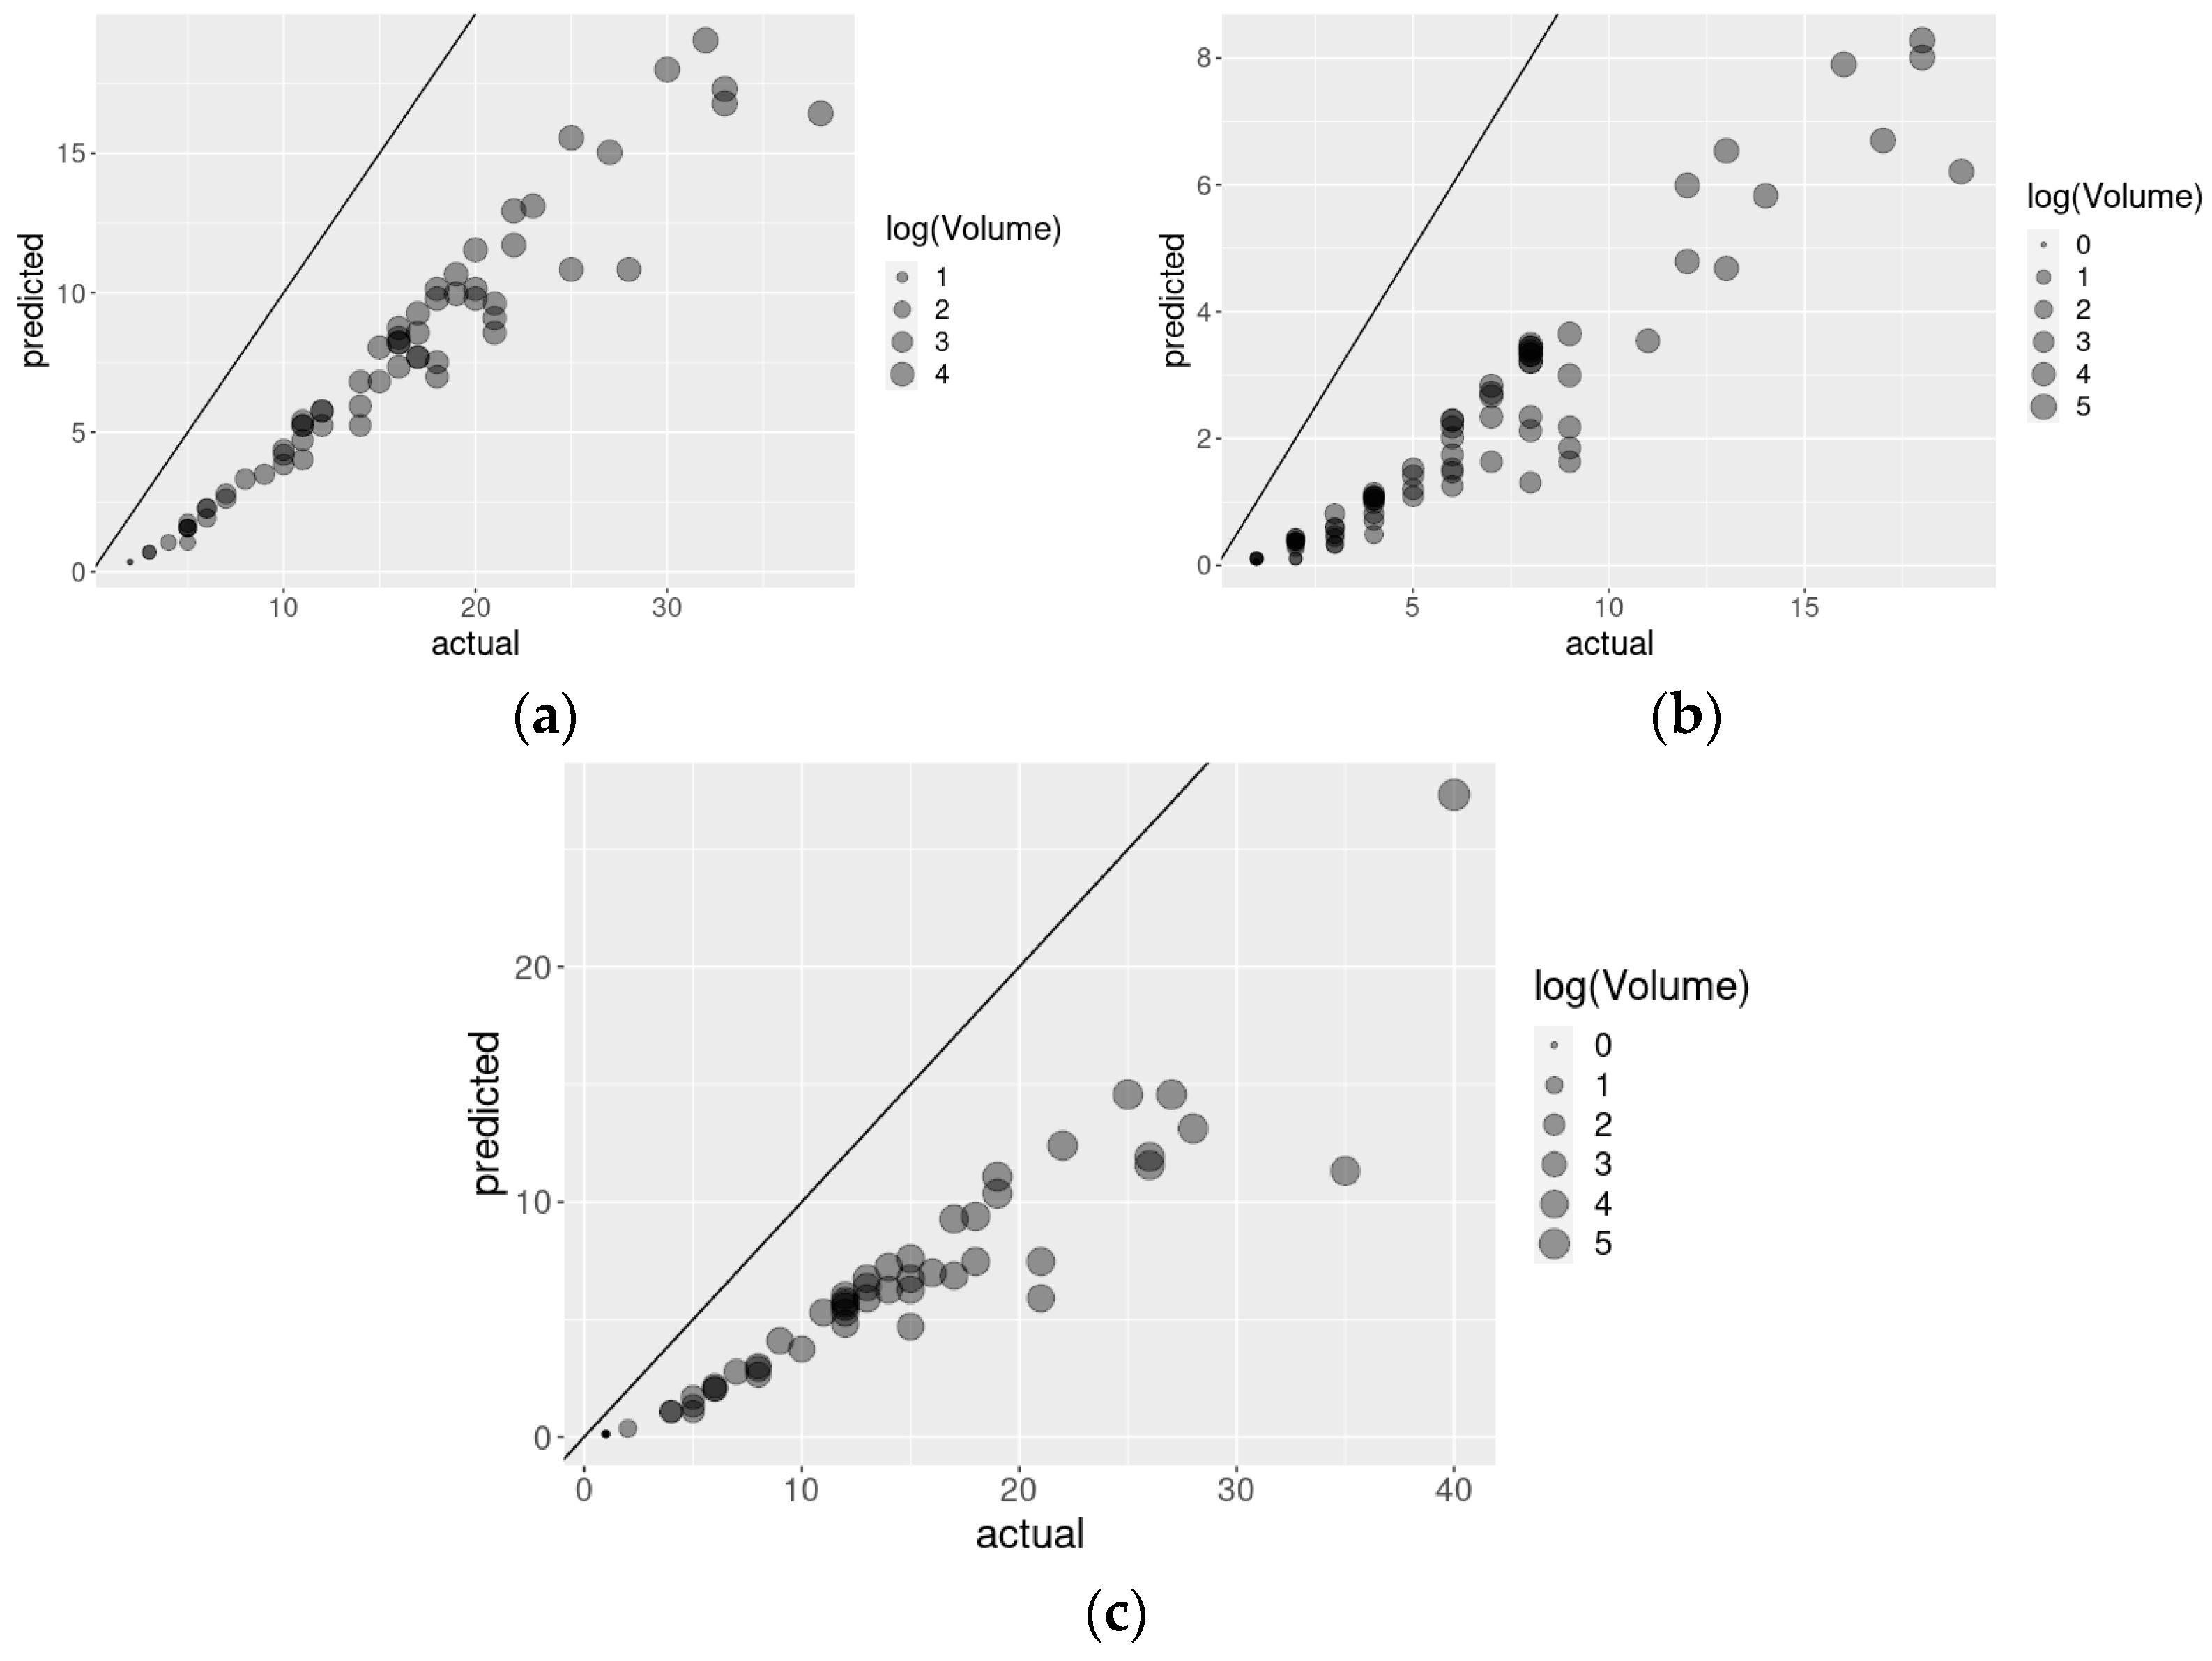
3.2. Risk Adjusting Resource Utilization
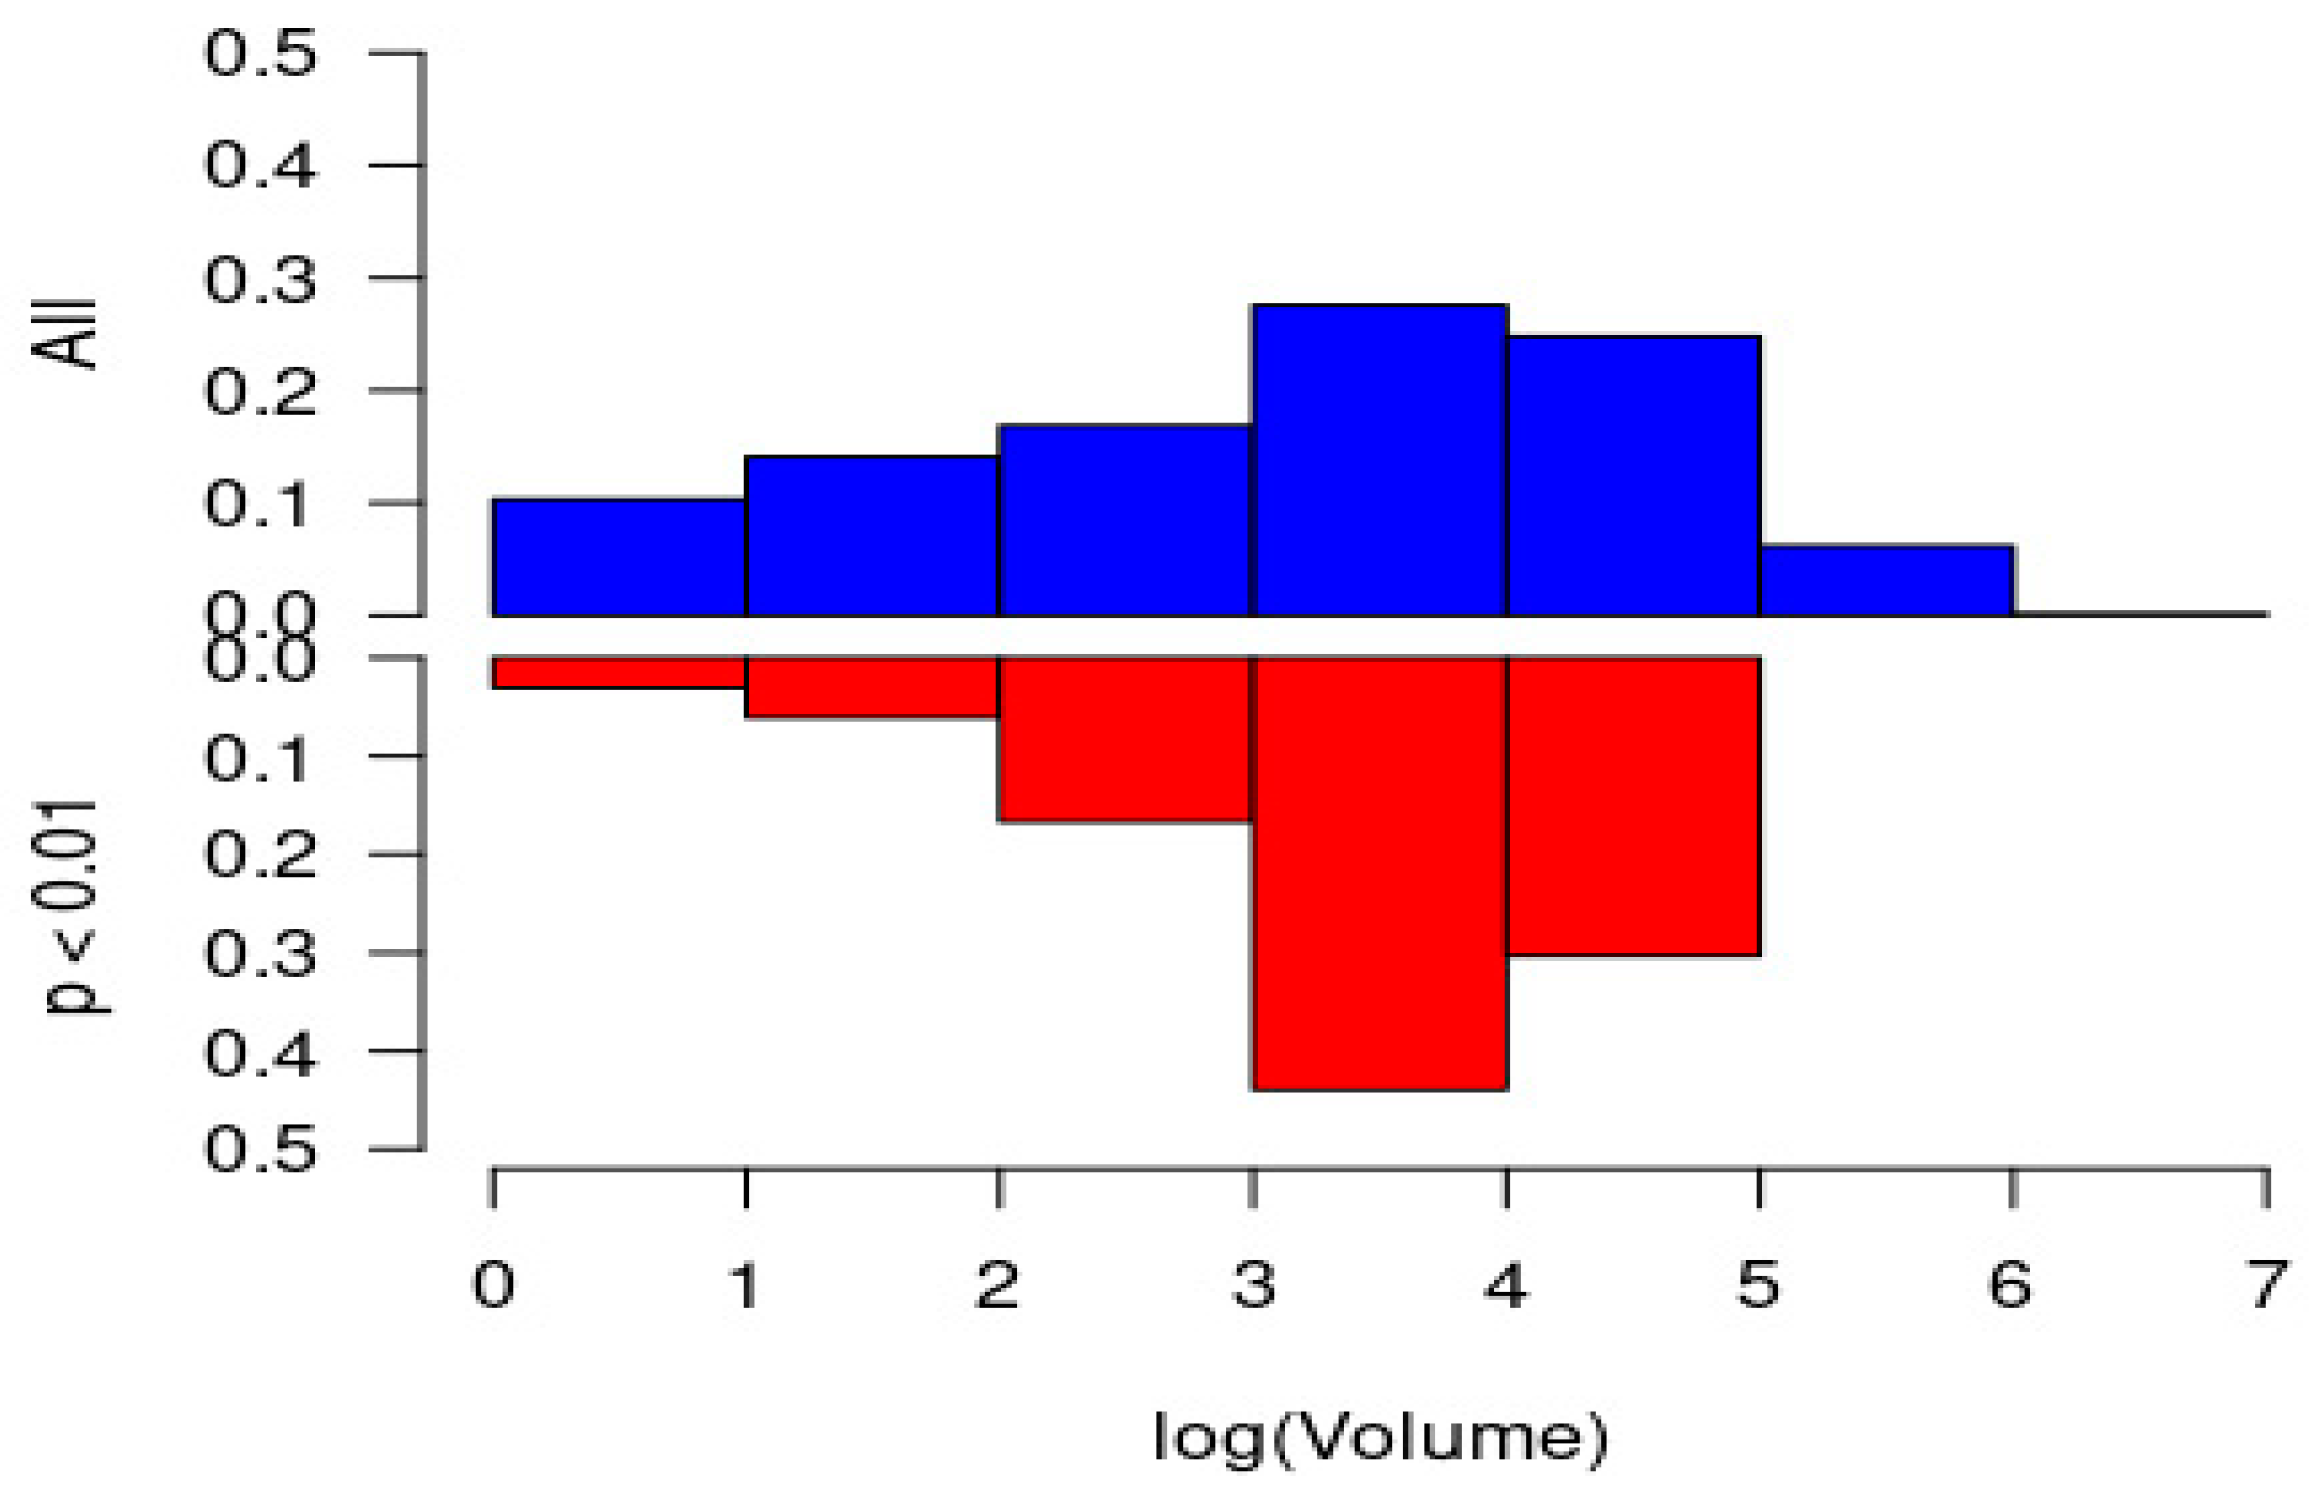
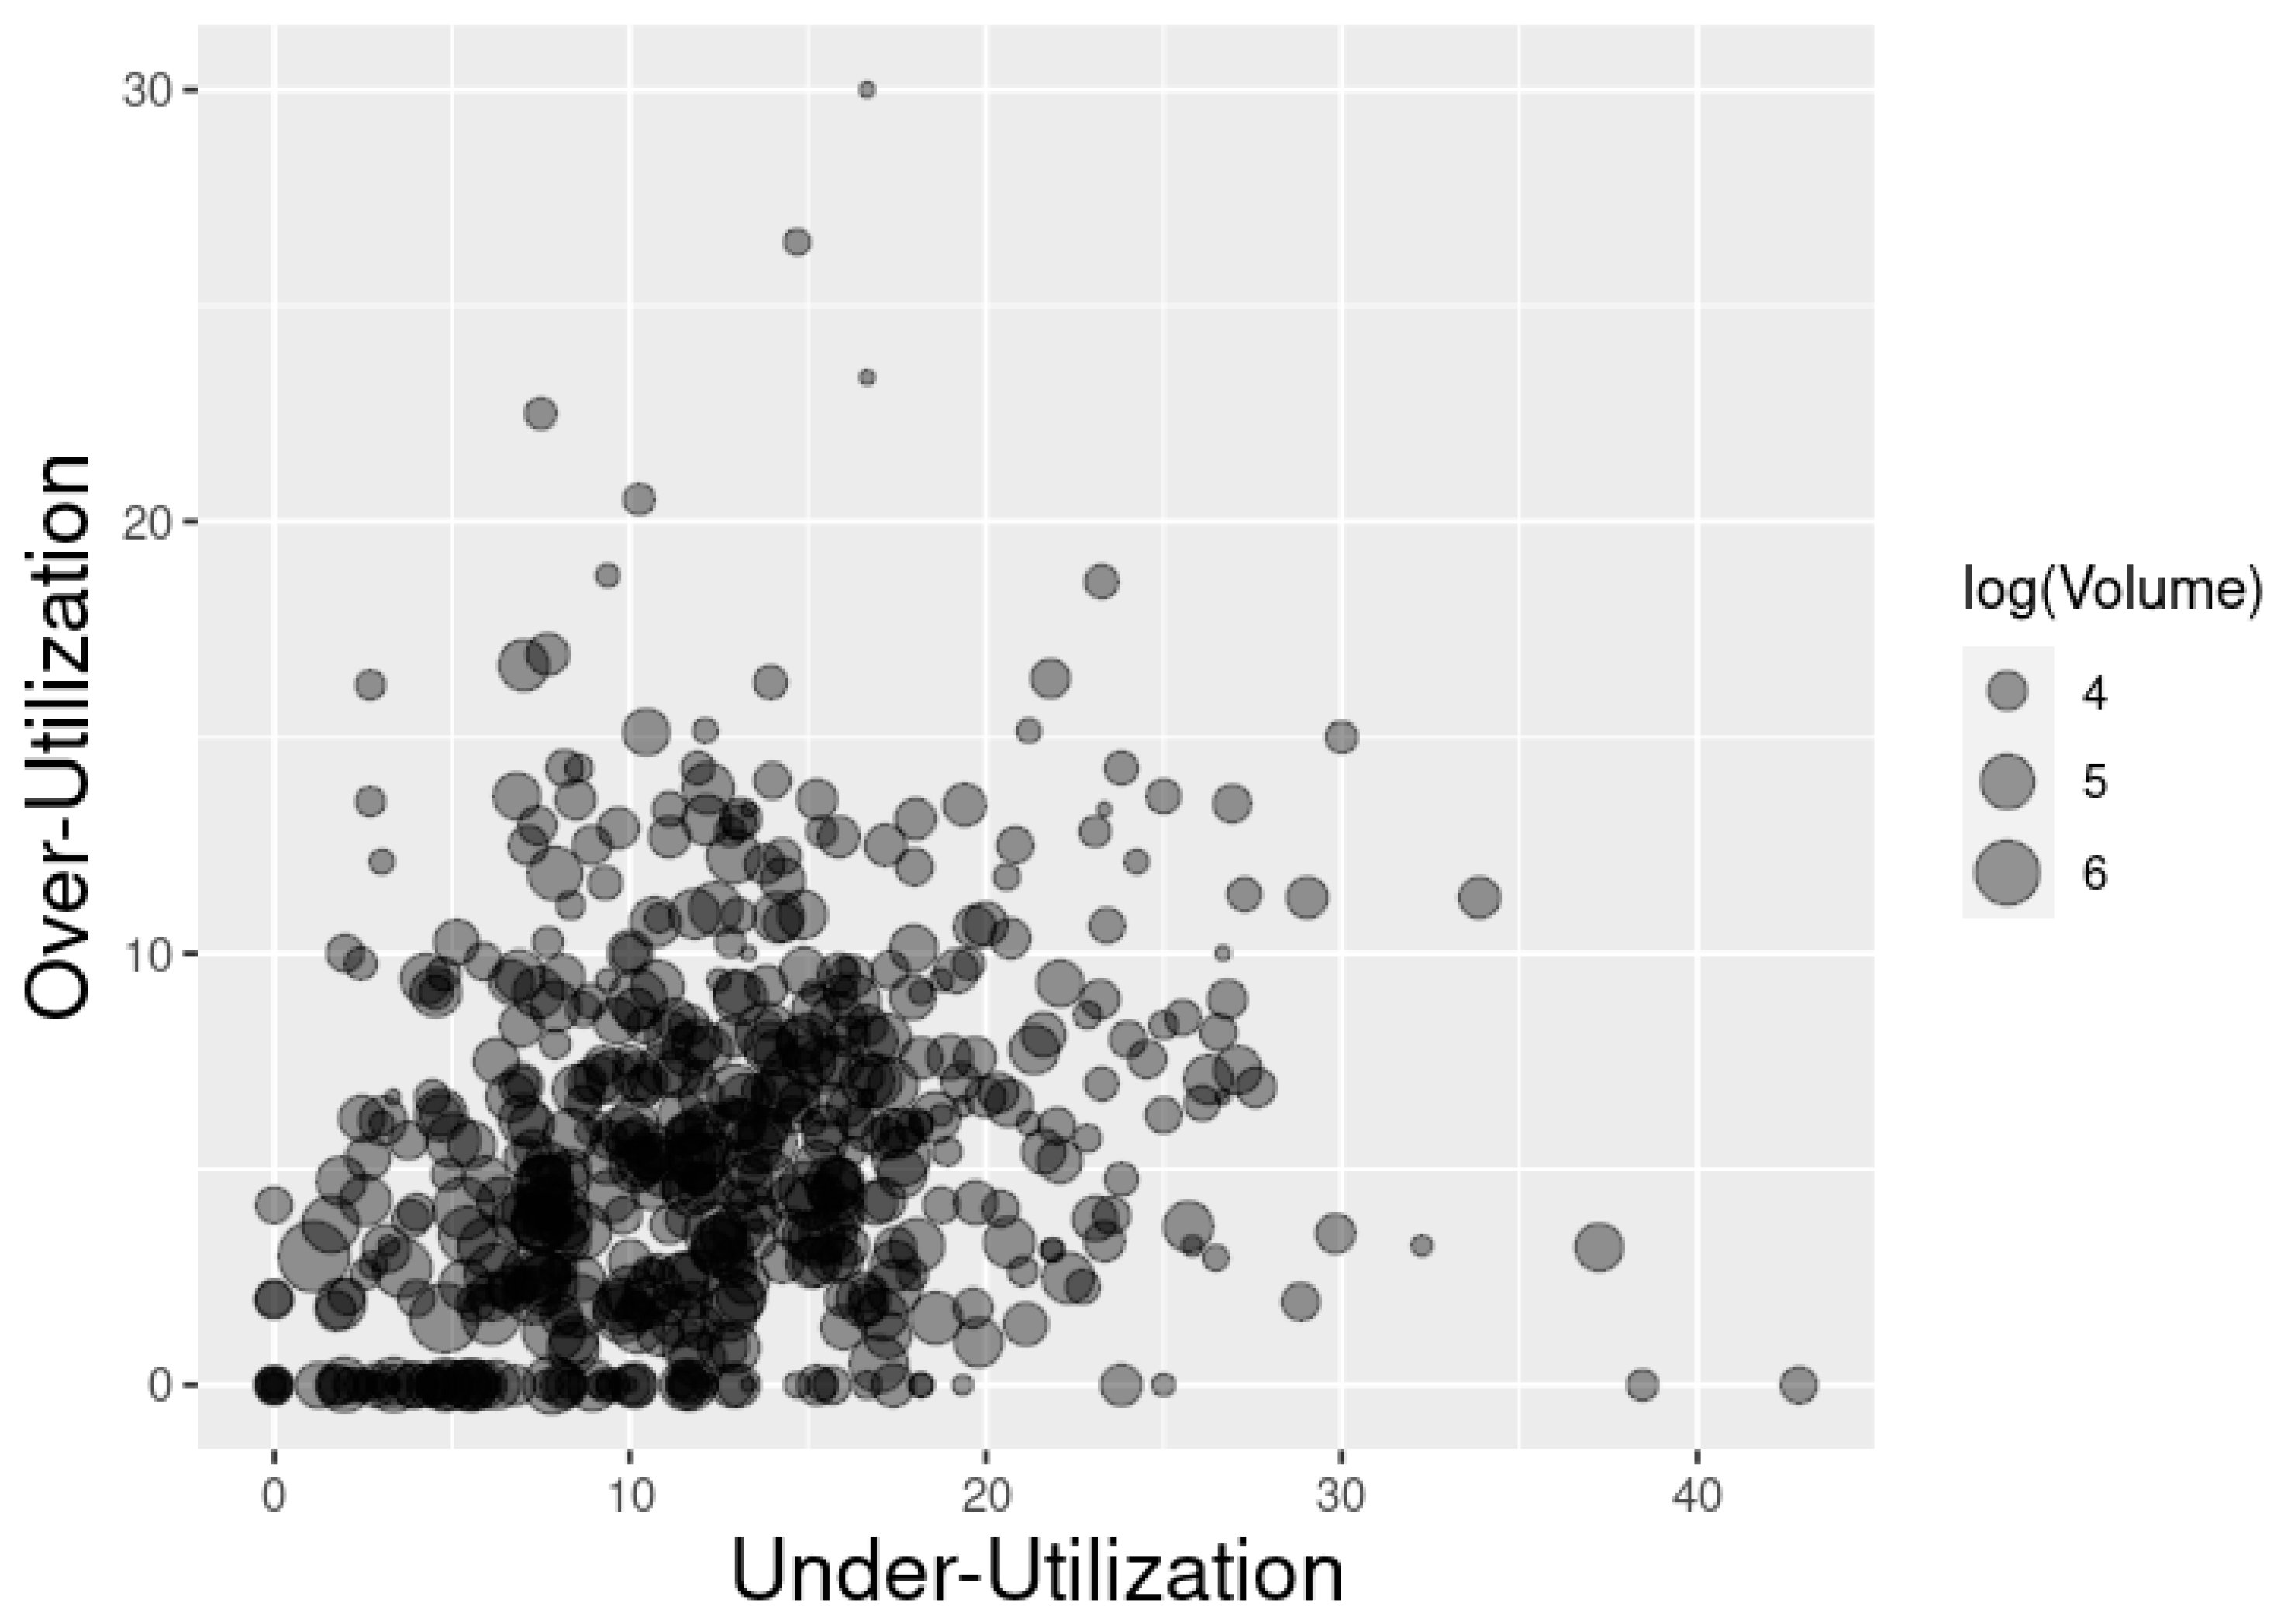
3.3. Misutilization
4. Discussion
Strengths and Limitations
5. Conclusions
Supplementary Materials
Author Contributions
Funding
Institutional Review Board Statement
Informed Consent Statement
Data Availability Statement
Acknowledgments
Conflicts of Interest
References
- Yale New Haven Services Corporation/Center for Outcomes Research and Evaluation. Overall Hospital Quality Star Rating on Hospital Compare Methodology Report (v3.0); 2017. Available online: https://qualitynet.cms.gov/files/5d0d3a1b764be766b0103ec1?filename=Star_Rtngs_CompMthdlgy_010518.pdf (accessed on 13 October 2021).
- Hendee, W.R.; Becker, G.J.; Borgstede, J.P.; Bosma, J.; Casarella, W.J.; Erickson, B.A.; Maynard, C.D.; Thrall, J.H.; Wallner, P.E. Addressing overutilization in medical imaging. Radiology 2010, 257, 240–245. [Google Scholar] [CrossRef] [PubMed]
- Miles, R.; Wan, F.; Onega, T.L.; Lenderink-Carpenter, A.; O’Meara, E.S.; Zhu, W.; Henderson, L.M.; Haas, J.S.; Hill, D.A.; Tosteson, A.N.A.; et al. Underutilization of supplemental magnetic resonance imaging screening among patients at high breast cancer risk. J. Women’s Health 2018, 27, 748–754. [Google Scholar] [CrossRef] [PubMed]
- Oakes, A.H.; Sharma, R.; Jackson, M.; Segal, J.B. Determinants of the overuse of imaging in low-risk prostate cancer: A systematic review. Urol. Oncol. 2017, 35, 647–658. [Google Scholar] [CrossRef] [PubMed]
- Leggett, L.E.; Khadaroo, R.G.; Holroyd-Leduc, J.; Lorenzetti, D.L.; Hanson, H.; Wagg, A.; Padwal, R.; Clement, F. Measuring resource utilization: A systematic review of validated self-reported questionnaires. Medicine 2016, 95, e2759. [Google Scholar] [CrossRef]
- Wallihan, D.B.; Stump, T.E.; Callahan, C.M. Accuracy of self-reported health services use and patterns of care among urban order adults. Med. Care 1999, 37, 662–670. [Google Scholar] [CrossRef]
- Wolinsky, F.D.; Miller, T.R.; An, H.; Geweke, J.F.; Wallace, R.B.; Wright, K.B.; Chrischilles, E.A.; Liu, L.; Pavlik, C.B.; Cook, E.A.; et al. Hospital episodes and physician visits: The concordance between self-reports and medicare claims. Med. Care 2007, 45, 300–307. [Google Scholar] [CrossRef] [Green Version]
- Frick, K.D. Microcosting quantity data collection methods. Med. Care 2009, 47 (Suppl. 1), S76–S81. [Google Scholar] [CrossRef] [Green Version]
- Riley, G.F. Administrative and claims records as sources of health care cost data. Med. Care 2009, 47 (Suppl. 1), S51–S55. [Google Scholar] [CrossRef]
- Wallis, C.J.D.; Poon, S.J.; Lai, P.; Podczerwinki, L.; Buntin, M.B. Trends in medicare spending across strata of resource utilization among older individuals in the United States. EClinicalMedicine 2021, 36, 100873. [Google Scholar] [CrossRef]
- Mulcahy, A.W.; Sorbero, M.E.; Mahmud, A.; Wilks, A.; Gildner, J.; Hornsby, A.; Pignotti, A. Measuring Health Care Utilization in Medicare Advantage Encounter Data: Methods, Estimates, and Considerations for Research; RAND Corporation: Santa Monica, CA, USA, 2019; Available online: https://www.rand.org/pubs/research_reports/RR2681.html (accessed on 14 January 2022).
- Stylianos, S. Evidence-based guidelines for resource utilization in children with isolated spleen or liver injury. The APSA trauma committee. J. Pediatr. Surg. 2000, 35, 164–167. [Google Scholar] [CrossRef]
- Anderson, J.L.; Heidenreich, P.A.; Barnett, P.G.; Creager, M.A.; Fonarow, G.C.; Gibbons, R.J.; Halperin, J.L.; Hlatky, M.A.; Jacobs, A.K.; Mark, D.B.; et al. ACC/AHA Statement on Cost/Value Methodology in Clinical Practice Guidelines and Performance Measures: A Report of the American College of Cardiology/American Heart Association Task Force on Performance Measures and Task Force on Practice Guidelines. J. Am. Coll. Cardiol. 2014, 63, 2304–2322. [Google Scholar]
- McKay, A.J.; Gunn, L.H.; Ference, B.A.; Dorresteijn, J.A.N.; Berkelmans, G.F.N.; Visseren, F.L.J.; Ray, K.K. Is the SMART risk prediction model ready for real-world implementation? A validation study in a routine care setting of approximately 380,000 individuals. Eur. J. Prev. Cardiol. 2021, zwab093. [Google Scholar] [CrossRef] [PubMed]
- Breastcancer.org. Breast MRI for Screening. Available online: https://www.breastcancer.org/symptoms/testing/types/mri/screening (accessed on 14 January 2022).
- Centers for Disease Control and Prevention. Healthy People 2020: Legal and Policy Resources Related to Access to Health Services. Available online: https://www.cdc.gov/phlp/publications/topic/hp2020/access.html (accessed on 14 January 2022).
- European Commission. Equality in and Equality of Access to Healthcare Services. Available online: https://www.euro.centre.org/downloads/detail/882 (accessed on 14 January 2022).
- White, D.B. A Model Hospital Policy for Allocating Scarce Critical Care Resources. Available online: https://ccm.pitt.edu/sites/default/files/UnivPittsburgh_ModelHospitalResourcePolicy_2020_04_15.pdf (accessed on 14 January 2022).
- U.S. Department of Health and Human Services, Office of Inspector General. Hospital Experiences Responding to the COVID-19 Pandemic: Results of a National Pulse Survey March 23–27, 2020. Available online: https://oig.hhs.gov/oei/reports/oei-06-20-00300.pdf (accessed on 14 January 2022).
- American Society of Anesthesiologists. Ethics Statement on Resource Allocation in a Pandemic. Available online: https://www.asahq.org/in-the-spotlight/coronavirus-covid-19-information/ethics-statement-on-resource-allocation (accessed on 14 January 2022).
- Joshi, R.P.; Pejaver, V.; Hammarlund, N.E.; Sung, H.; Lee, S.K.; Furmanchuk, A.; Lee, H.-Y.; Scott, G.; Gombar, S.; Shah, N.; et al. A predictive tool for identification of SARS-CoV-2 PCR-negative emergency department patients using routine test results. J. Clin. Virol. 2020, 129, 104502. [Google Scholar] [CrossRef]
- University of California Critical Care Bioethics Working Group. Allocation of Scarce Critical Resources under Crisis Standards of Care. Available online: https://www.ucop.edu/uc-health/reports-resources/uc-critical-care-bioethics-working-group-report-rev-6-17-20.pdf (accessed on 14 January 2022).
- Emanuel, E.J.; Persad, G.; Upshur, R.; Thome, B.; Parker, M.; Glickman, A.; Zhang, C.; Boyle, C.; Smith, M.; Phillips, J.P. Fair allocation of scarce medical resources in the time of COVID-19. N. Engl. J. Med. 2020, 382, 2049–2055. [Google Scholar] [CrossRef] [PubMed]
- Scatliff, J.H.; Morris, P.J. From Roentgen to magnetic resonance imaging: The history of medical imaging. N. Carol. Med. J. 2014, 75, 111–113. [Google Scholar] [CrossRef]
- Society of Nuclear Medicine & Molecular Imaging. Physician Quality Reporting System (PQRS). Available online: https://www.snmmi.org/ClinicalPractice/content.aspx?ItemNumber=10453 (accessed on 13 November 2021).
- Abujudeh, H.H.; Kaewlai, R.; Asfaw, B.A.; Thrall, J.H. Quality Initiatives: Key performance indicators for measuring and improving radiology department performance. RadioGraphics 2010, 30, 571–583. [Google Scholar] [CrossRef] [Green Version]
- Makarov, D.V.; Soulos, P.R.; Gold, H.T.; Yu, J.B.; Sen, S.; Ross, J.S.; Gross, C.P. Regional-level correlations in inappropriate imaging rates for prostate and breast cancers: Potential implications for the Choosing Wisely Campaign. JAMA Oncol. 2015, 1, 185–194. [Google Scholar] [CrossRef]
- Prasad, S.M.; Gu, X.; Lipsitz, S.R.; Nguyen, P.L.; Hu, J.C. Inappropriate utilization of radiographic imaging in men with newly diagnosed prostate cancer in the United States. Cancer 2012, 118, 1260–1267. [Google Scholar] [CrossRef] [Green Version]
- Schatten, H. Brief overview of prostate cancer statistics, grading, diagnosis and treatment strategies. Adv. Exp. Med. Biol. 2018, 1095, 1–14. [Google Scholar] [CrossRef]
- Abdellaoui, A.; Iyengar, S.; Freeman, S. Imaging in prostate cancer. Future Oncol. 2011, 7, 679–691. [Google Scholar] [CrossRef]
- Mariotto, A.B.; Yabroff, K.R.; Shao, Y.; Feuer, E.J.; Brown, M.L. Projections of the cost of cancer care in the United States: 2010–2020. J. Natl. Cancer Inst. 2011, 103, 117–128. [Google Scholar] [CrossRef] [PubMed] [Green Version]
- Pinto, F.; Totaro, A.; Calarco, A.; Sacco, E.; Volpe, A.; Racioppi, M.; D’Addessi, A.; Gulino, G.; Bassi, P. Imaging in prostate cancer diagnosis: Present role and future perspectives. Urol. Int. 2011, 86, 373–382. [Google Scholar] [CrossRef] [PubMed]
- Padhani, A.R.; Lecouvet, F.E.; Tunariu, N.; Koh, D.-M.; De Keyzer, F.; Collins, D.J.; Sala, E.; Fanti, S.; Vargas, H.A.; Petralia, G.; et al. Rationale for modernising imaging in advanced prostate cancer. Eur. Urol. Focus 2017, 3, 223–239. [Google Scholar] [CrossRef] [PubMed] [Green Version]
- Fütterer, J.J.; Barentsz, J.; Heijmijnk, S.T. Imaging modalities for prostate cancer. Expert Rev. Anticancer Ther. 2009, 9, 923–937. [Google Scholar] [CrossRef]
- Agency for Healthcare Research and Quality. Quality Indicator User Guide: Patient Safety Indicators (PSI) Composite Measures: Version 2020; Agency for Healthcare Research and Quality: Rockville, MD, USA, 2020. Available online: https://qualityindicators.ahrq.gov/Downloads/Modules/PSI/V2020/PSI_Composite_Development.pdf (accessed on 13 October 2021).
- Premier Applied Sciences. Premier Healthcare Database White Paper: Data That Informs and Performs; Premier Inc.: Charlotte, NC, USA, 2020; Available online: https://learn.premierinc.com/white-papers/premier-healthcare-database-whitepaper (accessed on 20 July 2021).
- World Health Organization ICD-10 Version: 2010. Available online: https://icd.who.int/browse10/2010/en#/C61 (accessed on 18 November 2021).
- Elixhauser, A.; Steiner, C.; Harris, D.R.; Coffey, R.M. Comorbidity measures for use with administrative data. Med. Care 1998, 36, 8–27. [Google Scholar] [CrossRef]
- Ullrich, M.; LaBond, V.; Britt, T.; Bishop, K.; Barber, K. Influence of emergency department patient volumes on CT utilization rate of the physician in triage. Am. J. Emerg. Med. 2021, 39, 11–14. [Google Scholar] [CrossRef]
- Ajayi, A.; Hwang, W.-T.; Vapiwala, N.; Rosen, M.; Chapman, C.H.; Both, S.; Shah, M.; Wang, X.; Agawu, A.; Gabriel, P.; et al. Disparities in staging prostate magnetic resonance imaging utilization for nonmetastatic prostate cancer patients undergoing definitive radiation therapy. Adv. Radiat. Oncol. 2016, 1, 325–332. [Google Scholar] [CrossRef] [Green Version]
- Akin, O.; Hricak, H. Imaging of prostate cancer. Radiol. Clin. N. Am. 2007, 45, 207–222. [Google Scholar] [CrossRef]
- Prostate Cancer Foundation. Grading Your Cancer. Available online: https://www.pcf.org/about-prostate-cancer/diagnosis-staging-prostate-cancer/gleason-score-isup-grade/ (accessed on 13 November 2021).


| Characteristics | Count/Mean (%/SD) |
|---|---|
| Length of Stay (days) | 4.57 (5.44) |
| Cost-type: Procedural | 30,559 (59.79) |
| Prostate Cancer as Principal ICD-10 Classification | 14,817 (28.99) |
| Age (years) | |
| ≤45 | 170 (0.33) |
| 46–50 | 597 (1.17) |
| 51–55 | 1977 (3.87) |
| 56–60 | 4408 (8.62) |
| 61–65 | 6977 (13.65) |
| 66–70 | 8234 (16.11) |
| 71–75 | 8168 (15.98) |
| 76–80 | 7305 (14.29) |
| 81–85 | 6155 (12.04) |
| >85 | 7120 (13.93) |
| Race | |
| American Indian | 206 (0.40) |
| Asian | 929 (1.82) |
| Black | 8572 (16.77) |
| Pacific Islander | 200 (0.39) |
| Unknown | 1037 (2.03) |
| White | 36,848 (72.09) |
| Other | 3319 (6.49) |
| Payor type | |
| Charity or Indigent | 71 (0.14) |
| Commercial Indemnity | 2706 (5.29) |
| Direct Employer Contract | 96 (0.19) |
| Managed Care Capitated | 168 (0.33) |
| Managed Care Non-Capitated | 8223 (16.09) |
| Medicaid Managed Care Capitated | 264 (0.52) |
| Medicaid Managed Care Non-Capitated | 1209 (2.37) |
| Medicaid Traditional | 716 (1.40) |
| Medicare Managed Care Capitated | 3373 (6.60) |
| Medicare Managed Care Non-Capitated | 9615 (18.81) |
| Medicare Traditional | 22,077 (43.19) |
| Other Government Payors | 1245 (2.44) |
| Self Pay | 439 (0.86) |
| Workers Compensation | 63 (0.12) |
| Other | 846 (1.66) |
| Point of Origin 1 | |
| Clinic | 7255 (14.19) |
| Court/Law Enforcement | 38 (0.07) |
| Information Not Available | 431 (0.84) |
| Non-Healthcare Facility (Physician Referral) | 39,417 (77.12) |
| Transfer from a Hospital (Different Facility) | 2607 (5.10) |
| Transfer from SNF 2 or ICF 3 | 675 (1.32) |
| Transfer from Ambulatory Surgical Center | 51 (0.10) |
| Transfer from Another Healthcare Facility | 427 (0.84) |
| Transfer from Hospice and is Under a Hospice Plan of Care or Enrolled in a Hospice Program | 15 (0.03) |
| Transfer from Hospital Inpatient in the Same Facility Resulting in a Separate Claim to the Payor | 195 (0.38) |
| Discharge Status | |
| Court/Law Enforcement | 65 (0.13) |
| Expired | 1673 (3.27) |
| Home Health Organization | 7732 (15.13) |
| Home or Self Care | 29,527 (57.77) |
| Hospice Home | 1414 (2.77) |
| Hospice Medical Facility | 1100 (2.15) |
| Left Against Medical Advice | 241 (0.47) |
| Transferred to a Long-Term Care Hospital | 235 (0.46) |
| Transferred to Another Rehabilitation Facility | 1273 (2.49) |
| Transferred to ICF 2 | 185 (0.36) |
| Transferred to Other Facility | 712 (1.39) |
| Transferred to SNF 3 | 6478 (12.67) |
| Transferred to Swing Bed | 124 (0.24) |
| Other | 352 (0.69) |
| Medicare Severity Diagnosis Related Groups (MS-DRGs) | |
| Acute Myocardial Infarction (Discharged Alive) | 575 (1.13) |
| Cardiac Arrhythmia Conduction Disorders | 732 (1.43) |
| Esophagitis, Gastroenteritis and Miscellaneous Digestive Disorders | 558 (1.09) |
| Gastrointestinal Hemorrhage | 937 (1.83) |
| Heart Failure (Shock) | 1375 (2.69) |
| Infectious Parasitic Diseases with Operating Room Procedure | 560 (1.10) |
| Intracranial Hemorrhage or Cerebral Infarction | 775 (1.52) |
| Kidney/Urinary Tract Infections | 891 (1.74) |
| Major Joint Replacement or Reattachment of Lower Extremity | 758 (1.48) |
| Major Male Pelvic Procedures | 12,795 (25.03) |
| Malignancy of Male Reproductive System | 1104 (2.16) |
| Miscellaneous Disorders of Nutrition Metabolism Fluids Electrolytes | 720 (1.41) |
| Other Kidney/Urinary Tract Diagnoses | 1521 (2.98) |
| Pathological Fractures Musculoskeletal Connective Tissue Malignancy | 832 (1.63) |
| Percutaneous Cardiovascular Procedure with Stent | 594 (1.16) |
| Renal Failure | 1514 (2.96) |
| Septicemia or Severe Sepsis without Mechanical Ventilation > 96 h | 3749 (7.34) |
| Simple Pneumonia Pleurisy | 944 (1.85) |
| Other | 20,177 (39.48) |
| Comorbidities | |
| Alcohol Abuse | 1672 (3.27) |
| Anemia Deficiency | 2394 (4.68) |
| Cardiac Arrhythmia | 14,830 (29.02) |
| Chronic Pulmonary Disease | 9784 (19.14) |
| Coagulopathy | 4546 (8.89) |
| Congestive Heart Failure | 9915 (19.40) |
| Depression | 4496 (8.80) |
| Diabetes-Complicated | 8258 (16.16) |
| Diabetes-Uncomplicated | 6411 (12.54) |
| Drug Abuse | 1007 (1.97) |
| Fluid and Electrolyte Disorders | 17,098 (33.45) |
| Hypertension-Complicated | 14,584 (28.53) |
| Hypertension-Uncomplicated | 21,819 (42.69) |
| Hypothyroidism | 4503 (8.81) |
| Liver Disease | 2051 (4.01) |
| Lymphoma | 673 (1.32) |
| Metastatic Cancer | 15,257 (29.85) |
| Obesity | 6232 (12.19) |
| Other Neurological Disorders | 6071 (11.88) |
| Paralysis | 1135 (2.22) |
| Peripheral Vascular Disorders | 4740 (9.27) |
| Pulmonary Circulation Disorders | 2612 (5.11) |
| Renal Failure | 12,320 (24.10) |
| Rheumatoid Arthritis Collagen | 887 (1.74) |
| Valvular Disease | 4235 (8.29) |
| Weight Loss | 5459 (10.68) |
| Competing Imaging Resources | |
| CT Scans (Excluding Outcome Resource) | 18,630 (36.45) |
| MRIs and MRAs 4 | 5158 (10.09) |
| Miscellaneous Imaging | 841 (1.65) |
| Nuclear Medicine | 2826 (5.53) |
| Special Imaging Techniques—All Imaging | 3384 (6.62) |
| Ultrasounds | 6493 (12.70) |
| X-rays | 28,969 (56.68) |
| Outcome Imaging Resource | |
| CT Scan of Pelvis/Abdomen without Contrast | 5990 (11.72) |
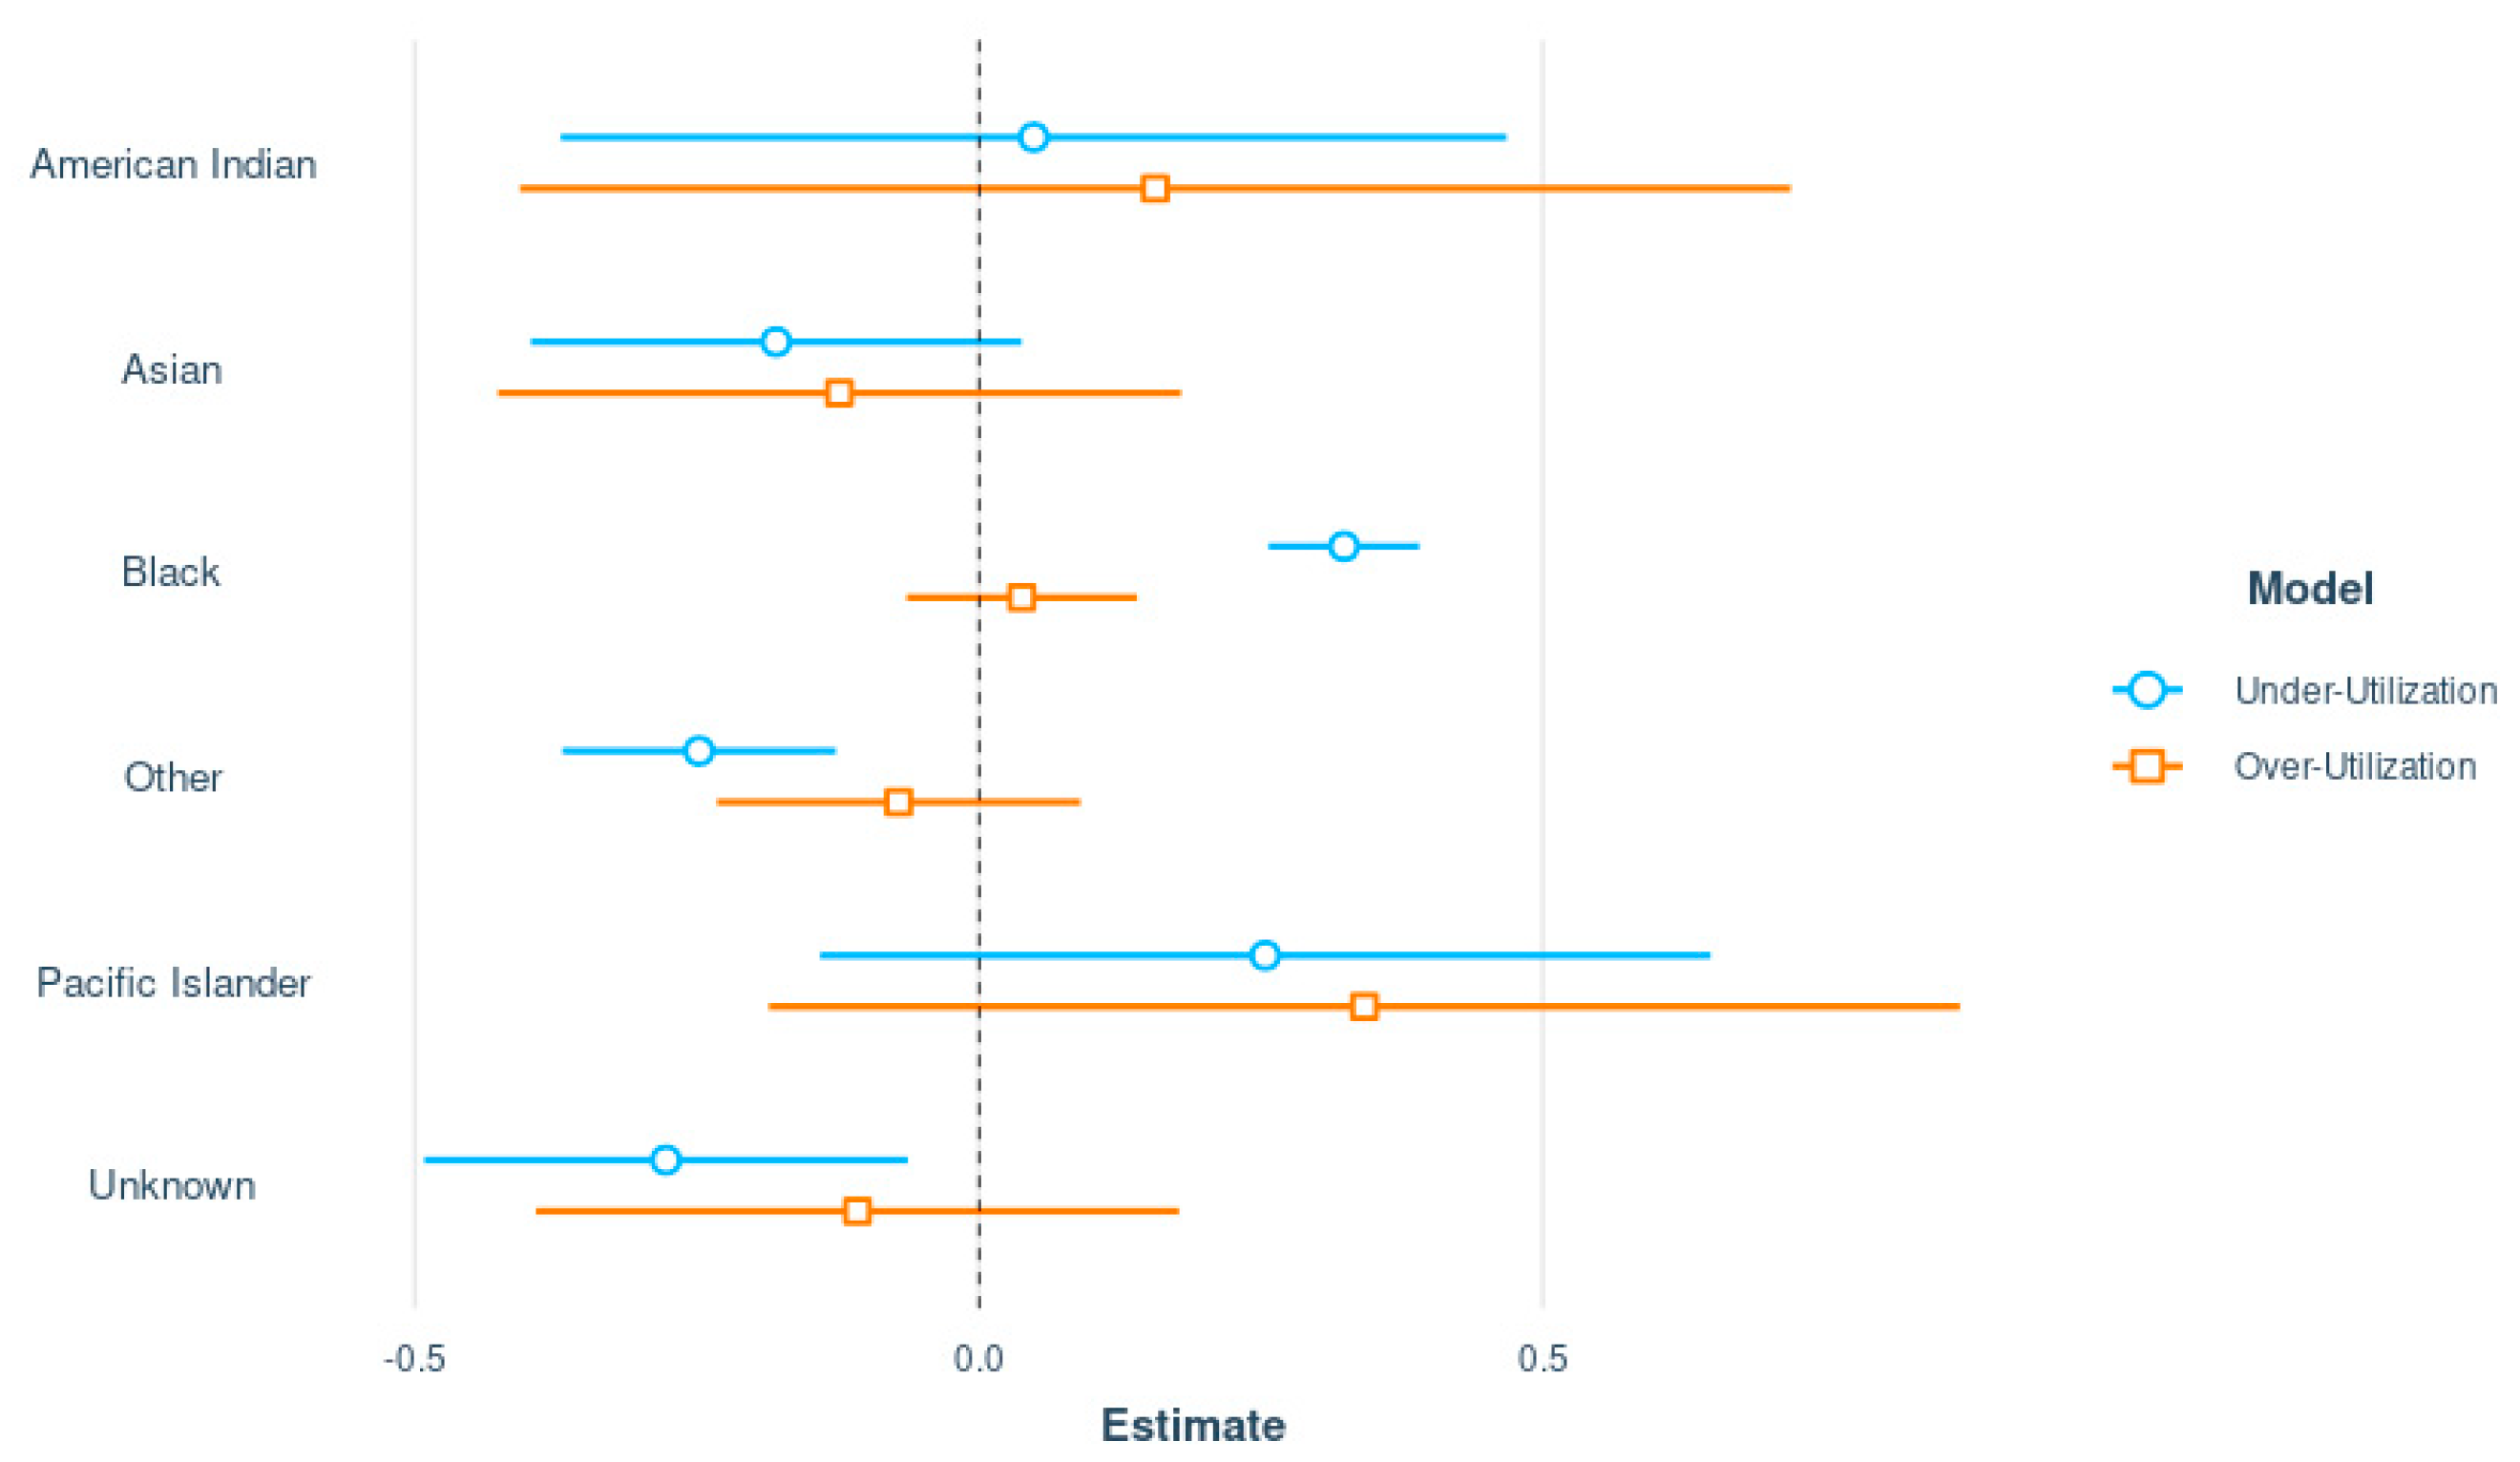
| Race | Under-Utilization | Over-Utilization | ||||
|---|---|---|---|---|---|---|
| OR | 95% CI | p | OR | 95% CI | p | |
| American Indian | 1.05 | 0.67–1.57 | 0.8200 | 1.17 | 0.63–1.97 | 0.5864 |
| Asian | 0.84 | 0.67–1.03 | 0.1055 | 0.88 | 0.64–1.18 | 0.4236 |
| Black | 1.38 | 1.29–1.48 | <0.0001 | 1.04 | 0.94–1.15 | 0.4648 |
| Pacific Islander | 1.29 | 0.85–1.88 | 0.2075 | 1.41 | 0.80–2.30 | 0.2045 |
| Unknown | 0.76 | 0.61–0.93 | 0.0112 | 0.90 | 0.67–1.18 | 0.4590 |
| Other | 0.78 | 0.69–0.88 | <0.0001 | 0.93 | 0.79–1.09 | 0.3872 |
Publisher’s Note: MDPI stays neutral with regard to jurisdictional claims in published maps and institutional affiliations. |
© 2022 by the authors. Licensee MDPI, Basel, Switzerland. This article is an open access article distributed under the terms and conditions of the Creative Commons Attribution (CC BY) license (https://creativecommons.org/licenses/by/4.0/).
Share and Cite
Lunn, Y.; Patel, R.; Sokphat, T.S.; Bourn, L.; Fields, K.; Fitzgerald, A.; Sundaresan, V.; Thomas, G.; Korvink, M.; Gunn, L.H. Assessing Hospital Resource Utilization with Application to Imaging for Patients Diagnosed with Prostate Cancer. Healthcare 2022, 10, 248. https://doi.org/10.3390/healthcare10020248
Lunn Y, Patel R, Sokphat TS, Bourn L, Fields K, Fitzgerald A, Sundaresan V, Thomas G, Korvink M, Gunn LH. Assessing Hospital Resource Utilization with Application to Imaging for Patients Diagnosed with Prostate Cancer. Healthcare. 2022; 10(2):248. https://doi.org/10.3390/healthcare10020248
Chicago/Turabian StyleLunn, Yazmine, Rudra Patel, Timothy S. Sokphat, Laura Bourn, Khalil Fields, Anna Fitzgerald, Vandana Sundaresan, Greeshma Thomas, Michael Korvink, and Laura H. Gunn. 2022. "Assessing Hospital Resource Utilization with Application to Imaging for Patients Diagnosed with Prostate Cancer" Healthcare 10, no. 2: 248. https://doi.org/10.3390/healthcare10020248