
Cognitive Assessment of Japanese Older Adults with Text Data Augmentation

Abstract
:1. Introduction
2. Related Works
2.1. Linguistic Features
2.2. Dealing with Imbalanced Data
3. Method
3.1. Dataset
3.1.1. Dataset Overview
3.1.2. Cognitive Function of the Subject in the Dataset
3.2. Classification Method
3.3. Parameters in Fine Tuning
- –
- Batch size: 1, 2, 4, 8, 16, 32;
- –
- Learning rate: 5 , 3 , 2 ;
- –
- Number of epochs: 4.
3.4. Data Cleansing
3.5. Setting the Stop Word
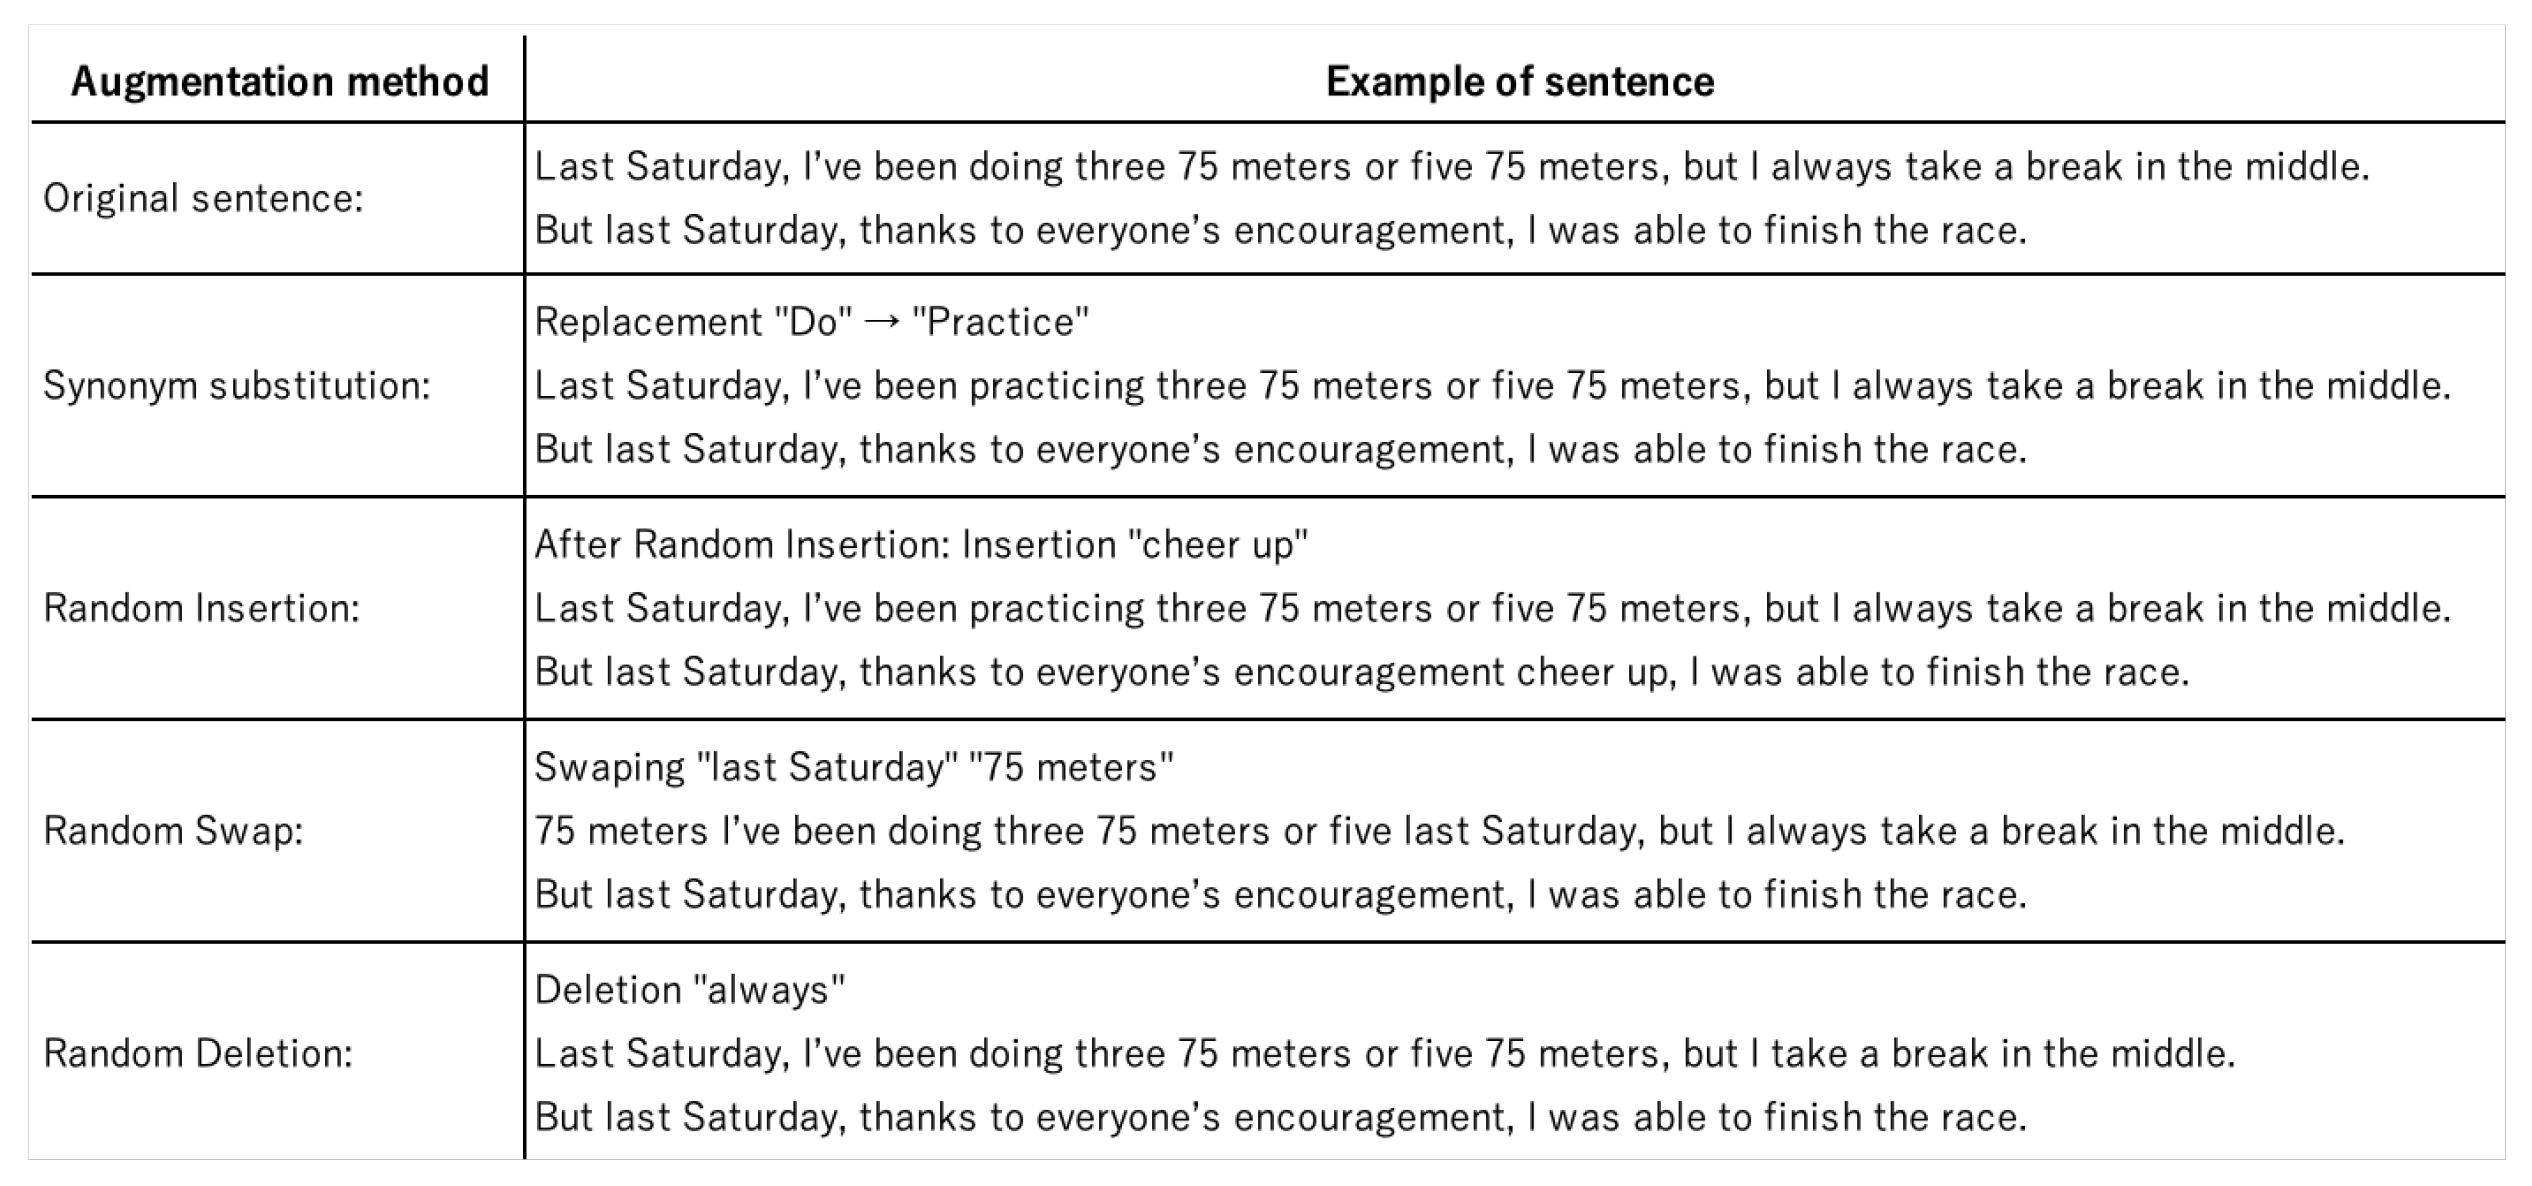
3.6. Easy Data Augmentation (Eda)
4. Evaluation
4.1. Evaluation Method
4.2. Classification Using All Tasks
4.3. Classification Results for Each Task
5. Discussion
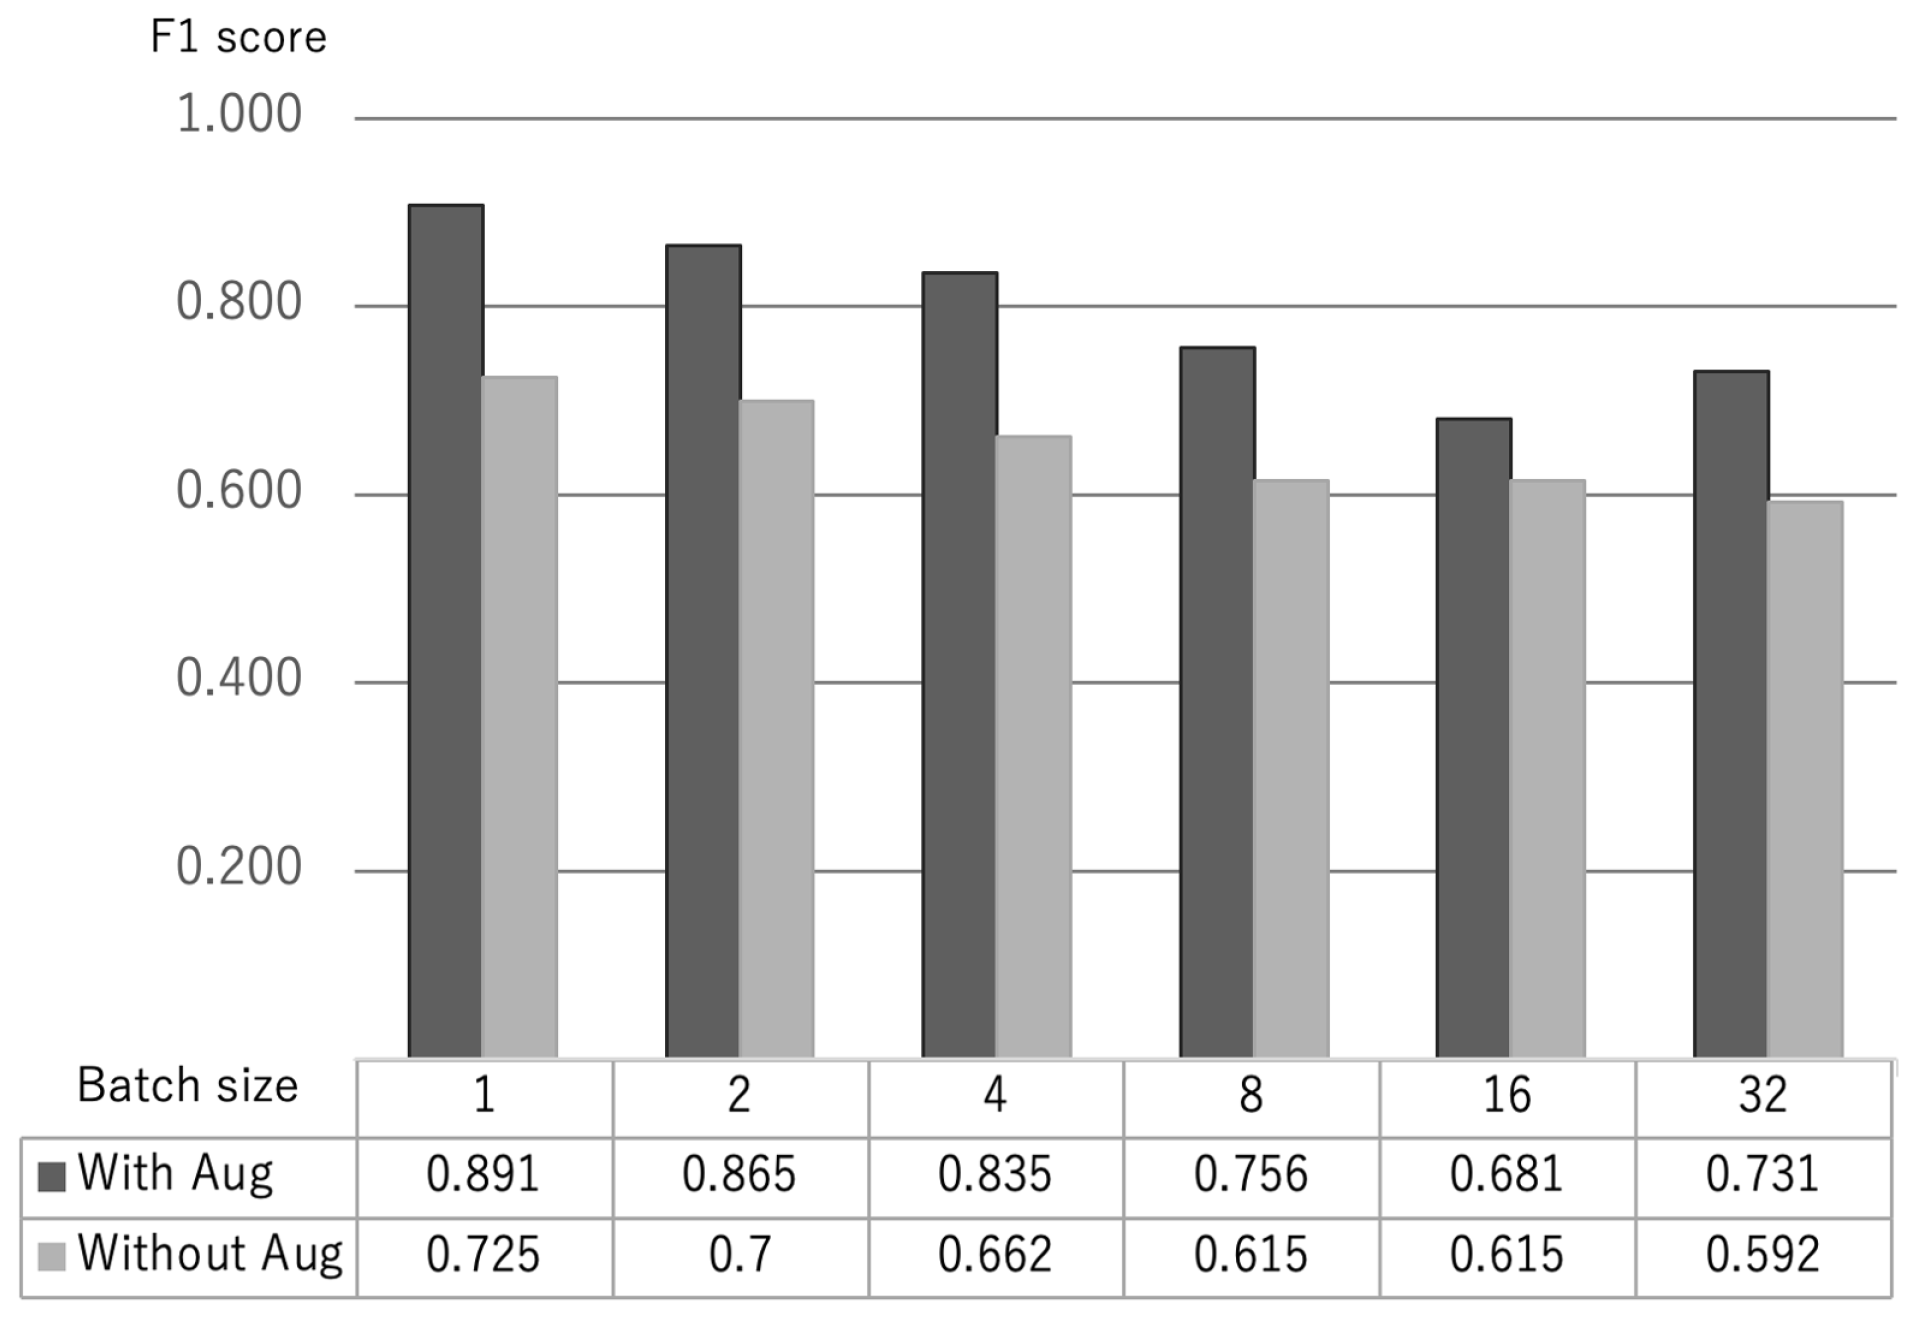
5.1. Effectiveness of Text Augmentation for Cognitive Function Classification
5.2. Parameters for Fine Tuning in BERT
5.3. Individual Task-Based Analysis
6. Limitations
7. Conclusions
Author Contributions
Funding
Institutional Review Board Statement
Informed Consent Statement
Data Availability Statement
Conflicts of Interest
References
- American Psychiatric Association. Diagnostic and Statistical Manual of Mental Disorders, 5th ed.; American Psychiatric Association: Washington, DC, USA, 2013; Volume 21, pp. 591–643. [Google Scholar]
- Stopford, C.L.; Thompson, J.C.; Neary, D.; Richardson, A.M.; Snowden, J.S. Working memory, attention, and executive function in Alzheimer’s disease and frontotemporal dementia. Cortex 2012, 48, 429–446. [Google Scholar] [CrossRef] [PubMed]
- Ministry of Health, Labour and Welfare. Guidelines for Decision-Making Support for People with Dementia in Daily Life and Social Life. Available online: https://www.mhlw.go.jp/file/06-Seisakujouhou-12300000-Roukenkyoku/0000212396.pdf (accessed on 5 September 2022).
- Breijyeh, Z.; Karaman, R. Comprehensive Review on Alzheimer’s Disease: Causes and Treatment. Molecules 2020, 25, 5789. [Google Scholar] [CrossRef] [PubMed]
- Cummings, J.; Lee, G.; Ritter, A.; Zhong, K. Alzheimer’s disease drug development pipeline: 2018. Alzheimer’s Dement. Transl. Res. Clin. Interv. 2018, 4, 195–214. [Google Scholar] [CrossRef]
- Jagust, W. Positron emission tomography and magnetic resonance imaging in the diagnosis and prediction of dementia. Alzheimer’s Dement. 2006, 2, 36–42. [Google Scholar] [CrossRef]
- Arevalo-Rodriguez, I.; Smailagic, N.; Figuls, M.R.; Ciapponi, A.; Sanchez-Perez, E.; Giannakou, A.; Pedraza, O.L.; Cosp, X.B.; Cullum, S. Mini-Mental State Examination (MMSE) for the detection of Alzheimer’s disease and other dementias in people with mild cognitive impairment (MCI). Cochrane Database Syst. Rev. 2015, 3, CD010783. [Google Scholar]
- Shinji, K. Development of the revised Hasegawa brief intelligence rating scale (HDS-R). Geriatr. Psychiatr. 1991, 2, 1339–1347. [Google Scholar]
- Tiberti, C.; Sabe, L.; Kuzis, G.; Cuerva, A.G.; Leiguarda, R.; Starkstein, S.E. Prevalence and correlates of the catastrophic reaction in Alzheimer’s disease. Neurology 1998, 50, 546–548. [Google Scholar] [CrossRef]
- Snowdon, D.A.; Kemper, S.J.; Mortimer, J.A.; Greiner, L.H.; Wekstein, D.R.; Markesbery, W.R. Linguistic ability in early life and cognitive function and Alzheimer’s disease in late life: Findings from the Nun Study. JAMA 1996, 275, 528–532. [Google Scholar] [CrossRef]
- Jarrold, W.L.; Peintner, B.; Yeh, E.; Krasnow, R.; Javitz, H.S.; Swan, G.E. Language analytics for assessing brain health: Cognitive impairment, depression and pre-symptomatic Alzheimer’s disease. In BI 2010: Brain Informatics; Springer: Berlin/Heidelberg, Germany, 2010. [Google Scholar]
- Orimaye, O.S.; Wong, J.S.; Golden, K.J. Learning predictive linguistic features for Alzheimer’s disease and related dementias using verbal utterances. In Proceedings of the Workshop on Computational Linguistics and Clinical Psychology: From Linguistic Signal to Clinical Reality, Baltimore, MD, USA, 27 June 2014; Available online: https://aclanthology.org/W14-3210/ (accessed on 5 September 2022).
- Voleti, R.; Liss, J.M.; Berisha, V. A review of automated speech and language features for assessment of cognitive and thought disorders. IEEE J. Sel. Top. Signal Process. 2019, 14, 282–298. [Google Scholar] [CrossRef] [Green Version]
- de la Fuente, G.S.; Ritchie, C.G.; Saturnino, L. Artificial intelligence, speech, and language processing approaches to monitoring Alzheimer’s disease: A systematic review. J. Alzheimer’s Dis. 2020, 78, 1547–1574. [Google Scholar] [CrossRef]
- Asgari, M.; Kaye, J.; Dodge, H. Predicting mild cognitive impairment from spontaneous spoken utterances. Alzheimer’s Dementia: Transl. Res. Clin. Interv. 2017, 3, 219–228. [Google Scholar] [CrossRef] [PubMed]
- Fraser, K.C.; Meltzer, J.A.; Rudzicz, F. Linguistic features identify Alzheimer ’s disease in narrative speech. J. Alzheimer’s Dis. 2016, 49, 407–422. [Google Scholar] [CrossRef] [PubMed]
- Kemper, S.; Thompson, M.; Marquis, J. Longitudinal change in language production: Effects of aging and dementia on grammatical complexity and propositional content. Psychol. Aging 2001, 16, 600. [Google Scholar] [CrossRef] [PubMed]
- Fraser, K.; Fors, K.L. Improving the Sensitivity and Specificity of MCI Screening with Linguistic Information. In Proceedings of the 11th International Conference on Language Resources and Evaluation (LREC 2018), Paris, France, 7–12 May 2018; Kokkinakis, D., Ed.; European Language Resources Association (ELRA): Paris, France, 2018. [Google Scholar]
- Karmaker, S.K.; Hassan, M.M.; Smith, M.J.; Xu, L.; Zhai, C.; Veeramachaneni, K. Automl to date and beyond: Challenges and opportunities. ACM Comput. Surv. (CSUR) 2021, 54, 1–36. [Google Scholar] [CrossRef]
- Mueller, K.D.; Hermann, B.; Mecollari, J.; Turkstra, L.S. Connected speech and language in mild cognitive impairment and Alzheimer’s disease: A review of picture description tasks. J. Clin. Exp. Neuropsychol. 2018, 40, 917–939. [Google Scholar] [CrossRef]
- Ganganwar, V. An overview of classification algorithms for imbalanced datasets. Int. J. Emerg. Technol. Adv. Eng. 2012, 2, 42–47. [Google Scholar]
- Shorten, C.; Khoshgoftaar, T.M. A survey on image data augmentation for deep learning. J. Big Data 2019, 6, 1–48. [Google Scholar] [CrossRef]
- Wei, J.; Zou, K. Eda: Easy data augmentation techniques for boosting performance on text classification tasks. arXiv 2019, arXiv:1901.11196. [Google Scholar]
- Oshima, H.; Nakamura, S.; Tanaka, K. Slothlib: A programming library for web search research. DBSJ Lett. 2007, 6, 113–116. [Google Scholar]
- Shibata, D.; Ito, K.; Shoji, W.; Osamu, A. Construction of a Corpus of Elderly People with Control Groups and Development of a Screening Technique for Preliminary Dementia Using the Corpus. Trans. Jpn. Soc. Artif. Intell. 2019, 34. Available online: https://www.jstage.jst.go.jp/article/tjsai/34/4/34_B-J11/_article/-char/ja (accessed on 5 September 2022).
- Goodglass, H.; Kaplan, E. The Assessment of Aphasia and Related Disorders; Lea & Febiger: Palo Alto, CA, USA, 1983. [Google Scholar]
- Kaufer, D.I.; Williams, C.S.; Braaten, A.J.; Gill, K.; Zimmerman, S.; Sloane, P.D. Cognitive screening for dementia and mild cognitive impairment in assisted living: Comparison of 3 tests. J. Am. Med Dir. Assoc. 2008, 9, 586–593. [Google Scholar] [CrossRef] [PubMed]
- Saxton, J.; Morrow, L.; Eschman, A.; Archer, G.; Luther, J.; Zuccolotto, A. Computer Assessment of Mild Cognitive Impairment. Postgrad. Med. 2009, 121, 177–185. [Google Scholar] [CrossRef] [PubMed]
- Folstein, M.F.; Folstein, S.E.; McHugh, P.R. Mini-Mental State: A practical method for grading the cognitive state of patients for the clinician. Psychiatr. Res. 1975, 12, 189–198. [Google Scholar] [CrossRef]
- Tsoi, K.K.F.; Chan, J.Y.C.; Hirai, H.W.; Wong, S.Y.S.; Kwok, T.C.Y. Cognitive Tests to Detect Dementia: A Systematic Review and Metaanalysis. JAMA Intern Med. 2015, 175, 1450–1458. [Google Scholar] [CrossRef]
- Devlin, J.; Chang, M.W.; Lee, K.; Toutanova, K. Bert: Pre-training of deep bidirectional transformers for language understanding. arXiv 2018, arXiv:1810.04805. [Google Scholar]
- Sato, T.; Hashimoto, T.; Okumura, M. Implementation of a Word Shared Dictionary mecab-ipadic-NEologd. Implementation of mecab-ipadic-NEologd, a Word Shared Dictionary, and its Effective Use in Information Retrieval. In Proceedings of the 23rd Annual Conference of the Association for Natural Language Processing 2017, Tsukuba, Japan, 13–17 March 2017; Available online: https://www.anlp.jp/proceedings/annual_meeting/2017/pdf_dir/B6-1.pdf (accessed on 5 September 2022).
- Isahara, H.; Bond, F.; Uchimoto, K.; Utiyama, M.; Kanzaki, K. Development of the japanese wordnet. In Proceedings of the 6th International Conference on Language Resources and Evaluation (LREC’08), Marrakech, Morocco, 28–30 May 2008. [Google Scholar]
- Grimm, P. Social desirability bias. In Wiley International Encyclopedia of Marketing; Wiley: Hoboken, NJ, USA, 2010. [Google Scholar]


| No. | Content of Questions |
|---|---|
| (1) | 1a: Recent sad event |
| (2) | 1b: When did it happen? |
| (3) | 2a: Recent event that made you feel anxious |
| (4) | 3a: Recent event that made you angry |
| (5) | 4a: Recent event that made you feel disgusted |
| (6) | 5a: Recent surprising event |
| (7) | 6a: Recent pleasant event |
| (8) | 6b: When did it happen |
| (9) | 7a: People you admire |
| (10) | 8a: What you are currently passionate |
| Healthy Older Group | MCI Older Group | Total | |
|---|---|---|---|
| Number of participants | 45 | 15 | 60 |
| Gender ratio | M 23/F 22 | M 8/F 7 | M 31/F 29 |
| Mean age | 73.8 (±4.4) | 73.5 (±5.5) | 73.7 (±4.1) |
| Mean value of MMSE | 29.3 (±0.7) | 25.9 (±1.0) | 28.4 (±1.6) |
| Without Augmentation | With Augmentation | |||
|---|---|---|---|---|
| Task | Rate of Correct Predictions | Number of Test Data | Rate of Correct Predictions | Number of Test Data |
| EP1a | 0.875 | 8 | 0.957 | 188 |
| EP1b | 0.786 | 14 | 0.919 | 185 |
| EP2a | 0.778 | 9 | 0.894 | 180 |
| EP3a | 0.833 | 12 | 0.804 | 179 |
| EP4a | 0.750 | 16 | 0.889 | 199 |
| EP5a | 0.615 | 13 | 0.908 | 173 |
| EP6a | 0.833 | 12 | 0.851 | 174 |
| EP6b | 0.900 | 10 | 0.905 | 199 |
| EP7a | 0.667 | 12 | 0.922 | 179 |
| EP8a | 0.615 | 13 | 0.923 | 169 |
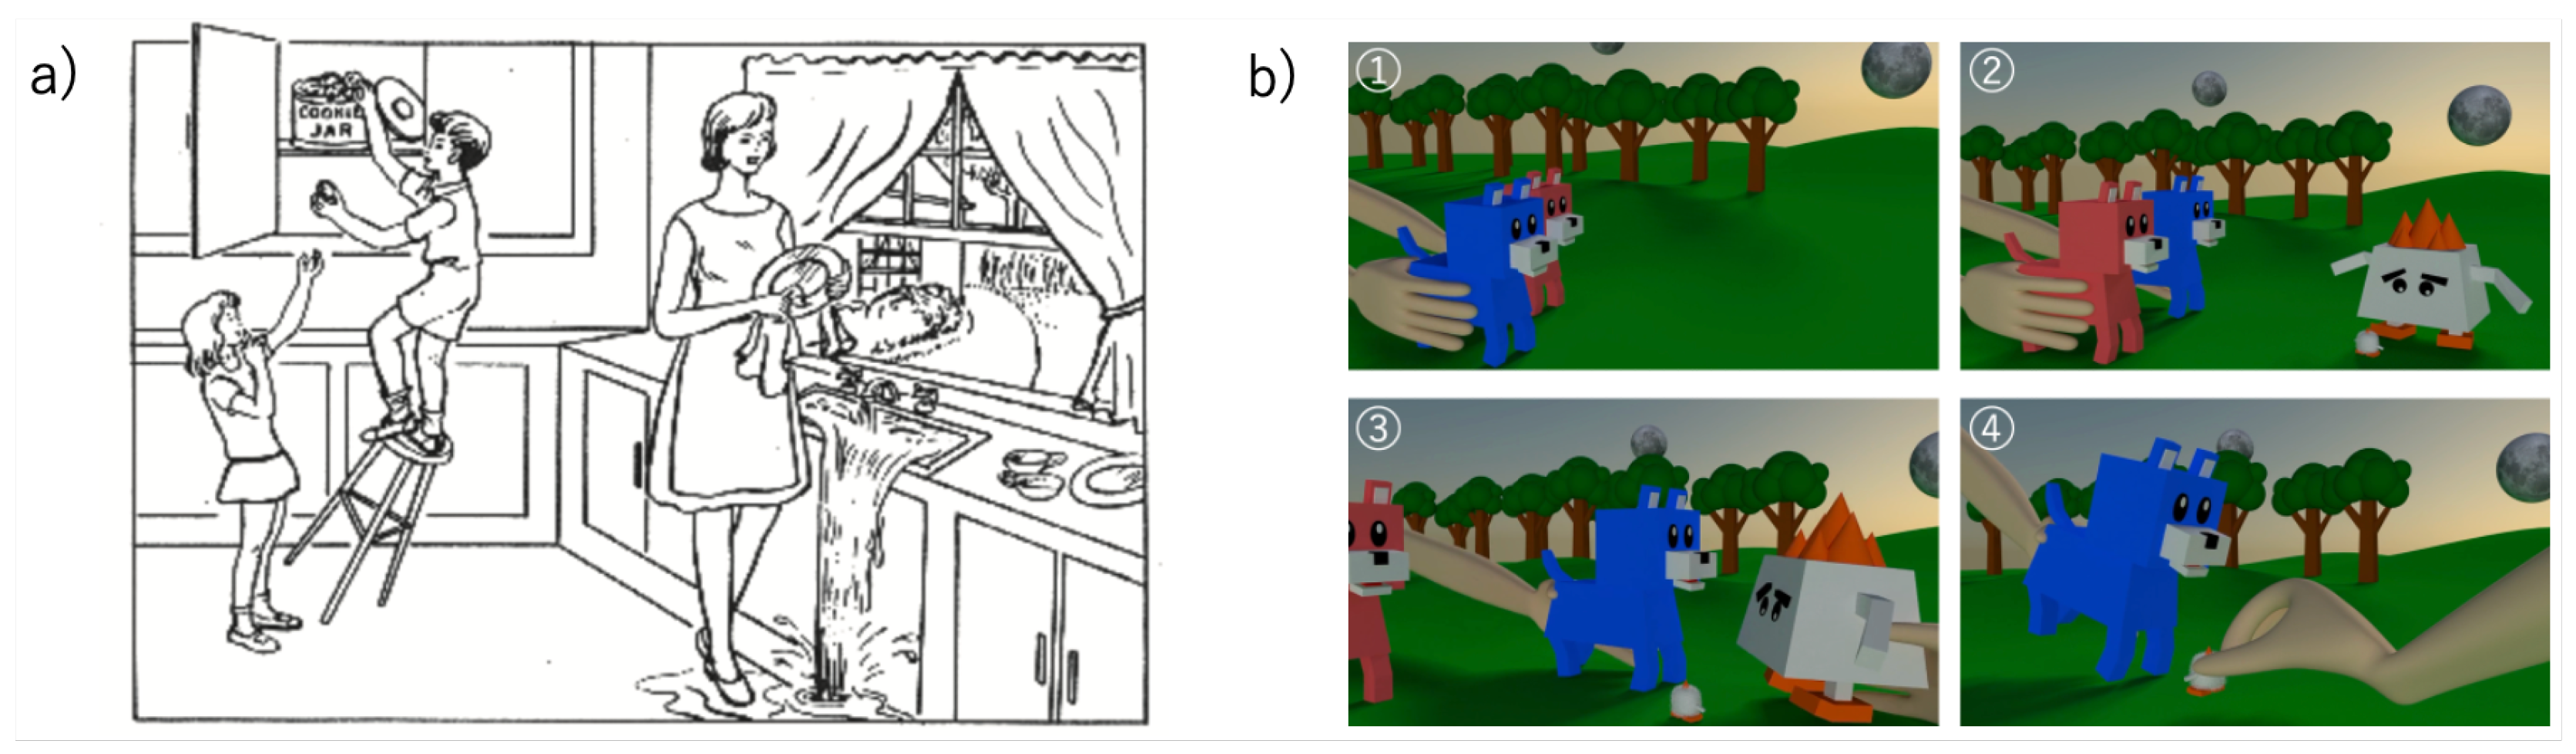
| Picture | 0.909 | 11 | 0.971 | 172 |
| Animation | 0.786 | 14 | 0.939 | 163 |
| Average | 0.779 | 12.0 | 0.907 | 180.0 |
Publisher’s Note: MDPI stays neutral with regard to jurisdictional claims in published maps and institutional affiliations. |
© 2022 by the authors. Licensee MDPI, Basel, Switzerland. This article is an open access article distributed under the terms and conditions of the Creative Commons Attribution (CC BY) license (https://creativecommons.org/licenses/by/4.0/).
Share and Cite
Igarashi, T.; Nihei, M. Cognitive Assessment of Japanese Older Adults with Text Data Augmentation. Healthcare 2022, 10, 2051. https://doi.org/10.3390/healthcare10102051
Igarashi T, Nihei M. Cognitive Assessment of Japanese Older Adults with Text Data Augmentation. Healthcare. 2022; 10(10):2051. https://doi.org/10.3390/healthcare10102051
Chicago/Turabian StyleIgarashi, Toshiharu, and Misato Nihei. 2022. "Cognitive Assessment of Japanese Older Adults with Text Data Augmentation" Healthcare 10, no. 10: 2051. https://doi.org/10.3390/healthcare10102051