Article

Study of Reversible Platelet Aggregation Model by Nonlinear Dynamics

by
Grigorii A. Vasilev
1,
Aleksandra A. Filkova
2,3 and
Anastasia N. Sveshnikova
1,2,3,*
1
Faculty of Physics, Lomonosov Moscow State University, 1/2 Leninskie Gory, 119991 Moscow, Russia
2
Center for Theoretical Problems of Physico-Chemical Pharmacology, Russian Academy of Sciences, 30 Srednyaya Kalitnikovskaya Str., 109029 Moscow, Russia
3
National Medical Research Center of Pediatric Hematology, Oncology and Immunology Named after Dmitry Rogachev, 1 Samory Mashela St, 117198 Moscow, Russia
*
Author to whom correspondence should be addressed.
Mathematics 2021, 9(7), 759; https://doi.org/10.3390/math9070759
Submission received: 18 February 2021 / Revised: 28 March 2021 / Accepted: 29 March 2021 / Published: 1 April 2021
(This article belongs to the Special Issue Mathematics in Biomedicine)

Abstract

:
Blood cell platelets form aggregates upon vessel wall injury. Under certain conditions, a disintegration of the platelet aggregates, called “reversible aggregation”, is observed in vitro. Previously, we have proposed an extremely simple (two equations, five parameters) ordinary differential equation-based mathematical model of the reversible platelet aggregation. That model was based on mass-action law, and the parameters represented probabilities of platelet aggregate formations. Here, we aimed to perform a nonlinear dynamics analysis of this mathematical model to derive the biomedical meaning of the model’s parameters. The model’s parameters were estimated automatically from experimental data in COPASI software. Further analysis was performed in Python 2.7. Contrary to our expectations, for a broad range of parameter values, the model had only one steady state of the stable type node, thus eliminating the initial assumption that the reversibility of the aggregation curve could be explained by the system’s being near a stable focus. Therefore, we conclude that during platelet aggregation, the system is outside of the influence area of the steady state. Further analysis of the model’s parameters demonstrated that the rate constants for the reaction of aggregate formation from existing aggregates determine the reversibility of the aggregation curve. The other parameters of the model influenced either the initial aggregation rate or the quasi-steady state aggregation values.

1. Introduction

Platelets are anuclear cell fragments of size approximately 3 × 0.5 μm. Their main task is to form aggregates, thereby stopping bleeding in the right place and at the right time. To aggregate with each other, platelets must be activated, when their membrane adhesives glycoproteins and integrins acquire high affinity to blood plasma protein fibrinogen [1]. In some cases, the formation of platelet aggregates can be reversible depending on the strength of platelet activation [2]; for example, reversible aggregation is observed in vitro in response to a weak activator, adenosine diphosphate (ADP), in the presence of calcium ions in the solution [3]. Another example of reversible platelet aggregation is the fluidity of the thrombus shell observed in in vivo experiments [4].
Light transmission platelet aggregometry (LTA) is a widely used clinical test to study the response of platelets to activation. This method was developed in 1962 by Born and O’Brien. [3]. During this test, a ray of light after passing through a cuvette with a suspension of platelets enters a photocell. After the addition of an activator, the total light transmission of the suspension increases due to the formation of large local light scattering centers, platelet aggregates (Figure 1a). Results of LTA are known to vary greatly between different donors, thus making the LTA test qualitative rather than quantitative [5]. To move closer to developing a more reliable platelet activity test, we proposed the utilization of the reversible aggregometry phenomenon in conjunction with the automatic estimation of aggregation parameters using a mathematical model [2].
The model proposed in our previous study [2] was based on the assumption of mass action kinetics applied to platelet aggregate formation (Figure 1b) [2]. The model consisted of two equations:
{ d p d t = 2 k 1 p 2 k 2 n p + ( k 1 + k 2 ) n d n d t = k 1 p 2 k 3 n 2 + ( k 3 k 1 ) n ,
where p denotes single platelet concentration, n is the concentration of platelet aggregates, parameters k 1 and k 1 are kinetic rate constants for the reversible reaction of aggregate formation from two platelets, k 2 and k 2 are kinetic rate constants for the reversible reaction of single platelet attachment to the existing aggregate, and k 3 and k 3 are kinetic rate constants for the reversible reaction of an aggregate formation from two existing aggregates—see Figure 1b. A typical result of LTA is a time curve of the relative changes in the optical density (OD) of the suspension or percentage of aggregation (aggregation equals (1 − OD) ∗ 100%). Equation (1) describes this parameter as 100 % exp ( p + n p 0 p 0 ) , where p0 denotes the initial concentration of single platelets in the suspension.
It should be noted that simulations of the aggregation curves by Equation (1) do not start from a steady state of the system. The simulation starts from the condition when all platelets are single (n0 = 0), and at time t = 0 they are assumed to become “sticky”, i.e., the platelets assume an ability to form aggregates. The relationship between the concentration of activator and the “stickiness” of platelets (parameter values) was not investigated previously [2]. Another unconventional feature of Equation (1) is that the mass conservation law does not hold (one aggregate could be formed from two aggregates and vice versa). The addition of another variable, the average size of aggregates, restores the mass conservation law [2]. However, for a description of the aggregation curve with as a low number of parameters as possible, the two variables are sufficient.
Despite its simplicity, the model was capable of accurately simulating LTA data for experimental ADP concentration ranging from 1.25 μM to 40 μM as was shown previously [2]. Additionally, it was shown that the parameters (ki) of the model depend on the concentration of activator (ADP) with a Pearson’s correlation coefficient of 0.9 for the k 1 parameter [2]. However, conventional analysis utilizing nonlinear dynamics for this model was not performed.
In general, platelet aggregation models could be divided into two subgroups: the mechanistic models and the Smoluchowski equation-based models. The mechanistic models take into account the mechanical forces of platelet interactions and the Navier–Stokes equation for the interaction between platelets and blood plasma. Typically, these models are two-dimensional [6,7,8,9], and even then they have a large set of required parameters (31 [6], >10 [7], >50 [9]). The first three-dimensional model of platelet aggregation published in 2019 also had a large number of parameters (>28) [10]. In these models, the computational cost is high (e.g., 72 × 1072 × 10 core-hours for running a typical simulation [10]) even with the amount of described ligand–receptor interactions being reduced. The second subgroup of the mathematical models utilizes the Smoluchowski equation [11] and mass action kinetics [12,13]. Generally, they have similar problems, although on a smaller scale [13]. An additional drawback of such modeling lies in the assumption of the system’s homogeneity, which is not valid for the thrombus growth setting but could be valid for platelet aggregometry [2].
The large number of model parameters has its pros and cons. From one point of view, this allows the model to be more flexible and customized [14]. However, there is a certain risk of overparametrization [15], when several sets of parameters describe the experimental data correctly, thus leading to a loss in the biophysical meaning of individual parameters [10,15,16].
Due to the high demand for a simple mathematical model of platelet aggregation, here we aimed at further investigation of Equation (1). We performed a transformation of the model variables into dimensionless ones to avoid the dependence of parameters on the initial concentration of platelets (p0). We demonstrated that in most cases for positive values of parameters and variables only one singular point exists, and its type is always the stable node. For the first and second methods of bifurcation analysis, the possible bifurcations occur only for negative and zero values of parameters for the probabilities of the aggregate dissociation. However, after conducting a five-dimensional analysis, we found bifurcation points in a positive range of parameters. Additionally, we performed an explicit sensitivity analysis to evaluate the impact of parameter values on the aggregation curves.

2. Materials and Methods

2.1. Computational Methods

A “Particle swarm” method [17] implemented in COPASI software [18] was utilized for parameter estimation, as described previously [2]. Numerical integration and bifurcation analysis were performed using PyDSTool utility from Python 2.7 [19]. The integrator VODE was used with fixed integration step dt = 0.1. The integration was performed with backward differentiation formulas (BDFs) with a configuration for stiff systems. Although the choice of integration method might be critical in some cases [20], the studied system (Equation (1)) is expected to be smooth enough; therefore, the choice of integration method is not of great importance in this study. However, to verify this statement, the numerical integration using the implicit Adams method with dt = 0.01 was conducted and the simulation results were the same within the machine accuracy.
Two approaches for bifurcation analysis were used. The first method was based on fixing four parameters of the system and varying the fifth. The eigenvalues of the Jacobian of the system were calculated for each new parameter value. According to the corresponding changes in the eigenvalues, the bifurcation point was determined. In the second method, three parameters of the system were fixed, several fixed values of the fourth parameter were selected, and the fifth parameter varied for each of the sets. Bifurcation points were determined similarly to the first method. When constructing bifurcation diagrams, it was assumed that the system was smooth, i.e., the calculated points could be connected by a continuous curve.

2.2. Reagents

The sources of the materials were as follows: ADP, apyrase grade VII (Sigma-Aldrich, St Louis, MO, USA). Hirudin-containing blood collection tubes (Vacuette®, Greiner Bio-One GmbH, Kremsmünster, Austria).

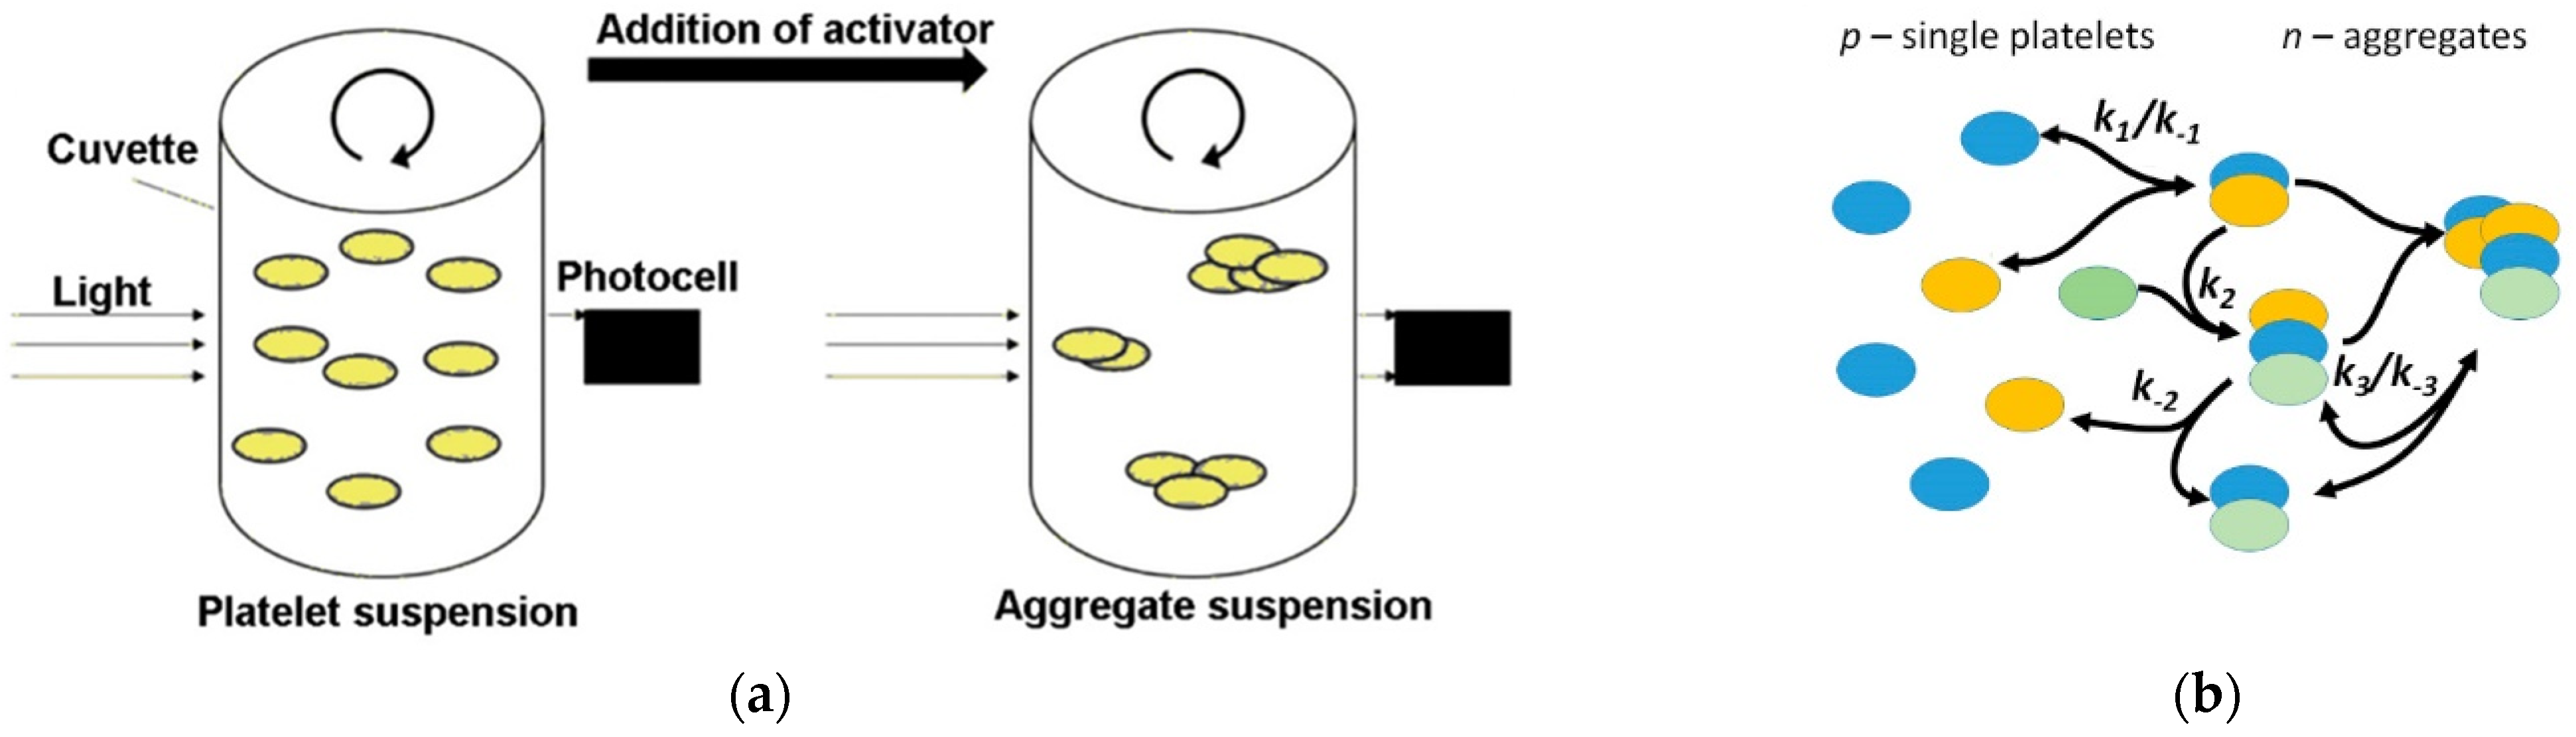
2.3. Blood Collection and Aggregometry
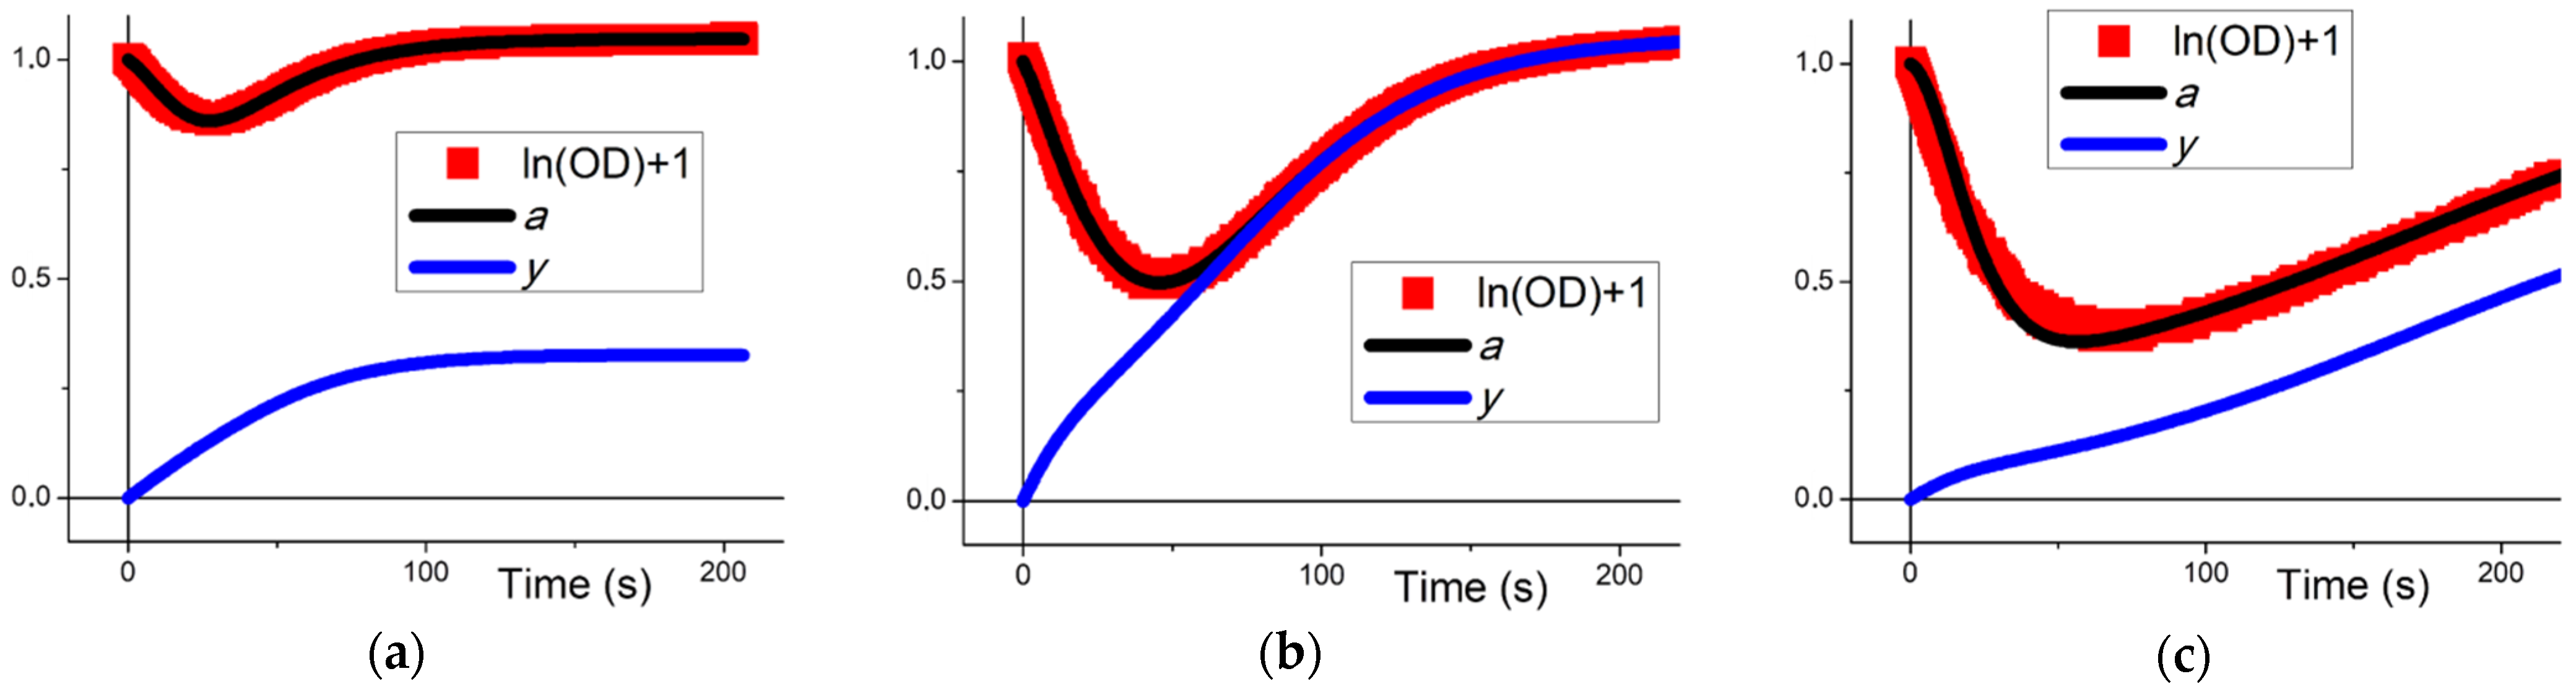
Healthy volunteers, both men and women aged between 18 and 35 years, were recruited into the study. Investigations were performed in accordance with the Declaration of Helsinki and approved by the Independent Ethics Committee at CTP PCP RAS (1_2018-1 from 1 December 2018), and written informed consent was obtained from all donors. For platelet-rich plasma, blood was collected into 1.6 ml tubes containing hirudin. Platelet-rich plasma was obtained by centrifugation at 150× g for 8 min without brake. Platelet-poor plasma for reference was obtained from the same sample by further centrifugation at 2000× g for 15 min as described previously [2]. Platelet aggregation was performed using Chrono-Log 490 and Biola LA-230 turbo-diametric aggregometer. Experiments were conducted in 250 μL (Chrono-Log) or 300 μL (Biola) aliquots of PRP. The platelet suspension was mixed by a stirrer with 800 rpm. ADP was added at various concentrations as the platelet activator. An optical signal was recorded every 0.5 s for Chrono-Log and 1s for Biola. All steps of the procedure were conducted at 37 °C.

3. Results

3.1. Transformation of the Model

In order to compare the values of model parameters and variables with each other and perform model analysis, the initial model (Equation (1), Figure 1b) was transformed into Equation (3) by means of the following variable replacements (Equation (2)):
{ a = p + n p 0 y = n p 0 ,
where p denotes the single platelet concentration, p0 denotes the initial platelet concentration, and n denotes the concentration of platelet aggregates; therefore, y is the dimensionless concentration of aggregates and a is the ln of optical density of the solution. The system of Equation (1) with the application of Equation (2) becomes the following system:
{ a ˙ = p 0 k 1 a 2 + ( 2 k 1 k 2 ) p 0 a y + ( k 1 + k 2 + k 3 ) y + ( k 2 k 1 k 3 ) p 0 y 2 y ˙ = p 0 k 1 a 2 2 k 1 p 0 a y + ( k 1 k 3 ) p 0 y 2 + ( k 1 + k 3 ) y .
It can be seen that the system in Equation (3) has five parameter values, which could be assessed from the experiment. These are the probabilities of aggregate formation: p 0 k 1 ,   p 0 k 2   and p 0 k 3 , which have dimensions of 1/s and will be replaced with k 1 , k 2   and k 3 for simplification, and the probabilities of the aggregate dissociation k 1 + k 2 + k 3 and k 1 + k 3 , which also have dimensions of 1/s and will be replaced with k 1 +   k 3   and k 3 for simplification. The further analysis will be performed for the modified system, Equation (4):
{ a ˙ = k 1 a 2 + ( 2 k 1 k 2 ) a y + ( k 1 + k 3 ) y + ( k 2 k 1 k 3 ) y 2 y ˙ = k 1 a 2 2 k 1 a y + ( k 1 k 3 ) y 2 + k 3 y ,
where k1 is the probability of new aggregate formation from two single platelets, k2 is the probability of another platelet attachment to an existing aggregate, k3 is the probability of formation of one aggregate from two existing ones, and k−1 and k−3 are the probabilities of an aggregate fragmenting (Figure 1b).
The Jacobian of Equation (4) will be:
( 2 a k 1   +   y ( 2 k 1     k 2 ) a ( 2 k 1     k 2 )   +   k 1   +   k 3   +   2 y ( k 1   +   k 2     k 3 ) 2 a k 1     2 k 1 y 2 a k 1   +     k 3   +   2 y ( k 1     k 3 ) ) .
Analysis of the matrix in Equation (5) [2] demonstrates that the singular points of the system could be of focus or node type. Additionally, positive coordinates of the singular point are:
{ a = y ( 2 k 1     k 2 )   +   y ( 4 k 1 k 3 y   +   4 k 1 k 1   +   4 k 1 k 3   +   k 2 2 y ) 2 k 1 y = 4 k 1 k 3 k 1   +   8 k 1 k 3   k 3     k 2 2   k 3     k 2 4 k 1 k 3 k 1 2   +   8 k 1 k 3 k 1   k 3   +   k 2 2 k 3 2 2 k 3 ( 4 k 1 k 3     k 2 2 ) ,
Therefore, depending on the parameters, there could be only one positive (physiologically meaningful) singular point of focus or node type.
The parameter values used previously [2] were assessed utilizing five different parameter estimation methods based on experimental data on platelet aggregation. Here, we followed the same route. The parameter values were assessed utilizing the “particle swarm” method [17] based on original experimental data on reversible platelet aggregation in response to ADP (Figure 2). Equation (4) described experimental data as successfully as Equation (1). The corresponding parameter values are given in Table 1. Previously [2], it was speculated that the parameter values should depend on the initial concentration of platelets (p0) and the activation strength. Here, p0 is already incorporated in the values of k1, k2, and k3. However, the dependence on the concentration of ADP is not obvious.

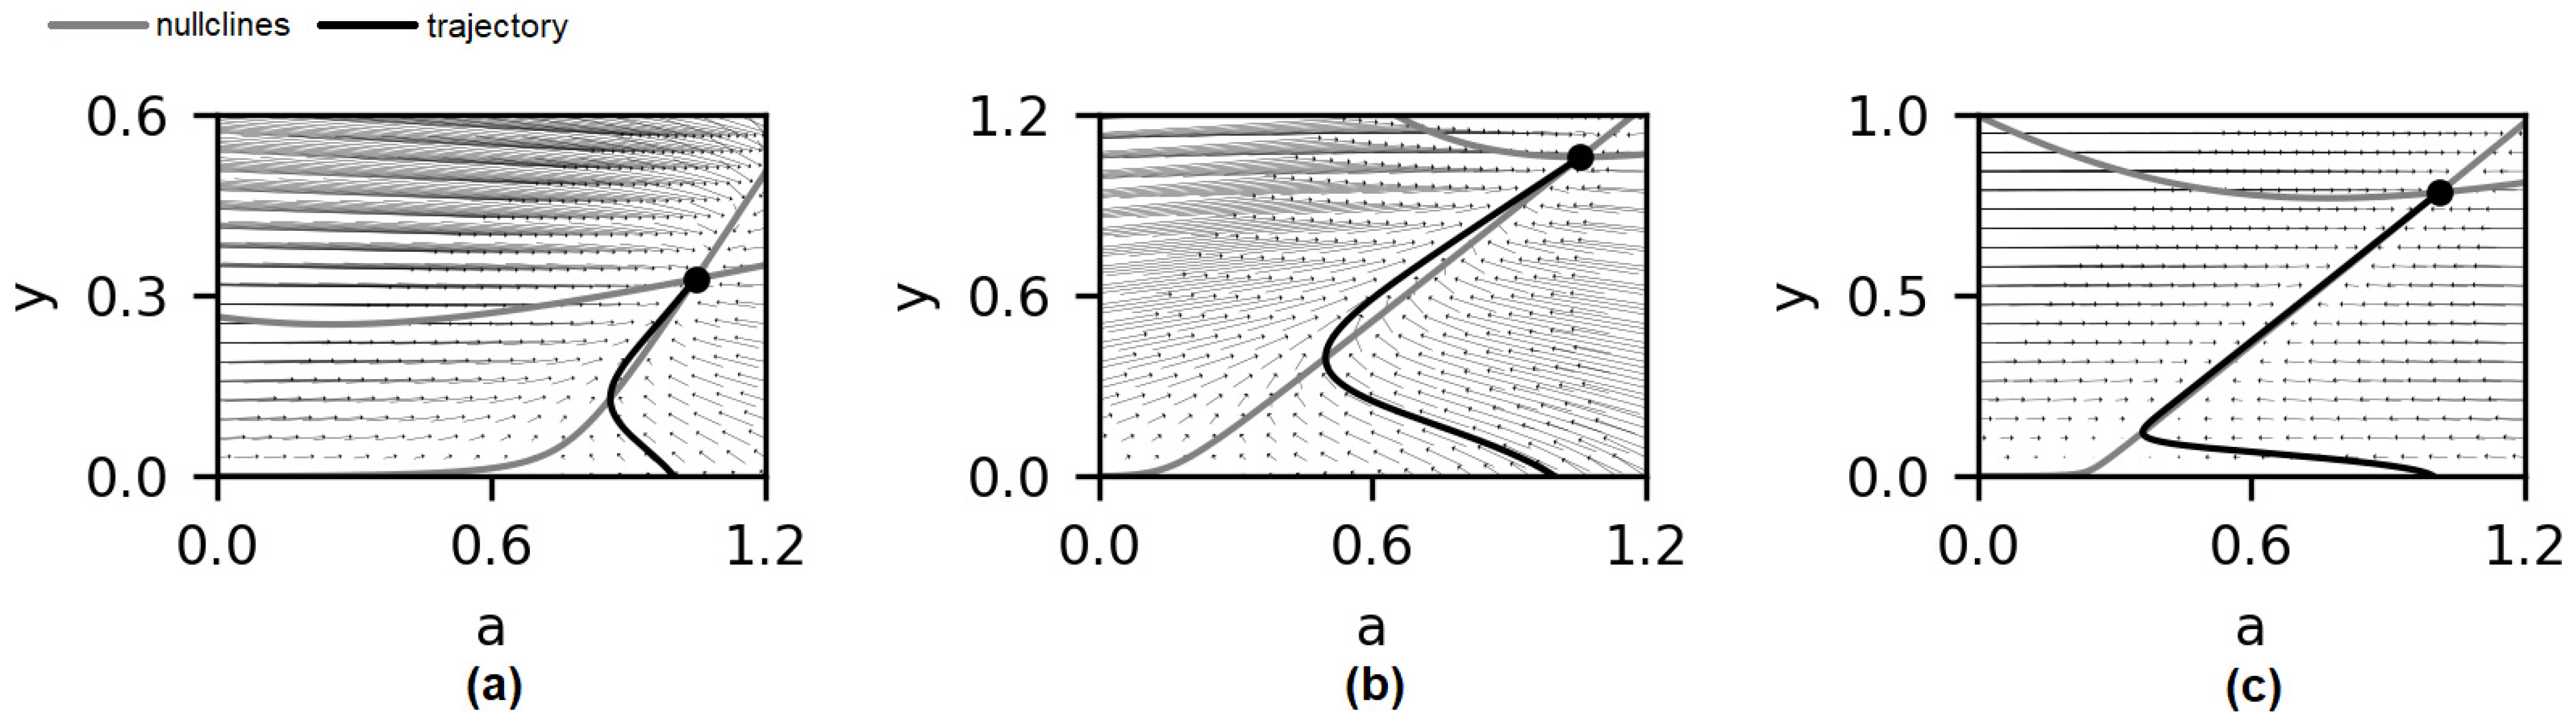
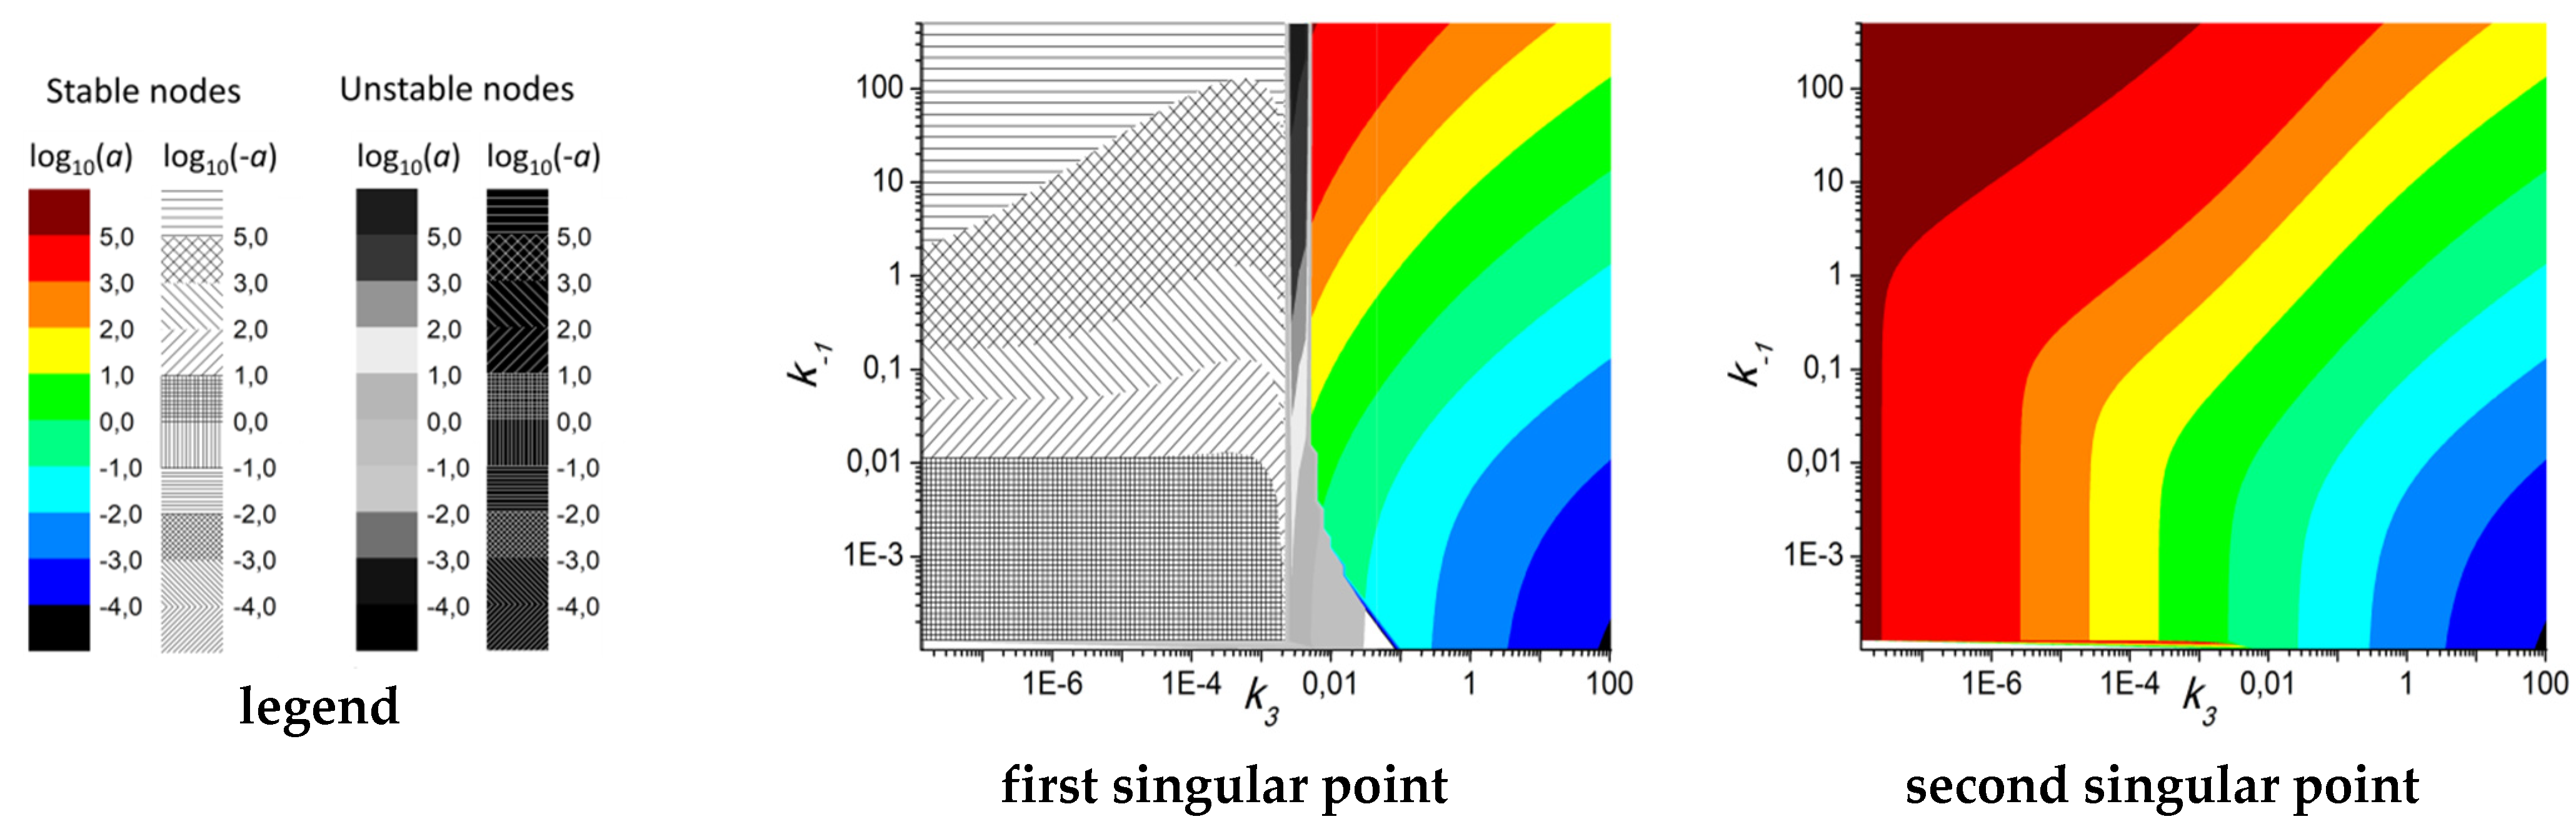
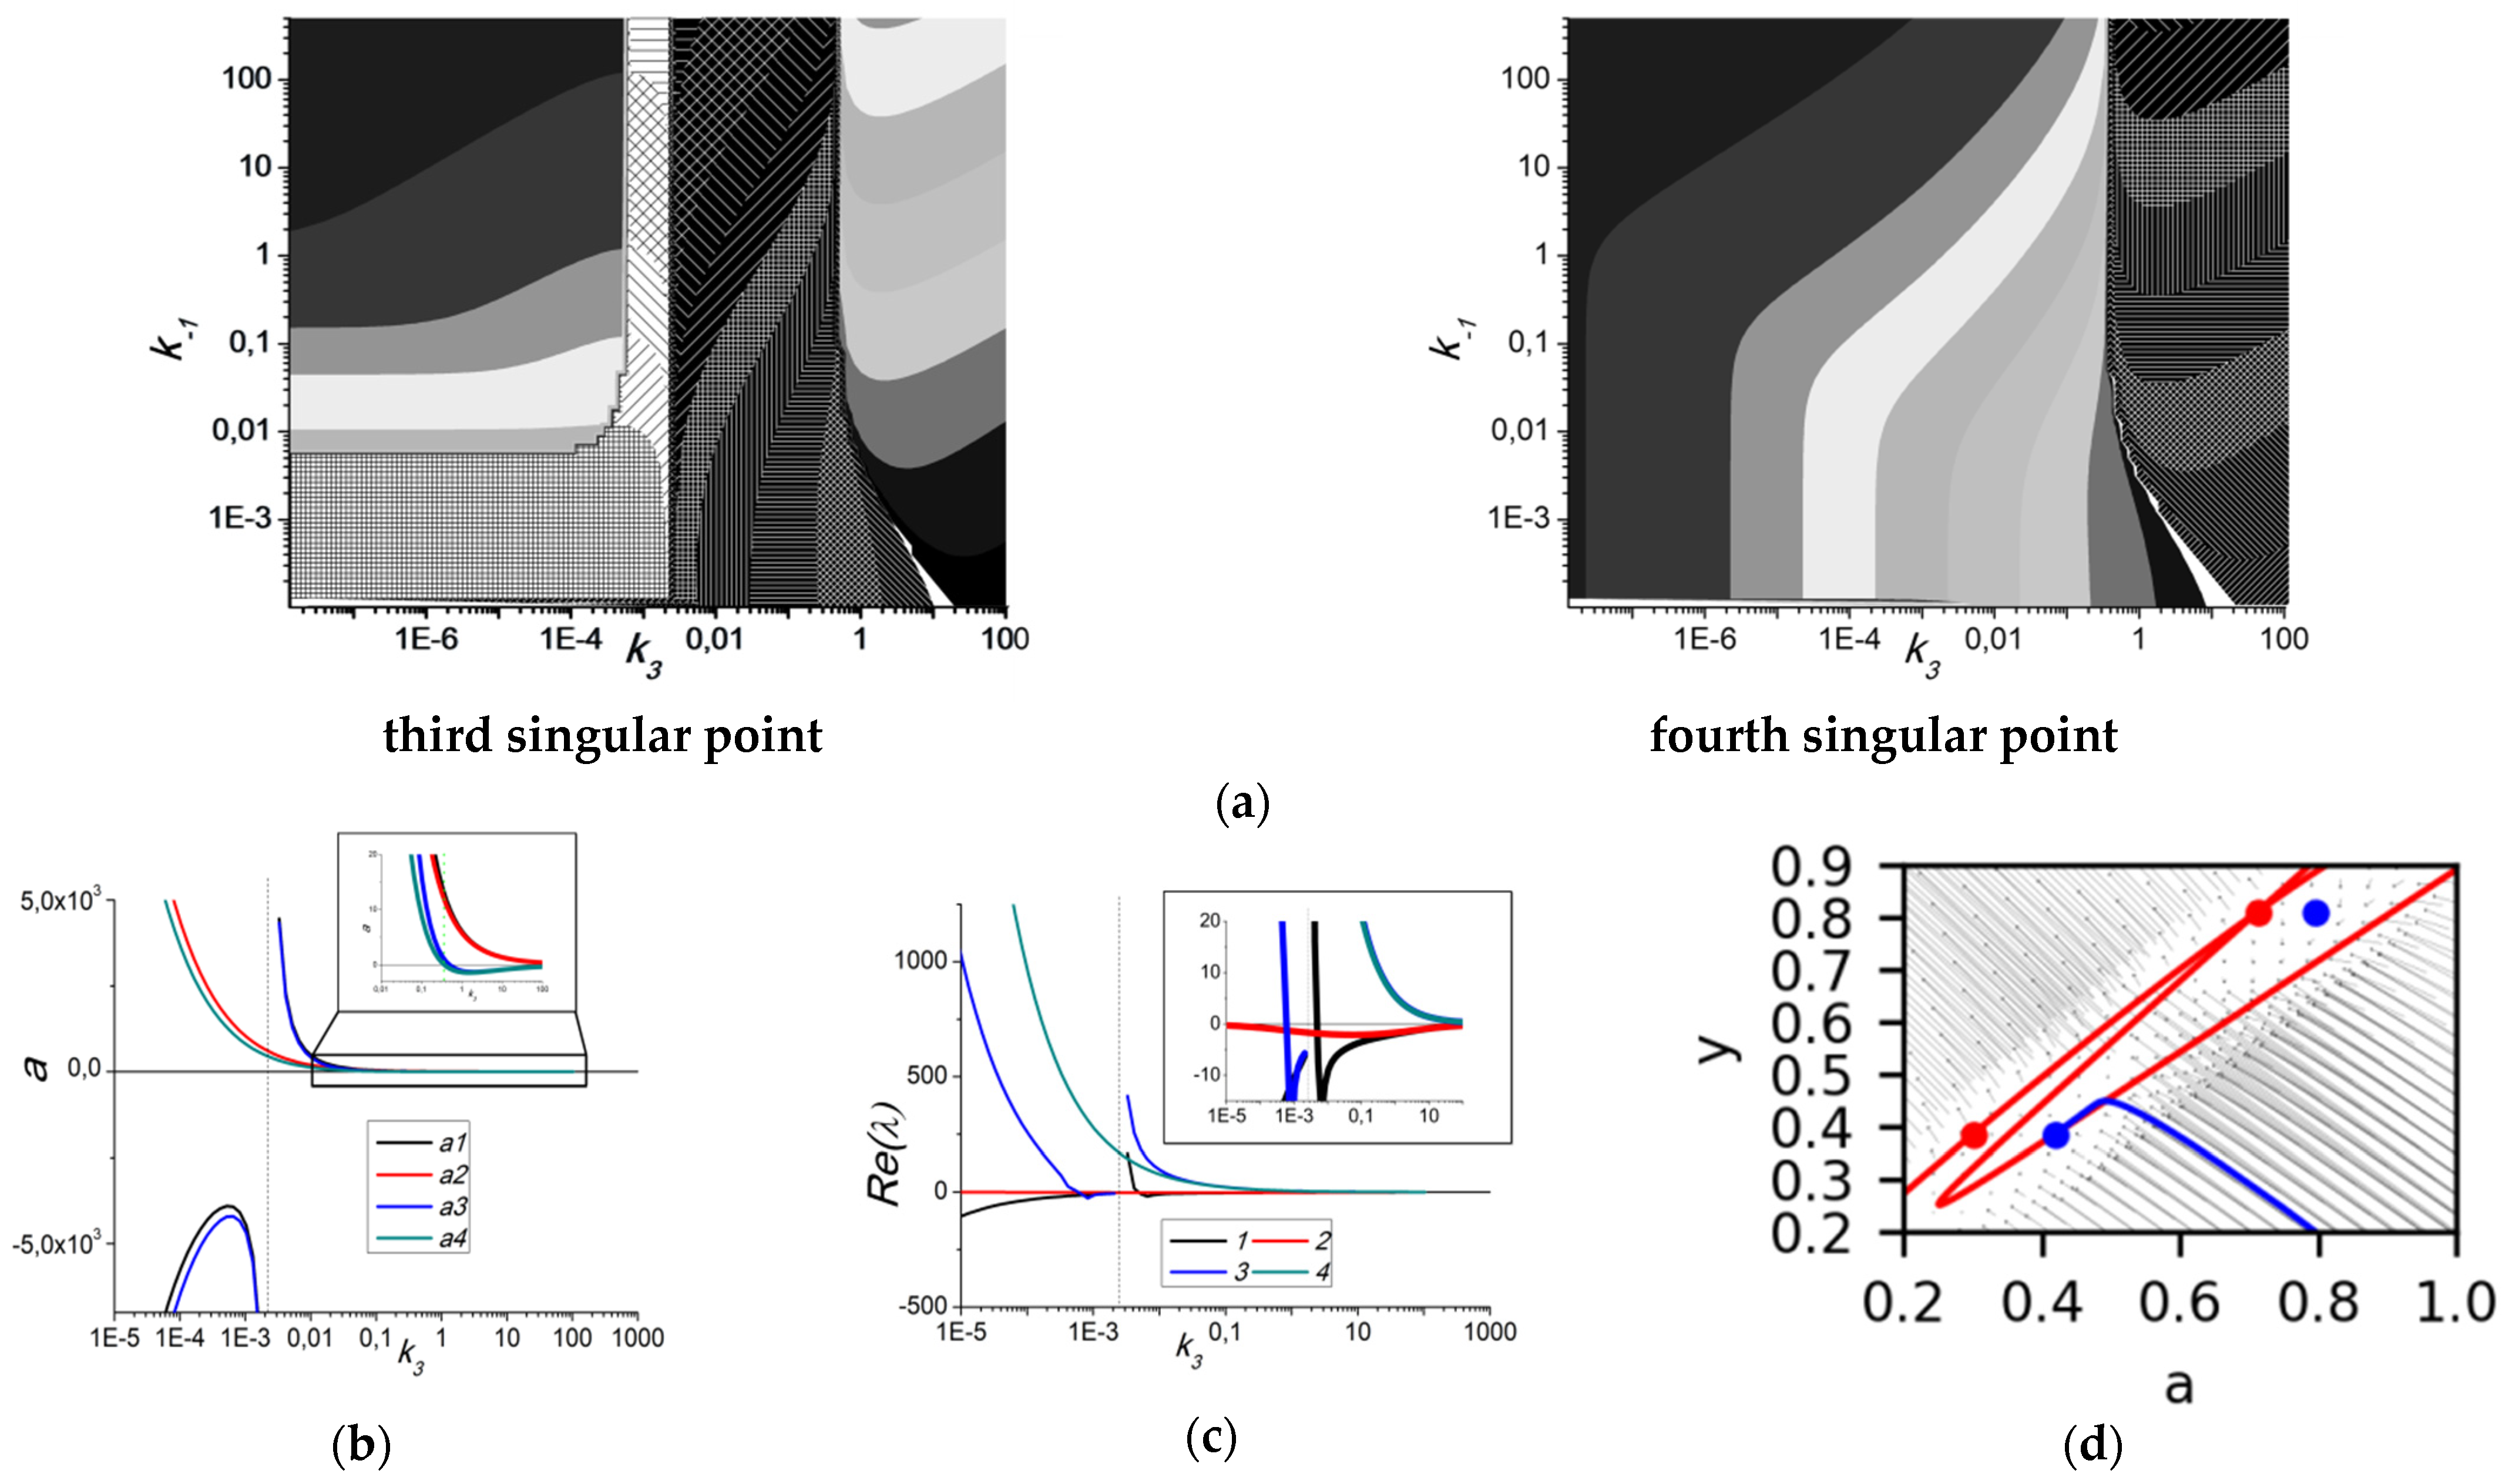
3.2. Bifurcation Analysis of the System

To determine the impact of the parameters ki on the behavior of the system, we have determined the types of singular points for different sets of parameters and looked for the bifurcation points. For all three ADP concentrations, the type of singular point was a stable node (see Figure 3 legend for the eigenvalues of Jacobian). For each set of parameters, the coordinates of the singular point were calculated using the analytical Equation (6). The set of coordinates of the singular point corresponds to the eigenvalues of the Jacobian of Equation (5). For each of the parameter sets, the eigenvalues are negative real numbers; therefore, the type of the singular point is a stable node. The characteristic form of the phase plane for this type of singular point is given in Figure 3. It was surprising because the aggregation curves were reversible in all cases, and the same values of the variable a were achieved for different values of the variable y (Figure 3).
Using the first method of bifurcation analysis, only one “node-focus” transition point was found (Figure 4a). For k−3 = 0 for curve ADP = 5 μM, the type of singular point changed from «stable node» to «stable focus». The corresponding real eigenvalue of the Jacobian remained negative (Figure S1a,b).
The second method of bifurcation analysis was a pairwise study of the parameters for each of the three sets. All variations of parameters were performed for parameter values from the range {0,10}, except for k−3, which was varied in the range {−1000, 1000}. For most sets of parameters, only singular points of the type “stable node” were found. The type “stable focus” was found for 2.5 μM ADP (Figure 4b) and 10 μM ADP (Figure 4e) model with both k−3 and k1 varied, and for 5 μM the ADP models with k−3 and k−1 (Figure 4c), or k−3 and k3 (Figure 4d) varied. Unstable singular points were also found for 2.5 μM ADP and 10 μM ADP models with both k−3 and k1 varied (Figure S1), the type “saddle” was not found.
Therefore, the variation in the values of parameters in their positive range did not give any bifurcation points. “Node-focus” transition points were found at k−3 = 0 for the system for 5 μM ADP, and k−3 < 0 for other concentrations of ADP. For greater negative values of the parameters, a loss of stability of the singular point could occur (Figure S1). The negative values of the parameters do not bear any physiological meaning, because the reverse reactions are described by different equations (Figure 1b). Thus, we can conclude that during the reversible platelet aggregation, the system is outside of the influence area of the steady state.
The main drawback of the performed analysis consists of the choice of parameter values. To look for bifurcation points further from the estimated parameter sets, we have conducted a 5D numerical analysis and calculated values for all four singular points described by Equation (6), starting with the parameter set for 2.5 μM ADP. This analysis revealed that there are large areas of the parameter space where at least two singular points are “stable nodes” (with negative real part and zero imaginary part of the first eigenvalue of Jacobian) with positive values for both variables (Figure 5). On the boundaries of these areas there are bifurcations “stable node”–“unstable node” (Figure 5b,c). A typical phase plane for systems with four singular points (two “stable nodes” and two “unstable nodes”) is given in Figure 5d. However, the “node-focus” transition points were not found during the analysis. It should be noted that, although the system in the area depicted in Figure 5 appears to be bistable, the model was devised to describe platelet aggregation starting from fixed initial conditions (a = 1, y = 0). Thus, if no variations in the platelets state happen during the experiment, the second stable point will never be achieved.

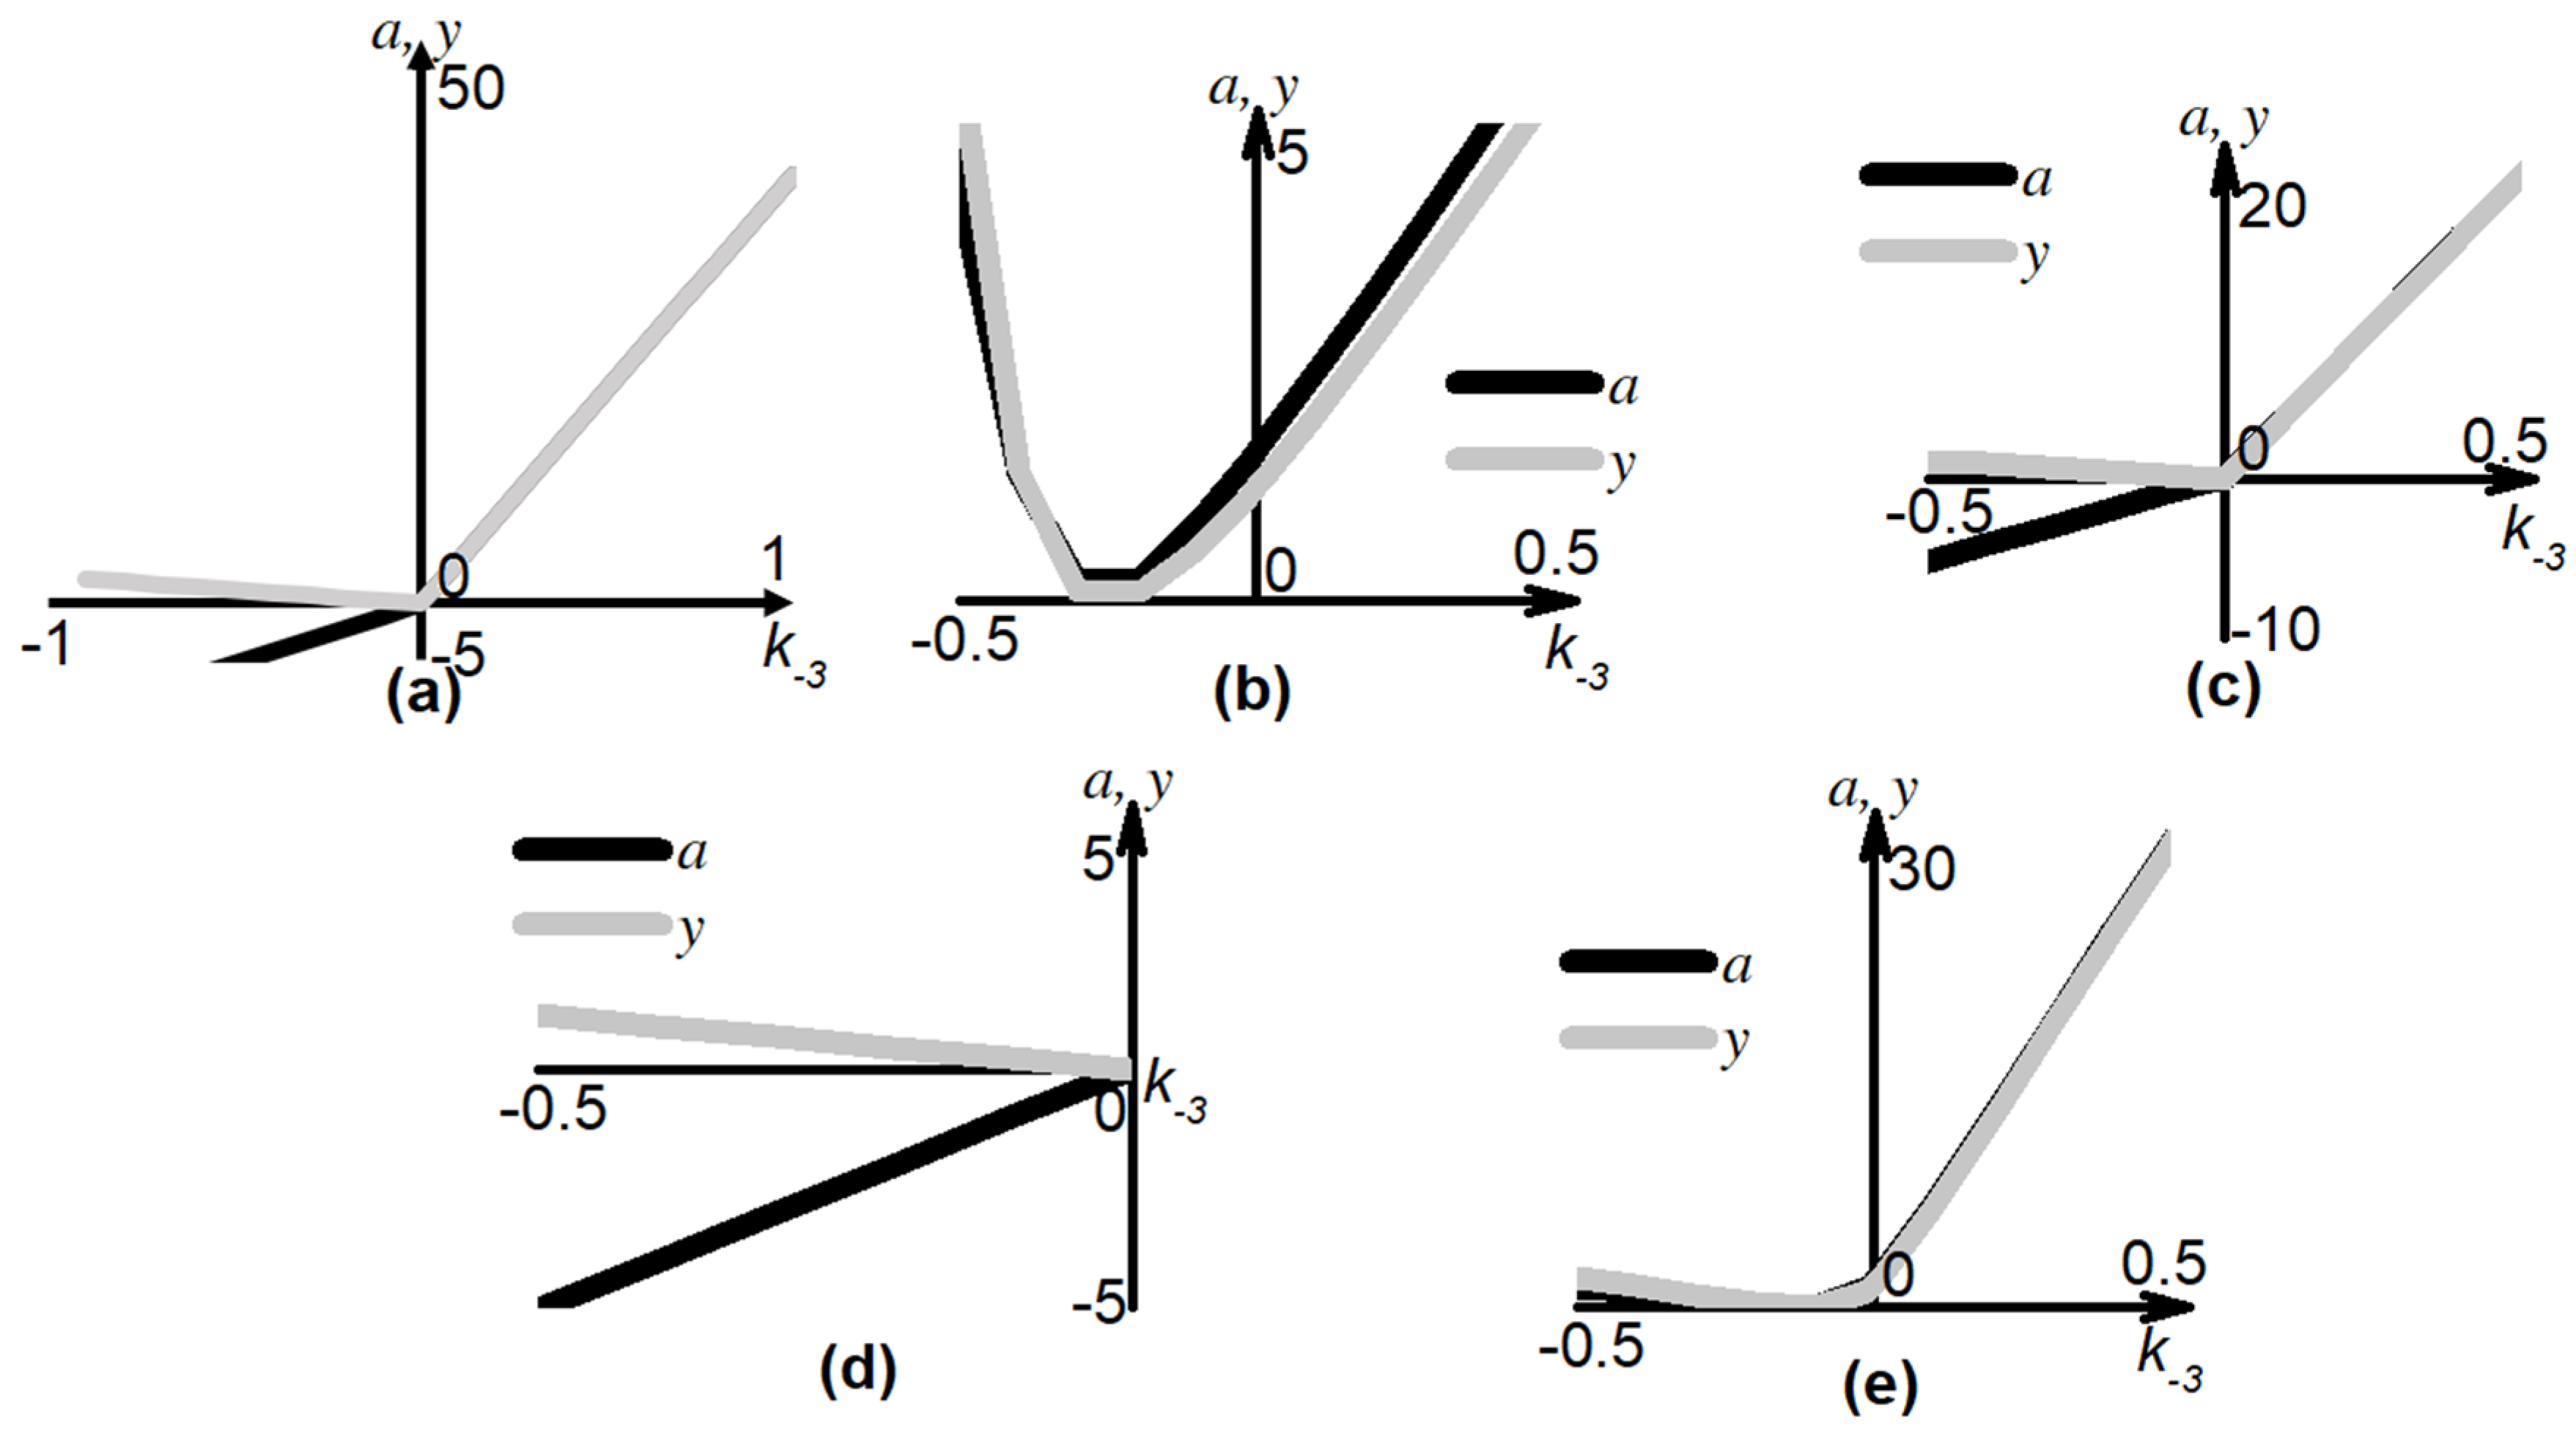
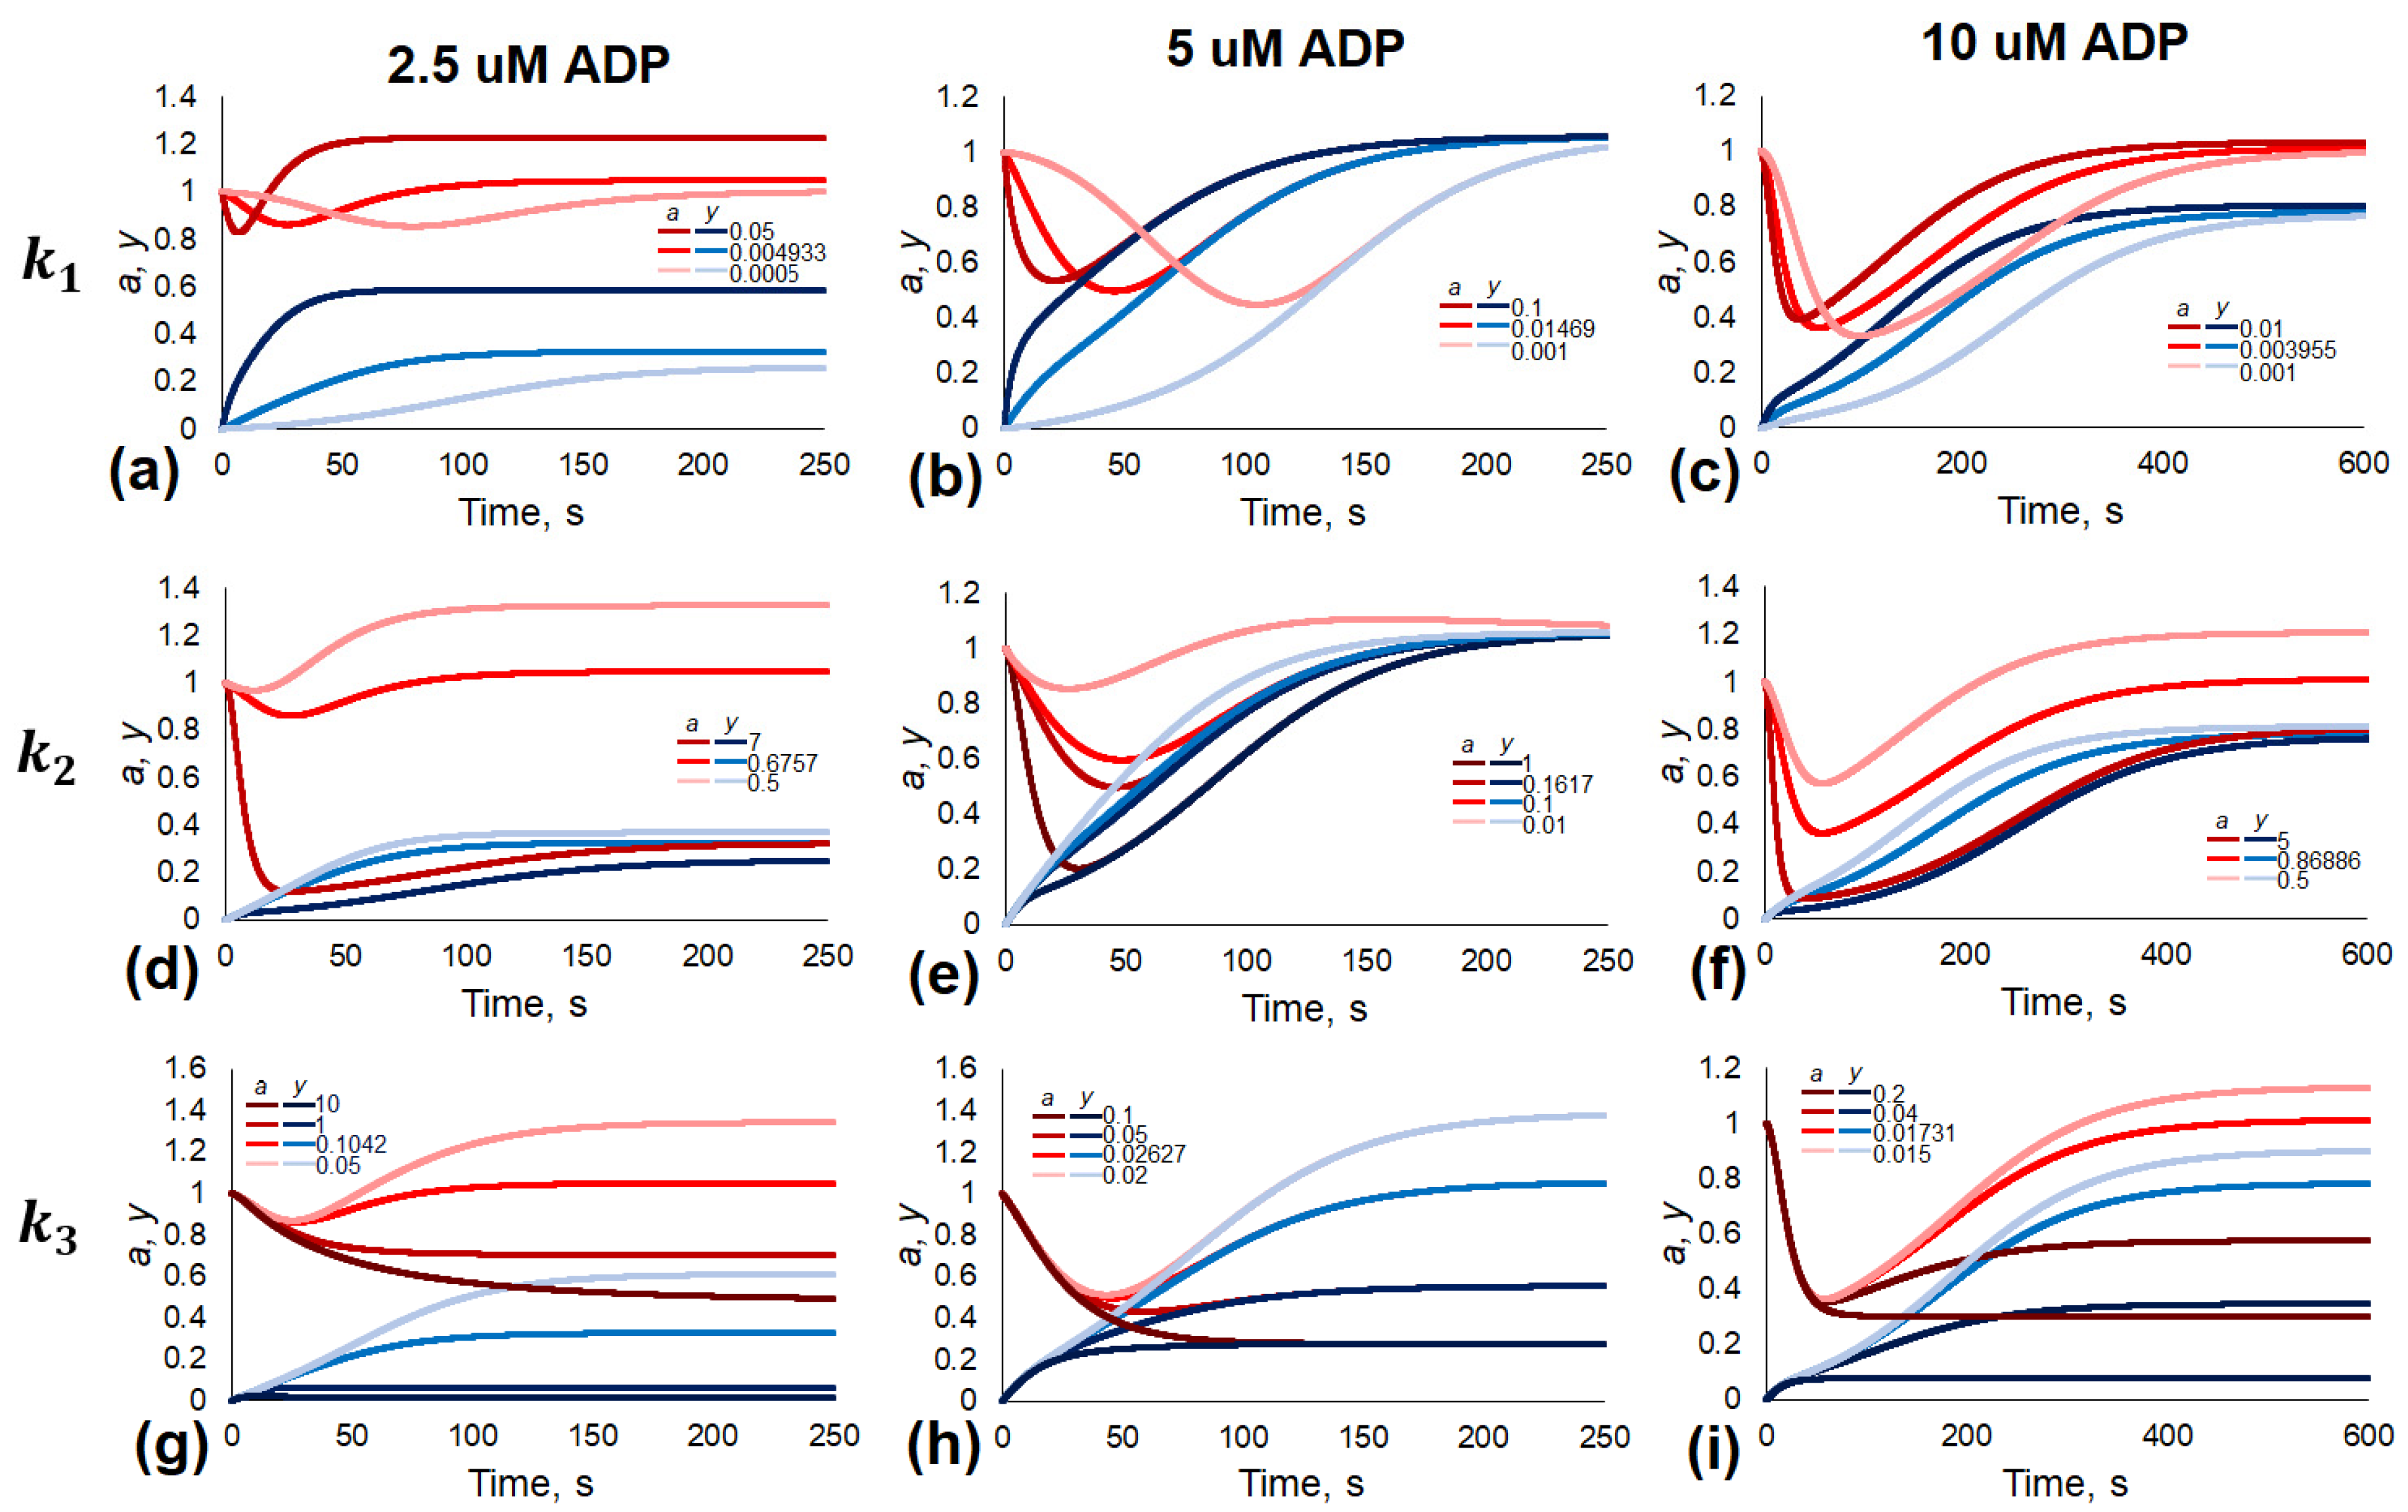
3.3. Effects of Parameter Variation

To investigate the impact of parameters on the aggregation curve, we have performed a variation of each parameter around its estimated value (Figure 6 and Figure S2). Based on the dependence of the initial aggregation rate (the first derivative of the variable a) and the minimum value of the variable a on the parameter values, we have supposed the following meaning for the parameter values.
The parameters k 1 and k 1 (Figure 1b) determine di-aggregate formations. Variation of k 1 determines the time before aggregation maximum (Figure 6a–c), while variations in k 1 lead to changes in the steady state values (Figure S2a–c). These results are in good correspondence with the physiological meaning of the model parameters. Indeed, k1 is the probability of new aggregate formation from two single platelets, and thus with the increase in this parameter, initial aggregation should occur faster, and so the time before the achievement of maximum aggregation should decrease.
The parameter k 2 (and k 2 as part of k 1 ) determines the stability of a single platelet inside an aggregate (Figure 1b). Variations in k 2 lead to some “scaling” of the aggregation curve, when both the initial aggregation rate and the steady state values of parameters shift. k 2 is the probability of another platelet attachment to an existing aggregate; therefore, it accelerates aggregation and makes it more intense in the beginning, so with the increase in this parameter, the aggregation maximum shifts to the left on the time axis and becomes deeper.
The parameters k 3 and k 3 (Figure 1b and Figure S2d–f) determine intrinsic aggregate stability. Consequently, both k 3 and k 3 impact the steady state values. k3 is the probability of forming one aggregate from two existing ones, and so with the increase in the parameter aggregation becoming more intense in the late period when there is a significant amount of aggregate, the height of the steady state thus decreases. The parameters k−1 and k−3 are the probabilities of an aggregate fragmenting, and so with the increase in these parameters, the height of steady state is increased because of more intense disaggregation.

4. Discussion

In the present study, we analyzed our previously published model of reversible platelet aggregation [2] using nonlinear dynamic methods. We modified the model to avoid the previously demonstrated dependence of the parameters on the initial platelet concentration. The modified system is still capable of describing experimental data (Figure 2) with the same number of parameters (5), thus avoiding excessive parameterization. The computational cost of this model is much lower than that of mechanistic models (about 1.4 s/core/calculation).
The reversible character of the aggregation curve on the phase plane makes us expect that the system will have a singular point of a certain type—a stable focus—as in other models of biological systems [21,22,23]. However, we analyzed and found that the system has only one singular point of the “stable node” type at physiologically significant values of the parameters (Figure 3). In a study by Cai et al. [24], similar behavior of a model of a biological system was observed. Namely, a phase plane similar to that shown in Figure 3, with a “returning” phase trajectory near the “stable node”, was obtained for a system of two ordinary differential equations.
Here, we performed bifurcation analysis for the system in two modes. The first mode consisted of the variation of one parameter at a time. In this mode, only one “node-focus” transition point was found at k−3 = 0 for the set of parameters corresponding to 5 µM ADP (Table 1, Figure 4a). The “stable focus” type of the singular point corresponds to the non-physiological type of aggregation curve. The second mode of bifurcation analysis consisted of the simultaneous variation of two parameters. In most cases, bifurcations in this mode were also not found. Negative values of the bifurcation parameters correspond to the opposite directions of reactions; therefore, in most cases, negative values of constant rates represent an experimental or procedural artifact [25]. However, in the present study, it is notable that bifurcations were found while varying the parameter k-3 which equals k-3 - k-1 of the original model (Equation (1)), thus bifurcations in the negative values have physiological meaning, corresponding to the high probability of the aggregate disintegration into two platelets. We have performed an additional numerical investigation of the five-dimensional parameter space (Figure 5). Although there are no bifurcations close to the points given in Table 1, in distant areas of the parameter space, a bi-stable behavior could be observed (Figure 5b,c).
According to the behavior of aggregation curves in response to the variation of the model parameters, we suppose the following roles of parameters in the shape of the curve view. Parameters k1 and k2 determine the initial aggregation rate (Figure 6), while the parameter k3 does not have an impact on it. This effect is more noticeable for small concentrations of ADP (Figure 6a,d). Therefore, this part of the aggregation curve is mostly dependent on the formation of small aggregates, most probably on the initial activation of integrins [26,27]. This result is consistent with the experimental data on platelet aggregate formation in diluted solutions [28].
Parameters k3, k−1, k−2 and k−3 determine the steady state level and thus the stability of aggregates (Figure 6). This finding lies in line with our previous statement [2], and experimental results obtained in previous studies [29], that reversible platelet aggregation is the process of destabilization of large aggregates formed in the first phase. Although in this study the dependence of the model parameters on ADP concentration was not observed, we expect the parameters k1 and k2 to be linearly proportional to the logarithm of reagent concentration as was described earlier by Babakhani et al. [30].
The platelet aggregation model (Equation (4)) has the following differences from the previously proposed ones. Compared to a model where aggregation occurs as a result of the collision of platelets with some probability [31], and compared with the mechanistic models, where direct platelet interactions with each other are considered [32,33,34], Equation (4) allows the direct determination of individual parameters from an experimental curve obtained from a patient. This will allow quantifying the LTA-based diagnostics in the future. Compared to models [7,35,36], where a supercomputer was used, the present model could be run on a personal computer and might be implemented in the LTA software. However, compared to a model, where platelet aggregation in diabetic retinal microaneurysms was investigated [37], our model (Equation (4)) cannot describe important specific information for medical application such as thrombi size and shape.
It should be noted that the analysis performed here is limited to the positive values of parameters near the physiologically meaningful values obtained from the experimental data. The mathematical model (Equation (1)), which was shown to be capable of a description of other biological processes such as polymerization and clustering [13], could demonstrate other types of behavior. For the most of the study, only two parameters were varied simultaneously (Figure 4). However, it is known that if a bifurcation was not found in the second mode performed in our study, varying all the parameters will not add new bifurcations [38]. Finally, although the sensitivity analysis has shown the preliminary physiological meaning of the parameters, more experimental data with different inhibitors usage are required to verify the obtained data similar to the previous study [39].

Supplementary Materials

The following are available online at https://www.mdpi.com/article/10.3390/math9070759/s1, Figure S1: Bifurcation diagrams for eigenvalues of Jacobian (λ). Figure S2: The effects of variations of the parameter values on the model responses.

Author Contributions

Conceptualization, A.N.S.; methodology, G.A.V. and A.N.S.; software, G.A.V.; formal investigation, G.A.V. and A.A.F.; resources, A.N.S.; writing—original draft preparation, G.A.V.; writing—review and editing, A.A.F. and A.N.S.; visualization, G.A.V.; supervision, A.N.S. All authors have read and agreed to the published version of the manuscript.

Funding

The reported study was funded by RFBR and the Royal Society of London (RS), project number 21-51-10005, and by RFBR, project number 17-00-00138.

Institutional Review Board Statement

The study was conducted according to the guidelines of the Declaration of Helsinki, and approved by the Ethics Committee of CTP PCP RAR (protocol #1 from 12.01.2018).

Informed Consent Statement

Informed consent was obtained from all subjects involved in the study.

Acknowledgments

We thank Mikhail Panteleev for valuable discussions on the subject.

Conflicts of Interest

The authors declare no conflict of interest.

References

  1. Varga-Szabo, D.; Pleines, I.; Nieswandt, B. Cell Adhesion Mechanisms in Platelets. Arterioscler. Thromb. Vasc. Biol. 2008, 28, 403–412. [Google Scholar] [CrossRef]
  2. Filkova, A.A.; Martyanov, A.A.; Dasgupta, A.K.G.; Panteleev, M.A.; Sveshnikova, A.N. Quantitative Dynamics of Reversible Platelet Aggregation: Mathematical Modelling and Experiments. Sci. Rep. 2019, 9, 6217. [Google Scholar] [CrossRef]
  3. Born, G.V.R. Aggregation of Blood Platelets by Adenosine Diphosphate and Its Reversal. Nature 1962, 194, 927. [Google Scholar] [CrossRef]
  4. Stalker, T.J.; Traxler, E.A.; Wu, J.; Wannemacher, K.M.; Cermignano, S.L.; Voronov, R.; Diamond, S.L.; Brass, L.F. Hierarchical Organization in the Hemostatic Response and Its Relationship to the Platelet-Signaling Network. Blood 2013, 121, 1875–1885. [Google Scholar] [CrossRef]
  5. Ling, L.; Liao, J.; Niu, Q.; Wang, X.; Jia, J.; Zuo, C.; Jiang, H.; Zhou, J. Evaluation of an Automated Light Transmission Aggregometry. Platelets 2017, 28, 712–719. [Google Scholar] [CrossRef] [Green Version]
  6. Kaneva, V.N.; Dunster, J.L.; Volpert, V.; Ataullahanov, F.; Panteleev, M.A.; Nechipurenko, D.Y. Modeling Thrombus Shell: Linking Adhesion Receptor Properties and Macroscopic Dynamics. Biophys. J. 2021, 120, 334–351. [Google Scholar] [CrossRef]
  7. Gupta, P.; Zhang, P.; Sheriff, J.; Bluestein, D.; Deng, Y. A Multiscale Model for Recruitment Aggregation of Platelets by Correlating with In Vitro Results. Cell. Mol. Bioeng. 2019, 12, 327–343. [Google Scholar] [CrossRef]
  8. Zheng, X.; Yazdani, A.; Li, H.; Humphrey, J.D.; Karniadakis, G.E. A Three-Dimensional Phase-Field Model for Multiscale Modeling of Thrombus Biomechanics in Blood Vessels. PLoS Comput. Biol. 2020, 16, e1007709. [Google Scholar] [CrossRef]
  9. Danes, N.A.; Leiderman, K. A Density-dependent FEM-FCT Algorithm with Application to Modeling Platelet Aggregation. Int. J. Numer. Methods Biomed. Eng. 2019, 35. [Google Scholar] [CrossRef]
  10. Ye, T.; Shi, H.; Phan-Thien, N.; Lim, C.T. The Key Events of Thrombus Formation: Platelet Adhesion and Aggregation. Biomech. Model. Mechanobiol. 2020, 19, 943–955. [Google Scholar] [CrossRef]
  11. Smoluchowski, M. Attempt for a Mathematical Theory of Kinetic Coagulation of Colloid Solutions. Z. Phys. Chem. 1917, 19, 129–135. [Google Scholar]
  12. Bentz, J.; Nir, S. Mass Action Kinetics and Equilibria of Reversible Aggregation. J. Chem. Soc. Faraday Trans. 1 Phys. Chem. Condens. Phases 1981. [Google Scholar] [CrossRef]
  13. Garzon Dasgupta, A.K.; Martyanov, A.A.; Filkova, A.A.; Panteleev, M.A.; Sveshnikova, A.N. Development of a Simple Kinetic Mathematical Model of Aggregation of Particles or Clustering of Receptors. Life 2020, 10, 97. [Google Scholar] [CrossRef] [PubMed]
  14. Pitt, M.A.; Myung, J.I.; Montenegro, M.; Pooley, J. Measuring Model Flexibility With Parameter Space Partitioning: An Introduction and Application Example. Cogn. Sci. 2008, 32, 1285–1303. [Google Scholar] [CrossRef] [PubMed]
  15. Reichert, P.; Omlin, M. On the Usefulness of Overparameterized Ecological Models. Ecol. Model. 1997, 95, 289–299. [Google Scholar] [CrossRef]
  16. Sagawa, S.; Raghunathan, A.; Koh, P.W.; Liang, P. An Investigation of Why Overparameterization Exacerbates Spurious Correlations. arXiv 2020, arXiv:2005.04345. [Google Scholar]
  17. Kennedy, J.; Eberhart, R. Particle Swarm Optimization. In Proceedings of the IEEE International Conference on Neural Networks, Perth, WA, Australia, 27 November–1 December 1995; Volume IV, pp. 1942–1948. [Google Scholar]
  18. Hoops, S.; Sahle, S.; Gauges, R.; Lee, C.; Pahle, J.; Simus, N.; Singhal, M.; Xu, L.; Mendes, P.; Kummer, U. COPASI–a COmplex PAthway SImulator. Bioinformatics 2006, 22, 3067–3074. [Google Scholar] [CrossRef] [Green Version]
  19. Clewley, R. Hybrid Models and Biological Model Reduction with PyDSTool. PLoS Comput. Biol. 2012. [Google Scholar] [CrossRef] [Green Version]
  20. Volino, P.; Magnenat-Thalmann, N. Comparing Efficiency of Integration Methods for Cloth Simulation. In Proceedings of the Computer Graphics International 2001, Hong Kong, China, 6 July 2001; pp. 265–272. [Google Scholar]
  21. Lu, M.; Huang, J.; Ruan, S.; Yu, P. Bifurcation Analysis of an SIRS Epidemic Model with a Generalized Nonmonotone and Saturated Incidence Rate. J. Differ. Equ. 2019, 267, 1859–1898. [Google Scholar] [CrossRef]
  22. Wu, L.-I.; Feng, Z. Homoclinic Bifurcation in an SIQR Model for Childhood Diseases. J. Differ. Equ. 2000, 168, 150–167. [Google Scholar] [CrossRef] [Green Version]
  23. Zhang, X.; Zhang, Q.; Zhang, Y. Bifurcations of a Class of Singular Biological Economic Models. Chaos Solitons Fractals 2009, 40, 1309–1318. [Google Scholar] [CrossRef]
  24. Cai, L.; Chen, G.; Xiao, D. Multiparametric Bifurcations of an Epidemiological Model with Strong Allee Effect. J. Math. Biol. 2013, 67, 185–215. [Google Scholar] [CrossRef]
  25. Menger, F.M. The Negative Rate Constants of Breslow and Huang. J. Org. Chem. 1991, 56, 6251–6252. [Google Scholar] [CrossRef]
  26. Proimos, G. Platelet Aggregation Inhibition with Glycoprotein IIb-IIIa Inhibitors. J. Thromb. Thrombolysis 2001, 11, 99–110. [Google Scholar] [CrossRef]
  27. Peter, K.; Schwarz, M.; Ylänne, J.; Kohler, B.; Moser, M.; Nordt, T.; Salbach, P.; Kübler, W.; Bode, C. Induction of Fibrinogen Binding and Platelet Aggregation as a Potential Intrinsic Property of Various Glycoprotein IIb/IIIa (IIbβ3) Inhibitors. Blood 1998, 92, 3240–3249. [Google Scholar] [CrossRef]
  28. Mindukshev, I.; Gambaryan, S.; Kehrer, L.; Schuetz, C.; Kobsar, A.; Rukoyatkina, N.; Nikolaev, V.O.; Krivchenko, A.; Watson, S.P.; Walter, U.; et al. Low Angle Light Scattering Analysis: A Novel Quantitative Method for Functional Characterization of Human and Murine Platelet Receptors. Clin. Chem. Lab. Med. 2012, 50. [Google Scholar] [CrossRef] [PubMed]
  29. Cazenave, J.-P.; Ohlmann, P.; Cassel, D.; Eckly, A.; Hechler, B.; Gachet, C. Preparation of Washed Platelet Suspensions From Human and Rodent Blood. In Platelets and Megakaryocytes; Humana Press: New Jersey, NJ, USA, 2004; Volume 272, pp. 13–28. ISBN 978-1-59259-782-6. [Google Scholar]
  30. Babakhani, P.; Bridge, J.; Phenrat, T.; Fagerlund, F.; Doong, R.; Whittle, K.R. Comparison of a New Mass-Concentration, Chain-Reaction Model with the Population-Balance Model for Early- and Late-Stage Aggregation of Shattered Graphene Oxide Nanoparticles. Colloids Surf. A Physicochem. Eng. Asp. 2019, 582, 123862. [Google Scholar] [CrossRef]
  31. Guy, R.D.; Fogelson, A.L. Probabilistic Modeling of Platelet Aggregation: Effects of Activation Time and Receptor Occupancy. J. Theor. Biol. 2002, 219, 33–53. [Google Scholar] [CrossRef]
  32. Link, K.G.; Sorrells, M.G.; Danes, N.A.; Neeves, K.B.; Leiderman, K.; Fogelson, A.L. A Mathematical Model of Platelet Aggregation in an Extravascular Injury Under Flow. Multiscale Model. Simul. 2020, 18, 1489–1524. [Google Scholar] [CrossRef]
  33. Liu, Z.L.; Ku, D.N.; Aidun, C.K. Mechanobiology of Shear-Induced Platelet Aggregation Leading to Occlusive Arterial Thrombosis: A Multiscale in Silico Analysis. J. Biomech. 2021, 120, 110349. [Google Scholar] [CrossRef] [PubMed]
  34. Du, J.; Kim, D.; Alhawael, G.; Ku, D.N.; Fogelson, A.L. Clot Permeability, Agonist Transport, and Platelet Binding Kinetics in Arterial Thrombosis. Biophys. J. 2020, 119, 2102–2115. [Google Scholar] [CrossRef]
  35. Pothapragada, S. Supercomputer Simulations of Platelet Activation in Blood Plasma at Multiple Scales. In Proceedings of the 2014 International Conference on High Performance Computing & Simulation (HPCS), Bologna, Italy, 21–25 July 2014; pp. 1011–1013. [Google Scholar]
  36. Van Rooij, B.J.M.; Závodszky, G.; Azizi Tarksalooyeh, V.W.; Hoekstra, A.G. Identifying the Start of a Platelet Aggregate by the Shear Rate and the Cell-Depleted Layer. J. R. Soc. Interface 2019, 16, 20190148. [Google Scholar] [CrossRef] [PubMed]
  37. Li, H.; Sampani, K.; Zheng, X.; Papageorgiou, D.P.; Yazdani, A.; Bernabeu, M.O.; Karniadakis, G.E.; Sun, J.K. Predictive Modelling of Thrombus Formation in Diabetic Retinal Microaneurysms. R. Soc. Open Sci. 2020, 7, 201102. [Google Scholar] [CrossRef] [PubMed]
  38. Strogatz, S.H. Nonlinear Dynamics and Chaos with Student Solutions Manual: With Applications to Physics, Biology, Chemistry, and Engineering, 2nd ed.; CRC Press: Boca Raton, FL, USA, 2018; ISBN 978-0-429-68015-1. [Google Scholar]
  39. Bustos, D.M.; Iglesias, A.A. The Kinetic Properties of Liver Glucokinase and Its Function in Glucose Physiology as a Model for the Comprehensive Study of Enzymes’ Kinetic Parameters and Reversible Inhibitors. Biochem. Mol. Biol. Educ. 2000, 28, 332–337. [Google Scholar] [CrossRef]
Figure 1. Schemes of experimental (a) and theoretical (b) processes of platelet aggregation in suspension. (a) Conventional light transmission aggregometry. A ray of light after passing through a cuvette with a suspension of platelets enters the photocell. Due to the formation of large local light scattering centers—platelet aggregates—the total light transmission of the suspension increases. The light transmission measured by the aggregometry determines the degree of platelet aggregation. (b) Illustration of a mathematical model of platelet aggregation based on the law of mass action between aggregates (n) and single platelets (p) [2].
Mathematics 09 00759 g001
Figure 2. Fitting of Equation (3) to experimental data on platelet aggregometry in response to ADP. (ac) Five parameters of Equation (3) were fitted by means of the “Particle Swarm” parameter estimation method to describe experimental data of platelet aggregation in response to ADP at 2.5 μM (a), 5 μM (b), or 10 μM (c). Blue lines denote variable y, black lines denote variable a, red squares denote the logarithm of experimental OD values. Experimental data are typical curves from n = 10.
Mathematics 09 00759 g002
Figure 3. Phase planes for the models, presented in Figure 2. The models were fitted to experimental data of platelet aggregation in response to ADP at 2.5 μM (a), 5 μM (b), or 10 μM (c). Nullclines are given in grey, trajectories from point {a,y} = {1,0} into steady state (same as in Figure 2) are given in black. Steady state parameters (the asterisk(*) denotes the stationary values of the variables): (a) a * = 1.047, y * = 0.327, λ1 = −0.24, λ2 = −0.041; (b) a * = 1.06, y * = 1.06, λ1 = −0.17, λ2 = −0.028; (c) a *= 1.012, y *= 0.78, λ1 = −0.68, λ2 = −0.014.
Mathematics 09 00759 g003
Figure 4. Bifurcation diagrams. Singular point values of a and y for Equation (4) as a function of parameter k 3 from {−1, −0.9, −0.8, …, −0.1, −0.01, −0.0001, 0, 0.0001, 0.001, 0.01, 0.1, …, 0.9, 1}. (a) Parameter k 3 is varied, other parameters are given in Table 1 for ADP = 5 μM; (b) parameter k 3 is varied, k 1 = 1 , other parameters are given in Table 1 for ADP = 2.5 μM; (c) parameter k 3 is varied, k 1 = 0.01 , other parameters are given in Table 1 for ADP = 5 μM; (d) parameter k 3 is varied, k 3 = 0.0001 , other parameters are given in Table 1 for ADP = 5 μM; (e) parameter k 3 is varied, k 1 = 1 , other parameters are given in Table 1 for ADP = 10 μM.
Mathematics 09 00759 g004
Figure 5. Numerical investigation of the parameter space for ADP = 2.5 μM. (a) Typical bifurcation diagrams demonstrating an area with 4 singular points (log10(a) as a function of k−1 and k3, other parameters were set at 0.49 (k1), 0.067 (k2), 0.026 (k−3). It can be seen that all four singular points exist for almost any combination of parameters. However, the third and fourth points are always “unstable”, while the second is always stable and positive, and the first could be either stable or unstable. (b,c) Bifurcation diagrams for the values of a (b), inset show the value of k3 for which 4 singular points with positive values of a exist) and the real part of the first eigenvalue of Jacobian (c), inset shows a close up view near Re(λ) = 0), k3 is varied, k−1 = 5, k1 = 0.49, k2 = 0.067, k−3 = 0.026. Together, (b,c) demonstrate the existence of two “stable nodes” (first and second) with positive values of a for a subspace of parameter space. At k3 = 0.0025, a “stable node”–“unstable node” bifurcation happens for the second singular point (black lines). (d) Phase plane for the system with the following parameter set: k−1 = 0.05, k1 =4.93, k2 = 0.675, k3 = 0.1, k−3 = 0.026. Nullclines are given in red, trajectories from point {a,y} = {1,0} into steady state are given in blue. Stable singular points are given in blue, unstable singular points are given in red, directions of phase trajectories are shown in grey.
Mathematics 09 00759 g005aMathematics 09 00759 g005b
Figure 6. The effects of variations in parameter values on the model responses. Time courses for a(t) and y(t) for parameter sets given in Table 1 for the corresponding ADP concentrations with one parameter being varied for each plot. For panels (ac) k 1 was varied; for (df)   k 2 was varied; for (gi)   k 3 was varied.
Mathematics 09 00759 g006
Table 1. Estimated parameter values for Equation (3) for experimental datasets presented in Figure 2.
2.5 μM 15 μM10 μM
k−10.50271.73 × 10−110.1995
k−30.02620.027780.01329
k10.0049330.014690.003955
k20.67570.16170.86886
k30.10420.026270.01731
1 ADP concentrations for the corresponding experimental data.
Publisher’s Note: MDPI stays neutral with regard to jurisdictional claims in published maps and institutional affiliations.

