Article

Designing Tasks for Introducing Functions and Graphs within Dynamic Interactive Environments

by
Samuele Antonini
1,* and
Giulia Lisarelli
2
1
Department of Mathematics “F. Casorati”, University of Pavia, 23100 Pavia, Italy
2
Department of Mathematics, University of Pisa, 56127 Pisa, Italy
*
Author to whom correspondence should be addressed.
Mathematics 2021, 9(5), 572; https://doi.org/10.3390/math9050572
Submission received: 31 January 2021 / Revised: 24 February 2021 / Accepted: 3 March 2021 / Published: 7 March 2021

Abstract

:
In this paper, we elaborate on theoretical and methodological considerations for designing a sequence of tasks for introducing middle and high school students to functions and their graphs. In particular, we present didactical activities with an artifact realized within a dynamic interactive environment and having the semiotic potential for embedding mathematical meanings of covariation of independent and dependent variables. After laying down the theoretical grounds, we formulate the design principles that emerged as the result of bringing the theory into a dialogue with the didactical aims. Finally, we present a teaching sequence, designed and implemented on the basis of the design principles and we show how students’ efforts in describing and manipulating the different graphs of functions can promote their production of specific signs that can progressively evolve towards mathematical meanings.

1. Introduction

The concept of function is central in modern mathematics and is one of the basic concepts in mathematics teaching and learning.
The Indicazioni Nazionali of the Italian Ministry of Education establishes that at the end of high school (grade 13), students should have learned functions, differential calculus, integrals, and they should be able to interpret the graph of a function and to represent a real-valued function of a real variable through its graph, even by using technological artifacts for representing data [1].
Indeed, the competence related to reading a graph and representing a phenomenon through a simple function and its graph is recognized as one of the main mathematical competencies for citizenship. The Unione Matematica Italiana suggests that one of the main didactical aims in learning mathematics is the acquisition of functional thinking by students [2] (p. 206). This type of thinking can be fostered through a strong connection between the function and its graph, the interpretation and the analysis of its behavior, and the link to the analytical expression. In other words, in addition to the techniques of calculus, is the importance of qualitative analysis, which should become a habit of mind for students and teachers.
However, from a didactical point of view, it should be considered that the conceptual area of functions and their representations involves significant cognitive complexities. There is a wide literature describing a variety of difficulties related to the learning of functions [3,4,5,6,7]. Moreover, many researchers reported on possible problems encountered by students when dealing with the graphical representation of a function [8,9]. In particular, it is well known that students often see a Cartesian graph of a function as an object, a static picture of a physical situation, without relating the Cartesian graph to the underlying functional relationship and without imaging the trajectory of a point moving on the plane according to the covariation of two quantities, one depending on the other. This is pointed out by Carlson [10] and Thompson [11], who stressed the importance of conceiving functions as asymmetric relations between two variables.
In order to address this type of difficulty, some researchers implemented mathematical tasks involving dynamic representations of covarying quantities. This approach seems to have supported middle and high school students in considering functional dependency when dealing with graphical representations of functions [8,12,13,14,15].
The aim of the study presented in this paper is to design a sequence of tasks to introduce middle and high school students to functions as covariation. Moreover, the paper is intended to theoretically motivate the choices underlying the construction of the tasks based on the identification of the cognitive processes to be promoted and the ways in which they can be promoted. After laying down our theoretical grounds, the first fundamental step towards the realization of this aim consists of formulating the design principles. They emerged as the result of an attempt to bring all the theoretical lenses adopted into a dialogue with our educational objective. Then we present a teaching sequence on real-valued functions of a real variable and their graphical representations, designed and implemented on the basis of the design principles. The paper ends with an a priori analysis of the students’ cognitive processes that can be supported by the activities of the sequence. The a priori analysis is conducted in the light of the theoretical frameworks that will be reported in the next section, and it is also corroborated by some qualitative data collected in previous studies [16,17,18], where cognitive processes enacted by students, carrying out some activities that are part of our sequence, are analyzed from different theoretical perspectives.

Theoretical Framework

This study is situated within the framework of design-based research (DBR). Generally speaking, the aim of DBR is to promote specific teaching-learning processes through both the theoretical elaboration, that leads to the formulation of design principles and the development of teaching materials based on these principles.
Theories play a central role in DBR and different levels of generality of theories are considered [19,20]. The following theoretical levels are taken into account in the literature [21] and we list them from the most general to the most specific: orienting frameworks or background theories; domain-specific instruction theories; local instruction theories.
  • Orienting frameworks [20] or background theories [22]: according to Prediger, Gravemeijer, and Confrey [21] (pp. 884–885), these theories are the foundation of the research that significantly influence both the design and the way the data are interpreted.
In this study, we adopt a sociocultural perspective [23]. In this frame, learning arises through the collaboration between individuals that cooperate to accomplish a task with a common aim. The shared social experience promotes interpersonal (external) processes that can be internalized becoming an intrapersonal (internal) process. In the process of internalization, the semiotic production (i.e., the production of signs, in particular of language) assumes a fundamental role. Signs have a twofold function as mediating tools: as a communicative or cultural tool, used for the collaborative construction and for sharing of knowledge; and as a psychological tool, used for individual thought and reflection.
  • Domain-specific instruction theories: according to Prediger, Gravemeijer, and Confrey [21] (p. 885) they are theories that “are specific for the school subject, in our case mathematics education, and offer a general framework for action”.
This study is rooted in the Vygotskian perspective, with particular regard to the social construction of knowledge and semiotic mediation accomplished through cultural artifacts. The designed tasks involve the use of digital artifacts to promote students’ construction of mathematical meanings through the production of signs, within the Theory of Semiotic Mediation [24]. In this theory, the activities with an artifact aim to promote “the evolution of signs expressing the relationship between the artifact and tasks into signs expressing the relationship between artifact and knowledge” [24] (p. 753). In this way, the artifact signs can evolve into mathematical signs, and then personal meanings can evolve into desired mathematical meanings, where the artifact assumes the role of the tool of semiotic mediation. This evolution of meaning is not necessarily spontaneous. Social interactions, in particular verbalization, and the specific teacher’s interventions, as in Mathematical Discussion [25], can promote the production of collective signs, the awareness of the meanings of different signs, and their evolution towards mathematical meanings.
  • Local instruction theories, that address the learning of a specific topic, in this case, functions and graphs. They are “theories about a possible learning process, together with theories about possible means of supporting that learning process […]. These means of support include the classroom social norms and the socio-mathematical norms that have to be in place” [21] (p. 885).
In this paper, we are interested in real functions and their graphs and we discuss these concepts from an epistemological point of view. It is possible to think about functional dependency as a correspondence, which means functions as entities that accept an input and produce an output. However, functional dependency can be seen also as covariation, as a process involving two quantities varying together [11,26,27]. A representation of functions could highlight one of these points of view and hide the other one. In mathematics education, the covariational view of functions is essential for understanding more advanced concepts of calculus that are related to functions, such as limits and derivatives [12,28,29]. More specifically, in this study, we consider a qualitative description of covariation as a dynamic and asymmetric relationship between the variations of the two variables.
Given these theoretical lenses, addressing different levels of generality, we first worked to make a bricolage. The term was suggested by Gravemeijer and Cobb [22] and it refers to the work of tinkering with these different theoretical resources in order to formulate the design principles.
In particular, we observe that the asymmetric relation between variables can be mediated (in the sense of Theory of Semiotic Mediation) by a dynamic interactive environment (DIE), as explored by Falcade, Laborde, and Mariotti [13]. A DIE makes it possible to construct geometrical objects and to move them by dragging some elements of the construction and maintaining the mathematical relationships established during the construction process. Therefore, it is possible to distinguish two types of movement: direct, when the user acts directly on a base object, i.e., a point that gives rise to the construction; and indirect if the observed movement is obtained as a consequence of dragging another object [30]. Indeed, it is thanks to the use of dragging that the dependence relation between variables, that characterizes functional relationships, can be experienced in terms of these two different types of motion. In this context, dragging assumes the role of a psychological tool [31,32].
In the following sections, after the presentation of the design principles, we describe a sequence of activities that we design to introduce students to the real-valued function of a real variable and their graphs, focusing on the evolution of signs in different representations of covariation within a DIE.

2. Methods

2.1. The Design Principles

In the DBR methodology, the task design emerges as a result of a dialogue between theoretical perspectives and educational objectives. The first part of this study concerns the formulation of design principles as the result of such a dialogue. The role played by these different principles is to guide the design of the task sequence.
As we did in the previous section with the theories involved in this study, we formulate the design principles addressing different levels of generality and different focuses, which we identify as methodological, epistemological, and related to the artifact.

2.1.1. Methodological Principles

Methodological principles emerge by orienting frameworks and domain-specific instruction theories, the Vygotskian perspective, and the Theory of Semiotic Mediation. These principles address the general methodological choices in the design and in managing the activities:
  • Minimize teacher’s interventions during classroom activities in order to pose particular attention to students’ interactions and to promote the production of individual and collective signs and meanings. The teacher orchestrates the discussion so that the development of students’ meanings towards mathematical meanings is not forced but emerges in the construction of a semiotic chain.
  • Make students work alone, in pairs, in small groups, and in the whole-class group.
  • Foster students to discuss as well as ask students for written explanations to support their production of signs, to communicate and to become aware of the personal, collective, and mathematical meanings.
  • Use (or not) some mathematical formal terms in the text of the task depending on the goal of the activity and concerning students’ words used in previous lessons.
  • Support the development of a suitable language, from a mathematical point of view, to communicate and describe the representations proposed.
  • Create conflictual situations for students who experience a mismatch between what they see and what they expect to see.
  • Do not give definitions a priori. The aim is not to explain certain properties of functions but to promote the production of a language that can evolve towards a mathematical language about functions and their graph.
  • Use artifacts to support the development of meanings from personal to mathematical meanings.

2.1.2. Epistemological Principles

Epistemological principles concern different aspects of the mathematical meanings that are related to the educational objectives. Their formulation is influenced by our local instruction theories, and especially, by the theories on covariational reasoning:
  • Focus on students’ exploration of covariation.
  • Focus on qualitative aspects, to study the functions’ behavior and the relationships between changes in the variables.
  • Ask for a description of the possible changes of the two variables, instead of a description of what specific values they can assume.
  • Represent the dependence relation of f ( x ) to x in terms of an asymmetric relation between the two variables.
  • Use dynamic representations of functions to foster comparisons between the variations of the two variables in the domain and the codomain.

2.1.3. Artifact-Related Principles

The artifact-related principles guide us both in the choice of the artifact and in the design of the activities with the artifact. These principles arise from the domain-specific instruction theories and the local instruction theories:
  • Use an artifact that effectively implements the above epistemological design principles. In particular, the artifact has to allow the construction of both static and dynamic representations of functions. Moreover, through the interaction with the artifact, students should explore covariation of variables.
  • Represent the dependence relation of f ( x ) to x in terms of the asymmetric relationship between the movements of the two variables.
  • Build and reinforce the relations between the different representations of functions, especially between dynamic and static ones.
  • Ask for transitions between dynamic and static representations of functions and work on the differences and similarities between these different representations.
  • Define ad hoc functions, with a specific behavior or property that can be embedded in the artifact.
  • Give students previously constructed dynamic interactive files with dynamic graphs that they can manipulate and explore by dragging and by activating the trace mark.
  • Use different dynamic graphs characterized by different reciprocal positions of the axes. In particular, use one-dimensional graphs where both variables move in the same direction and two-dimensional graphs where the two variables move along the Cartesian axes.
  • Do not use numbered axes in the initial stages, in order to put the focus on the movement of variables instead of on their values.
  • Disable the magnetism in the files. This is a property that DIEs allow to a point that makes it move on the line representing the real axis as if it has a magnet that attaches it to the whole numbers. Disabling this tool, the dragging of the point is more uniform.
  • Use ticks instead of points, which is the default construction offered by DIEs, to represent the variables, in order to highlight the distinction between the meanings of “one value” and “a pair of values”.
In the next section, we discuss some epistemological and cognitive issues in order to design a didactical sequence of activities based on the design principles.

2.2. From the Design Principles to the Didactical Sequence

The usual representation of real-valued functions of a real variable is the Cartesian graph, which mathematically is the set of points of ( x , f ( x ) ) where the independent variable x belongs to the domain of the function. The Cartesian graph is a powerful representation of functions since it offers an immediate and global view of the “behavior of the function”. From a cognitive point of view, interpreting and manipulating a graph requires the reconstruction of the relationship between the two real variables x and f ( x ) , starting from the set of points P of coordinates ( x , f ( x ) ) . ONE point P of the graph is a point in the Cartesian plane that represents the functional relation between TWO numbers (x and f ( x ) ). These TWO numbers belong to the same set of real numbers, but they correspond to TWO points belonging to TWO different straight lines, that are orthogonal to each other, respectively the x-axis and the y-axis. The choice of representing the same set of real numbers as two different and orthogonal lines makes the construction of the graph possible, but it brings high complexity from a cognitive point of view, as highlighted in the literature, e.g., [4,5,7]. In order to “see” the covariation of variables in a graph, it is necessary to image the variation of the (independent) variable x and the consequent variation of the (dependent) variable f ( x ) , to coordinate the two variations and to image the relationship between them. In other words, starting from a graph, that is a static curve in the Cartesian plane, the identification of the covariation of the two variables requires a dynamic reconstruction by the subject that has to reconstruct and coordinate the movements expressing the variations. As already mentioned in the paper, this reconstruction is not straightforward for many students, who make several mistakes in the interpretation and construction of Cartesian graphs.
Appropriate use of specific artifacts makes it possible to perceive variation as movement and to act on the movement itself, consistently with the constraints imposed by the dependency between the two variables. In fact, a dynamic representation cannot be realized within a paper and pencil environment, and it is necessary to make use of appropriate supports, such as dynamic geometry software [33].
Moreover, the use of artifacts can also go far beyond the possibility of perceiving and acting on the variation of the variables. The Theory of Semiotic Mediation [24] considers an artifact to be an instrument of semiotic mediation, as it can have a dual relationship with personal meanings and mathematical meanings. It can, therefore, play a powerful role in the construction of mathematical meanings and, thus, in the learning process: “…on the one hand, personal meanings are related to the use of the artifact, in particular in relation to the aim of accomplishing the task; on the other hand, mathematical meanings may be related to the artifact and its use. This double semiotic relationship will be named the semiotic potential of an artifact. Because of this double relationship, the artifact may function as a semiotic mediator and not simply as a mediator, but such a function of semiotic mediation is not automatically activated; we assume that such a semiotic mediation function of an artifact can be exploited by the expert (in particular the teacher) who has the awareness of the semiotic potential of the artifact both in terms of mathematical meanings and in terms of personal meanings” [24] (p. 754, original emphasis).
According to the Theory of Semiotic Mediation, we analyze the semiotic potential of DIEs regarding the construction of mathematical meanings related to the concept of function.
In this paper, we focus on representations of functions realized through a DIE and known as DynaGraphs [34], which are dynamic representations in which the independent variable is dynamically draggable on a line and is presented separately from its image. Both the x-axis and y-axis are horizontal; originally, they were referred to as “the x-Line” and “the f ( x ) -Line” (see Table 1).
The independence of the x variable is realized by the possibility of freely dragging a point, bound to a line (the x-Line); the resulting movement visually mediates the variation of the point within a specific domain. Whereas the dependence of the f ( x ) variable is realized by an indirect motion: the dragging of the independent variable along its axis causes the motion of the dependent variable, bound to another line (the f ( x ) -Line), that cannot be directly dragged.
In other words, the experience of dragging and of the two types of motion is related to functional dependency. Moreover, this dependency is then interpreted as invariant under dragging, when exploring different dynamic representations of a function in a DIE [35,36]. This is used to lead students from the production of a language in the context of the artifact to a mathematical language, for example, in the transition from the description of the different motions to the description of the relationship in terms of logical dependency between variables.
The relation between the two movements represents, in fact, the covariation between the two variables. For example, if the two variables in the DynaGraph move in the same direction, the function is increasing, if they move in opposite directions, the function is decreasing. A constant function is represented with the independent variable that can be dragged by a direct motion and the other variable standing still. The relations existing between the mathematical properties of a function and the properties of its dynamic representation are many and they are very deep from a mathematical point of view, see, for example, [37]. In terms of the Theory of Semiotic Mediation [24], the artifact, that is constituted by dynamic graphs, embeds a mathematical knowledge and it is linked to artifact signs (signs related to the movement of points on the screen) and mathematical signs (signs related to the functions’ properties expressed within a mathematical theory).
Another very important tool offered by many DIEs is the trace of a point. The trace mark allows displaying the trajectory of an object during the dragging action. For example, by activating the trace mark on the independent variable x, when x is dragged in an interval [ a , b ] , the part of the x-line corresponding to [ a , b ] will be displayed. In a similar way, by activating the trace mark on the dependent variable f ( x ) , when x is dragged in [ a , b ] , all the positions assumed by f ( x ) will be displayed and then the subset of the f ( x ) -line representing the set f ( [ a , b ] ) will be marked.
In summary, dynamic graphs embed mathematical meanings that play a central role in the construction of meanings related to the concept of function. The direct/indirect motion is strictly connected to the mathematical meaning of functional relationship and to the possibility of distinguishing the independent variable from the dependent one. The trace activated on one of the two variables is connected to mathematical meanings like subsets of the domain, image of subsets of the domain, and to the graph itself (see below). The relation between the movements of the ticks is related to monotonicity properties and the relation between the speed of these movements is connected to the derivative. The change of direction of the tick representing the dependent variable is related to the presence of a relative maximum/minimum, etc. Obviously, we could go much further by carrying out an accurate analysis that leads to identifying the semiotic potential of the artifact in question.
An important application of the use of the trace mark in this study is the construction of the Cartesian graph as the trajectory of the point ( x , f ( x ) ) , displayed thanks to the activation of the trace, for x varying in the domain of the function. In this way, it is possible to represent both the trajectory of the moving point, and then to visualize the (dynamic) behavior of the function, and the global (and static) graph.
We observe that it is possible to design different dynamic representations by varying the position of the two lines representing the domain of variation of x and f ( x ) respectively. In particular, we play on this possibility to build a sequence of tasks with the aim of promoting students’ production of signs, the construction, and the development of mathematical meanings related to functions and their Cartesian graph.
The sequence thus unfolds in different dynamic representations of functions. To slim down the narration, we are going to use the following acronyms referring to the different graphs of functions: DGp, DGpp, DGc, and SGc. The first letter stands for the modality in which it has been designed (D: dynamic, S: static), while the lower case letters indicate the number and the position of the axes (p: one horizontal line, pp: two horizontal parallel lines, c: Cartesian plane).
In more detail:
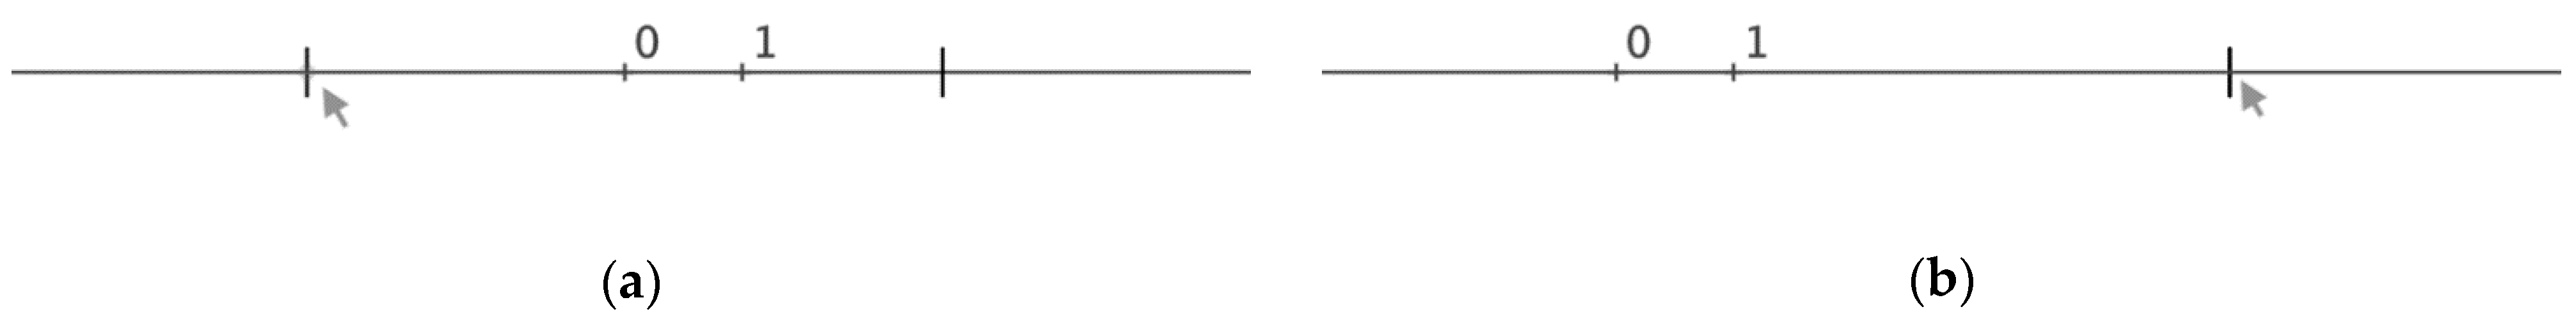
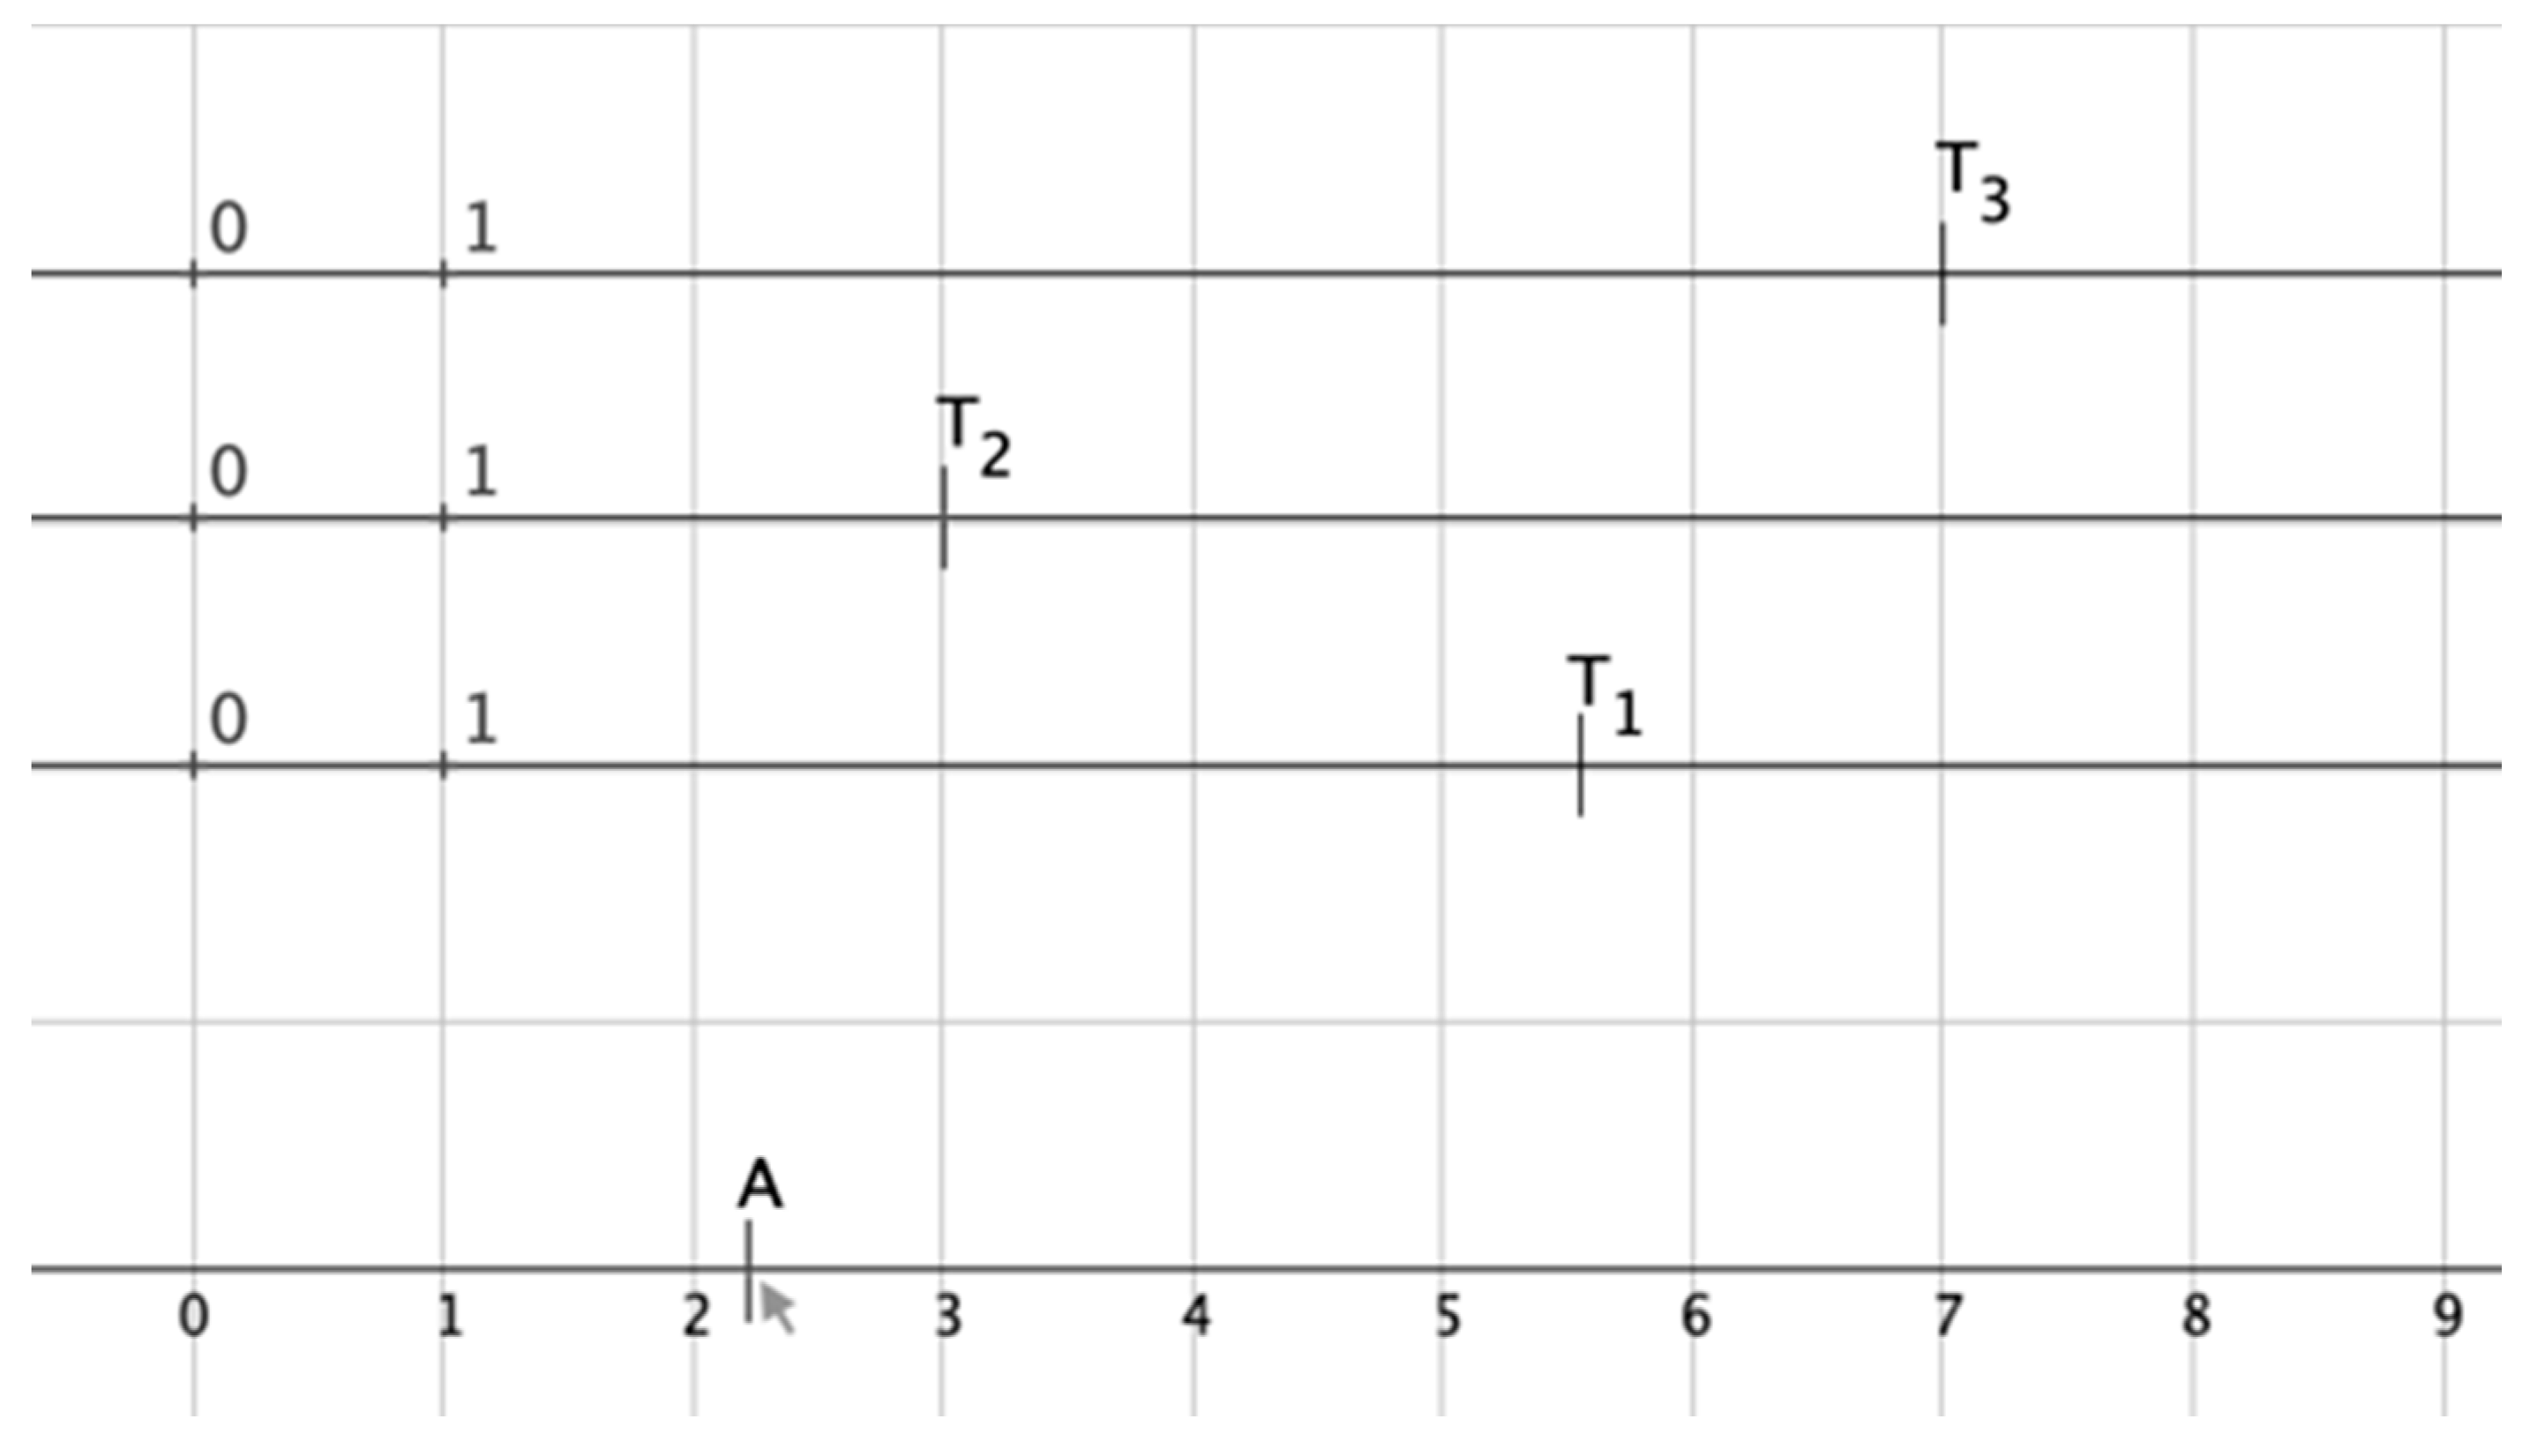
  • DGp is a dynamic graph where, unlike the DynaGraphs described in [34], we bound the two variables on the same line to stress their belonging to the same set of numbers. The dynamic interactive file contains one fixed horizontal line, with two ticks bound to it.
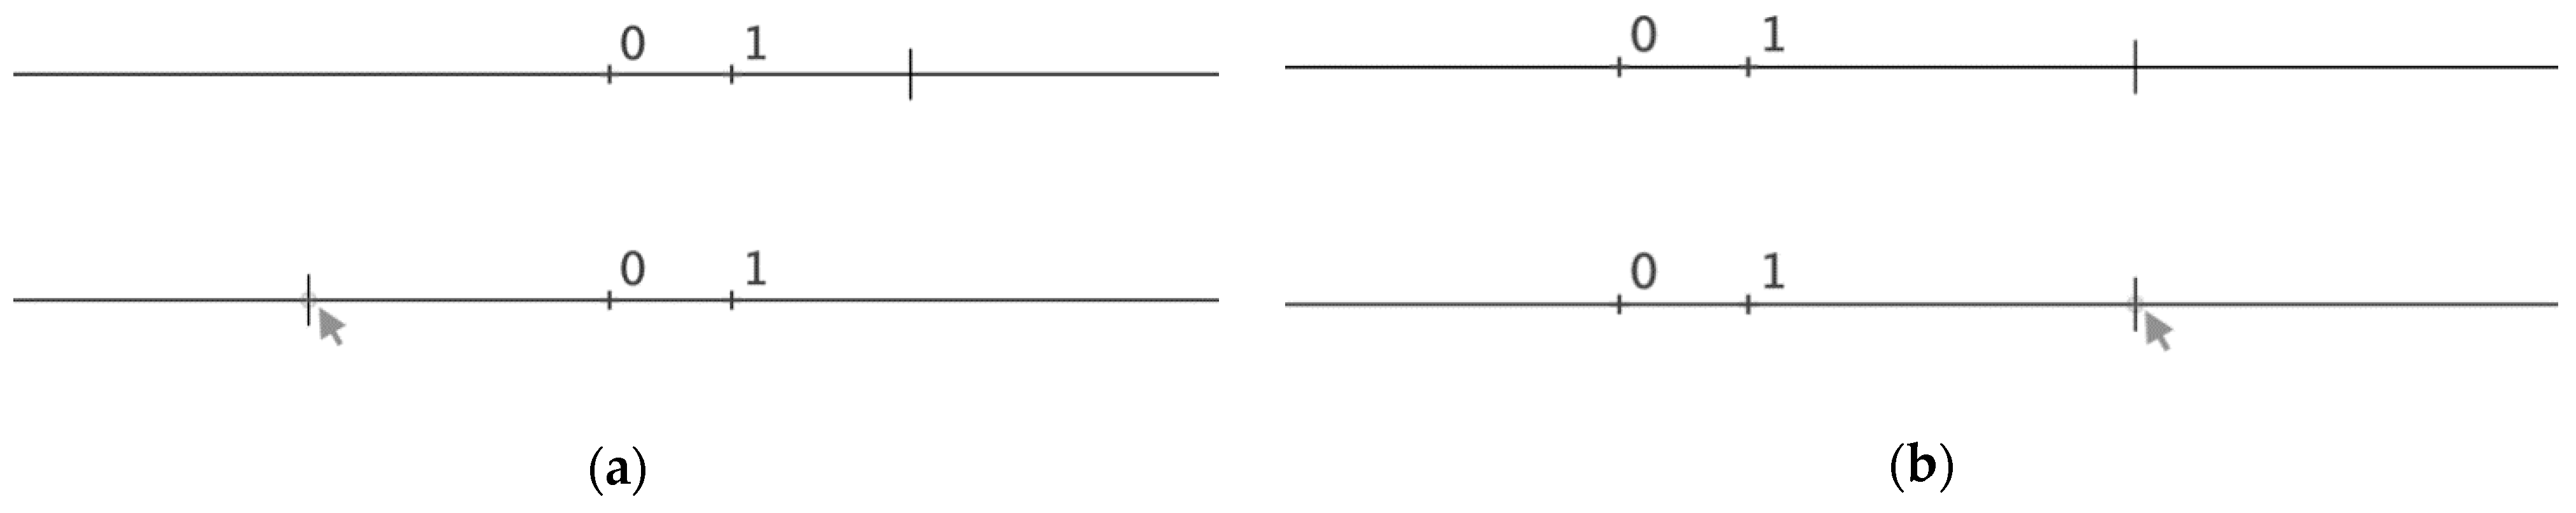
  • DGpp appears like the traditional DynaGraph and it works as a DGp, but the two variables are bound to move along two distinct parallel lines.
  • The dynamic representation DGc brings us closer to the Cartesian graph of the function. In this representation, the two lines on which the variables move are perpendicular.
  • SGc is the well-known Cartesian graph, that can be drawn on a piece of paper.
The representations are summarized in Table 1.
In summary, through a sequence of activities, students construct the SGc of a function as the product of a process of interaction between the DGc and the curve in the Cartesian plane. It is from the relationship that binds together these two elements that the Cartesian graph assumes its meaning as a representation of a function. This interplay can be revealed by considering simultaneously the curve drawn in the plane and the underlying covariation between the two real variables, one depending on the other. In the sequence, we made it possible through the use of the trace mark. In particular, by constructing the point of coordinates ( x , f ( x ) ) and by activating the trace on it, as x is dragged along its line, the trajectory of ( x , f ( x ) ) remains plotted and visible; then the well-known Cartesian graph can be displayed (Figure 1).

3. Results: The Didactical Activities

In this section, we present a didactical sequence on the introduction of real-valued functions of a real variable and their graphical representations. The sequence is designed based on the design principles presented above and it can be proposed to both middle and high school students. Similar activities have been experimented with and analyzed [16,17,18,38,39] through different theoretical frameworks.
Before getting into the heart of some activities, we make some observations about the structure of our sequence that starts from a DGp and brings us to the construction of an SGc.
In the following activities, students are given some files with dynamic representations of some functions. The main task is: “Explore the construction, identify and describe possible movements by using the dragging tool.” Specific requests are then made in some tasks to focus students’ exploration on specific aspects of functions and specific properties of the representations.
To simplify the presentation, we group the activities into three groups: activities with dynamic representations; activities for the construction of the Cartesian graph; activities for the transitions between different representations.

3.1. Activities with Dynamic Representations
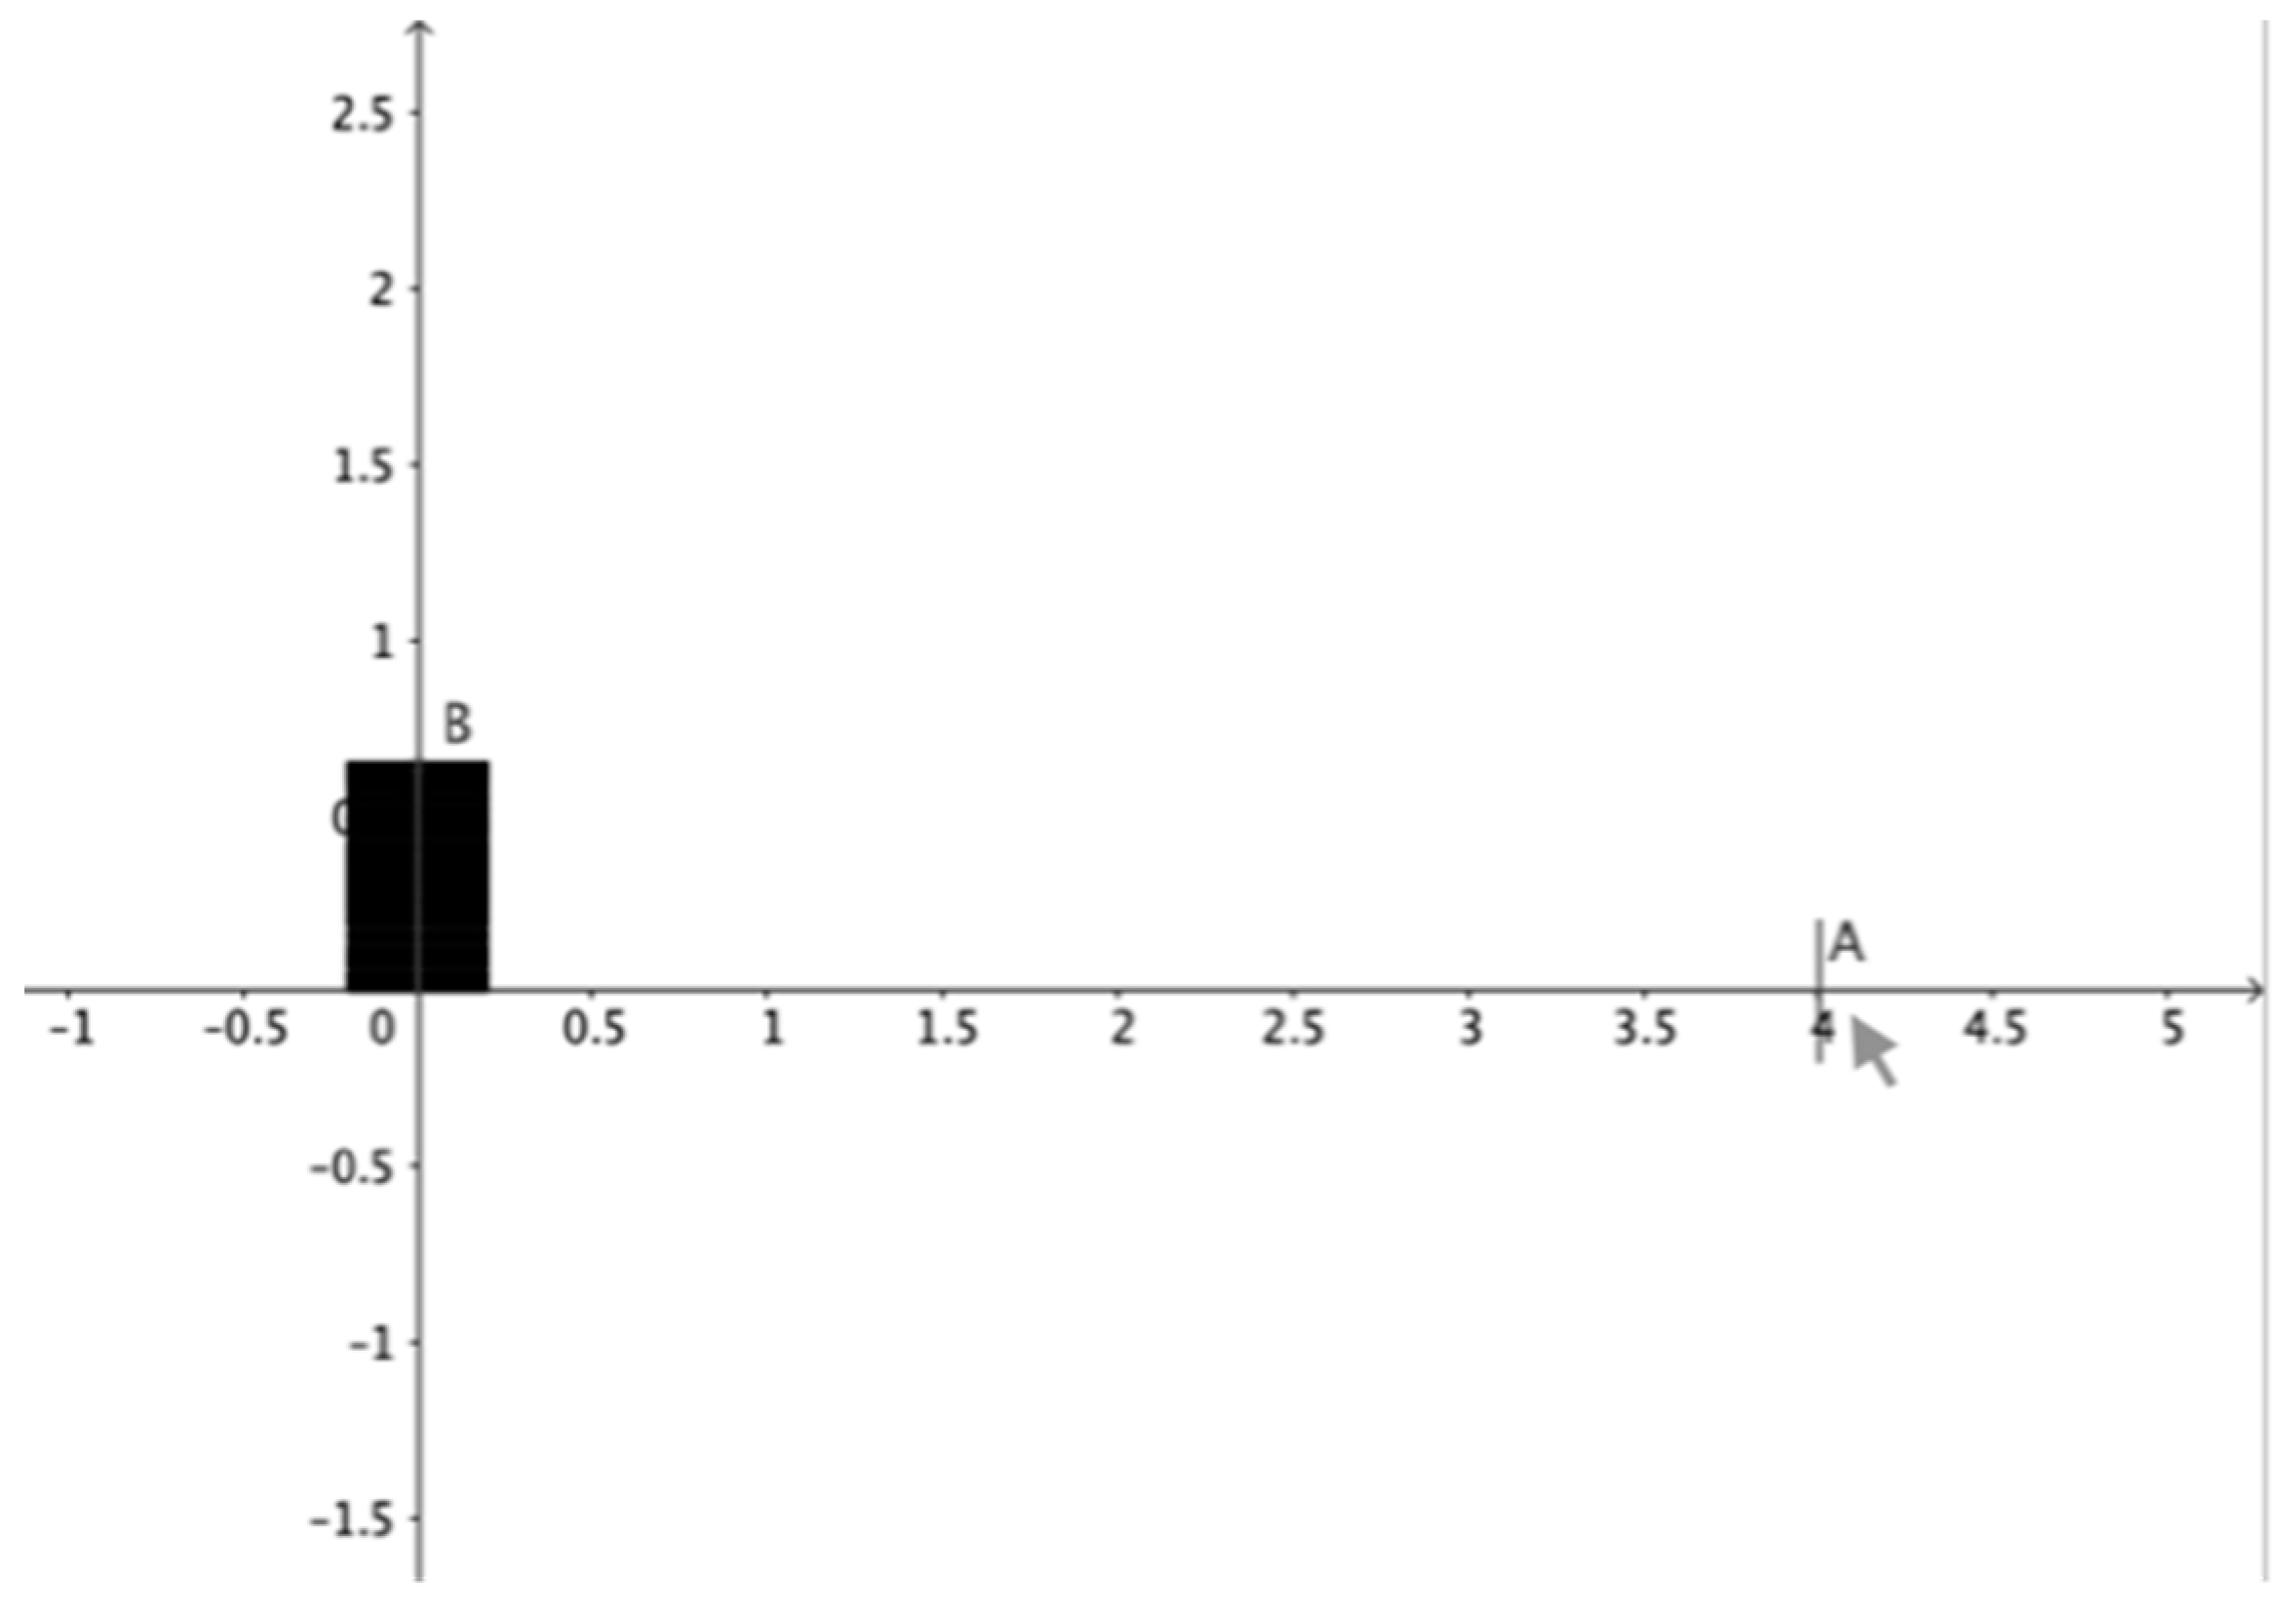
Activity 1
AIMS: To create a situation in which students can experience the functional dependency and construct a language for describing variables and dependency.
TASK: Explore the construction, identify and describe possible movements by using the dragging tool and write down your own observations on a sheet of paper.
DESCRIPTION: Students can observe and act on pre-designed interactive files, with the DGp of different functions and they are asked to work alone or in pairs. The functional relationship is experienced through the possibility of direct and indirect action. The DGp has one unnumbered line in which only the numbers 0 and 1 are marked. The unnumbered line allows students to focus their attention on the movements of the ticks and not on the numbers where they stop. A description is expected in terms of the distinction between the two variables by assigning them different names and in terms of the reciprocal movements, hence the covariation.
Activity 2
AIMS: To motivate the choice of introducing a second line of real numbers and a new representation, the DGpp.
TASK: Explore the construction, identify and describe possible movements by using the dragging tool and write down your own observations on a sheet of paper.
DESCRIPTION: Students are asked to work alone or in pairs on a pre-designed interactive file, with the DGp of the function f ( x ) = | x | (or other functions such that f ( x ) = x in some intervals). This particular function can promote an inner conflict for students when they investigate the movement of the two variables for positive values of the independent one since for these values, the two ticks are perfectly overlapped and they move together. As shown in Figure 2, in the DGp it is not possible to know if there are two overlapped ticks or if the tick representing the dependent variable is missing. This specific case shows the gains of having the two lines with the variables separated (Figure 3), which is relevant for laying the foundation for the construction of the Cartesian plane, where the domain and the codomain of the function are presented separately from one another.
Activity 3
AIMS: To strengthen the meaning of function as covariation in the DGpp and to construct the meanings of image and preimage.
TASK: Explore the construction, identify and describe possible movements by using the dragging tool and write down your own observations on a sheet of paper. Then answer the following questions [A and B are the labels for the ticks representing the independent variable and the dependent variable, respectively]:
(1) 
Is it possible to have B=3? If yes, how?
(2) 
Is it possible to have B= -3? If yes, how?
(3) 
How can you move B from 0 to 1?
(4) 
By dragging A from 1 to 4 what are all the possible values that B can assume?
Explain your answers.
DESCRIPTION: Students work alone or in pairs on pre-designed interactive files, with the DGpp of functions that are not defined for all real numbers (e.g., f ( x ) = x + 3     2   ). The use of numbered axes makes it possible to give a more precise description of the range in which the dependent and the independent variable can move. Moreover, by activating, for example, the trace on the dependent variable, the set of images is displayed when the independent variable is dragged (Figure 4).
Activity 4
AIMS: To promote the interpretation of a graph through the construction of a real context of which the graph is the representation.
TASK: Three different telephone charges are described, varying by minutes of telephone transactions or a flat rate. Depending on the type of phone traffic, it is asked to identify which charge is the most convenient.
DESCRIPTION: Students work in small groups on a pre-designed interactive file, with the DGpp of three functions (Figure 5). The comparison of the three functions requires handling the independent and dependent variables and identifying domain intervals in which one of the three functions has the smallest values.

3.2. Activities for the Construction of the Cartesian Graph

The construction of the Cartesian graph of a function involves the construction of a DynaGraph with perpendicular axes and of the trajectory of ( x , f ( x ) ) . In particular, starting from the DGpp and in order to introduce the second dimension to construct a DGc, it is necessary to rotate the line containing the dependent variable. In this way, we obtain the Cartesian axes on which the two ticks are bound to move. The functional dependence between the two variables is still represented by the relation between direct and indirect motion but they have two different directions: the tick on the abscissa axis is directly draggable, while the tick on the ordinate axis is indirectly draggable.
Activity 5
AIMS: To work on the covariation of the two variables in two dimensions.
TASK: Explore the construction, identify and describe possible movements by using the dragging tool and write down your own observations on a sheet of paper.
DESCRIPTION: Students can observe and act on pre-designed interactive files, with the DGc of different functions. They verbalize their experience by using new words that are possibly connected to their previous activities with the other representations.
Activity 6
AIMS: To relate the movements of the two ticks, along the Cartesian axes, to the movement of the point ( x , f ( x ) ) and to its trajectory.
TASK: Students are asked to explore the DGc of a function, by dragging the ticks bound to the Cartesian axes, and they are asked to “Imagine and draw on a sheet of paper the trajectory of the point ( x , f ( x ) ) .”
DESCRIPTION: This is a key step of the didactical sequence that brings to the construction of the graph of the function in the Cartesian plane. Before showing an SGc, we promote students’ exploration of the DGc and we ask them to imagine, and then to draw on a sheet of paper, the trajectory of the point ( x , f ( x ) ) . We observe that this point is not visualized on the computer screen, so this kind of task requires paying attention to the variations of both variables at the same time and then sketching a curve that synthesizes this covariation. Imagining and plotting the trajectory of the point ( x , f ( x ) ) from the observation of the movements of the two ticks (representing x and f ( x ) ) in the DGc fosters familiarity with the behavior of the function resulting from the covariation of the variables.
In this activity, students are asked to draw the curve on a sheet of paper and then to verify it by using the tools offered by the DIE. In particular, as shown in Figure 1b, it is possible to build the point ( x , f ( x ) ) as the intersection point of the perpendicular line to the x-axis passing through ( x , 0 ) and the perpendicular line to the y-axis passing through ( 0 , f ( x ) ) . Then, by dragging x, it is possible to see on the screen how ( x , f ( x ) ) moves in relation to the movements of x. Finally, by activating the trace mark on this point and dragging the independent variable, it is possible to obtain the image of the trajectory followed by ( x , f ( x ) ) (see Figure 1c). The curve that forms on the screen is the graph of the function in the Cartesian plane.

3.3. Activities for the Transitions between Different Representations

The following activities are designed to let students work with different graphs of the same function and, in particular, to support the transitions between dynamic and static representations of functions.
Activity 7
AIMS: To promote processes for constructing the Cartesian graph of a function from the observation of the movements of the two variables in a dynamic representation.
TASK: Students are asked to explore the DGpp of a function, by dragging, and they have to “Draw on a sheet of paper the trajectory of the point ( x , f ( x ) ) in a Cartesian plane.
DESCRIPTION: Students can observe and act on pre-designed interactive files, with the DGpp of different functions. By observing how f ( x ) varies depending on x-movements, they have to draw the Cartesian graph of the function on a sheet of paper. A game that can be played by students in pairs consists of giving only one student access to the DGpp of a function and asking him/her to describe the movements (in words) to the other student that has to draw the Cartesian graph on the paper.
Activity 8
AIMS: To promote covariational reasoning in a static function representation, to support the construction and the interpretation of the behavior of a function and of the movements of the variables from the observation of a Cartesian graph.
TASK: Students are asked to match static representations to dynamic representations.
DESCRIPTION: Students work in pairs. One of the students sees the Cartesian graphs of some functions, drawn on a sheet of paper, the other student works with some dynamic representations (DGpp or DGc) of the same functions. Neither student has access to the representations seen by the other. Their goal is to match the two sets of representations. The student who sees the static graphs has to describe the movements of the two variables and the other student has to identify the corresponding DynaGraph (and vice versa).

4. Discussion and Conclusions

The tasks presented in this paper are prototypes of activities of which several variants can be designed. The design of these tasks is carried out based on design principles and their implementation in a classroom is essentially based on methodological principles. The design principles have been formulated on the basis of well-established theories in mathematics education that offer insights into how to promote cognitive learning processes.
The epistemological analysis of knowledge, especially concerning real-valued functions of a real variable, led us to focus on functional dependence and on covariation [12,28,29] as the main mathematical meanings which ground the didactical sequence. From a Vygotskian perspective and, in particular, in light of the Theory of Semiotic Mediation [24], we have identified an artifact having the semiotic potential for embedding mathematical meanings of covariation and, at the same time, allowing the design of tasks aimed at promoting fundamental processes for managing and interpreting graphs of functions.
Generally speaking, the Theory of Semiotic Mediation provides activities to promote different types of signs [24]:
  • Activities with artifacts, in which students produce specific signs that are linked to the use of specific artifacts and, then, they are called artifact signs.
  • Individual production of signs. Asking students to discuss, to write down their observations, to describe the activity, is meant to promote students’ production of signs.
  • Collective production of signs. Through the Mathematical Discussion [25], signs are shared, and through the orchestration of the teacher, the signs evolve into mathematical signs. During this phase, definitions can emerge (under the teacher’s guide) as verbal representations of specific properties that students may have already observed and that are associated with specific signs.
The activities that we have presented in this paper are designed to promote the production of specific signs with the use of artifacts, the reflection on these signs, and the collective evolution of these signs towards mathematical signs. In the following, we briefly outline an a priori analysis of the production of artifact signs, referring in part also to the results of similar didactical activities, that have been experimented with and analyzed through different theoretical frameworks, for example, [16,17,18].
The first activities with the artifact have the goal of making students realize that both ticks move (apart from the case of constant functions), but only one of them can be directly dragged. This asymmetry characterizing the situation, and the request to write down their observations or, more generally, to communicate with someone who was not looking at the computer screen, can prompt the students to look for a suitable language to distinguish the two ticks when they are asked to describe the movements. We observe that the linguistic distinction of the two ticks is the first fundamental step in the formation of the meaning of dependent and independent variables and of functional relationship. We expect that the language used by students initially will appear to be linked to the everyday language, with descriptions recalling spatial and temporal references of the position and speed of the two ticks, with recurrent terms (artifact signs) such as “move”, “right/left/up/down”, “when”, “before/after”.
The dependence relation can be effectively expressed by students thanks to the difference between direct and indirect motion. In [18], the author, in describing the language used by the students in activities with DynaGraphs, reports several expressions similar to the following: “They move both [the ticks], we move just one of them”; “One [tick] does not move with the mouse, but moves when I move the other”. The expressions “point that I can move” and “point that I can move by dragging another point” are artifact signs that should evolve towards the mathematical signs “independent variable” and “dependent variable”. These artifact signs are part of a whole web of signs referring to movement, that allow the construction of the meanings that can evolve into mathematical meanings related to different properties of functions.
Some example of more articulated expressions used by students to describe dynamic graphs are reported in [16]:
  • “They [the ticks] move both because, that is, with respect to the two fixed points that are zero and one, by moving maybe B to the right, A moves to the left and then it goes below zero and by moving B to the left A goes to the right”
  • “The two ticks move simultaneously along the line in such a way that, moving in the opposite direction, they are symmetrical with respect to their meeting point”
In these cases, the artifact signs refer to the relationship between the movements of the two ticks expressed in terms of the relationship between the directions of movement. This artifact sign is related to the mathematical sign “decreasing function” and it has a dual role, from cognitive and didactical points of view: in the genesis of the meaning of “decreasing function”, and in the construction of the cognitive processes underlying the interpretation of the graphs of functions, i.e., in the “dynamic reading” of a Cartesian graph.
All these considerations could be extended to other artifact signs emerging along with the implementation of the activities. For example, linguistic expressions describing the speed of the ticks (evolving in the mathematical sign of “derivative”), the change of direction of the tick representing the dependent variable (evolving in the mathematical sign of “local maximum/minimum”), and so on (see [37]).
In summary, the activities with the different representations (DGp, DGpp, DGc, SGc) and the activities involving a transition between two or more representations are aimed at making students produce artifact signs that present both similarities and differences and that constitute a semiotic chain evolving towards mathematical signs. As written in [24] (p. 778): “The construction of semiotic chains constitutes one of the goals of teacher’s interventions. […] reaching a mathematical definition does not only mean the production of a mathematically correct statement, but also the construction of a web of semiotic relationships supporting the construction of the corresponding mathematical concept. The construction of this web allows one to freely use artifact signs far beyond the definition of mathematical signs, without losing the generality requested by a mathematical discourse, or to come back to such signs whenever their evocative power could be useful” [24] (p. 778).
Finally, in this paper, we focused on the didactical sequence of tasks designed to promote this web of semiotic relationships on mathematical meanings underlying functions and their representation, considering these meanings to be essential from both cognitive and didactical points of view. Obviously, the didactical sequence will not be concluded until the fundamental intervention of the teacher is aimed at organizing the mathematical knowledge in a theory.

Author Contributions

Conceptualization, S.A. and G.L.; methodology, G.L.; formal analysis, S.A. and G.L.; investigation and resources, S.A. and G.L.; data curation, G.L.; writing—original draft preparation, S.A. and G.L.; writing—review and editing, S.A. and G.L.; supervision, S.A. All authors have read and agreed to the published version of the manuscript.

Funding

This research received no external funding.

Conflicts of Interest

The authors declare no conflict of interest.

References

  1. MIUR. Indicazioni Nazionali Riguardanti Gli Obiettivi Specifici di Apprendimento Concernenti le Attività e gli Insegnamenti Compresi nei Piani Degli Studi Previsti per i Percorsi Liceali. Available online: https://www.indire.it/lucabas/lkmw_file/licei2010/indicazioni_nuovo_impaginato/_decreto_indicazioni_nazionali.pdf (accessed on 29 January 2021).
  2. UMI; MIUR; SIS; MATHESIS. Matematica 2003. Available online: http://www.matematica.it/tomasi/lab-did/pdf/matem-2003-curricolo.pdf (accessed on 29 January 2021).
  3. Tall, D.; Vinner, S. Concept image and concept definition in mathematics with particular reference to limits and continuity. Educ. Stud. Math. 1981, 12, 151–169. [Google Scholar] [CrossRef]
  4. Vinner, S.; Dreyfus, T. Images and definitions for the concept of function. J. Res. Math. Educ. 1989, 20, 356–366. [Google Scholar] [CrossRef]
  5. Dubinsky, E. Reflective abstraction in advanced mathematical thinking. In Advanced Mathematical Thinking; Tall, D., Ed.; Kluwer: Boston, LA, USA, 1991; pp. 95–126. [Google Scholar]
  6. Sfard, A. Operational origins of mathematical objects and the quandary of reification—The case of function. In The Concept of Function: Aspects of Epistemology and Pedagogy; Harel, G., Dubinsky, E., Eds.; Mathematical Association of America: Washington, DC, USA, 1992; pp. 59–84. [Google Scholar]
  7. Tall, D. The transition to advanced mathematical thinking: Functions, limits, infinity and proof. In Handbook of Research on Mathematics Teaching and Learning; Grouws, D.A., Ed.; Macmillan: New York, NY, USA, 1992; pp. 495–511. [Google Scholar]
  8. Monk, S.; Nemirovsky, R. The case of Dan: Student construction of a functional situation through visual attributes. In Research in Collegiate Mathematics Education. I. CBMS Issues in Mathematics Education; Dubinsky, E., Schoenfeld, A.H., Kaput, J., Eds.; American Mathematical Society: Providence, RI, USA, 1994; pp. 139–168. [Google Scholar]
  9. Goldenberg, E.P. Ruminations about dynamic imagery (and a Strong Plea for Research). In Exploiting Mental Imagery with Computers in Mathematics Education; Sutherland, R., Mason, J., Eds.; Springer: Berlin, Germany, 1995; pp. 202–224. [Google Scholar]
  10. Carlson, M.P. A cross sectional investigation of the development of the function concept. In Research in Collegiate Mathematics Education. III. CBMS Issues in Mathematics Education; Schoenfeld, A.H., Kaput, J., Dubinsky, E., Eds.; American Mathematical Society: Providence, RI, USA, 1998; pp. 114–162. [Google Scholar]
  11. Thompson, P.W. Images of rate and operational understanding of the fundamental theorem of calculus. Educ. Stud. Math. 1994, 26, 229–274. [Google Scholar] [CrossRef]
  12. Saldanha, L.A.; Thompson, P.W. Re-thinking covariation from a quantitative perspective: Simultaneous continuous variation. In Proceedings of the 20th Annual Meeting of the Psychology of Mathematics Education–North America, Raleigh, NC, USA, 31 October–3 November 1998; Berenson, S.B., Coulombe, W.N., Eds.; North Carolina State University: Raleigh, NC, USA, 1998; pp. 298–304. [Google Scholar]
  13. Falcade, R.; Laborde, C.; Mariotti, M.A. Approaching functions: Cabri tools as instruments of semiotic mediation. Educ. Stud. Math. 2007, 66, 317–333. [Google Scholar] [CrossRef]
  14. Sinclair, N.; Healy, L.; Reis Sales, C. Time for telling stories: Narrative thinking with Dynamic Geometry. ZDM 2009, 41, 441–452. [Google Scholar] [CrossRef]
  15. Johnson, H.L.; McClintock, E. A link between students’ discernment of variation in unidirectional change and their use of quantitative variational reasoning. Educ. Stud. Math. 2018, 97, 299–316. [Google Scholar] [CrossRef] [Green Version]
  16. Colacicco, G.; Lisarelli, G.; Antonini, S. Funzioni e grafici in ambienti digitali dinamici. DdM 2017, 2, 7–25. [Google Scholar] [CrossRef]
  17. Lisarelli, G. How dragging mediates a discourse about functions. In Proceedings of the 42nd Conference of the International Group for the Psychology of Mathematics Education, Umea, Sweden, 3–8 July 2018; Bergqvist, E., Osterholm, M., Granberg, C., Sumpter, L., Eds.; PME: Umea, Sweden, 2018; pp. 323–330. [Google Scholar]
  18. Lisarelli, G. A Dynamic Approach to Functions and Their Graphs: A Study of Students’ Discourse from a Commognitive Perspective. Ph.D. Thesis, University of Florence, Florence, Italy, 2019. [Google Scholar]
  19. Gravemeijer, K. Developmental research as a research method. In Mathematics Education as a Research Domain: A Search for Identity (An ICMI Study); Kilpatrick, J., Sierpinska, A., Eds.; Kluwer: Dordrecht, The Netherlands, 1998; pp. 277–295. [Google Scholar]
  20. DiSessa, A.A.; Cobb, P. Ontological innovation and the role of theory in design experiments. J. Learn. Sci. 2004, 13, 77–103. [Google Scholar] [CrossRef]
  21. Prediger, S.; Gravemeijer, K.; Confrey, J. Design research with a focus on learning processes: An overview on achievements and challenges. ZDM 2015, 47, 877–891. [Google Scholar] [CrossRef]
  22. Gravemeijer, K.; Cobb, P. Design research from the learning design perspective. In Educational Design Research Part A: An Introduction; Plomp, T., Nieveen, N., Eds.; SLO: Enschede, The Netherlands, 2013; pp. 72–113. [Google Scholar]
  23. Vygotsky, L.S. Mind in Society. The Development of Higher Psychological Processes; Cole, M., John-Steiner, V., Scribner, S., Souberman, E., Eds.; Harvard University Press: Cambridge, MA, USA, 1978. [Google Scholar]
  24. Bartolini Bussi, M.B.; Mariotti, M.A. Semiotic mediation in the mathematics classroom: Artifacts and signs after a Vygotskian perspective. In Handbook of International Research in Mathematics Education, 2nd ed.; English, L., Kirshner, D., Eds.; Routledge: New York, NY, USA, 2008; pp. 746–783. [Google Scholar]
  25. Bartolini Bussi, M.G. Mathematical discussion and perspective drawing in primary school. Educ. Stud. Math. 1996, 31, 11–41. [Google Scholar] [CrossRef]
  26. Confrey, J. Splitting, similarity, and rate of change: A new approach to multiplication and exponential functions. In The Development of Multiplicative Reasoning in the Learning of Mathematics; State University of New York Press: Albany, NY, USA, 1994; pp. 293–330. [Google Scholar]
  27. Carlson, M.; Jacobs, S.; Coe, E.; Larsen, S.; Hsu, E. Applying covariational reasoning while modeling dynamic events: A framework and a study. J. Res. Math. Educ. 2002, 33, 352–378. [Google Scholar] [CrossRef] [Green Version]
  28. Kaput, J.J. Patterns in students’ formalization of quantitative patterns. In The Concept of Function: Aspects of Epistemology and Pedagogy; Harel, G., Dubinsky, E., Eds.; MAA: Washington, DC, USA, 1992; pp. 290–318. [Google Scholar]
  29. Cottrill, J.; Dubinsky, E.; Nichols, D.; Schwingendorf, K.; Thomas, K.; Vidakovic, D. Understanding the limit concept: Beginning with a coordinated process schema. J. Math. Behav. 1996, 15, 167–192. [Google Scholar] [CrossRef]
  30. Mariotti, M.A. Proof and proving in mathematics education. In Handbook of Research in the Psychology of Mathematics Education; Gutierrez, A., Boero, P., Eds.; Sense: Rotterdam, The Netherlands, 2006; pp. 173–214. [Google Scholar]
  31. Mariotti, M.A.; Baccaglini-Frank, A. Making conjectures in dynamic geometry: The potential of a particular way of dragging. N. Engl. Math. J. 2011, XLIII, 22–33. [Google Scholar]
  32. Baccaglini-Frank, A.; Antonini, S. From conjecture generation by maintaining dragging to proof. In Proceedings of the 40th Conference of the International Group for the Psychology of Mathematics Education, Szeged, Hungary, 3–7 August 2016; Csíkos, C., Rausch, A., Szitányi, J., Eds.; PME: Szeged, Hungary, 2016; pp. 43–50. [Google Scholar]
  33. Hazzan, O.; Goldenberg, E.P. Student’s understanding of the notion of function. Int. J. Comput. Math. Learn. 1997, 1, 263–290. [Google Scholar] [CrossRef]
  34. Goldenberg, E.P.; Lewis, P.; O’Keefe, J. Dynamic representation and the development of an understanding of functions. In The Concept of Function: Aspects of Epistemology and Pedagogy; Harel, G., Dubinsky, E., Eds.; Mathematical Association of America: Washington, DC, USA, 1992. [Google Scholar]
  35. Laborde, C.; Kynigos, C.; Hollebrands, K.; Strässer, R. Teaching and learning geometry with technology. In Handbook of Research in the Psychology of Mathematics Education; Gutierrez, A., Boero, P., Eds.; Sense: Rotterdam, The Netherlands, 2006; pp. 275–304. [Google Scholar]
  36. Baccaglini-Frank, A.; Mariotti, M.A.; Antonini, S. Different perceptions of invariants and generality of proof in dynamic geometry. In Proceedings of the 33rd Conference of the International Group for the Psychology of Mathematics Education, Thessaloniki, Greece, 19–24 July 2009; Tzekaki, M., Sakonidis, H., Eds.; PME: Thessaloniki, Greece, 2009; pp. 89–96. [Google Scholar]
  37. Antonini, S.; Baccaglini-Frank, A.; Lisarelli, G. From Experiences in a Dynamic Environment to Written Narratives on Functions. Digit. Exp. Math. Educ. 2020, 6, 1–29. [Google Scholar] [CrossRef]
  38. Caponi, M.; Lisarelli, G. Realization trees: A commognitive lens. In Proceedings of the 42nd Conference of the International Group for the Psychology of Mathematics Education, Umea, Sweden, 3–8 July 2018; Bergqvist, E., Osterholm, M., Granberg, C., Sumpter, L., Eds.; PME: Umea, Sweden, 2018; p. 212. [Google Scholar]
  39. Lisarelli, G.; Antonini, S.; Baccaglini-Frank, A. Capturing ‘time’: Characteristics of students’ written discourse on dynagraphs. In Proceedings of the Eleventh Congress of the European Society for Research in Mathematics Education, Utrecht, The Netherlands, 6–10 February 2019; Jankvist, U.T., van den Heuvel-Panhuizen, M., Veldhuis, M., Eds.; Freudenthal Group and Freudenthal Institute, Utrecht University and ERME: Utrecht, The Netherlands, 2019; pp. 4549–4556. [Google Scholar]
Figure 1. The process of construction of an SGc from a DGc in the DIE. (a) Two ticks representing x and f ( x ) are respectively on the x-axis and on the y-axis. The tick that represents x can be (directly) dragged and the movement of x causes the (indirect) movement of f ( x ) , according to the functional dependency. (b) The point ( x , f ( x ) ) is built as the intersection point of the perpendicular line to the x-axis passing through ( x , 0 ) and the perpendicular line to the y-axis passing through ( 0 , f ( x ) ) . (c) The activation of the trace mark on ( x , f ( x ) ) and the dragging of x allow to visualize the trajectory of ( x , f ( x ) ) and then the graph of the function.
Mathematics 09 00572 g001
Figure 2. Two screenshots of the DGp of the function f ( x ) = | x | . The mouse cursor identifies the tick representing the independent variable, which is the only draggable one. (a) A screenshot of the DGp for a negative x-value; (b) A screenshot of the DGp for a positive x-value.
Mathematics 09 00572 g002
Figure 3. Two screenshots of the DGpp of the function f ( x ) = | x | . The mouse cursor identifies the tick representing the independent variable, which is the only draggable one. (a) A screenshot of the DGpp for a negative x-value; (b) A screenshot of the DGp for a positive x-value.
Mathematics 09 00572 g003
Figure 4. By activating the trace mark on B, while dragging A from 1 to 4, it is possible to visualize f ( [ 1 , 4 ] ) on the screen.
Mathematics 09 00572 g004
Figure 5. A screenshot of the DGpp of three functions of the same variable. T1, T2, and T3 represent three different telephone charges all varying depending on time A. The tick representing time is the only draggable one.
Mathematics 09 00572 g005
Table 1. The graphs used in the activities. SGc is the well-known Cartesian graph. DGp, DGpp, and DGc are dynamic graphs where x and f ( x ) are represented by ticks. The tick representing x is draggable (as indicated by the mouse cursor in the screenshots) and its movement causes the movement of the tick representing f ( x ) , according to the functional dependency.
AcronymDescriptionScreenshot
DGpDynamic graph with one (horizontal) line. The two ticks representing x and f ( x ) are on the same line. Mathematics 09 00572 i001
DGppDynamic graph with two parallel (horizontal) lines. The two ticks representing x and f ( x ) are on two parallel and different lines. Mathematics 09 00572 i002
DGcDynamic graph in the Cartesian plane. The two ticks representing x and f ( x ) are on two perpendicular lines (the Cartesian axes). Mathematics 09 00572 i003
SGcStatic Cartesian graph Mathematics 09 00572 i004
Publisher’s Note: MDPI stays neutral with regard to jurisdictional claims in published maps and institutional affiliations.

