Article

Cryptocurrency as Epidemiologically Safe Means of Transactions: Diminishing Risk of SARS-CoV-2 Spread

by
Dmitry V. Boguslavsky
,
Natalia P. Sharova
* and
Konstantin S. Sharov
Koltzov Institute of Developmental Biology of Russian Academy of Sciences, 26 Vavilov Street, 119334 Moscow, Russia
*
Author to whom correspondence should be addressed.
Mathematics 2021, 9(24), 3263; https://doi.org/10.3390/math9243263
Submission received: 18 November 2021 / Revised: 12 December 2021 / Accepted: 14 December 2021 / Published: 15 December 2021
(This article belongs to the Special Issue Mathematics, Cryptocurrencies and Blockchain Technology)

Abstract

:
In comparison with other respiratory viruses, the current COVID-19 pandemic’s rapid seizing the world can be attributed to indirect (contact) way of transmission of SARS-CoV-2 virus in addition to the regular airborne way. A significant part of indirect transmission is made through cash bank notes. SARS-CoV-2 remains on cash paper money for period around four times larger than influenza A virus and is absorbed by cash notes two and a half times more effectively than influenza A (our model). During the pandemic, cryptocurrencies have gained attractiveness as an “epidemiologically safe” means of transactions. On the basis of the authors’ gallop polls performed online with social networks users in 44 countries in 2020–2021 (the total number of clear responses after the set repair 32,115), around 14.7% of surveyed participants engaged in cryptocurrency-based transactions during the pandemic. This may be one of the reasons of significant rise of cryptocurrencies rates since mid-March 2020 till the end of 2021. The paper discusses the reasons for cryptocurrency attractiveness during the COVID-19 pandemic. Among them, there are fear of SARS-CoV-2 spread via cash contacts and the ability of the general population to mine cryptocurrencies. The article also provides a breakdown of the polled audience profile to determine the nationalities that have maximal level of trust to saving and transacting money as cryptocurrencies.

1. Introduction

In spring 2020, on the verge of the “coronacrisis”, the event that combined healthcare, economic, financial, administrative, political, employment, and social crises, many markets experienced a dramatic fall. The situation was exacerbated by massive layoffs. Most importantly, central banks in the period of COVID-19 pandemic mainly eased their monetary policy to help different sectors of their economies to overcome the crisis, e.g., the USD interest rate was diminished from 2.25% in January 2020 to 0.25% in April 2020 and it has remained at this level thus far [1]. This was an unprecedented Federal Open Market Committee’s decision, as in the post-war period of US history the USD interest rate was never this low. Even after the “great financial crisis” of the 21st century broke out in 2008, the interest rate was 0.50. As a result, fixed-income investments became not as popular as they were before the pandemic. Treasury notes, bonds, and interest rate swaps plunged after the FOMC decision. Federal funds rate dropped to 0.00–0.25% and Eurodollar futures, consequently, jumped [2]. Simultaneously, the financial crisis distracted many investors from the traditional assets such as stocks. At this uneasy time, electronic money, including cryptocurrencies, came to the foreground. Luo et al. [3] and Shovkhalov with Idrisov [4] showed that price-based monetary policy has strong anti-interference, as an increase in e-money supply leads to weakening of the effect of monetary policy.
The correlation of almost all stock, futures and spot markets worldwide was unprecedented at the beginning of the pandemic [5,6,7,8]. Almost all world financial assets behaved in a very similar, nearly identical manner in February–March 2020 [9]. Previously such a behavior was observed only in 2008 [10,11]. After the global fall in February–March 2020, world markets began to revive by degrees. Most of the stock markets, both in economically developed countries and emerging economies, are higher at the end of 2021 than they were at the beginning of 2020 [12].
Figure 1 shows the behavior of different financial assets since February 2019 till September 2020 (the end of the first wave of the COVID-19 pandemic). We can observe a mixed behavior of traditional assets and a sharp rise in cryptocurrencies price (Bitcoin and Ether).
In February–March 2020, i.e., the very beginning of the pandemic, there was a clear fall of price of most popular financial assets such as world stock indexes or energy resources. An especially uncommon, almost absurd situation, was observed with crude oil, whose prices fell below zero (in this scenario a crude oil producer must pay money for storage instead of receiving it for crude oil sale). Bitcoin and Ether prices also underwent this temporary slippage, but to a much lesser degree. By the end of the first wave of the pandemic cryptocurrencies outperformed every other asset in the world significantly.
The COVID-19 pandemic did not undermine the growing tendency of cryptocurrencies. On the contrary, the whole period of the pandemic caused a substantial rise in Bitcoin prices thus far (15 November 2021), bringing it to its historical maximums (+810%). We take Bitcoin as a reference for all cryptocurrencies, but for some other cryprocurrencies the rise of their price was even more expressed since January 2020 up to now (15 November 2021) (e.g., +3738% for Ether).
This behavior is quite uncommon for the pandemic time. No other financial asset experienced such a rise in price in the COVID-19 times [13,14]. Instead, economic stagnation, diminishing investment activities, and widening the bond–swap spread are common phenomena now [15,16,17,18,19,20]. However, cryptocurrencies outperformed any “traditional” market. This growth was not broken even by the events which were deemed to impact cryptocurrencies negatively, e.g., the prohibition of mining farms in PRC on the grounds of environmental impact or the notorious Elon Musk’s refusal to sustain cryptocurrencies. It may be partly explained by the “safe haven” effect [21,22,23]. The Chinese government’s prohibition of mining as well as restrictions in some other parts of the world were caused by the huge environmental impact of mining farms. In Asia, Latin America, and Africa, the impact of cryptocurrency mining is especially large [24,25,26]. However, environmental-based restrictions did not break the growing trend of cryptocurrencies during the pandemic.
To be sure, during the last five to six years there was a growing trend in prices and trading volumes of cryptocurrencies. From 2015 thus far, the Bitcoin price rose from 200 USD to 60,000 USD and the volume from dozens and hundreds of Bitcoins a day to some 50,000 Bitcoins a day, i.e., around 3 billion USD a day (in total on different cryptocurrency exchanges) [27,28,29]. This growing trend was accounted for by the involvement of both the general population and several large investors (large net-worth individuals and a few banks) that supported cryptocurrencies from the very beginning. Some of the large players were attracted by the unclear legislation associated with use of cryptocurrency payments, savings, trading, and other transactions, e.g., the absence of tax deductions applicable to cryptocurrency-based operations [30,31,32]. The other investors were distracted from cryptocurrencies for the very same reason of lack of legal regulation. To sum up, up until the pandemic, cryptocurrencies experienced many periods of ebbs and flows. However, only now can we observe such a rocketing. In the paper, we suppose that this growth can be partially caused by the pandemic along with the other reasons, as the pandemic may have raised the attractiveness of cryptocurrency on the whole.
A few authors suggested that cryptocurrencies became to be regarded as safe havens in the global COVID-related instability [33,34,35,36,37,38]. Kim and Lee [39] and Lahmiri and Bekiros [40] argue that the COVID-19 pandemic influenced cryptocurrencies prices negatively, making them extremely volatile and unpredictable. However, in the works of Woebbeking [41], Drożdż et al. [42], Friti et al. [43], and Zhu et al. [44] an opposite viewpoint is proposed: the pandemic was the main reason for stabilizing and supporting the growing trend of cryprocurrencies.
In the paper, we suggest a reason for an exceptional growth of cryptocurrencies during the COVID-19 pandemic. We believe that it was cryptocurrency that began to be regarded as an epidemiologically safe means of transactions and a possible substitution for cash money.
Of course, cash money was always regarded as a probable means of transmitting different respiratory pathogens, even before the current pandemic. However, it is interesting to compare the transmissibility of SARS-CoV-2 virus through cash notes with respiratory viruses close in structure and properties such as influenza A virus. Besides, since this pandemic caused enormous media coverage, people began to pay larger attention to epidemiological safety in their payments than they did before. This may be supported by the fact that there are many media news regarding coronavirus and cash money unsafety, and we could find few such news during any previous epidemics of the last two decades, e.g., SARS 2002–2004, “bird flu” H5N1, H1N1 epidemics, etc.
We suggest a hypothesis that the significant rise of cryptocurrencies in 2020–2021 may be mainly explained by the large inflow of small investors (general population) to cryptocurrency trading that were searching for an epidemiologically safe means of transactions during the time of pandemic.
The article has the following structure. We shall analyze the validity of such allegations about cash money as a means of spreading the virus. Then we shall investigate the connection between disbelief towards cash money and approving/supporting cryptocurrencies instead of credit/debit card operations. We shall study the situation in different countries and finally evaluate the possible future scenarios of cryptocurrency behavior in the time of pandemic.

2. Methods

2.1. Cohorts

We investigated social networks users’ opinion regarding cryptocurrencies, cash money, and the COVID-19 spread in 44 countries. The initial number of responses was 86,841. After the set repair, the final number of responses suitable for analysis was 32,115.

2.2. Time of Study

The main results have been obtained in the interval 15 March 2020 to 15 November 2021.

2.3. Software

Origin 8.1 (OriginLab Corp., Northampton, MA, USA) was used for modelling, statistical calculations and visualization.

2.4. Type of Study

The study is a biosocial analysis of different strata’s attitudes performed along with computational modelling.

2.5. Description of the Interviewing Procedure

The interviewing was performed as follows.
  • A C++-based program was written to screen through the following networks: Facebook, Instagram, VK, Google+, and Twitter, for accounts that contained at least 20 posts with the following keywords: cryptocurrency (with and without a space), cryptocurrencies (with and without a space), crypto, cryptotrading (with and without a space), cryptomining (with and without a space), cryptocurrency exchange (with and without a space), cryptocurrencies exchange (with and without a space), cryptocurrency wallet (with and without a space), cryptocurrencies wallet (with and without a space), mining, mining farm, Bitcoin, Ether, Ethereum, blockchain (with and without a space), blockchain technology (with and without a space in the first word), BTC, ETH, Bitfinex, Bitstamp, Bitbay, Btcmarkets, Cex.io, Coinbase, Exmo, Gemini, Kraken, for the period since 15 March 2020. Versions in different languages of the keywords were used (excepting the names of the cryptocurrency exchanges listed here);
  • If the screening procedure returned an account, the other C++- and Silverlight-based program submitted a private message to the account with an invitation to join the current research;
  • If the account’s holder responded, the response was stored in the special database on our server to be analyzed further;
  • The languages used in the screening and invitation were Arabic, Central Thai, Chinese (simplified), Chinese (traditional), English, Farsi, French, German, Greek, Italian, Japanese, Korean, Malay, Portuguese, Russian, Spanish, Turkish, and Vietnamese. These sets of languages were deemed a priori suitable to encompass the majority of social networks users;
  • In the poll, the social networks users had to respond to the three questions with answers YES (1), NO (2) or -/–/— (different forms of dash that stood for IT’S DIFFICULT TO SAY) (3):
    (1)
    Do you engage in any transactions with cryptocurrency (mining, speculation, savings, payment, etc.)? (Q1)
    (2)
    If cryptocurrencies were widely recognized as means of transactions, regulated and guaranteed against fraud/hacking/loss, would you prefer them to ordinary cashless bank transactions, e.g., payments with bank-issued debit/credit cards? (Q2)
    (3)
    Do you regard cash money as an epidemiologically risky means of transactions during the COVID-19 pandemic? (Q3)
The fourth input factor was the level of ordinary (bank) cashless operations in a country in 2015–2019. The data for this factor were collected from the following sources: (1) the number of non-cash transactions per inhabitant, 2014–2019 [45]; (2) overview of preferred methods of payment around the world [46], and proportion of non-cash payments in selected countries worldwide in 2015 [47]. The data published by other researchers/statistical agencies were only used in point 4.
The respondents were asked to answer with only pre-defined replies {YES, NO, … (versions in other languages), -, –, —, or 1, 2, 3}.

2.6. Country Choice

The countries with the number of responses suitable for further analysis larger than the pre-defined conditional threshold (i.e., responses left in the set after repair) were included in the study. In our case, this minimal number was arbitrarily chosen as 500. We received 44 countries that fitted our criterion. Introducing the threshold is a measure of increasing the significance of the sample set for the research.

2.7. Data Cleaning and Set Repairing

We eliminated spoilt and strange responses as well as responses with low credibility in an algorithmic way.
  • First, a program screened through the database and carried out the simplest linguistic analysis. It removed all responses in which at least one field was blank or at least one field did not contain at least one intelligible word in the language list used.
  • Second, a program screened through the database and eliminated all responses with at least one field different from {YES, NO, … (versions in other languages), -, –, —, 1, 2, 3}. Different letter cases (upper case, lower case, or a combination thereof) and different languages from the list could be used.
As a result, we have chosen 47,823 clean responses that may have been analyzed further of 86,841 responses initially stored in the database. So, the clean set of responses was 55.07% of the initial one. Of this intermediate set we excluded the responses of minors, outliers with an age of more than 64 y.o., and all responses where the respondent’s age could not be determined. This gave us 32,115 responses (67.15% of the intermediate set and 36.98% of the initial unrepaired set).

2.8. Final Set Characteristics

The main characteristics of the final sample set after repair are summarized in Table 1.

2.9. Methodology to Assess Risk of SARS-CoV-2 Surface Contact Transmission through Bank Notes

To estimate the rate of transmitting SARS-CoV-2 by cash bank notes, we may apply a modified SIR (Susceptible–Infected–Recovered) model with the virus shedding assumption [48,49,50]. In this model, in addition to the direct airborne route of infection transmission, an infected person sheds SARS-CoV-2 virions on surfaces that become objects of indirect infection. It has been repeatedly demonstrated that SARS-CoV-2 has longer average times of decay on surfaces in comparison with many other respiratory viruses, e.g., influenza, parainfluenza, adenoviruses, or other coronaviruses [51,52,53,54]. Though there were supposedly no works concerning SARS-CoV-2 virions adhesion on cash bank notes thus far, Xue et al. [55], Azuma et al. [56] and Marquès et al. [57] showed that SARS-CoV-2 virion particles behave differently on different surfaces. Paper, especially paper with a layer of dust, fat, and other contaminants (this may be a good approach to describe cash notes in circulation), can absorb SARS-CoV-2 large virions (around 100–200 nm in diameter) effectively [58,59].
Combining an advanced technique by Fred Brauer in his book “Mathematical Models in Population Biology and Epidemiology” [60] and a number of papers in periodicals [61,62,63,64,65] with our SIR modified model [48], we receive an additional group of the population that sheds the virus through the bank notes Vshed. In his works, some of which are published in co-authorship, Fred Brauer proposed a methodology of calculating/receiving/assessing age of infection [60,61], final size equation [60,61], contact networks [62], indirect transmission [63], epidemic progression with time [64], and behavior change during an epidemic [65]. We then receive the first order Markov differential equation
d V s h e d d t = σ I τ V ,
where I is the number of infected individuals, σ is the rate of shedding the virus on cash notes and τ is the decay rate of SARS-CoV-2 on surface. We use the word “decay” conditionally, as it may include different processes whose result would be the loss of infectivity of the virus: virus mechanical removal from the note, agglomeration of viruses, biochemical destruction, photo destruction by sun UV radiation, etc. [66,67]. Hirose et al. stressed that during any epidemic, cash money circulation is an important factor of transmitting the disease [67].
The total number of people in the group is N:
N = S + I + R ,  
where S is the subgroup of susceptible persons and R recovered. The SIR model assumes that
  d S d t = β a i r S I β s u r f S V ,   d I d t = β a i r S I + β s u r f S V α I ,   d R d t = α I
where βair is the rate of airborne infection, βsurf is the rate of transmission via surfaces, and α is the rate of recovery. For simplicity of the model, let us suppose that all surface transmission of SARS-CoV-2 is done through cash bank notes. For model (3), basic reproduction number r0:
r 0 = β a i r N α + β s u r f σ N α τ .  
Equation (4) is a construction based on the simplest model described in the works [60,61,63]. It was received taking into account the Brauer’s viewpoint on basic reproduction number and final size relation. It contains two terms. The former describes the airborne (common) way of pandemic transmission, the latter the transmission through bank notes. r0,air for SARS-CoV-2 is estimated as 1.6–2.6 for different environments [68,69,70]. In our works [28,33,50] we found that combined r0 may be assessed as 2.0–5.6 for different environments. Therefore, we can attribute the difference to the second term in Equation (4), i.e., r0,surf. However, in real life the basic reproduction number depends on more parameters than Equation (4) assumes.
The approach described above is the simplest approach in which we assumed the immediate infection/decay of the virus on the cash notes. In reality, the situation is more complex. In its circulation in the population, a bank note may be infected by different people with different amounts of SARS-CoV-2 virions several times. Naturally, it can infect several people. This leads to necessity in presenting infection potential of a bank note and virus shedding as functions of time: SR = SR(t, tinf)—shedding rate of a person during the time of being infectious tinf; AV = AV(t, tshed)—“active virus,” i.e., the part of virions absorbed on bank notes that are still infectious for people, tshed earlier. Then, we may calculate the amount of active virions that can still be dangerous to people operating with the bank note at moment t, by substituting a new variable T = t − tinf for integration:
L o c a l   A V = 0 t S R t i n f A V t t i n f d t i n f = 0 t S R t T A V T d T .  
For the full course of COVID-19 pandemic, we have
T o t a l   A V = 0 0 t S R t T A V T d T d t .  
Integrating by variable substitution and the order interchange, we receive
T o t a l   A V = 0 T S R t T d t A V T d T = 0 0 S R T d T A V T d T = 0 S R T d T 0 A V T d T .  
From Equations (4) and (7), it is easy to write the expression for basic reproduction number r0,surf:
r 0 ,   s u r f = β s u r f α τ N 0 S R T d T 0 A V T d T .  
To estimate whether the pandemic will continue in an imagined population that applies all epidemiological measures to prevent the SARS-CoV-2 airborne spread (r0,air = 0), only through cash circulation, let us consider the initial moment t = 0. At the very beginning of SARS-CoV-2 spread in this biosocial group, we would have the following system of equations:
S = N ,   t = 0 , V s h e d = 0 ,   T o t a l A V = 0 .
From Equation (3), for d S d t and Equation (9) it can be seen that at the beginning of the pandemic in a given theoretical society where only cash notes circulation contributes to SARS-CoV-2 spread,
d S d t = β s u r f N 0 0 d S d T t T T A V T d T S R T d T .  
For Equation (10) to have a solution like
S t = S i n i t e k t ,  
its characteristic equation should be
β s u r f N 0 e k T S R T d T 0 e k T A V T d T = 1 .
Finally, it is easy to observe from Equations (8) and (12) that at the beginning of the epidemic
r 0 ,   s u r f = 1 α τ 0 S R T d T 0 A V T d T 0 e k T S R T d T 0 e k T A V T d T .  
From Equation (13), we see that in our imagined society there will be no pandemic spread due to cash circulation, if parameter k < 0. Otherwise, the virus will spread in the population through operations with bank notes.
Substituting the experimentally obtained figures for r0,surf estimates that may be derived from [48,54,71] to Equation (13), we can compare SARS-CoV-2 virions behavior during adhesion on bank notes with the behavior of other respiratory viruses, e.g., influenza viruses [72,73,74,75,76]. The works of Otter et al. [72] and Cortes and Zuñiga [73] compare the transmission of coronaviruses SARS 2002–2004 and MERS with that of influenza viruses. Lauterbach et al. provides data on surface transmission of influenza A virus [74]. The study of Ikeda et al. describes adhesion of influenza A virus on different surfaces and provides parameters of adhesion [75]. Robinson et al. describes surface transmission and inactivation of different respiratory viruses in different ambience [76].

3. Results and Discussion

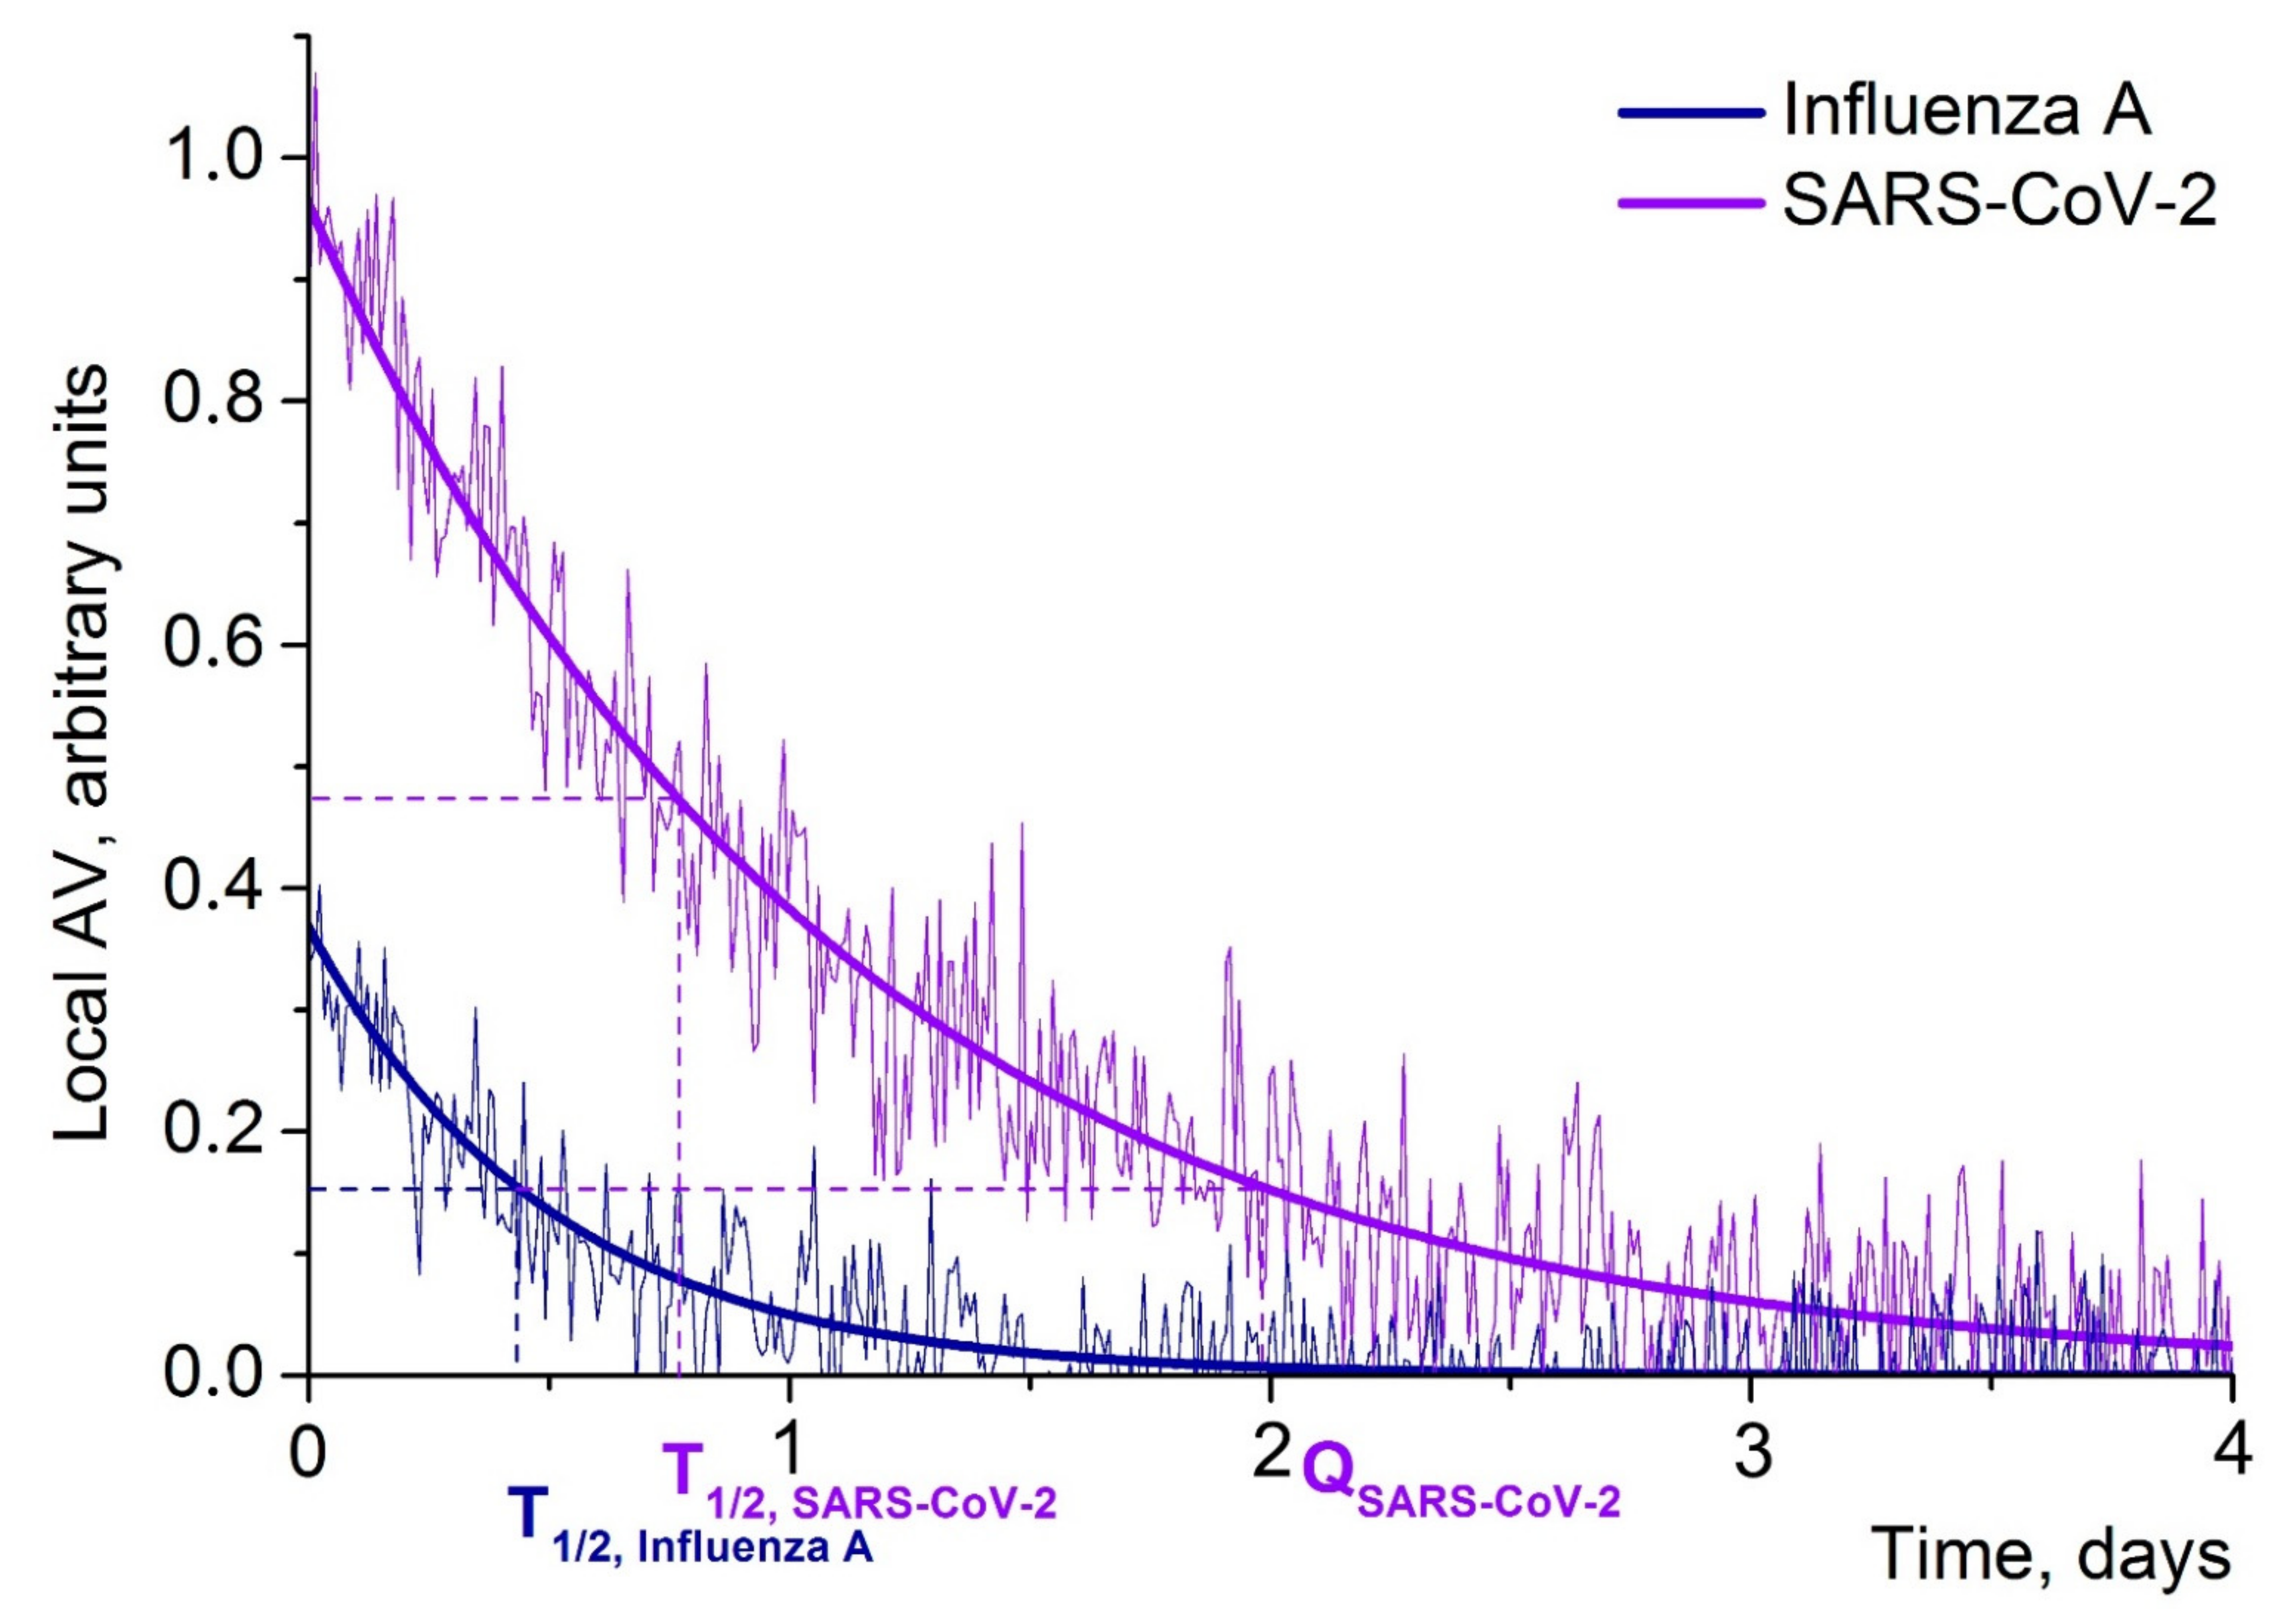
3.1. Comparison of SARS-CoV-2 and Influenza A Transmission Potential through Paper Cash Money

Figure 2 shows comparative decay of Influenza A (calculated with data provided in our works [48,54,71] and works of other researchers [72,73,74,75,76]) and SARS-CoV-2 on dirty paper surfaces that may be a good approximation for cash bank notes in circulation. Calculation is made with respect to basic reproduction numbers r0,air and r0,surf for influenza A and SARS-CoV-2 viruses (Equation (13)) for idealized environments where cash money are the only surfaces with shed viruses. Modelling is made so that Equation (1) has a solution as an exponential-type decay.
From Figure 2 one can observe that the half-life time of SARS-CoV-2 active virions T1/2,SARS-CoV-2 on dirty and fat paper is nearly two times larger than half-life time of influenza A active virions T1/2,Influenza A. Besides, to reach the level of influenza A active virions on dirty paper at the time of half-life, it will take SARS-CoV-2 approximately two days, i.e., the period four times greater than the period for influenza A (point QSARS-CoV-2 on the time scale). This evidences SARS-CoV-2 greater stability on porous surfaces (unclear, whether this implies mechanical stability or biochemical stability). Then, AVSARS-CoV-2(0) is around 2.5 times more than AVInfluenza A(0). It may be explained by greater adhesion capacity of SARS-CoV-2 with respect to dirty, viscous, and hydrophobic paper surfaces, as in the modelling the initial quantities of viruses shed were equal for SARS-CoV-2 and influenza A.
Assuming that all surface transmission of the viruses is made through cash bank notes (a theoretical scenario), we may conclude that cash money has larger epidemiological risk for transmitting SARS-CoV-2 than influenza A (and possibly many other respiratory viruses). In reality the transmission of an epidemic is more complex and it may include different surfaces and airborne ways. However, the main conclusion will be the same as for our idealized model: during the COVID-19 and similar pandemics, cash money becomes a risky substance for spreading the pathogen. Currencies with plastic cash money such as Hong Kong dollars or Macanese patacas may be less risky but they are rare in the world, as the overwhelming majority of currencies are still printed on paper. We did not conduct any special research on the matter, however. We supposed it on the basis of several studies that demonstrated lower transmissibility of respiratory viruses through plastic surfaces than through paper surfaces [72,73,74,75,76].

3.2. Growth of Population Interest in Cryptocurrencies as Possible Substitutes for Cash Money

Figure 3 shows the in-group percentage of respondents who answered YES to question 1, by country (green bars), and part of the population who preferred bank debit/credit/online payments in 2015–2019 (grey bars). It is to emphasize that green bars demonstrate the in-group percentage of those people who used cryptocurrencies in 2020–2021 and participated in our study, and they do not show the percentage of the total population of these countries who use cryptocurrencies. Obviously, the latter may be different from the data we collected and showed as green bars. Therefore, Figure 3 must be understood in a semi-quantitative sense and the data depicted as green bars used with caution. Nonetheless, Figure 3 allows one to make an estimation of cryptocurrency popularity among social network users. Besides, it demonstrates the trends that push new countries ahead in using cryptocurrencies in our days.
In our research, the leader of using cryptocurrencies was India. China followed, despite the recent prohibition of the Chinese government to mine cryptocurrencies because of the environmental impact. As we can see, Figure 3 demonstrates a picture a little different from the data provided by Statista.com website, according to which the top six crypto countries in 2020 were Nigeria, Vietnam, Philippines, Turkey, Peru, and Switzerland [77]. That may be partly explained by different methodologies applied by Statista.com for their evaluations and by us in the current research and different set composition.
In Table 2, we provide Pearson correlation coefficients Cxy between people who responded YES to the above three queries and the fourth factor of level of non-cash bank payments in a country in 2015–2019.
A few important observations may be drawn from Figure 3 and Table 2:
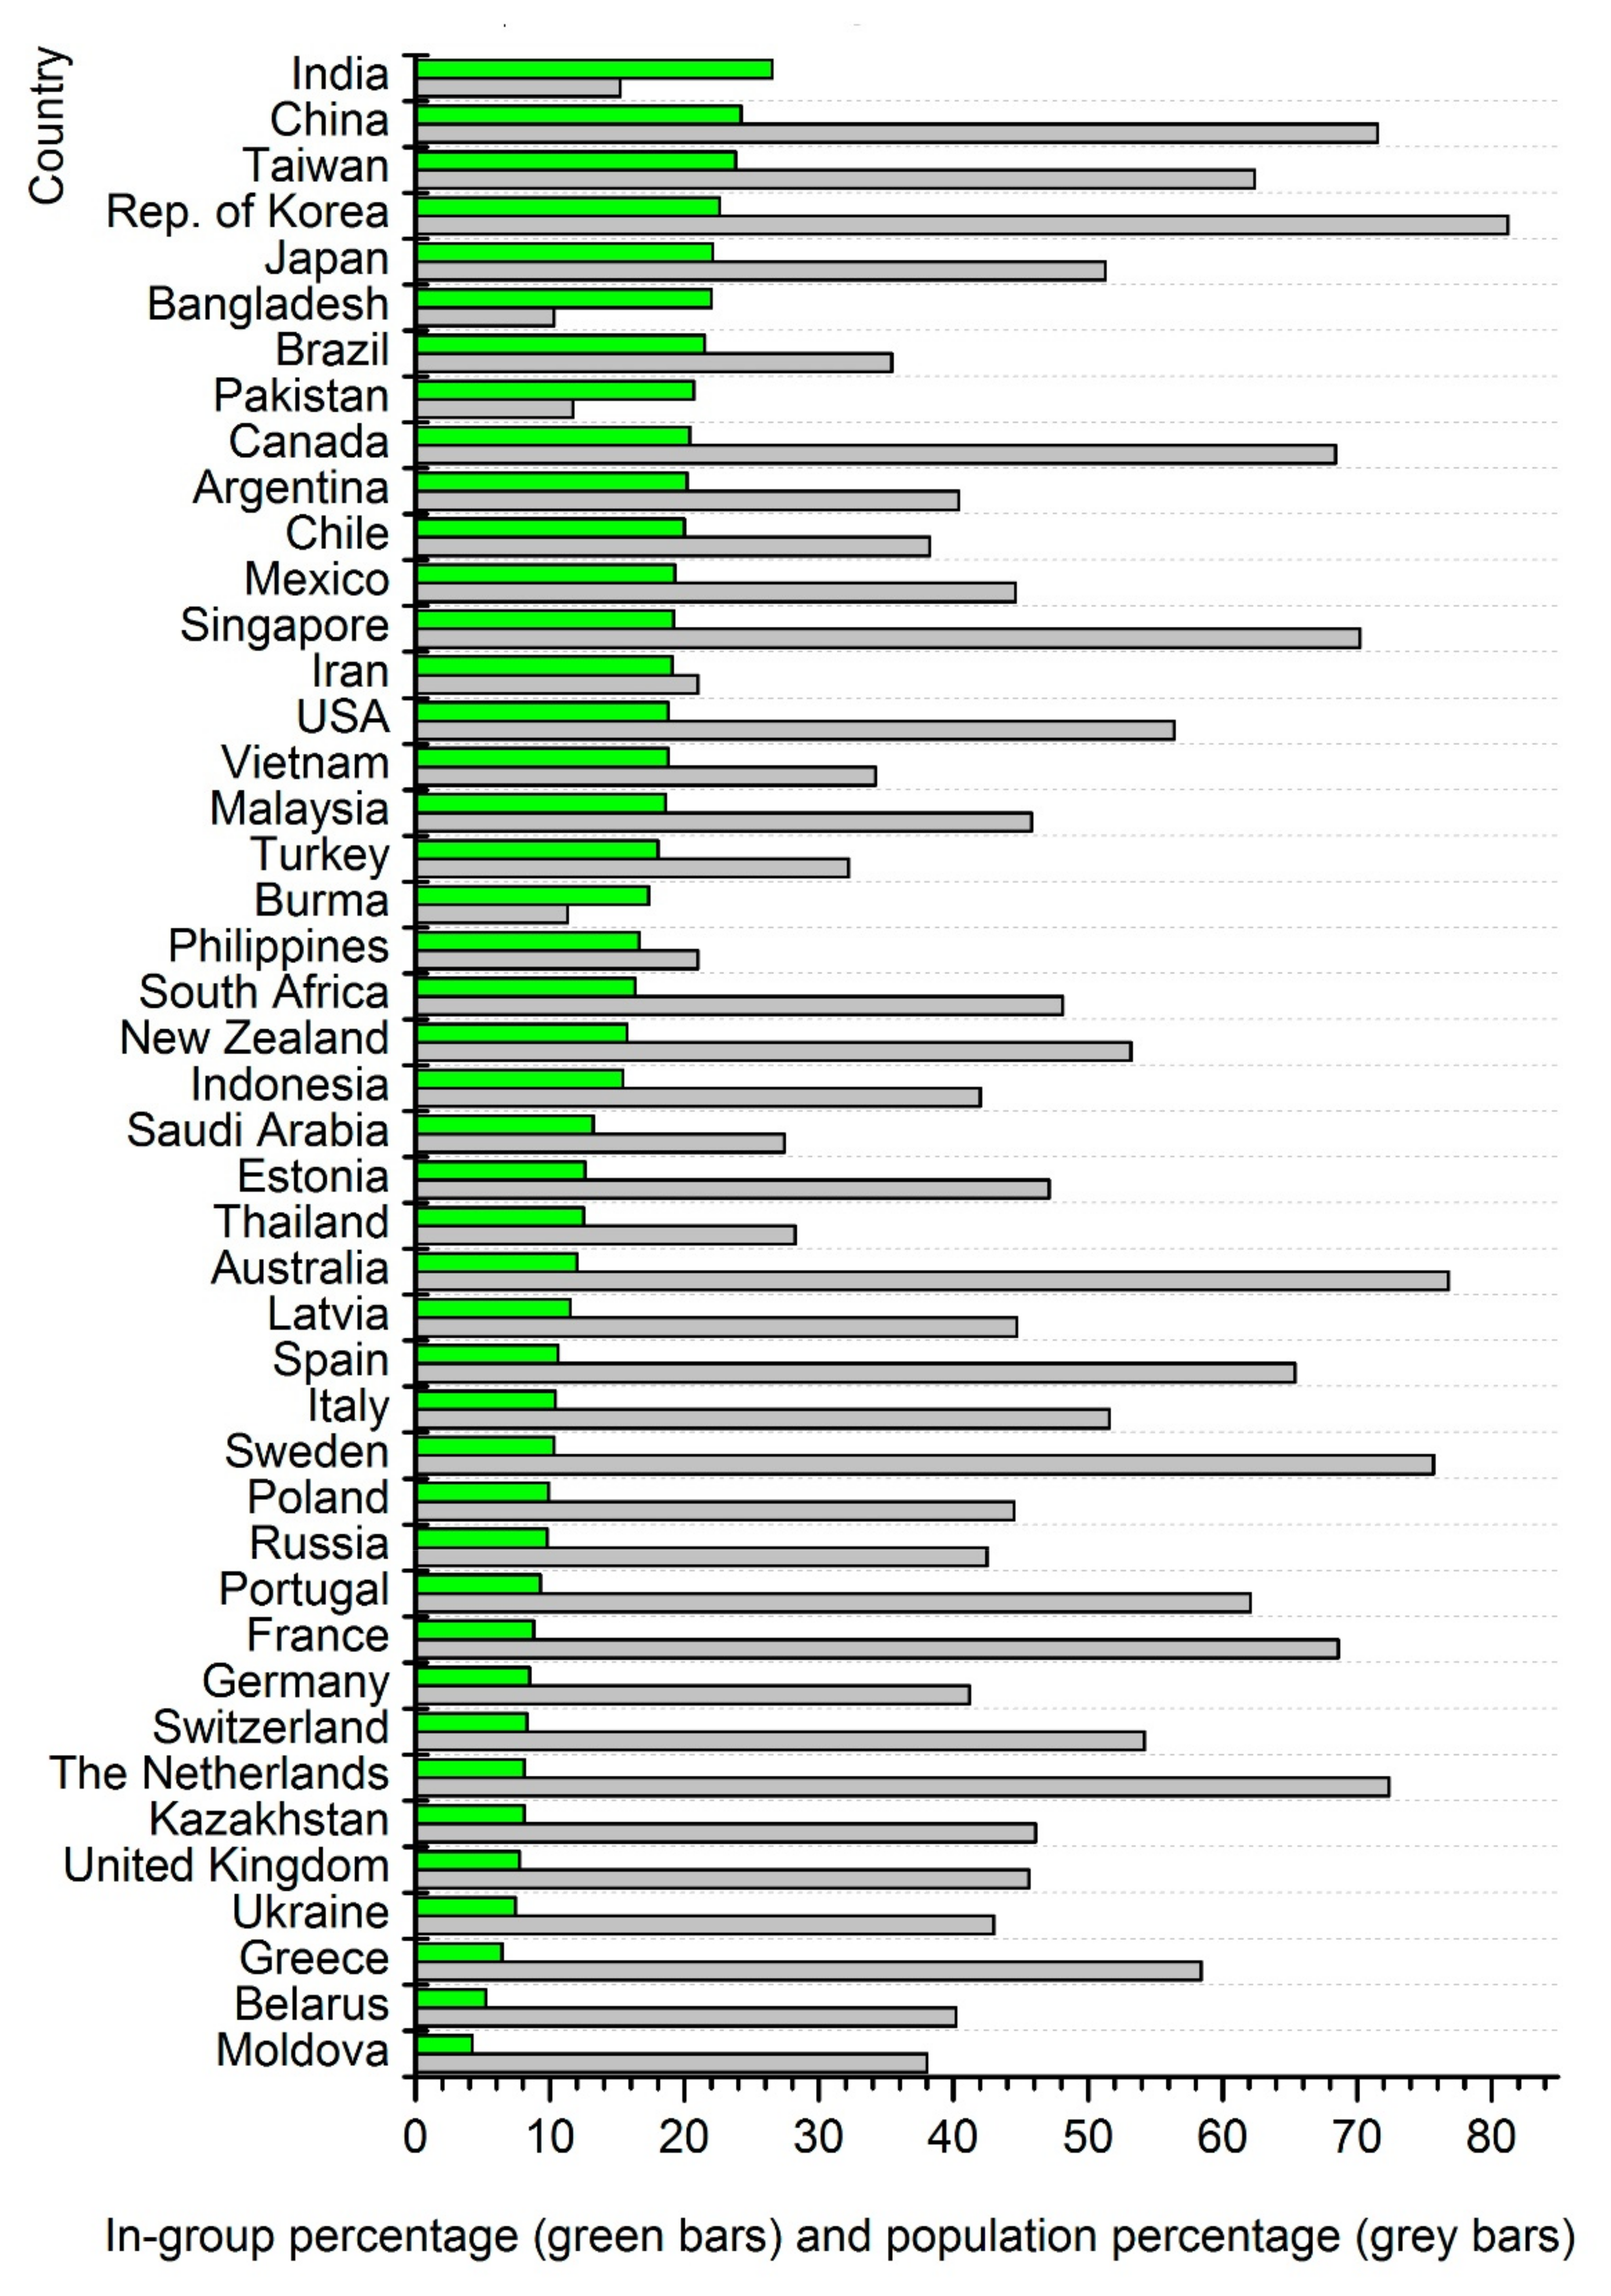
  • There is almost no correlation (even very slight anti-correlation) between Q1 (Figure 3, green bars) and bank non-cash transactions level (Figure 3, grey bars). From this, it may be deduced that cryptocurrencies are mainly used by different groups of population than devoted supporters of only credit/debit cards/online payments who totally reject using cash. Of course, a person may use both these ways of non-cash transactions (bank-controlled and cryptocurrencies) but the preferences may be different on the scale of the whole population of a country, e.g., in India we may currently observe the highest level of cryptocurrency attractiveness, while the level of using non-cash bank operations was one of the lowest in the world in 2015–2019;
  • There is still no data in statistical agencies on using debit/credit card/online payments in the time of the COVID-19 pandemic. However, there are reasons to believe that the pandemic increased the level of non-cash bank payments somewhat proportionally with respect to the pre-COVID level, according to the data provided by Statista [78], European Central Bank [79], and a set of papers on non-cash payments chosen by Science Direct [80]. With all that said, the demand for cash money also significantly increased, as works [81,82,83,84,85,86] demonstrate, despite the decline in cash day-to-day operations of individuals. Guttmann et al. presented a report on cash demand during the pandemic made by the Reserve Bank of Australia [81]. Náñez Alonso et al. discussed changes in cash demand in rural areas of Spain, which were caused by COVID-19 [82]. In a Bank of Canada Staff Discussion Paper, Chen et al. compared the demand and use of cash [83]. In a National Bank of Poland working paper, Wisniewski et al. analyzed the level of transition from cash to cashless payments during the pandemic [84]. Alvarez and Argente [85] as well as Rogoff and Scazzero [86] described new trends of cash management after 2020. All these works prove that the cash volume increased during the COVID-19 pandemic. However, this may be a result of inflation, whose level was relatively high in different parts of the world during the pandemic (partly caused by low interest rates). We may hypothesize that persons who widely used card payments before the pandemic, increased the frequency of card use. However, the groups of population who became interested in cryptocurrencies at the time of the pandemic may differ from those who prefer online bank payments and bank card operations on regular basis;
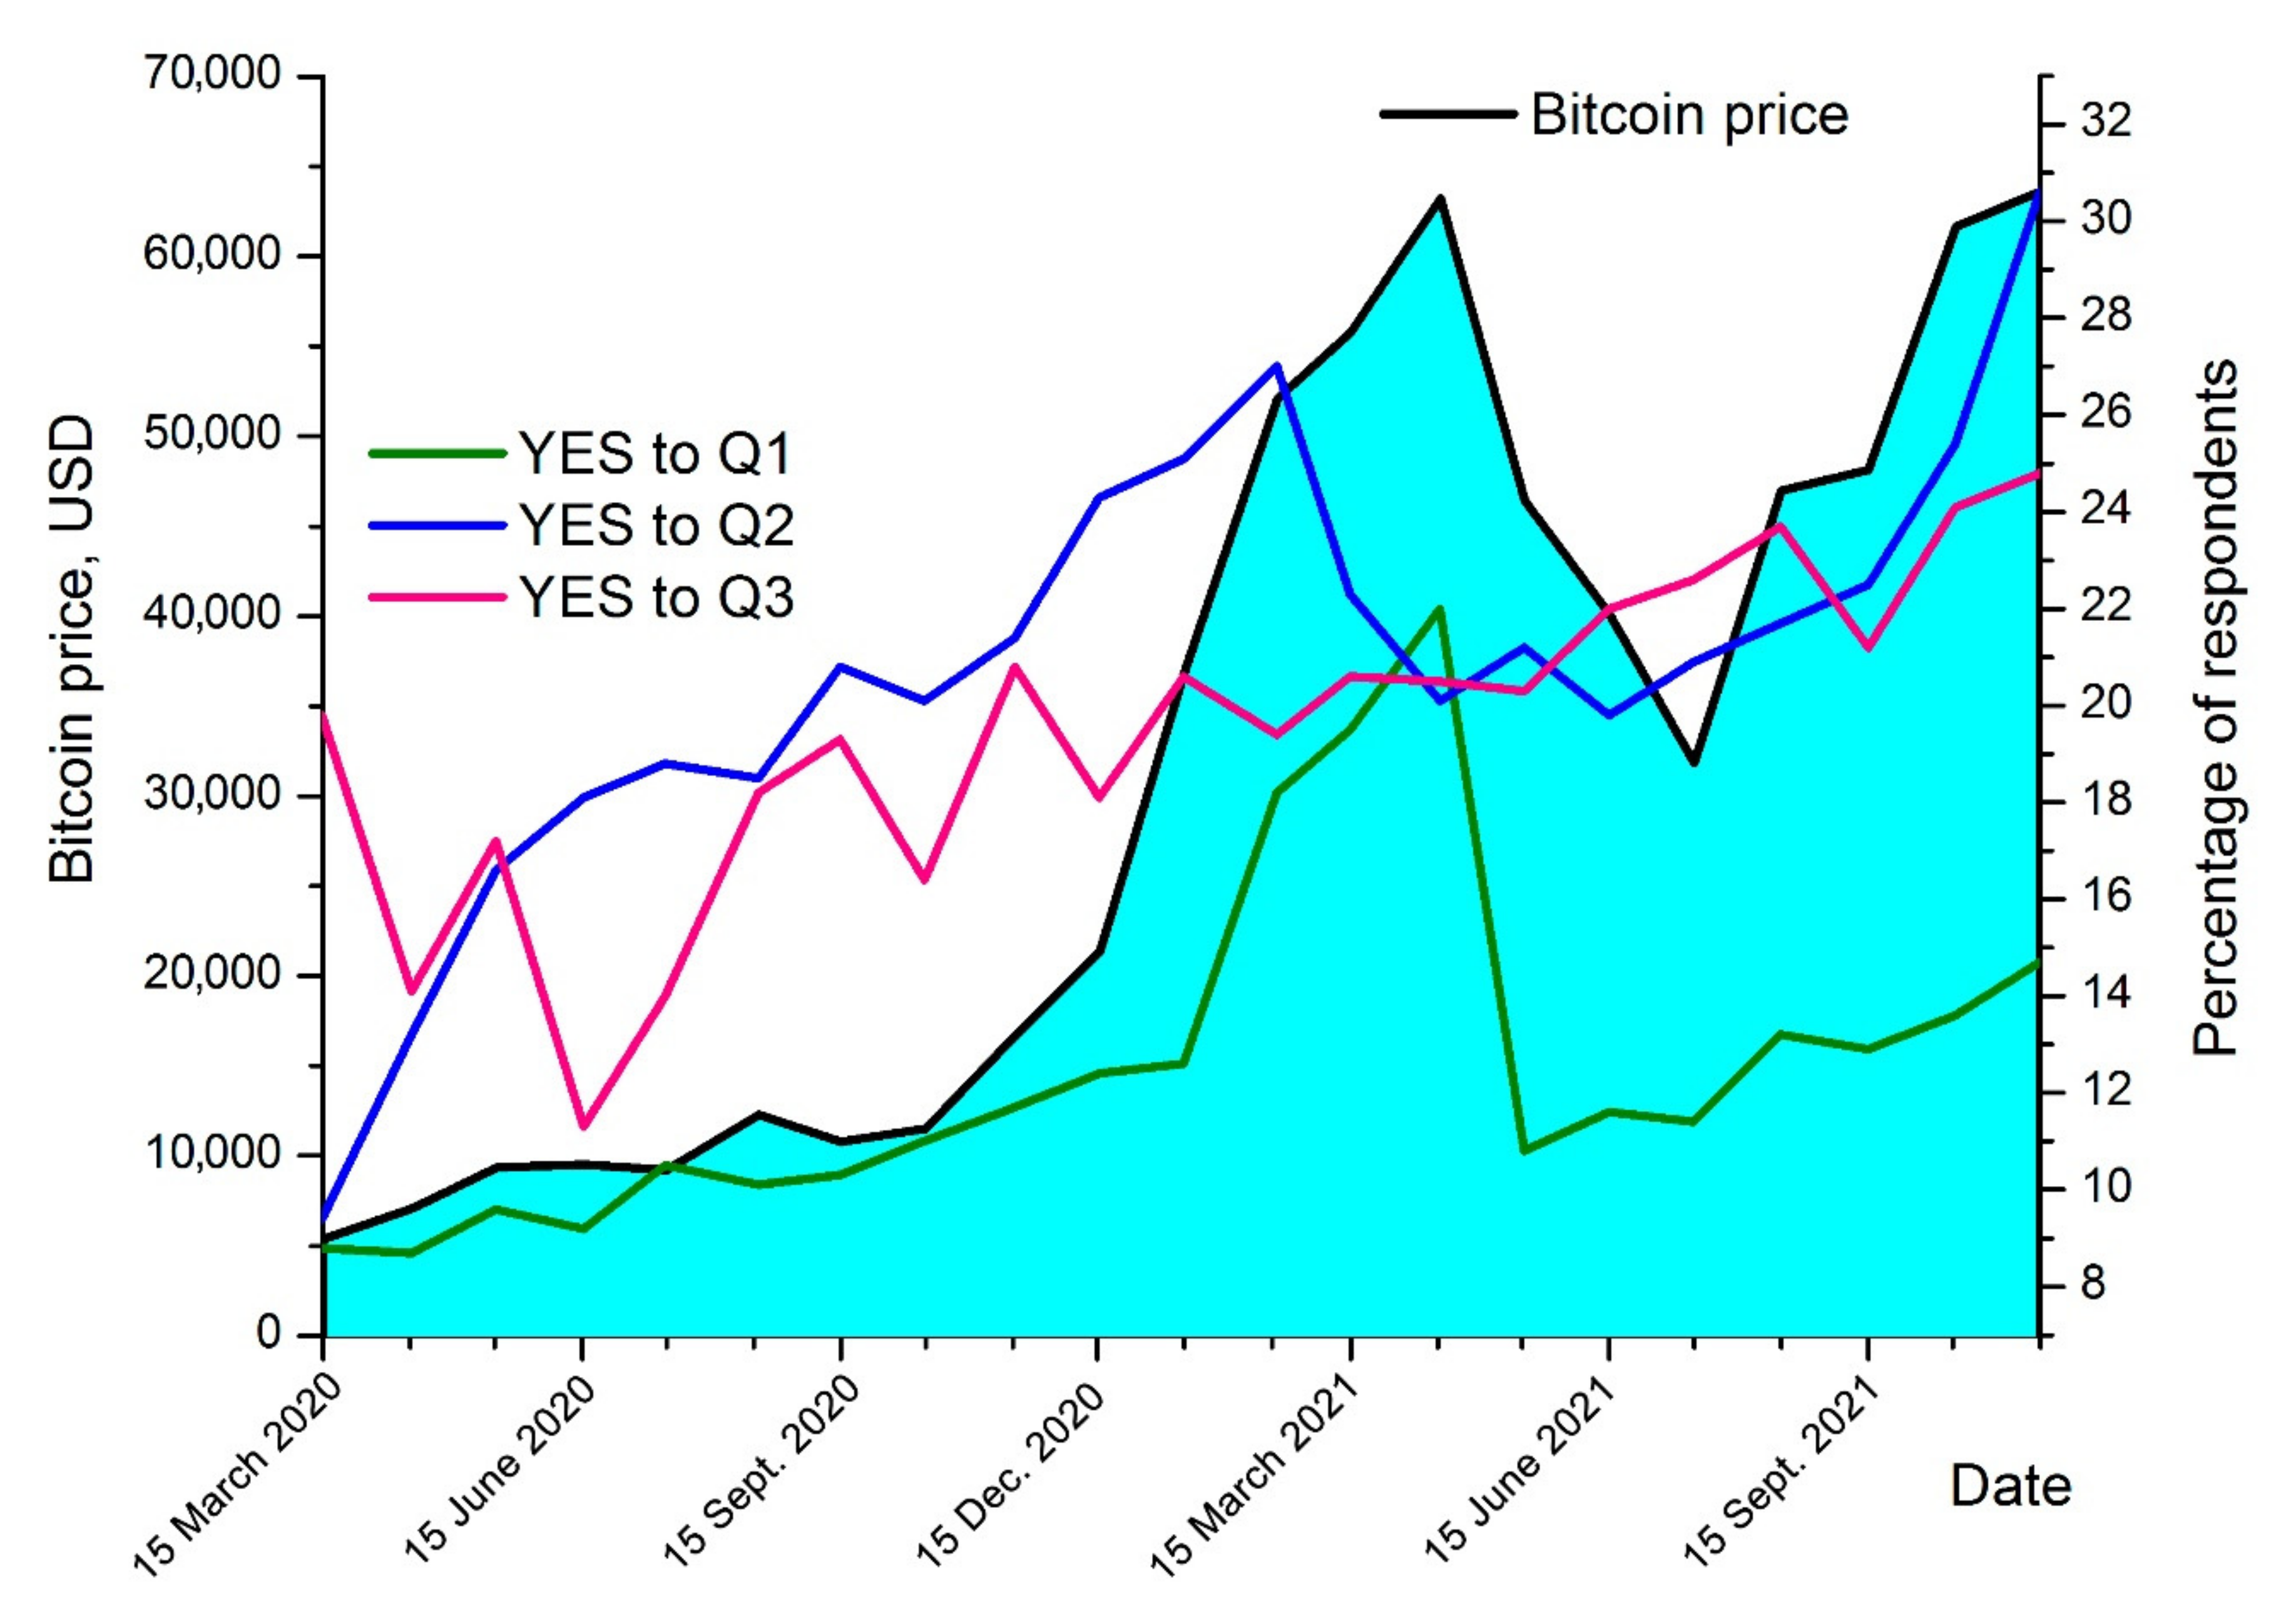
  • The correlation between Q1 and Q2 is considerable. There were people who replied YES to Q2 but NO to Q1. Therefore, we may anticipate that in case of larger regulation and protection of cryptocurrencies, the proportion of those who approve and use cryptocurrencies, may rise significantly;
  • The correlation between Q1 and Q3 is very strong (highlighted in bold in Table 1). It means we may assume that the COVID-19 pandemic was one of the main reasons for the raising fascination of cryptocurrencies;
  • The country composition is different for supporting cryptocurrency-based operations and non-cash bank operations. On the whole, with a few exceptions, we can see that economically developed countries tend to group at the lower part of Figure 3 (lower level of trust for cryptocurrency), whereas the level of non-cash bank transactions may be substantial in these countries. On the contrary, the population of many emerging countries (mainly Asian states) currently has the highest interest in cryptocurrencies independently of the level of non-cash card and online payments made by this population.

3.3. Temporal Change of Attitudes towards Cryptocurrencies in the Course of COVID-19 Pandemic

Figure 4 demonstrates the temporal change of the weighted average of YES proportion to queries Q1, Q2, and Q3 (all respondents from all countries) with regard to Bitcoin prices. Each measurement was made at the middle of the month since March 2020 to November 2021. The Pearson correlation coefficients in regard to time change are provided in Table 3.
It is noteworthy that the Bitcoin price is highly correlated with the sentiments of people who are interested in cryptocurrencies. These are sentiments about Bitcoin future (Q1 and Q2) and the fear of using cash bank notes during the pandemic (Q3). This makes cryptocurrencies the assets whose price is currently largely determined by psychological factors influencing the behavior of the general population, in comparison with more “traditional” financial assets, where institutional interest plays considerable role.

4. Limitations

The major limitations of the study are the following:
Our results reflect participation of only one social group in using cryptocurrencies, i.e., active users of social networks Facebook, Instagram, VK, and Google+. Therefore, our approach is not very representative. The results for the total population of the countries studied may be different;
We may have overlooked a few countries with a considerable level of using cryptocurrencies due to introducing a minimum threshold on number of responses, e.g., Nigeria, Peru, or Colombia [77];
We widely used the concept of correlation between different factors. However, correlation is not capable of showing the direction of causative relations, nor does it take into account the multitude of possible factors. Therefore, we may have missed several factors in the sociological survey. As well, we did;
We assumed that the main reason for tremendous cryptocurrency growth was the COVID-19 pandemic. However, it may be only one of several important factors;
We focused on Bitcoin, but we did not study a variety of cryptocurrencies and their behavior during the pandemic;
We compared the level of using cryptocurrencies in 2020–2021 with the level of non-cryptocurrency bank cashless payments in 2015–2019. Strictly speaking, that may have blurred the results to a certain degree;
We did not study the involvement of large institutional investors in cryptocurrencies trading during the pandemic. However, without studying this field the full picture of the cryptocurrency–pandemic relation is hardly attainable;
We only compared SARS-CoV-2 with influenza A virus in terms of transmissibility through cash bank notes. It would be interesting to compare it with other respiratory viruses and epidemics;
We did not investigate psychological attitudes of the general population towards cryptocurrencies as a substitute for banks monopoly on producing money and how this may have contributed to the rise of cryptocurrencies rates during the pandemic. Taking into account psychological attractiveness of cryptocurrencies as a competitor to the money produced by banks may be a serious factor of cryptocurrencies rocketing during the COVID-19 pandemic;
We did not compare paper money and plastic money in terms of epidemiological risk;
We did not assess epidemiological risk of using debit/credit cards kept in wallets along with cash money;
We did not distinguish between different ways of using cryptocurrencies, i.e., the ever-changing levels of mining, trading, keeping in cryptocurrency wallets, payments, etc.
We applied a very strict algorithmic set repair that led to a substantial contraction of the set [Final Set (after repair) = 37% × Initial Set (before repair)] algorithmically without any complex linguistic analysis of the responses.
We did not perform any manual analysis of the responses. That may have excluded many relevant responses from the further analysis, e.g., those that were input in the questionnaire in a different form from the sample we proposed {YES, NO, … (versions in other languages), -, –, —, or 1, 2, 3}.
Of all of the limitations stated above, we regard the following two the most important: (1) research of using cryptocurrency not in the whole population, but in a group that cannot give the full representativeness; and (2) absence of a multifaceted comparative study of cryptocurrencies/cash/bank cards and other online payments in the time of pandemic due to lack of third-party data. Addressing these limitations can provide a guidance how to devise and conduct a future research.

5. Conclusions

The COVID-19 pandemic caused fear of using cash bank notes as an epidemiologically risky means of transactions and simultaneous surge of almost all cryptocurrencies rates. We may hypothesize that this surge is explained by the growth of the general population’s interest in cryptocurrencies as more suitable means for new types of social relations in the global world where epidemiological measures must be ensured and observed. Heldt [87] and Biały [88] write that caution for cash money may be one of the ways to enhance the culture of communication during the pandemic events. Using cryptocurrencies is a possible option to make such an enhancement. Santos et al. [89], Naughton et al. [90], VanMeter et al. [91], and Sassin [92] emphasize the appeal of new electronic techniques of financial transactions for many people in the situation of a crisis-related uncertainty and cryptocurrencies may have attractiveness as a psychological safe haven. Besides, based on works of Wilder-Smith et al. [93], Peeri et al. [94], Nomura et al. [95], Maria and José Luis Miralles-Quirós [96], and Dwita et al. [97] we may suppose that cryptocurrencies may be a part of the Sustainable Finance paradigm.
In our model described in this article, we proved that the fear of cash money as a SARS-CoV-2 spreader is explainable. A significant part of indirect transmission of SARS-CoV-2 virus is made through cash bank notes circulation. SARS-CoV-2 remains on cash paper money for a period around four times larger than the influenza A virus and it is absorbed by cash notes two and a half times more effectively than influenza. With all that said, it should be stressed that using cash money is not any more dangerous to people during the pandemic than wearing clothes, driving cars, or buying utilities. However, due to the persistence of cash money in our life and frequent incompliance with routine safety measures by people during the pandemic (e.g., neglect of elementary washing hands after dealing with cash notes) make cash notes an important factor in spreading the pathogen.
Our conclusions about the use of cash bank notes on the whole agrees with the recent research of Bank of England that says “The COVID pandemic has changed the way that people shop. In response to social distancing guidelines, more people are shopping online, meaning fewer cash payments”. [98].
However, our estimations of coronavirus viability on paper cash surfaces do not coincide with the results obtained on behalf of the BoE [98]. The authors of the report on virus viability published by the BoE [98] (“Cash in the time of COVID” BoE paper, Box 2) argue that it is difficult to get the coronavirus from the cash notes or coins. However, the results obtained by Blutest Laboratories Ltd., Glasgow, UK, (the BoE’s contractor) cannot be unambiguously interpreted in the context of our investigation for the following reasons. 1. The laboratory did not used SARS-CoV-2, the causative pathogen of COVID-19. Instead, they used a surrogate coronavirus, but they did not specify which one. As it is known, coronaviral infections represent the group of infectious diseases caused by RNA-containing viruses of the order Nidovirales, family Coronaviridae, which affect many species of birds and mammals [99]. These viruses are numerous and currently there are more than a hundred representatives known to scientists [100]. A number of coronaviruses are pathogenic to humans, e.g., HKU1, NL63, OC43, and E229 coronaviruses cause mild human diseases [101,102]. All coronaviruses deviate from each other in size, physical conformation, and physical properties [103] and to substitute the causative agent of COVID-19 by another member of the family was possibly not the best option, as the results obtained by Blutest Laboratories Ltd. can hardly be extrapolated to SARS-CoV-2. 2. In the report published by the BoE the researchers do not provide information on the sample set of surfaces. We have no idea on the number of experiments and statistics used. 3. The authors of this report do not provide data on the techniques used to bring samples of virions to the surfaces they studied. Was it an aerosol, spray, gas, liquid, or large-droplet injection? 4. They do not provide technical data on amplification and detection of the viral RNA to assess the amount of remaining virions. To measure a virus quantity on a surface is not a trivial task and, therefore, to use the data provided by Blutest Laboratories Ltd., a reader must be fully aware of the methodology. In any case, the BoE report says that the transmission level of the novel coronavirus SARS-CoV-2 is negligibly small by cash bank notes during the pandemic. We cannot agree due to the lack of information given by the authors from Blutest Laboratories Ltd.
As epidemiologically safe means of transactions, cryptocurrencies could be attractive as a perspective for possible substitutes for cash, were they more regulated, protected, and broadly accepted as a legal means of payment, and the transactions based on them guaranteed by different institutions. The preference of cryptocurrencies to bank non-cash operations by the growing number of people (especially persons of young age, having an active lifestyle, or engaged in IT-related professions) during the pandemic may also be explained by the psychological appeal of cryptocurrencies as money that is produced by individuals, not by banks who produce customary money (USD, EUR, etc.).
Our paper helps to see a broad perspective of cryptocurrencies development during a crisis time. We studied the “coronacrisis”, but the conclusions may be applied to different crisis events and pivotal points in the development of societies.
In a global world without borders, we may anticipate unstable epidemiological situation in the decades to come. In this situation, if cryptocurrencies are recognized as legal means of savings and payments by different governments, as it is already done with Bitcoin in El Salvador, we may see them achieve tremendous success.

Author Contributions

Conceptualization, K.S.S.; methodology, D.V.B. and K.S.S.; software, D.V.B. and K.S.S.; validation, D.V.B., N.P.S. and K.S.S.; formal analysis, D.V.B. and K.S.S.; investigation, D.V.B., N.P.S. and K.S.S.; resources, N.P.S.; data curation, D.V.B. and K.S.S.; writing—original draft preparation, K.S.S.; writing—review and editing, D.V.B., N.P.S. and K.S.S.; visualization, D.V.B. and K.S.S.; supervision, N.P.S.; project administration, N.P.S.; funding acquisition, N.P.S. All authors have read and agreed to the published version of the manuscript.

Funding

This work has been funded by Government program of basic research in Koltzov Institute of Developmental Biology of Russian Academy of Sciences in 2021, No. 0088-2021-0008.

Institutional Review Board Statement

Not applicable.

Conflicts of Interest

The authors declare no conflict of interest.

Ethics

All results are anonymized and no identifying information about the social network users’ accounts was collected or disclosed in the research. The participating users who disclosed their real names were included in the cohorts but this information was stored on our server and was not used at any stage of the work. Since no experiments were carried out on biological organisms, no special ethics permission from the affiliated institution was required.

References

  1. Interest Rates, Discount Rate for United States. Available online: https://fred.stlouisfed.org/series/INTDSRUSM193N (accessed on 4 December 2021).
  2. Trading Economics. Available online: https://tradingeconomics.com/united-states/interest-rate#:~:text=Interest%20Rate%20in%20the%20United,percent%20in%20December%20of%202008.&text=United%20States%20Fed%20Funds%20Rate%20%2D%20data%2C%20historical%20chart%2C%20forecasts,updated%20on%20December%20of%202021 (accessed on 4 December 2021).
  3. Luo, S.; Zhou, G.; Zhou, J. The Impact of Electronic Money on Monetary Policy: Based on DSGE Model Simulations. Mathematics 2021, 9, 2614. [Google Scholar] [CrossRef]
  4. Shovkhalov, S.; Idrisov, H. Economic and Legal Analysis of Cryptocurrency: Scientific Views from Russia and the Muslim World. Laws 2021, 10, 32. [Google Scholar] [CrossRef]
  5. Jareño, F.; González, M.D.L.O.; López, R.; Ramos, A.R. Cryptocurrencies and oil price shocks: A NARDL analysis in the COVID-19 pandemic. Resour. Policy 2021, 74, 102281. [Google Scholar] [CrossRef] [PubMed]
  6. Umar, Z.; Jareño, F.; de la González, M. The impact of COVID-19-related media coverage on the return and volatility connectedness of cryptocurrencies and fiat currencies. Technol. Forecast. Soc. Chang. 2021, 172, 121025. [Google Scholar] [CrossRef]
  7. Umar, Z.; Gubareva, M. A time–frequency analysis of the impact of the COVID-19 induced panic on the volatility of currency and cryptocurrency markets. J. Behav. Exp. Financ. 2020, 28, 100404. [Google Scholar] [CrossRef]
  8. Mnif, E.; Jarboui, A.; Mouakhar, K. How the cryptocurrency market has performed during COVID-19? A multifractal analysis. Financ. Res. Lett. 2020, 36, 101647. [Google Scholar] [CrossRef]
  9. Corbet, S.; Hou, Y.; Hu, Y.; Larkin, C.; Oxley, L. Any port in a storm: Cryptocurrency safe-havens during the COVID-19 pandemic. Econ. Lett. 2020, 194, 109377. [Google Scholar] [CrossRef]
  10. Wątorek, M.; Kwapień, J.; Drożdż, S. Financial Return Distributions: Past, Present, and COVID-19. Entropy 2021, 23, 884. [Google Scholar] [CrossRef]
  11. Casti, J.L. From Social Mood to Collective Events: Measuring the Path by Sociometers. Beacon J. Stud. Ideol. Ment. Dimens. 2021, 4, 020110153. Available online: https://hdl.handle.net/20.500.12656/thebeacon.4.020110153 (accessed on 14 October 2021).
  12. Verma, P.; Dumka, A.; Bhardwaj, A.; Ashok, A.; Kestwal, M.C.; Kumar, P. A Statistical Analysis of Impact of COVID19 on the Global Economy and Stock Index Returns. SN Comput. Sci. 2021, 2, 27. [Google Scholar] [CrossRef]
  13. Sassin, W. Die Grenzen Der Ökonomie: Globalisierung—Vom Füllhorn Zum Giftbecher? Eur. Crossrd. 2020, 1, 010410216. Available online: https://hdl.handle.net/20.500.12656/eurcrossrd.1.010410216 (accessed on 3 November 2021).
  14. Sassin, W. Der Konflikt Zwischen Ideologien und Einer Nüchternen Und Umfassenden Sichtweise: Nachhaltig Gegen Resilient? Beacon J. Stud. Ideol. Ment. Dimens. 2020, 3, 020440211. Available online: https://hdl.handle.net/20.500.12656/thebeacon.3.020440211 (accessed on 6 October 2021).
  15. Donskikh, O.A. Moral and Ideological Consequences of Pandemic. Beacon J. Stud. Ideol. Ment. Dimens. 2020, 3, 020510125. Available online: https://hdl.handle.net/20.500.12656/thebeacon.3.020510125 (accessed on 14 November 2021).
  16. Elleby, C.; Dominguez, I.P.; Adenauer, M.; Genovese, G. Impacts of the COVID-19 Pandemic on the Global Agricultural Markets. Environ. Resour. Econ. 2020, 76, 1067–1079. [Google Scholar] [CrossRef]
  17. Mazur, M.; Dang, M.; Vega, M. COVID-19 and the march 2020 stock market crash. Evidence from S&P1500. Financ. Res. Lett. 2020, 38, 101690. [Google Scholar] [CrossRef]
  18. Pinilla, J.; Barber, P.; Vallejo-Torres, L.; Rodríguez-Mireles, S.; López-Valcárcel, B.; Serra-Majem, L. The Economic Impact of the SARS-CoV-2 (COVID-19) Pandemic in Spain. Int. J. Environ. Res. Public Health 2021, 18, 4708. [Google Scholar] [CrossRef]
  19. Mahata, A.; Rai, A.; Nurujjaman, M.; Prakash, O.; Bal, D.P. Characteristics of 2020 stock market crash: The COVID-19 induced extreme event. Chaos Interdiscip. J. Nonlinear Sci. 2021, 31, 053115. [Google Scholar] [CrossRef]
  20. Sassin, W. Globalisierung und Digitalisierung—Die Exponentielle Ausbreitung Ansteckender Information und Deren Mögliche Eindämmung. Beacon J. Stud. Ideol. Ment. Dimens. 2020, 3, 010510201. Available online: https://hdl.handle.net/20.500.12656/thebeacon.3.010510201 (accessed on 11 September 2020).
  21. O’Sullivan, A. Ungoverned or anti-governance? How Bitcoin threatens the future of Western institutions. J. Int. Aff. 2018, 71, 90–102. [Google Scholar]
  22. Suoquin, F. Auf Der Suche Nach Dem Wesen Der Evolution. Deutschland Nach Dem Zweiten Weltkrieg, Die USA Und Die Europäische Union Als Beispiele Für Den Übergang Zur Nächsten Evolutionsstufe Des Homo Sapiens. Eur. Crossrd. 2020, 1, 020210220. Available online: https://hdl.handle.net/20.500.12656/eurcrossrd.1.020210220 (accessed on 1 December 2020).
  23. Matkovskyy, R.; Jalan, A. Can Bitcoin Be an Inflation Hedge? Evidence from a Quantile-on-Quantile Model. Rev. Econ. 2021, 7, 1021–1041. [Google Scholar] [CrossRef]
  24. Meynkhard, A. Energy Efficient Development Model for Regions of the Russian Federation: Evidence of Crypto Mining. Int. J. Energy Econ. Policy 2019, 9, 16–21. [Google Scholar] [CrossRef]
  25. Alonso, S.N.; Jorge-Vázquez, J.; Fernández, M.E.; Forradellas, R.R. Cryptocurrency Mining from an Economic and Environmental Perspective. Analysis of the Most and Least Sustainable Countries. Energies 2021, 14, 4254. [Google Scholar] [CrossRef]
  26. Goodkind, A.L.; Jones, B.A.; Berrens, R.P. Cryptodamages: Monetary value estimates of the air pollution and human health impacts of cryptocurrency mining. Energy Res. Soc. Sci. 2019, 59, 101281. [Google Scholar] [CrossRef]
  27. BTC/USD. Available online: https://www.investing.com/crypto/bitcoin/btc-usd-advanced-chart (accessed on 3 December 2020).
  28. Bitcoin Trading Volume. Available online: https://data.bitcoinity.org/markets/volume/30d?c=e&t=b (accessed on 3 December 2020).
  29. Total Bitcoin Trading Volume on Major Cryptocurrency Exchanges. Available online: https://www.blockchain.com/charts/trade-volume (accessed on 3 December 2020).
  30. Chu, D. Broker-dealers for virtual currency: Regulating cryptocurrency wallets and exchanges. Colum. Law Rev. 2018, 118, 2323–2360. [Google Scholar]
  31. Ducas, E.; Wilner, A. The security and financial implications of blockchain technologies: Regulating emerging technologies in Canada. Int. J. Can. J. Glob. Policy Anal. 2017, 72, 538–562. [Google Scholar] [CrossRef] [Green Version]
  32. Turpin, J.B. Bitcoin: The Economic Case for a Global, Virtual Currency Operating in an Unexplored Legal Framework. Indiana J. Glob. Leg. Stud. 2014, 21, 335. [Google Scholar] [CrossRef] [Green Version]
  33. Zhang, Y.; Zhu, P.; Xu, Y. Has COVID-19 Changed the Hedge Effectiveness of Bitcoin? Front. Public Health 2021, 9, 704900. [Google Scholar] [CrossRef] [PubMed]
  34. Conlon, T.; Corbet, S.; McGee, R.J. Are cryptocurrencies a safe haven for equity markets? An international perspective from the COVID-19 pandemic. Res. Int. Bus. Financ. 2020, 54, 101248. [Google Scholar] [CrossRef] [PubMed]
  35. Hou, J.; Liu, J.; Jie, Y. Examining the Psychological State Analysis Relationship Between Bitcoin Prices and COVID-19. Front. Psychol. 2021, 12, 647691. [Google Scholar] [CrossRef] [PubMed]
  36. Chen, T.; Lau, C.K.M.; Cheema, S.; Koo, C.K. Economic Policy Uncertainty in China and Bitcoin Returns: Evidence From the COVID-19 Period. Front. Public Health 2021, 9, 651051. [Google Scholar] [CrossRef]
  37. James, N.; Menzies, M.; Chan, J. Changes to the extreme and erratic behaviour of cryptocurrencies during COVID-19. Phys. A Stat. Mech. Its Appl. 2020, 565, 125581. [Google Scholar] [CrossRef]
  38. Mahdi, E.; Leiva, V.; Mara’Beh, S.; Martin-Barreiro, C. A New Approach to Predicting Cryptocurrency Returns Based on the Gold Prices with Support Vector Machines during the COVID-19 Pandemic Using Sensor-Related Data. Sensors 2021, 21, 6319. [Google Scholar] [CrossRef]
  39. Kim, K.; Lee, M. The Impact of the COVID-19 Pandemic on the Unpredictable Dynamics of the Cryptocurrency Market. Entropy 2021, 23, 1234. [Google Scholar] [CrossRef]
  40. Lahmiri, S.; Bekiros, S. The impact of COVID-19 pandemic upon stability and sequential irregularity of equity and cryptocurrency markets. Chaos Solitons Fractals 2020, 138, 109936. [Google Scholar] [CrossRef]
  41. Woebbeking, F. Cryptocurrency volatility markets. Digit. Financ. 2021, 3. [Google Scholar] [CrossRef]
  42. Drożdż, S.; Kwapień, J.; Oświęcimka, P.; Stanisz, T.; Wątorek, M. Complexity in Economic and Social Systems: Cryptocurrency Market at around This Is Correct COVID-19. Entropy 2020, 22, 1043. [Google Scholar] [CrossRef]
  43. Ftiti, Z.; Louhichi, W.; Ben Ameur, H. Cryptocurrency volatility forecasting: What can we learn from the first wave of the COVID-19 outbreak? Ann. Oper. Res. 2021, 1–26. [Google Scholar] [CrossRef]
  44. Zhu, P.; Zhang, X.; Wu, Y.; Zheng, H.; Zhang, Y. Investor attention and cryptocurrency: Evidence from the Bitcoin market. PLoS ONE 2021, 16, e0246331. [Google Scholar] [CrossRef]
  45. Non-Cash Payments Volume. Available online: https://worldpaymentsreport.com/non-cash-payments-volume-3/#transactions-per-inhabitant (accessed on 17 November 2021).
  46. World Economic Forum. Available online: https://www.weforum.org/agenda/2021/01/this-chart-shows-cash-cashless-finance-payment-methods-global-preference (accessed on 17 November 2021).
  47. Proportion of Non-Cash Payments in Selected Countries Worldwide in 2015. Available online: https://www.statista.com/statistics/585966/share-of-cashless-transactions-by-country (accessed on 17 November 2021).
  48. Sharov, K.S. Creating and applying SIR modified compartmental model for calculation of COVID-19 lockdown efficiency. Chaos Solitons Fractals 2020, 141, 110295. [Google Scholar] [CrossRef]
  49. Valba, O.V.; Avetisov, V.A.; Gorsky, A.S.; Nechaev, S.K. Evaluating Ideologies of Coronacrisis-Related Self-Isolation and Frontiers Closing by SIR Compartmental Epidemiological Model. Beacon J. Stud. Ideol. Ment. Dimens. 2020, 3, 020210318. Available online: https://hdl.handle.net/20.500.12656/thebeacon.3.020210318 (accessed on 11 September 2021).
  50. Sharov, K.S. 8806 Russian patients demonstrate T cell count as better marker of COVID-19 clinical course severity than SARS-CoV-2 viral load. Sci. Rep. 2021, 11, 9440. [Google Scholar] [CrossRef]
  51. Malik, Y.A. Properties of Coronavirus and SARS-CoV-2. Malays. J. Pathol. 2020, 42, 3–11. [Google Scholar]
  52. Meyerowitz, E.A.; Richterman, A.; Gandhi, R.T.; Sax, P.E. Transmission of SARS-CoV-2: A Review of Viral, Host, and Environmental Factors. Ann. Intern. Med. 2021, 174, 69–79. [Google Scholar] [CrossRef]
  53. Fathizadeh, H.; Maroufi, P.; Momen-Heravi, M.; Dao, S.; Köse, Ş.; Ganbarov, K.; Pagliano, P.; Esposito, S.; Kafil, H.S. Protection and disinfection policies against SARS-CoV-2 (COVID-19). Infez. Med. 2020, 28, 185–191. [Google Scholar]
  54. Sharov, K.S. HIV/SARS-CoV-2 co-infection: T cell profile, cytokine dynamics and role of exhausted lymphocytes. Int. J. Infect. Dis. 2020, 102, 163–169. [Google Scholar] [CrossRef]
  55. Xue, X.; Ball, J.K.; Alexander, C.; Alexander, M.R. All Surfaces Are Not Equal in Contact Transmission of SARS-CoV-2. Matter 2020, 3, 1433–1441. [Google Scholar] [CrossRef]
  56. Azuma, K.; Yanagi, U.; Kagi, N.; Kim, H.; Ogata, M.; Hayashi, M. Environmental factors involved in SARS-CoV-2 transmission: Effect and role of indoor environmental quality in the strategy for COVID-19 infection control. Environ. Health Prev. Med. 2020, 25, 1–16. [Google Scholar] [CrossRef]
  57. Marquès, M.; Domingo, J.L. Contamination of inert surfaces by SARS-CoV-2: Persistence, stability and infectivity. A review. Environ. Res. 2020, 193, 110559. [Google Scholar] [CrossRef]
  58. Zhou, L.; Yao, M.; Zhang, X.; Hu., B.; Li., X.; Chen, H.; Zhang, L.; Liu, Y.; Du, M.; Sun, B.; et al. Breath-, air- and surface-borne SARS-CoV-2 in hospitals. J. Aerosol. Sci. 2021, 152, 105693. [Google Scholar] [CrossRef]
  59. Ren, S.-Y.; Wang, W.-B.; Hao, Y.-G.; Zhang, H.-R.; Wang, Z.-C.; Chen, Y.-L.; Gao, R.-D. Stability and infectivity of coronaviruses in inanimate environments. World J. Clin. Cases 2020, 8, 1391–1399. [Google Scholar] [CrossRef] [PubMed]
  60. Henson, S.M.; Brauer, F.; Castillo-Chavez, C. Mathematical Models in Population Biology and Epidemiology. Am. Math. Mon. 2003, 110, 254. [Google Scholar] [CrossRef]
  61. Brauer, F. Age-of-infection and the final size relation. Math. Biosci. Eng. 2008, 5, 681–690. [Google Scholar] [CrossRef] [PubMed]
  62. Brauer, F. Preface. J. Biol. Dyn. 2010, 4, 429–430. [Google Scholar] [CrossRef] [Green Version]
  63. Brauer, F. A new epidemic model with indirect transmission. J. Biol. Dyn. 2016, 11, 285–293. [Google Scholar] [CrossRef]
  64. Davoudi, B.; Moser, F.; Brauer, F.; Pourbohloul, B. Epidemic progression on networks based on disease generation time. J. Biol. Dyn. 2013, 7, 148–160. [Google Scholar] [CrossRef] [Green Version]
  65. Brauer, F. A simple model for behaviour change in epidemics. BMC Public Health 2011, 11, S3. [Google Scholar] [CrossRef] [Green Version]
  66. Tien, J.H.; Earn, D.J.D. Multiple Transmission Pathways and Disease Dynamics in a Waterborne Pathogen Model. Bull. Math. Biol. 2010, 72, 1506–1533. [Google Scholar] [CrossRef]
  67. Hirose, R.; Ikegaya, H.; Naito, Y.; Watanabe, N.; Yoshida, T.; Bandou, R.; Daidoji, T.; Itoh, Y.; Nakaya, T. Survival of SARS-CoV-2 and influenza virus on the human skin: Importance of hand hygiene in COVID-19. Clin. Infect. Dis. 2020, 73, e4329–e4335. [Google Scholar] [CrossRef]
  68. Jung, S.-M.; Akhmetzhanov, A.R.; Hayashi, K.; Linton, N.M.; Yang, Y.; Yuan, B.; Kobayashi, T.; Kinoshita, R.; Nishiura, H. Real-Time Estimation of the Risk of Death from Novel Coronavirus (COVID-19) Infection: Inference Using Exported Cases. J. Clin. Med. 2020, 9, 523. [Google Scholar] [CrossRef] [Green Version]
  69. Kuniya, T. Prediction of the Epidemic Peak of Coronavirus Disease in Japan. J. Clin. Med. 2020, 9, 789. [Google Scholar] [CrossRef] [Green Version]
  70. Delikhoon, M.; Guzman, M.I.; Nabizadeh, R.; Baghani, A.N. Modes of Transmission of Severe Acute Respiratory Syndrome-Coronavirus-2 (SARS-CoV-2) and Factors Influencing on the Airborne Transmission: A Review. Int. J. Environ. Res. Public Health 2021, 18, 395. [Google Scholar] [CrossRef]
  71. Sharov, K.S. Trends in adaptation of fifteen European countries population to SARS-CoV-2 in March–May 2020: Can Taiwanese experience be adopted? J. Formos. Med. Assoc. 2020, 120, 679–687. [Google Scholar] [CrossRef]
  72. Otter, J.A.; Donskey, C.; Yezli, S.; Douthwaite, S.; Goldenberg, S.D.; Weber, D.J. Transmission of SARS and MERS coronaviruses and influenza virus in healthcare settings: The possible role of dry surface contamination. J. Hosp. Infect. 2016, 92, 235–250. [Google Scholar] [CrossRef] [Green Version]
  73. Cortes, A.A.; Zuñiga, J.M. The use of copper to help prevent transmission of SARS-coronavirus and influenza viruses. A general review. Diagn. Microbiol. Infect. Dis. 2020, 98, 115176. [Google Scholar] [CrossRef]
  74. Lauterbach, S.E.; Wright, C.M.; Zentkovich, M.M.; Nelson, S.W.; Lorbach, J.N.; Bliss, N.T.; Nolting, J.M.; Pierson, R.M.; King, M.D.; Bowman, A.S. Detection of influenza A virus from agricultural fair environment: Air and surfaces. Prev. Veter.-Med. 2018, 153, 24–29. [Google Scholar] [CrossRef]
  75. Ikeda, K.; Tsujimoto, K.; Suzuki, Y.; Koyama, A.H. Survival of influenza A virus on contaminated student clothing. Exp. Ther. Med. 2015, 9, 1205–1208. [Google Scholar] [CrossRef] [Green Version]
  76. Robinson, M.; Drossinos, Y.; Stilianakis, N.I. Indirect transmission and the effect of seasonal pathogen inactivation on infectious disease periodicity. Epidemics 2013, 5, 111–121. [Google Scholar] [CrossRef]
  77. Share of Respondents Who Indicated They Either Owned or Used Cryptocurrencies in 55 Countries Worldwide in 2020. Available online: https://www.statista.com/statistics/1202468/global-cryptocurrency-ownership (accessed on 3 December 2021).
  78. Number of Non-Cash Transactions Worldwide from 2013 to 2018, with Forecasts from 2019 to 2023, by Region. Available online: https://www.statista.com/statistics/265767/number-of-cashless-transactions-worldwide-by-region (accessed on 18 November 2021).
  79. Payments Statistics: 2020. European Central Bank. Available online: https://www.ecb.europa.eu/press/pr/stats/paysec/html/ecb.pis2020~5d0ea9dfa5.en.html (accessed on 18 November 2021).
  80. Noncash Payments. Science Direct. Available online: https://www.sciencedirect.com/topics/economics-econometrics-and-finance/noncash-payments (accessed on 18 November 2021).
  81. Guttmann, R.; Pavlik, C.; Ung, B.; Wang, G. Cash Demand during COVID-19. Available online: https://www.rba.gov.au/publications/bulletin/2021/mar/pdf/cash-demand-during-covid-19.pdf (accessed on 5 December 2021).
  82. Alonso, S.N.; Jorge-Vazquez, J.; Forradellas, R.R. Detection of Financial Inclusion Vulnerable Rural Areas through an Access to Cash Index: Solutions Based on the Pharmacy Network and a CBDC. Evidence Based on Ávila (Spain). Sustainability 2020, 12, 7480. [Google Scholar] [CrossRef]
  83. Chen, H.; Engert, W.; Huynh, K.; Nicholls, G.; Nicholson, M.; Zhu, J. Cash and COVID-19: The Impact of the Pandemic on the Demand for and Use of Cash (No. 2020-6). Bank of Canada Staff Discussion Paper. 2020. Available online: https://www.bankofcanada.ca/2020/07/staff-discussion-paper-2020-6 (accessed on 4 December 2021).
  84. Wisniewski, T.P.; Polasik, M.; Kotkowski, R.; Moro, A. Switching from Cash to Cashless Payments during the COVID-19 Pandemic and Beyond. NBP Working Paper no. 337. Available online: https://www.nbp.pl/publikacje/materialy_i_studia/337_en.pdf (accessed on 4 December 2021).
  85. Alvarez, F.; Argente, D. Cash-Management in Times of COVID-19. BE J. Macroecon. 2021. [Google Scholar] [CrossRef]
  86. Rogoff, K.; Scazzero, J. COVID Cash. CMFA Working Paper 002. Available online: https://scholar.harvard.edu/files/rogoff/files/cato_journal_covid_cash_november_2021.pdf (accessed on 4 December 2021).
  87. Heldt, A. Let’s Meet Halfway: Sharing New Responsibilities in a Digital Age. J. Inf. Policy 2019, 9, 336–369. Available online: https://papers.ssrn.com/sol3/papers.cfm?abstract_id=3459965 (accessed on 12 November 2020). [CrossRef]
  88. Biały, B. Social Media—From Social Exchange to Battlefield. Cyber Def. Rev. 2017, 2, 69–90. Available online: https://cyberdefensereview.army.mil/CDR-Content/Articles/Article-View/Article/1589009/social-mediafrom-social-exchange-to-battlefield (accessed on 7 October 2020).
  89. Santos, K.O.B.; Fernandes, R.D.C.P.; De Almeida, M.M.C.; Miranda, S.S.; Mise, Y.F.; De Lima, M.A.G. Trabalho, saúde e vulnerabilidade na pandemia de COVID-19. Cad. De Saúde Pública 2020, 36, e00178320. [Google Scholar] [CrossRef]
  90. Naughton, S.X.; Raval, U.; Harary, J.M.; Pasinetti, G.M. The role of the exposome in promoting resilience or susceptibility after SARS-CoV-2 infection. J. Expo. Sci. Environ. Epidemiol. 2020, 30, 776–777. [Google Scholar] [CrossRef]
  91. VanMeter, K.C.; Bhakdi, S.; Gerilovych, A.P. COVID-19 Outbreak Role in the Development of Societies: Questions and Inconsistencies. Beacon J. Stud. Ideol. Ment. Dimens. 2020, 3, 011140018. Available online: https://hdl.handle.net/20.500.12656/thebeacon.3.011140018 (accessed on 28 September 2021).
  92. Sassin, W. Behindert Die Demokratie Die Nachhaltigkeit in Eurasien? Eur. Crossrd. 2020, 1, 020000201. Available online: https://hdl.handle.net/20.500.12656/eurcrossrd.1.020000201 (accessed on 4 November 2021).
  93. Wilder-Smith, A.; Chiew, C.J.; Lee, V.J. Can we contain the COVID-19 outbreak with the same measures as for SARS? Lancet Infect. Dis. 2020, 20, e102–e107. [Google Scholar] [CrossRef] [Green Version]
  94. Peeri, N.C.; Shrestha, N.; Rahman, M.S.; Zaki, R.; Tan, Z.; Bibi, S.; Baghbanzadeh, M.; Aghamohammadi, N.; Zhang, W.; Haque, U. The SARS, MERS and novel coronavirus (COVID-19) epidemics, the newest and biggest global health threats: What lessons have we learned? Int. J. Epidemiol. 2020, 49, 717–726. [Google Scholar] [CrossRef] [Green Version]
  95. Nomura, S.; Yoneoka, D.; Tanoue, Y.; Kawashima, T.; Shi, S.; Eguchi, A.; Miyata, H. Time to Reconsider Diverse Ways of Working in Japan to Promote Social Distancing Measures against the COVID-19. J. Hered. 2020, 97, 457–460. [Google Scholar] [CrossRef]
  96. Miralles-Quirós, M.M.; Miralles-Quirós, J.L. Sustainable Finance and the 2030 Agenda: Investing to Transform the World. Sustainability 2021, 13, 10505. [Google Scholar] [CrossRef]
  97. Mariana, C.D.; Ekaputra, I.A.; Husodo, Z.A. Are Bitcoin and Ethereum safe-havens for stocks during the COVID-19 pandemic? Financ. Res. Lett. 2020, 38, 101798. [Google Scholar] [CrossRef] [PubMed]
  98. Caswell, E.; Smith, M.H.; Learmonth, D.; Pearce, G. Cash in the Time of COVID. Quarterly Bulletin of Bank of England of 2020 Q4. Available online: https://www.bankofengland.co.uk/quarterly-bulletin/2020/2020-q4/cash-in-the-time-of-covid (accessed on 4 December 2021).
  99. Gerilovych, A.P.; Stegniy, B.T.; Kornieikov, O.M.; Muzyka, D.V.; Gerilovych, I.O.; Bolotin, V.I.; Kovalenko, L.V.; Arefiev, V.L.; Zlenko, O.B.; Kolchyk, O.V. Coronavirus Infections of Animals and Humans: Biological and Epidemiological Properties of Causative Agents; Springer: Singapore, 2021; pp. 17–36. [Google Scholar] [CrossRef]
  100. Payne, S. Family Coronaviridae. Viruses 2017, 149–158. [Google Scholar] [CrossRef]
  101. Roussel, Y.; Giraud-Gatineau, A.; Jimeno, M.-T.; Rolain, J.-M.; Zandotti, C.; Colson, P.; Raoult, D. SARS-CoV-2: Fear versus data. Int. J. Antimicrob. Agents 2020, 55, 105947. [Google Scholar] [CrossRef] [PubMed]
  102. Sharov, K.S. Adaptation of a Russian population to SARS-CoV-2: Asymptomatic course, comorbidities, mortality, and other respiratory viruses—A reply to Fear versus Data. Int. J. Antimicrob. Agents 2020, 56, 106093. [Google Scholar] [CrossRef]
  103. To, K.K.W.; Hung, I.F.N.; Chan, J.F.W.; Yuen, K.-Y. From SARS coronavirus to novel animal and human coronaviruses. J. Thorac. Dis. 2013, 5, S103–S108. [Google Scholar] [CrossRef]
Figure 1. Relative change in price of different assets: energy resources; grains; precious, ferrous and non-ferrous metals; bonds; interest rate swaps; several world stock indices; and cryptocurrencies, since February 2019 till September 2020 (the end of the first wave of the COVID-19 pandemic). The data are taken from the following sources: New York Mercantile Exchange; Chicago Board of Trade; London Bullion Market; Singapore Exchange; London Metal Exchange; BrokerTec; London Clearing House LCH ClearNet; Chicago Mercantile Exchange; Intercontinental Exchange; National Stock Exchange of India; and several cryptocurrency exchanges.
Mathematics 09 03263 g001
Figure 2. Modelling the decay of active viruses on dirty and fat paper surfaces (approximation for cash bank notes) in ideal conditions free of UV radiation and mechanical stir. The initial amounts of virions shed on the surfaces are equal for the two viruses. Poisson noise 5%. Modelling is made in OriginPro 8.1 (OriginLab Corp., Northampton, MA, USA) with the use of nonlinear curve simulation instrument based on multiparametric input.
Mathematics 09 03263 g002
Figure 3. Part of respondents who engaged in any transactions with any cryptocurrencies in the groups of respondents studied our investigation (2020–2021), per cent (green bars), and mean part of population that was using non-cash bank payments (debit/credit cards or online payments) in these countries in 2015–2019 on a regular basis (third-party data, grey bars).
Mathematics 09 03263 g003
Figure 4. Bitcoin price (left axis) and weighted average proportion of respondents who answered YES to queries Q1, Q2, and Q3 (right axis), depending on time. Fixings were made at the middle of each month from 15 March 2020 to 15 November 2021.
Mathematics 09 03263 g004
Table 1. Main demographics of the respondents and their cryptocurrency-related profile. Detected algorithmically on the basis of the data provided in social networks accounts (if any) or from the questionnaire. Student distribution of the sample set was assumed, CI = 95%, p = 0.05.
AgeRange: 18–64 years *; mean 32.4 ± 10.2 y.o.
Gender13,654 females (42.52% **)
IT-related occupation8366 (26.05%)
Active lifestyle (based on analysis of photo captions posted in the last three years)10,077 (31.38%)
Self-employed (if stated overtly in the social account profile)5228 (16.28%)
Academic training (if stated overtly in the social account profile):
  • Student (undergraduate or post-graduate)
7420 (23.10%)
  • Bachelor degree
5238 (16.31%)
  • Master degree
4904 (15.27%)
  • PhD degree or higher
82 (0.26%)
Engaged in any operations with any of cryptocurrencies4728 (14.72%)
Time of using any of cryptocurrencies in group of those persons who use themMean 1.1 ± 0.7 years
Interest in cryptocurrencies emerged after the beginning of the COVID-19 pandemic, independently of using cryptocurrencies in practice or not (based on the posts content analysis)18,106 (56.38%)
Engaged in crypto mining2264 (7.05%)
Engaged in crypto trading3588 (11.17%)
Engaged in crypto savings1012 (3.15%)
Engaged in crypto exchange with other wallets/cryptocurrencies709 (2.21%)
Regular online payments with cryptocurrencies134 (0.42%)
* Responses received from minors were not included in the sample set; ** Hereinafter the percentage of the total final set.
Table 2. Pearson correlation coefficients Cxy between YES reply proportion in different countries to the queries at the corresponding significance levels pxy. Strong correlation is highlighted in bold.
Q1Q2Q3Bank Non-Cash
Q1 0.64020.8404 *–0.1932
Q2p ≤ 2.87 × 10⁻⁶ 0.59040.1619
Q3p ≤ 9.66 × 10⁻¹³ *p ≤ 2.46 × 10⁻⁵ –0.1730
Bank Non-Cashp ≤ 0.2090p ≤ 0.2939p ≤ 0.2615
* Strong correlation is highlighted in bold.
Table 3. Pearson correlation coefficients Bxy between temporal changes of weighted average YES proportion in the whole set and Bitcoin prices, at the corresponding significance levels pB, xy.
Q1 (t)Q2 (t)Q3 (t)Bitcoin Price (t)
Q1 (t) 0.52710.41870.7878 *
Q2 (t)pB ≤ 0.0141 0.52360.6953 *
Q3 (t)pB ≤ 0.0589pB ≤ 0.0149 0.7254 *
Bitcoin Price (t)pB ≤ 2.24 × 10⁻⁵ *pB ≤ 4.67 × 10⁻⁴ *pB ≤ 1.98 × 10⁻⁴ *
* Strong correlations are highlighted in bold.
Publisher’s Note: MDPI stays neutral with regard to jurisdictional claims in published maps and institutional affiliations.

