
Trading Cryptocurrencies Using Second Order Stochastic Dominance


Department of Management, Western Galilee Academic College, Acre 2412101, Israel
Mathematics 2021, 9(22), 2861; https://doi.org/10.3390/math9222861
Submission received: 24 October 2021
/
Revised: 6 November 2021
/
Accepted: 10 November 2021
/
Published: 11 November 2021
(This article belongs to the Special Issue Mathematics, Cryptocurrencies and Blockchain Technology)
Abstract
:This research is the first attempt to customize a trading system that is based on second order stochastic dominance (SSD) to five known cryptocurrencies’ daily data: Bitcoin, Ethereum, XRP, Binance Coin, and Cardano. Results show that our system can predict price trends of cryptocurrencies, trade them profitably, and in most cases outperform the buy and hold (B&H) simple strategy. Our system’s best performance was achieved trading XRP, Binance Coin, Ethereum, and Bitcoin. Although our system has also generated a positive net profit (NP) for Cardano, it failed to outperform the B&H strategy. For all currencies, the system better predicted long trends than short trends.
1. Introduction
The use of algorithmic trading systems is widespread among investment houses and professional traders who uses algorithmic trading as their major investment tool. In recent years, investors have realized that those systems are necessary for processing efficiently a huge amount of financial data and replace many hours of human analysis. Researchers and practitioners have tried to identify cryptocurrencies’ price behaviors and by doing so improve their ability to forecasts future prices. Different processes were used to identify and forecasts cryptocurrencies’ price behaviors, including linear and nonlinear and other technical tools. This research makes the first attempt to predict price trends of major cryptocurrencies using second order stochastic dominance (SSD) conditions. The concept of stochastic dominance arises in decision analysis in situations where one probability distribution over possible outcomes can be ranked as superior to another. Our aim is to detect stochastic dominance superiority changes and exploit them for profitable trading.
We tested our system for five major cryptocurrencies: Bitcoin, Ethereum, XRP (Ripple), Binance Coin, and Cardano. Cryptocurrency such as Bitcoin is traded on special exchanges including Etoro and CoinBase. The biggest exchange in the world by far is called Binance. That exchange has developed its own cryptocurrency called Binance Coin to make it easier to pay for the exchange services, and this currency held in 2021 the third largest market value of all cryptocurrencies. Cardano was launched in 2017 as a third generation blockchain that aimed to directly compete with other decentralized platforms as a more scalable, secure, and efficient alternative. By August 2021, Cardano had the third highest market value after Bitcoin and Ethereum. We found that the system can predict price trends of cryptocurrencies, trade them profitably, and in most cases outperform the buy and hold (B&H) simple strategy.
2. Literature Review
Researchers have documented that the cryptocurrency market is largely affected by herding behavior (Vidal Tomas et al. [1]; Gama Silva et al. [2]); therefore, techniques such as machine learning and technical analysis improve price forecasting when they integrate additional variables related to sentiment (see for example Ortu et al. [3]). Because of this market behavior, some trading algorithms combines market data with social media data (Liu [4], Sohangir et al. [5]). The social media information is extracted mainly from Google and Twitter along with popular investor idea exchange platforms such as Seeking Alpha (https://seekingalpha.com/Seekingalpha.com, accessed on 1 November 2021) and Investopedia (https://www.investopedia.com/, accessed on 1 November 2021). Kim et al. [6] tried to predict fluctuations in the prices of cryptocurrencies by analyzing comments in online communities. They found that positive comments significantly affected the price fluctuations of Bitcoin, whereas the prices of two other cryptocurrencies, Ripple (XRP) and Ethereum, were strongly influenced by negative comments. Garcia and Schweizer [7] also demonstrated the existence of a relationship between returns and Twitter valence and polarization. Matta et al. [8] reported significant cross correlation values between the volume of online searches and Bitcoin’s trading volume.
In contrast to stock markets, cryptocurrencies are less regulated and therefore carry extra risks (Baek and Elbeck [9]). In such a dynamic trading environment, algorithmic trading systems can provide fast and useful information (Chow et al. [10]; Liu et al. [11]; Cohen [12]; Cohen [13]). Balcilar et al. [14] found that when extreme events are excluded, volume is an important predictor of Bitcoin’s price. Brandvold et al. [15] investigated the role of various of cryptocurrency exchanges in the price discovery process and concluded that information sharing is dynamic and evolves significantly over time. Feng et al. [16] found evidence of informed trading in the Bitcoin market prior to major events. Moreover, they noticed that informed traders prefer to build their positions two days before large positive events and one day before large negative events. This result serves as proof of market inefficiency that differentiates uninformed traders from informed traders.
3. Data and Methodologies
Our data consisted of daily price and returns of the five most popular cryptocurrencies that are valued together at more than $1.5 trillion (at the end of August 2021). The time scope for this research varied from the beginning of January 2015 for Bitcoin and the beginning of May 2018 for Cardano until the end of September 2021. We programed a trading system that uses second order stochastic dominance (SSD) to predict short term price trends of the examined crypto currencies. SSD implies that if two separate distributions A and B exist, A has a second order stochastic dominance over B if A holds less risk in terms of particle variations and has at least as high mean value. Concerning the cumulative distribution functions and , a is second order stochastic dominant over B if the area under from minus infinity to x is less than or equal to the area under for all x (Equation (1)).
where t = particle at time t, of the stochastic distribution.
The necessary conditions for second order stochastic dominance are given in Equation (2):
The SSD requirements fit trading, since investors rely heavily on the financial asset distribution function when they make investment decisions, and in that process, they usually put more weight on the downside of the investment opportunity since they are guided by fear of loss and risk aversion. In a recent study, McCarthy and Hillenbrand [17] found that extrapolative beliefs and risk aversion are important drivers of stock prices, together explaining 86% of movements in the S&P500 index.
To allow a stronger impact of a new price information over an old one, we used Exponential Moving Average () instead of , as noted in Equation (3).
where = current exponential moving average, = today’s return, = yesterday’s exponential moving average return, N = number of days of the EMA, and .
We then integrated Equations (2) and (3) to produce long and short trading signals. A long signal is generated if the following conditions are met (Equation (4)):
A short signal is generated if the following conditions are met (Equation (5)):
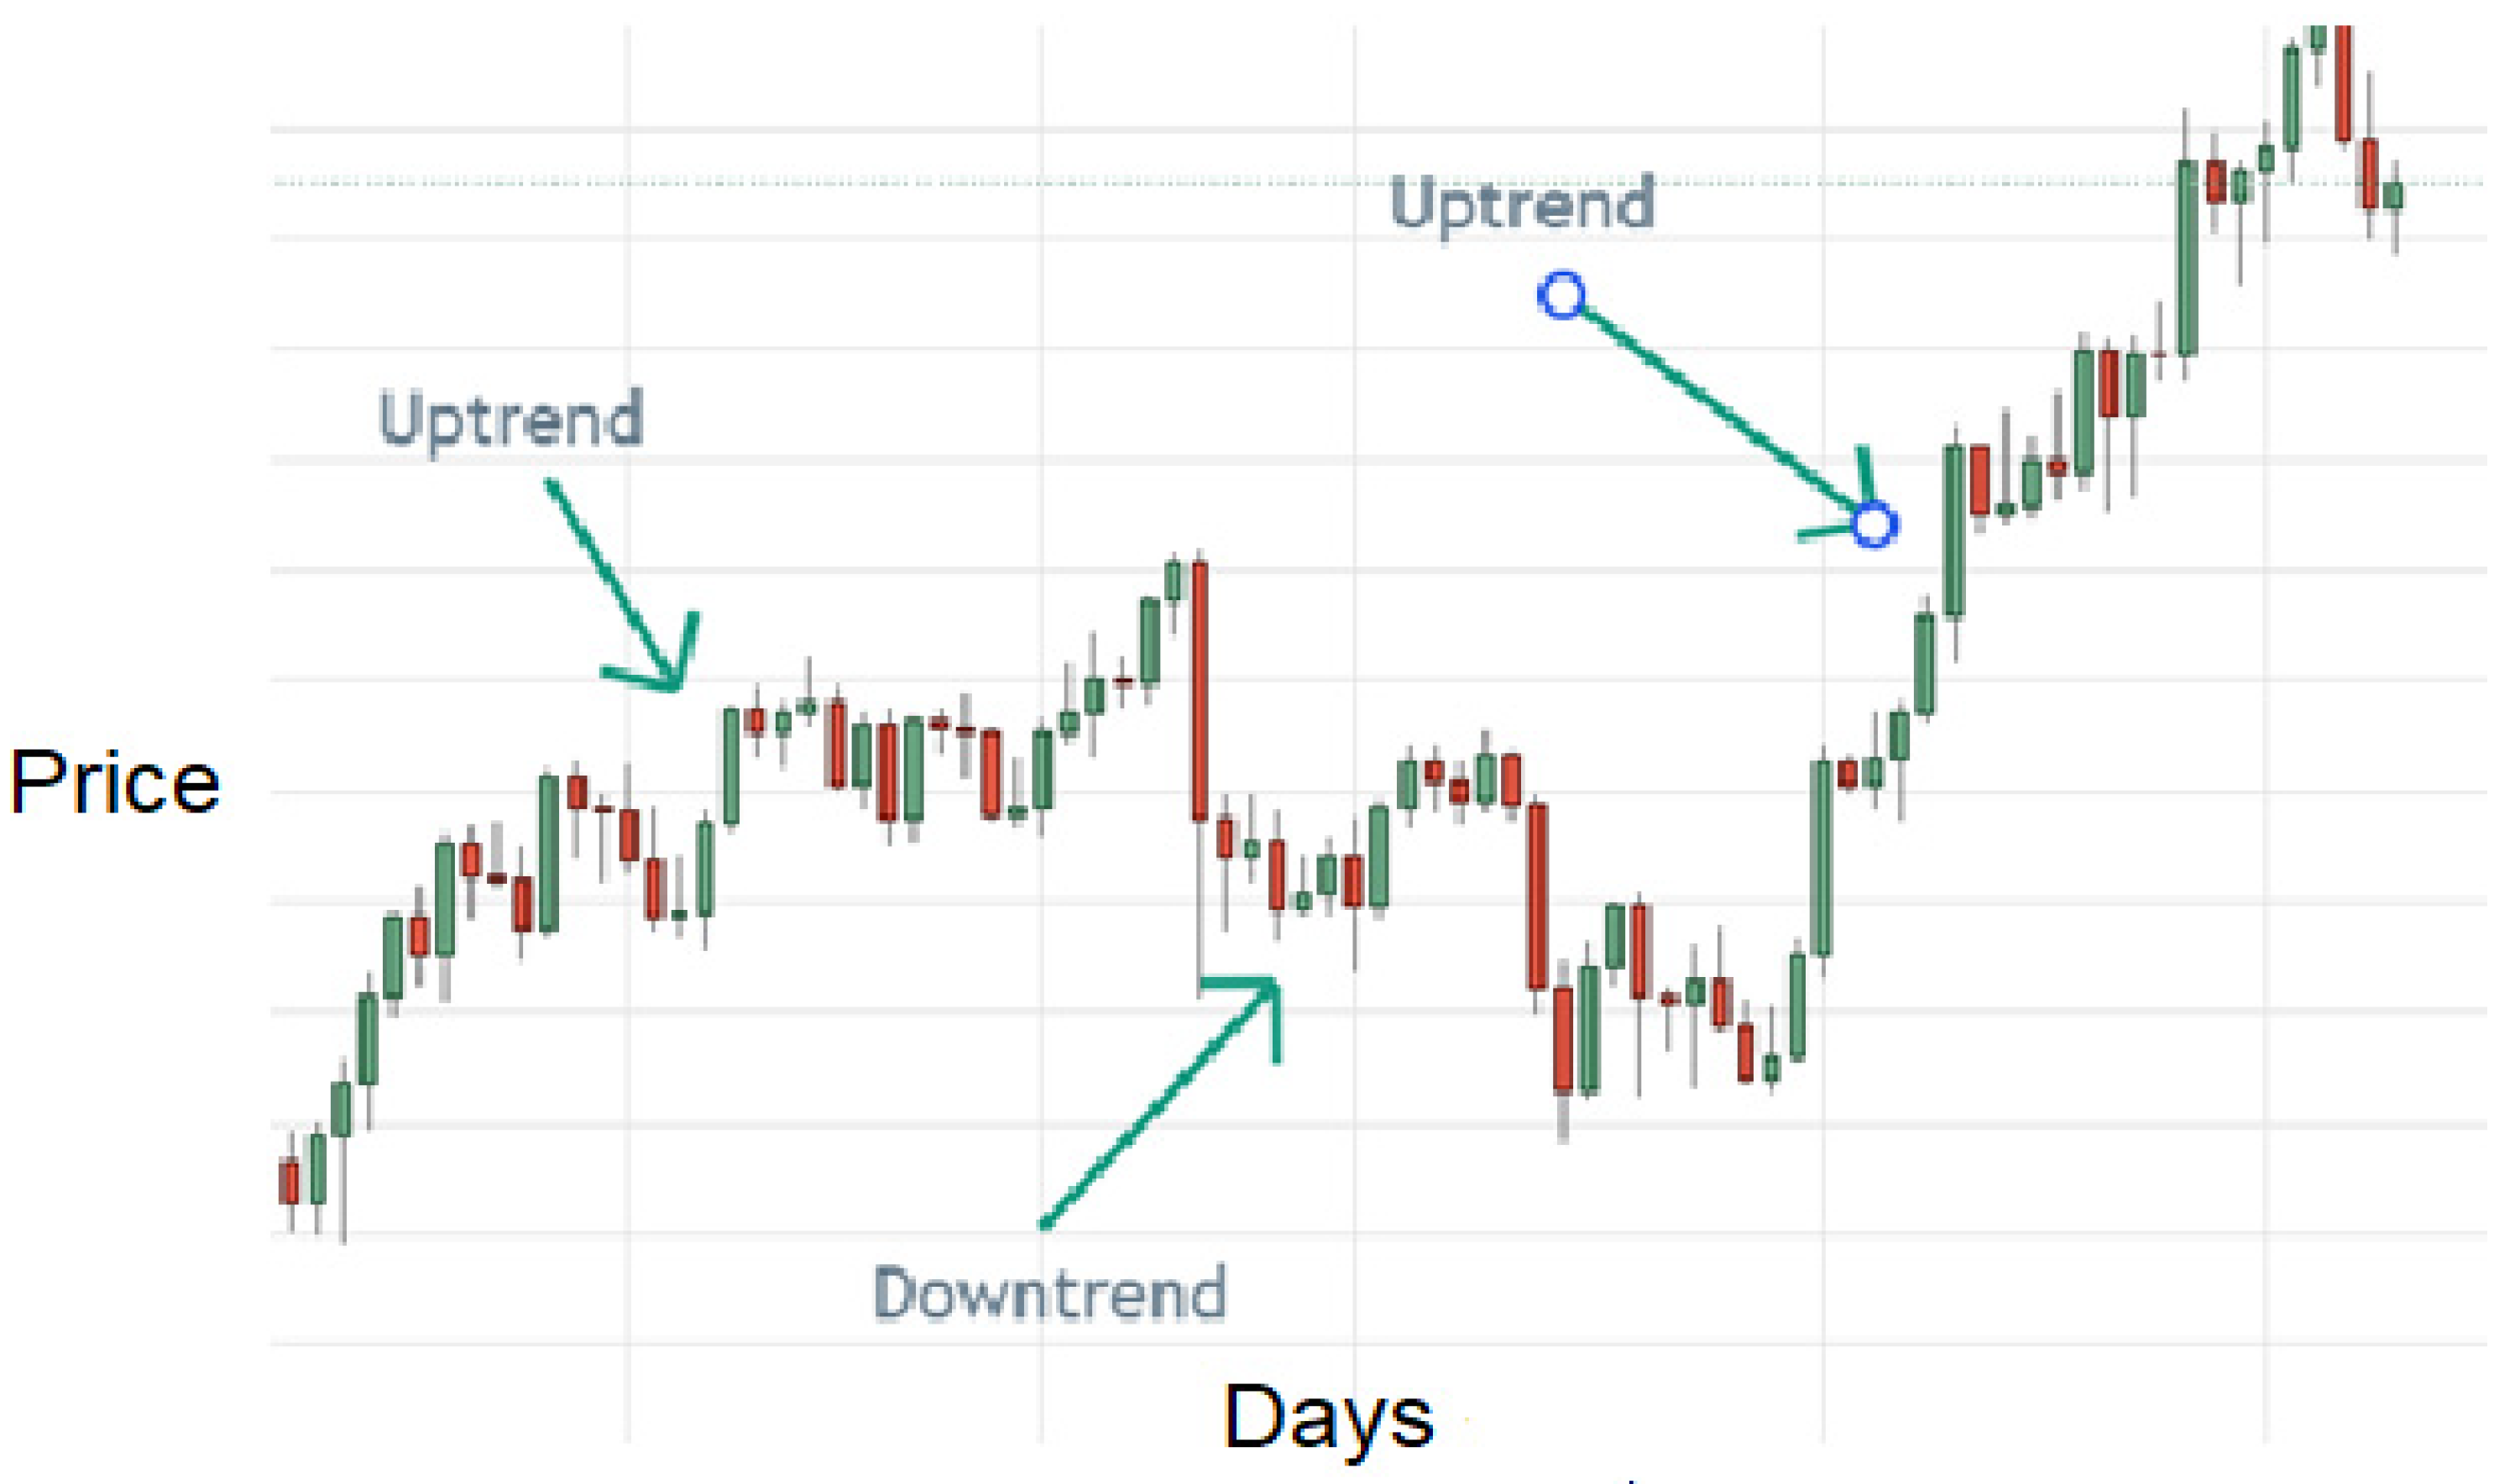
Figure 1 shows a bar chart of Bitcoin against the U.S. dollar, demonstrating that in an uptrend, the average daily return is growing along with a higher minimum daily return. On the other hand, a downtrend is characterized with lower average and lower minimum daily returns.
Each bar in Figure 1 contains information of the open, close, high, and low of the daily prices. A long red bar symbolizes a large daily price drop, and a long red bar symbolizes a major price rise. The system is designed to buy or sell one cryptocurrency at a time for easy comparison to the buy and hold (B&H) strategy. A specific number of days is entered into the system for it to calculate two consecutive EMAs and distributions and to establish whether the SSD condition of the current distribution over the latter exists. If such dominance is recognized, the system generates long or short trade. Once a position is realized, the system will stay in that position until an opposite dominance occurs. This trading system is highly sensitive to the range of days for which the SSD and EMAs are calculated. When it relies on a large number of days for those calculations, the number of executed trades drop dramatically, since it becomes difficult to recognize a continuous trend for every financial asset and especially for cryptocurrencies that are characterized with frequent trend shifts. Therefore, we altered the number of days systematically starting with one day until the number of recorded trades dropped to zero. We then reported the results of the best setups that produced the highest net profit (NP) generated by the trading system and the Profit Factor (PF), which is the gross profits divided by gross losses. For example, if the profit factor is 1.3, the system generated 30% more profits than losses. In order to document the downside risk, for each strategy, we calculated Maximum Draw Down (MDD), which is the maximum observed loss of a single trade without taking into consideration the frequency of large losses. Since the cryptocurrencies market varies dramatically over time because of its complexity and relatively infancy (see, for example, Fry and Cheah [18]; Fry [19]), we followed the changes of the average NP and MDD per trade over time for each cryptocurrency. Moreover, we also separated all trades to long and short trades to find out whether our system has different forecasting power for uptrends and downtrends.
4. Results
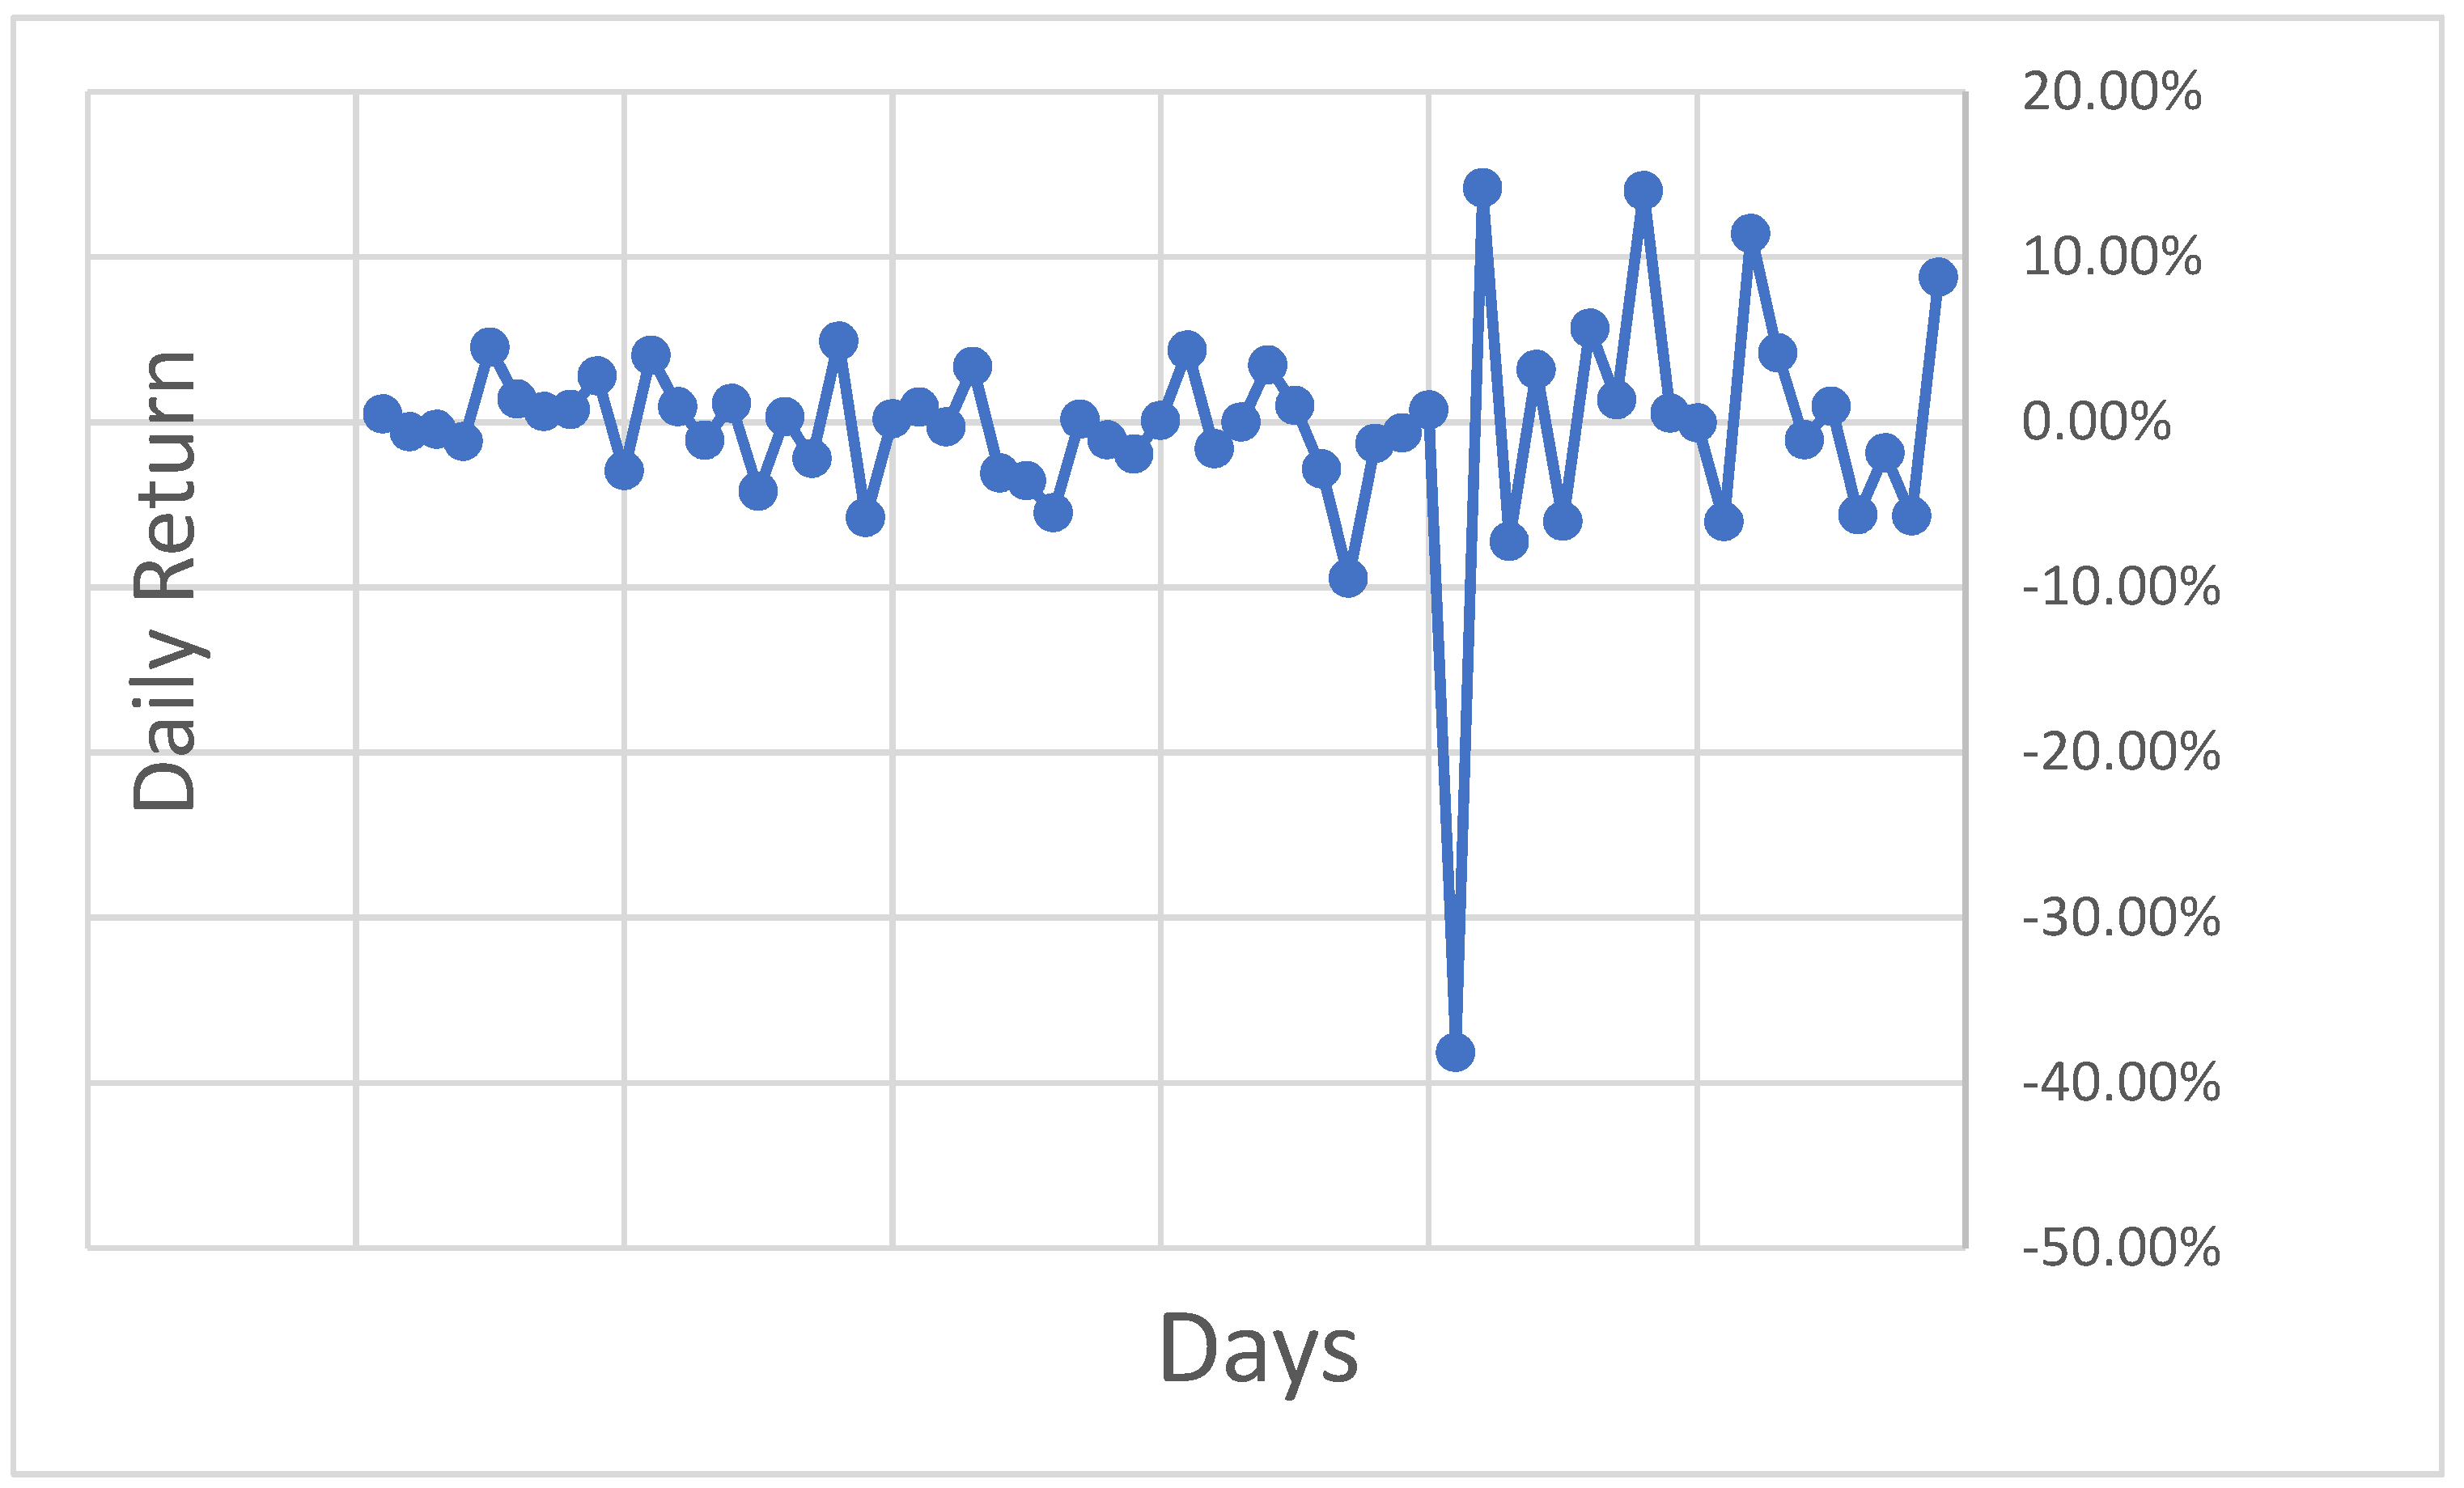
We start our results section by examining Figure 2, which represents Bitcoin price movement for a two-month random sample. Figure 2 show that the Bitcoin price oscillated at a reasonable scope before hitting a sharp movement because of a major outside shock, and then its volatility quadrupled in the next coming days.
The results of the SSD-based trading system of the five cryptocurrencies are summarized in Table 1, Table 2, Table 3, Table 4 and Table 5. The results reported in the tables are the best results our system achieved by altering the number of days until reaching the highest NP and PF. Each table also shows the dollar and percentage gap of the system’s NP versus the B&H strategy for the entire examined period. Moreover, the tables also contain information about long and short trades for each cryptocurrency.
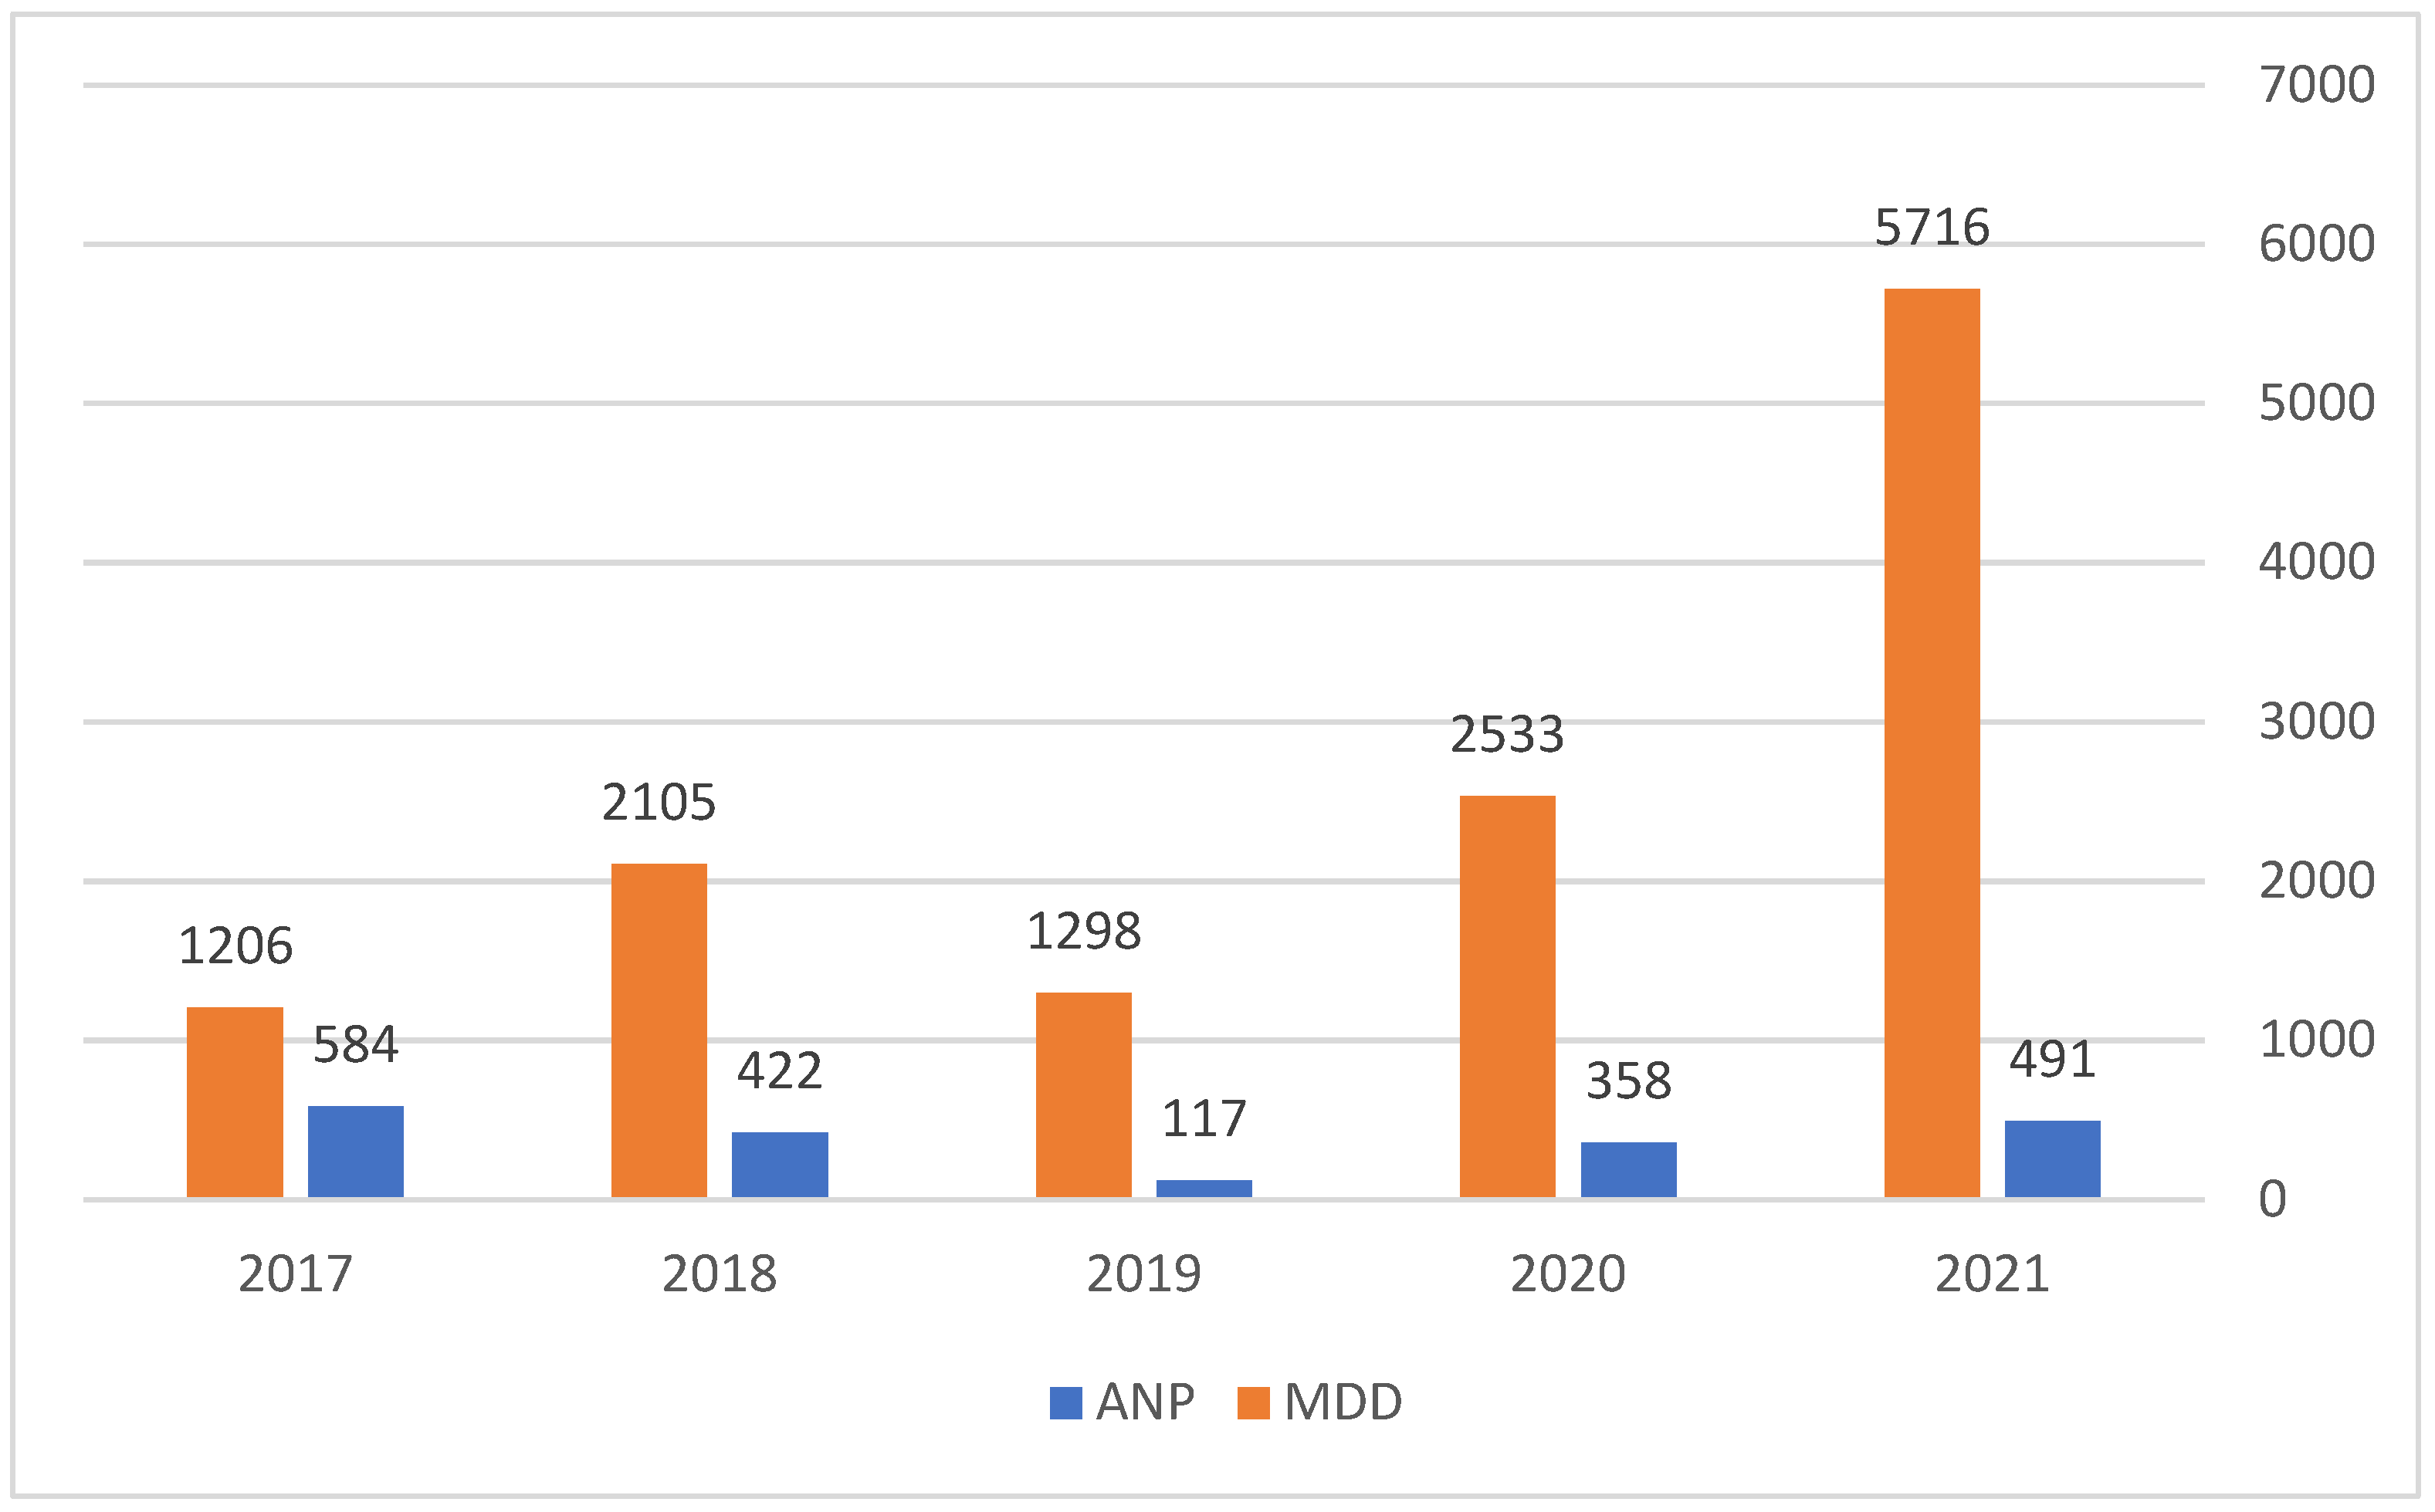
Table 1 demonstrates that the best setup for Bitcoin trading through our system is 13 days, producing 73,051 NP, which is 21% over the B&H strategy. The PF of this setup is 1.98, which means there are 98% more winning trades than loosing trades. The MDD calculations indicate that the trading strategy is least risky when it is based on 13 days. Table 1 also show that our SSD-based system better predicts Bitcoin’s uptrends than downtrends. We also find high dependency of the system performance on its daily selected setup. Figure 3 show that the average NP and MDD per trade varies over time using the best setup for Bitcoin.
Figure 3 shows that our system’s best performance was achieved in 2017, resulting in an ANP of $584, and the MDD was $1206. The year 2021 had the highest MDD for the system with $491 average NP per trade. Table 2 summarizes the results of our system for Ethereum trades.
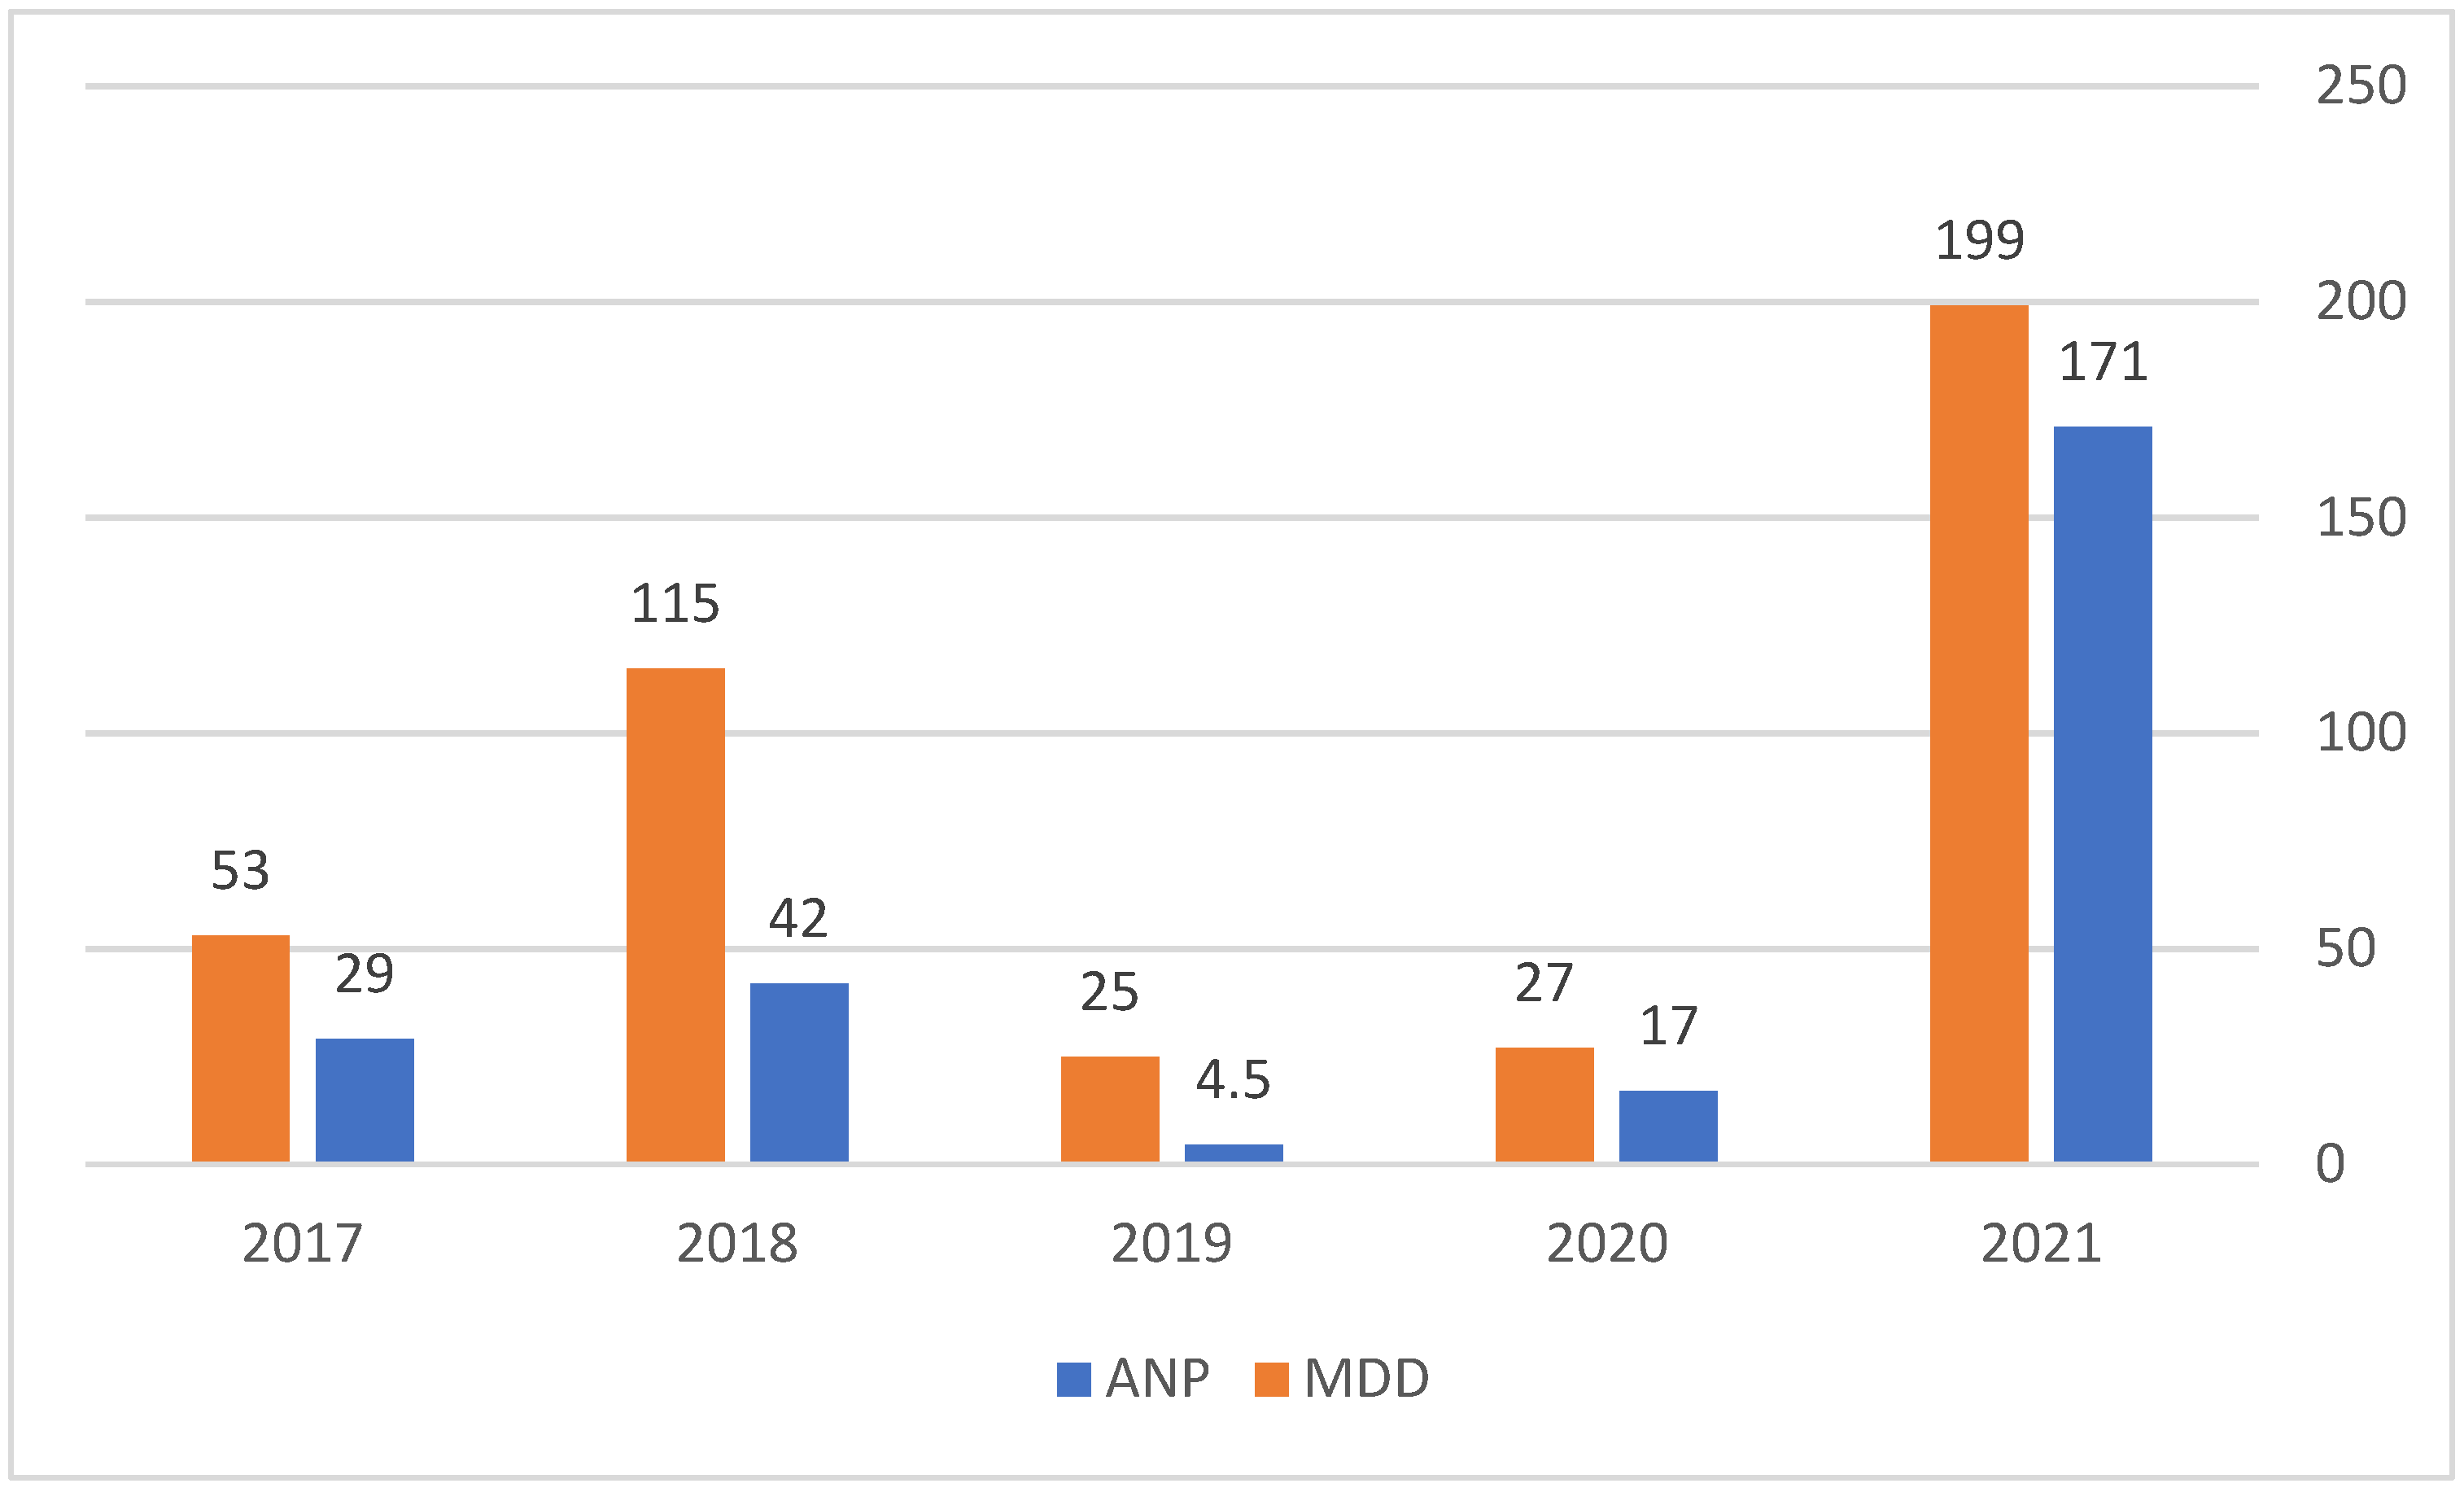
Table 2 demonstrates that Ethereum price trends changed slower than did Bitcoin’s. The best trend prediction was achieved using a 24 day setup for Ethereum compared to 13 days for Bitcoin. Using a 24 day setup, our system produced 4741 NP, which is 26.7% more than the B&H strategy and $199 MDD. The PF at this setup is 2.54, which represents 154% more winning trades than loosing trades. Moreover, our system results are more robust for Ethereum trades than for Bitcoin trades. Again, as for Bitcoin, the system predicts better Ethereum long trends than short trends. Figure 4 demonstrates the average NP and MDD per trade varies over time using the best setup for Ethereum.
Figure 4 shows that the highest ANP and MDD per trade were achieved in 2021. These results reflect the large appreciation in the Ethereum price during 2021 and the ability of our system to detect uptrends. Table 3 summarizes the results of our system for XRP trades.
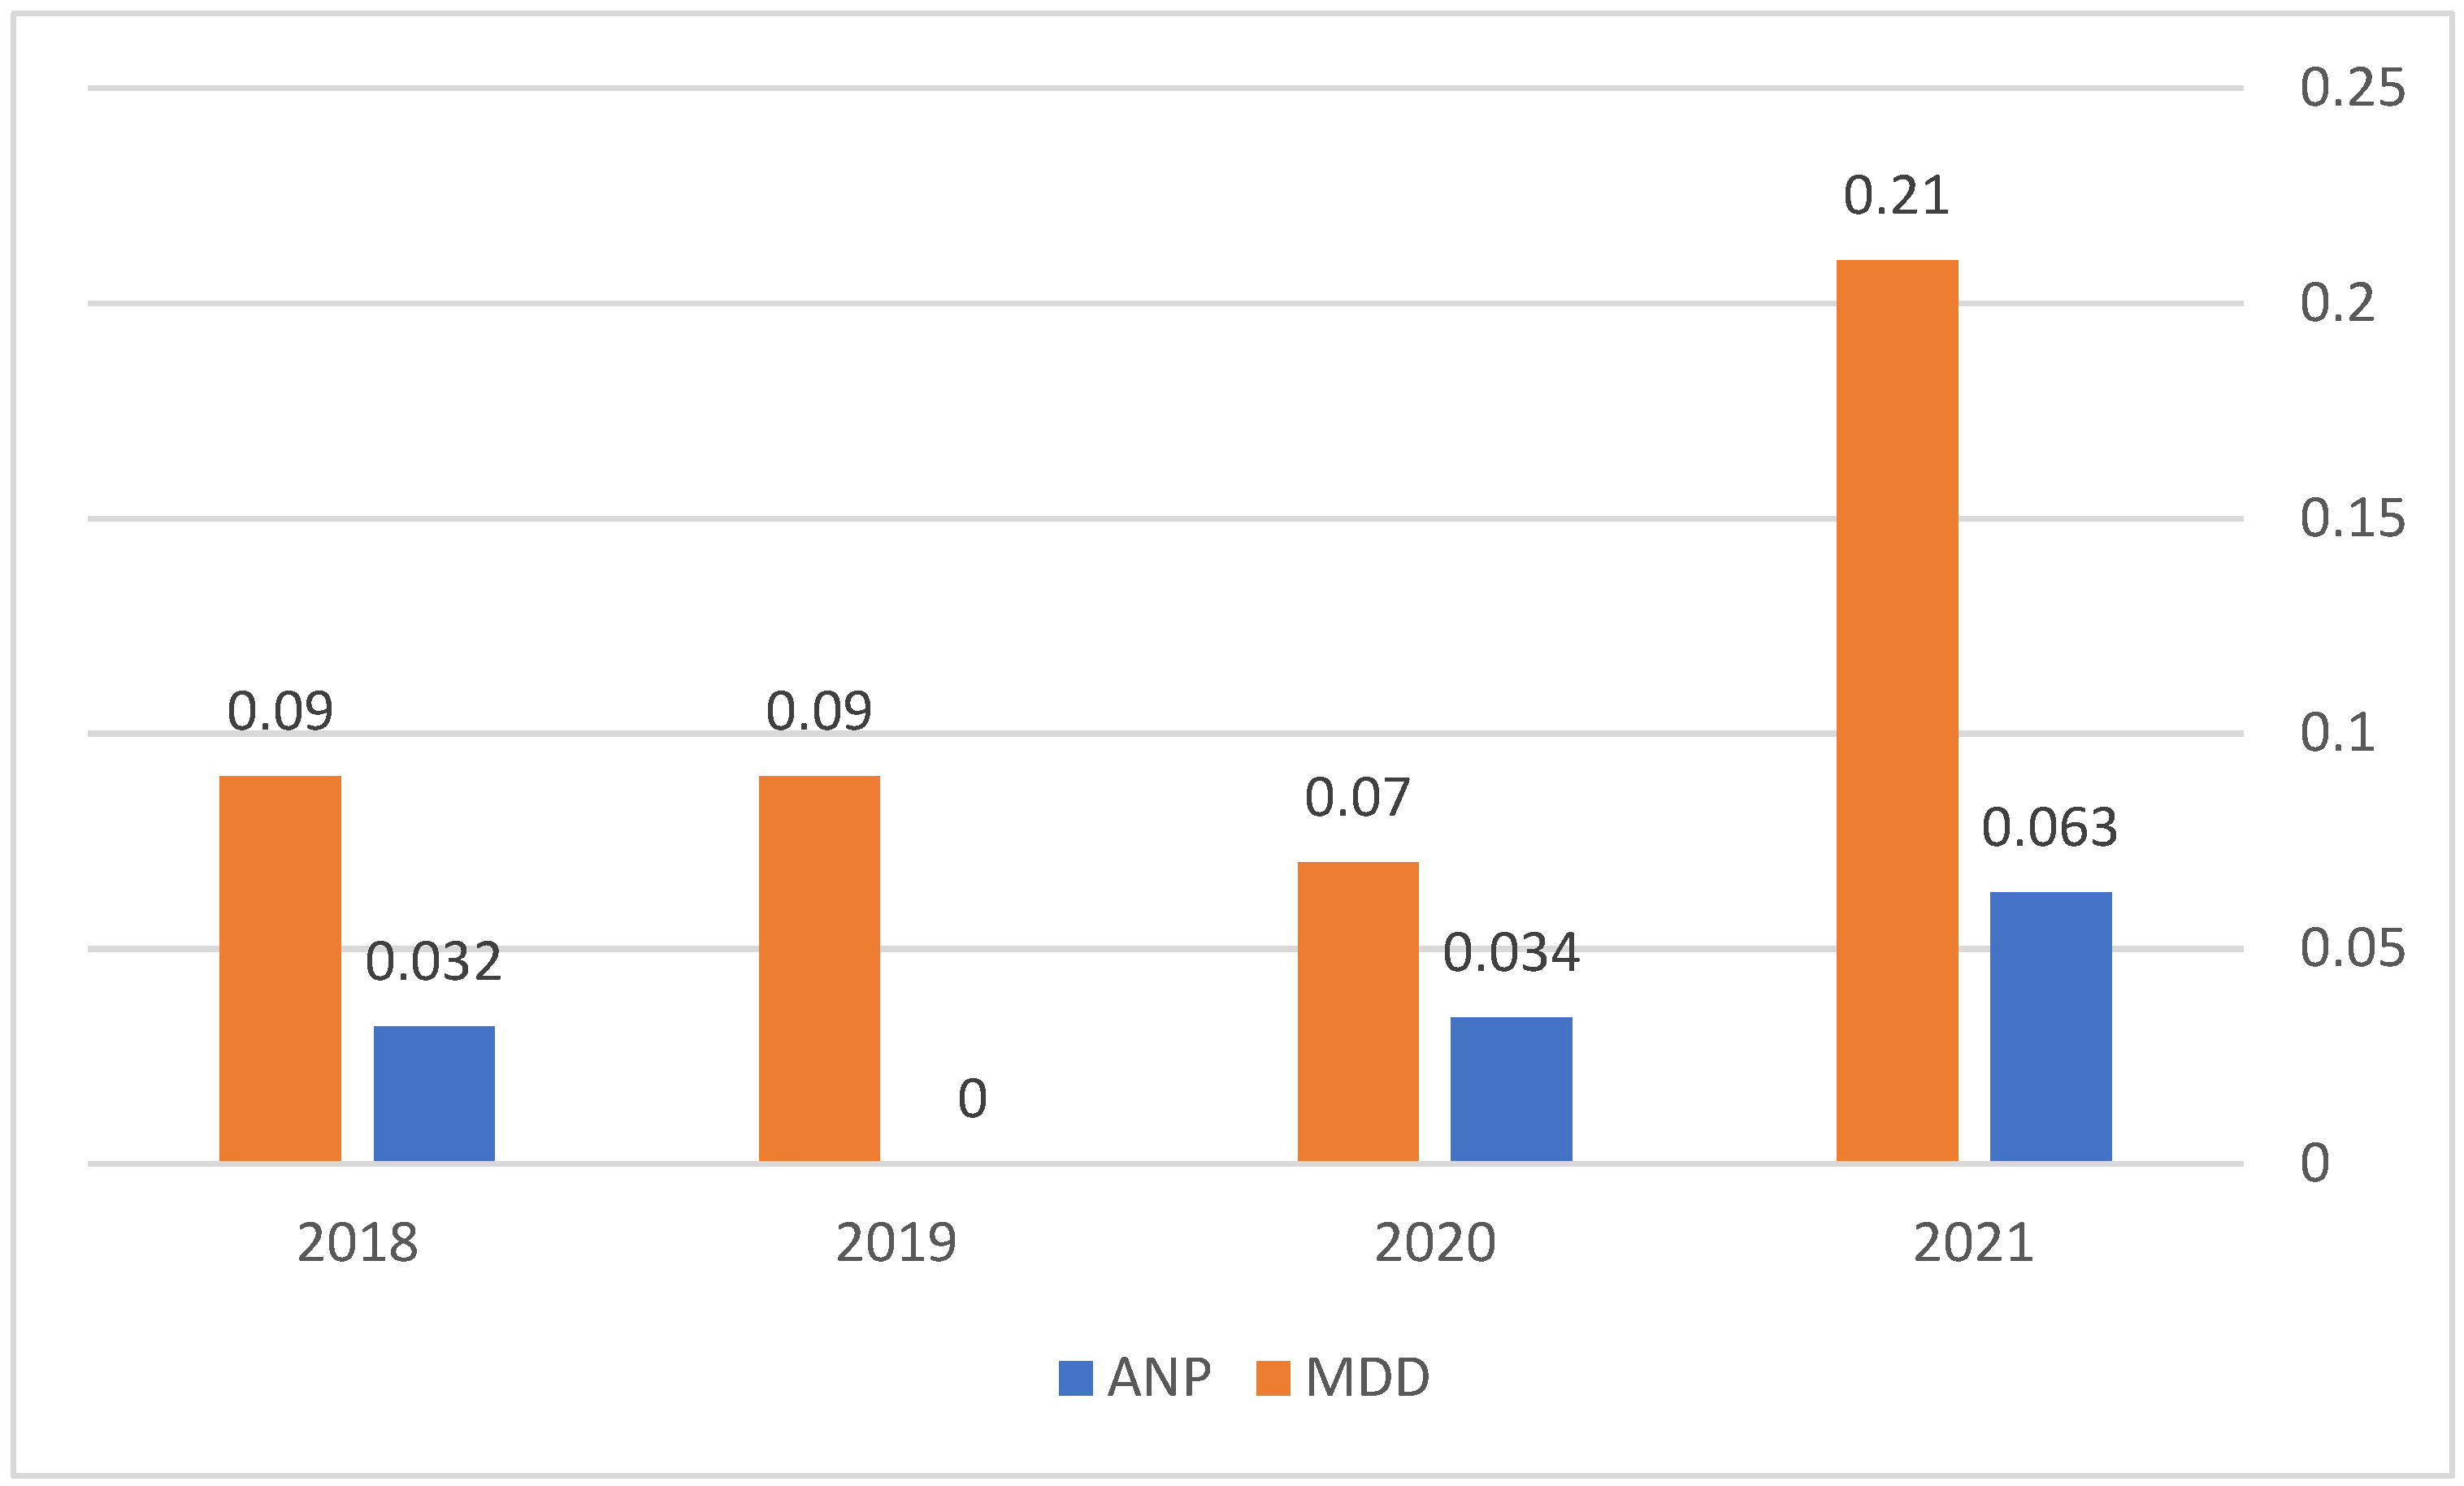
Table 3 shows that our system outperformed the B&H strategy by 502% ($2) with $0.21 MDD, for the 13 days setup, making the system a better fit for XRP trends prediction than for Bitcoin or Ethereum. The system is robust for 12 to 17 day setups, resulting in 1.57 average PF. As for the Bitcoin and Ethereum, the XRP system better predicts long trends than short trends. Figure 5 shows the average NP and MDD per trade varies over time using the best setup for XRP.
Figure 5 shows that as the price of the XRP appreciated in the market, our system better generated profits and was subjected to higher risks (ANP of 0.063 and MDD of 0.21). Table 4 summarizes the results of our system for Binance Coin trades.
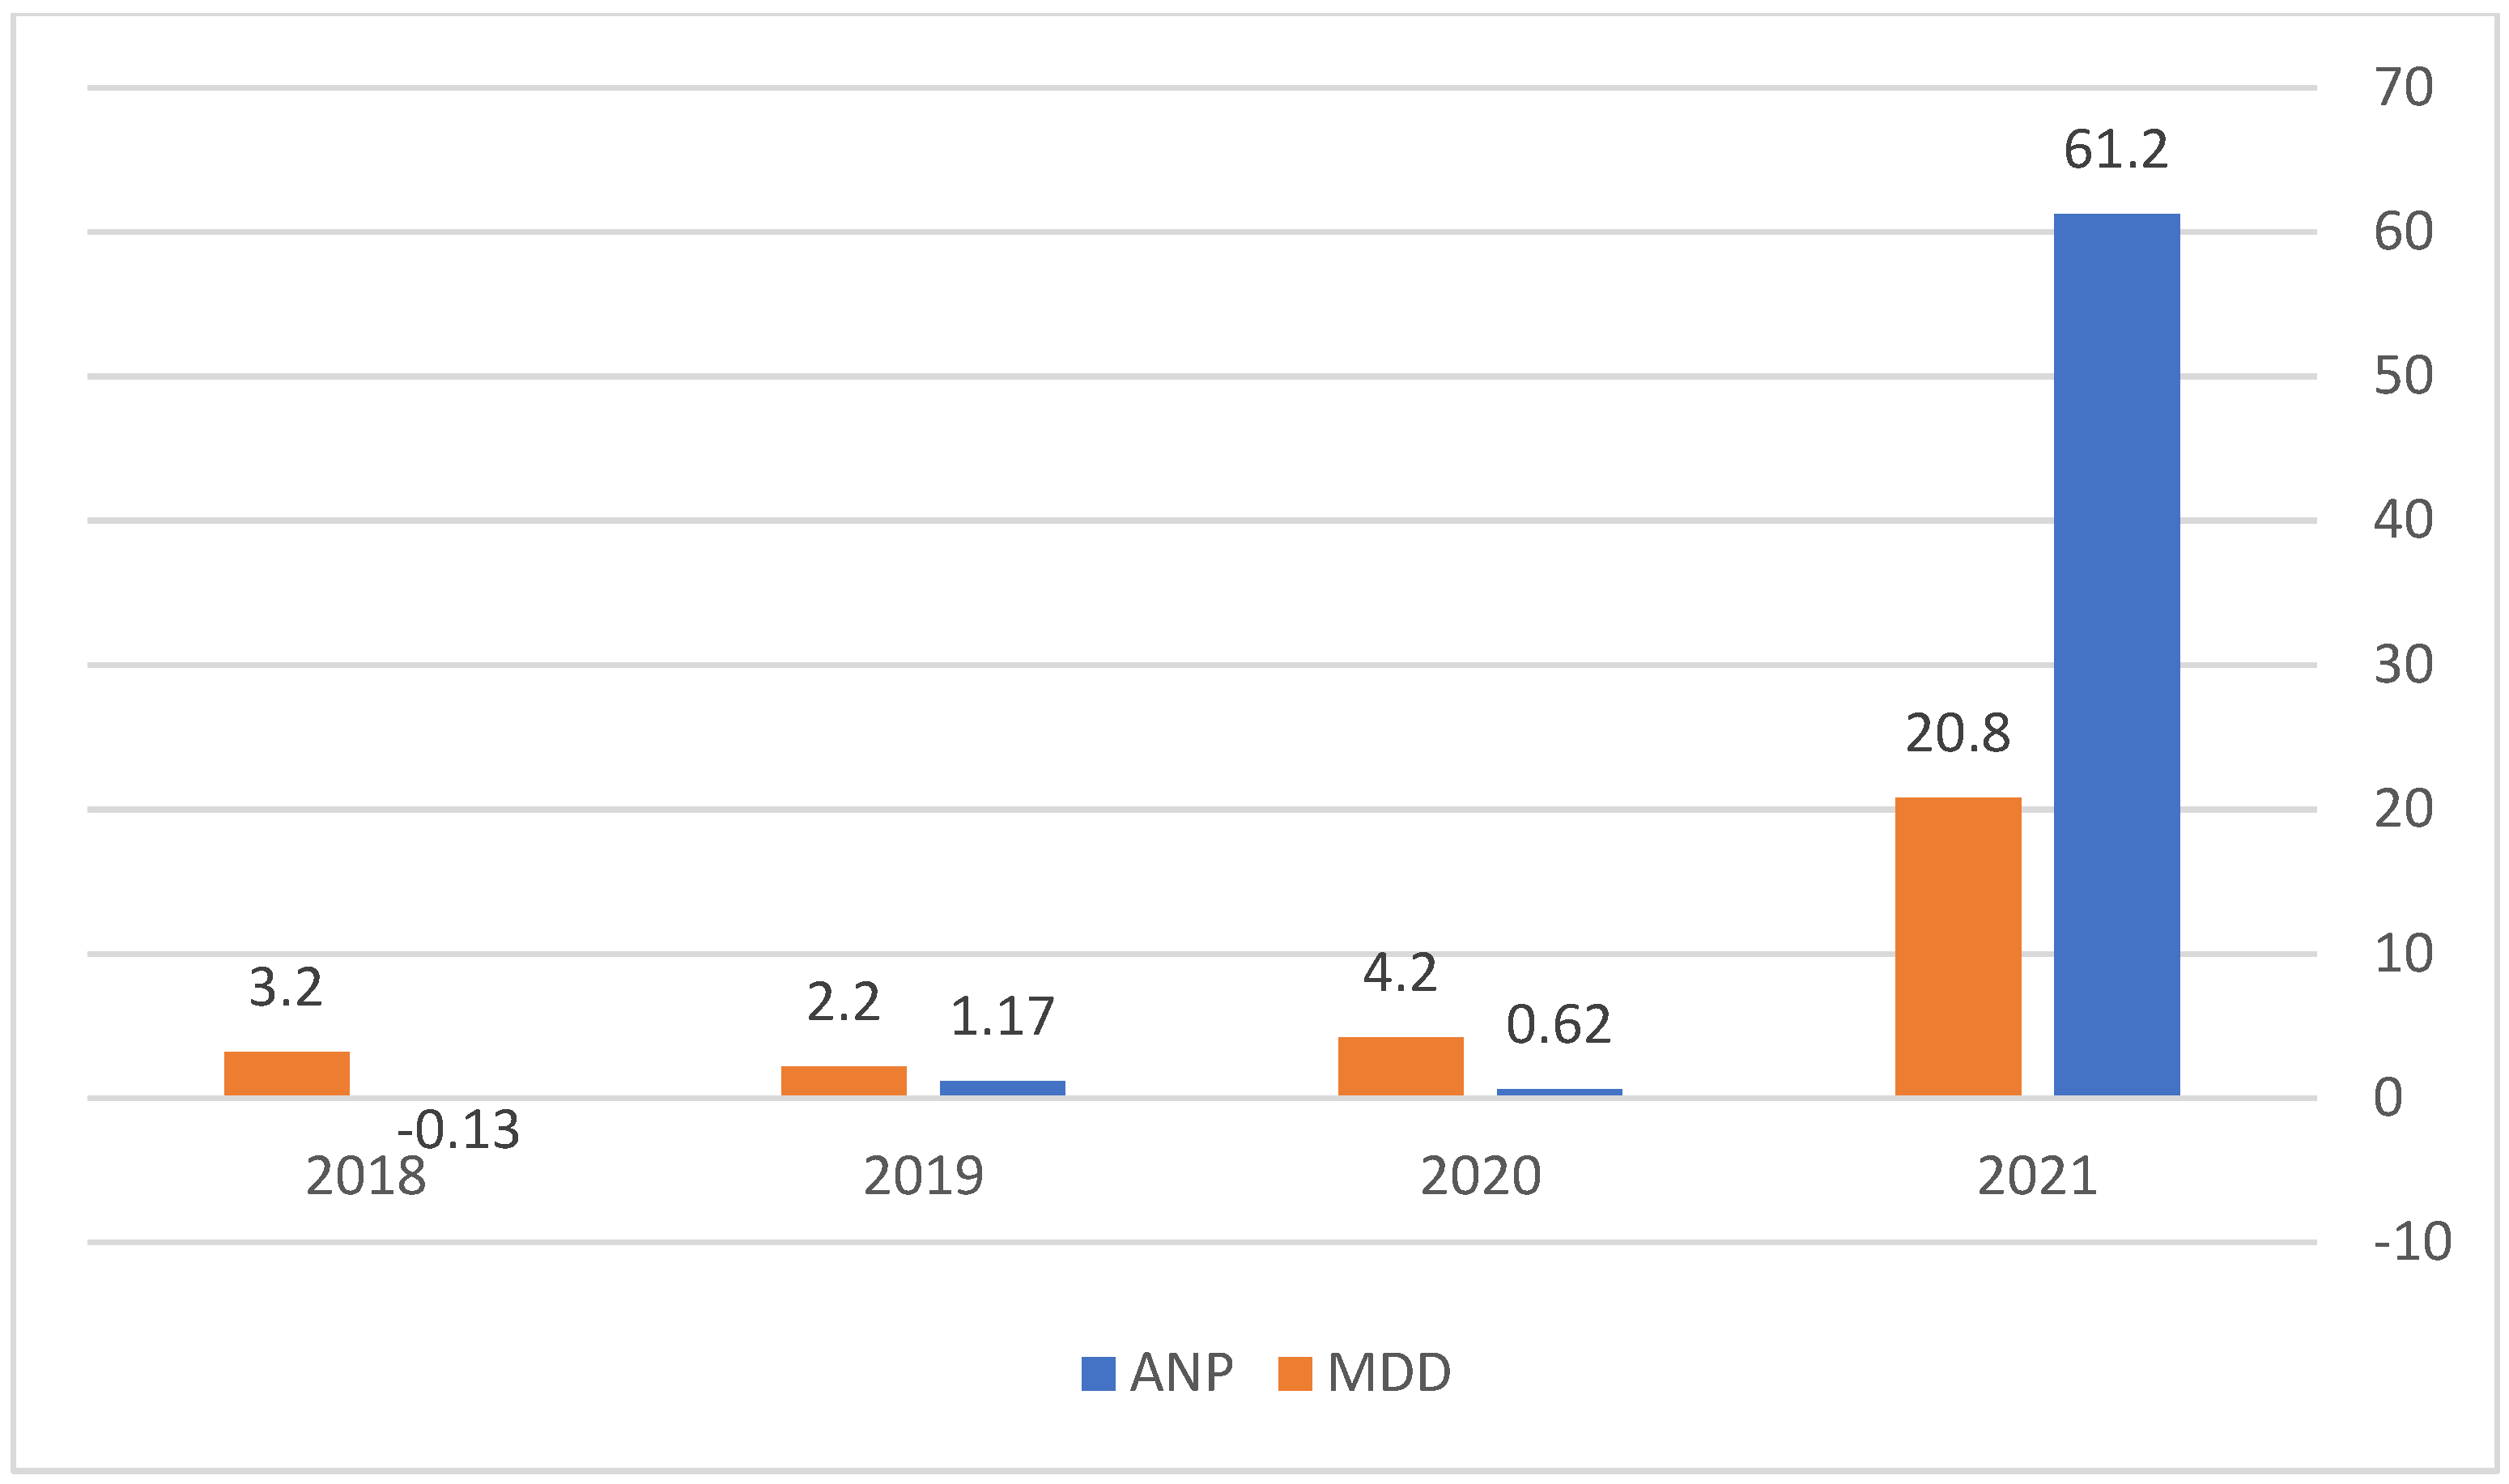
Table 4 shows that the SSD system fits to trade Binance Coin. The best setup was 26 days, resulting in $826 NP, which represents a 74.7% return over the B&H strategy and $20.8 MDD. Setups from 23 to 28 days produced better results than the B&H strategy by more than 50%. The system performances are excellent for long trades (PF = 10.55 for the 26 day setup) and good for short trades (PF = 2.06 for the 26 day setup). Figure 6 show that the average NP and MDD per trade varies over time using the best setup for XRP.
Figure 6 show that the main profits were accumulated by our system in 2021. From January 2021 till the end of September 2021, the Binance Coin rose from $42 to $387.5 (822%). The MDD also rose dramatically in 2021, indicating the higher risk involved in trading the Binance Coin using our system. Table 5 summarizes the results of our system for Cardano trades.
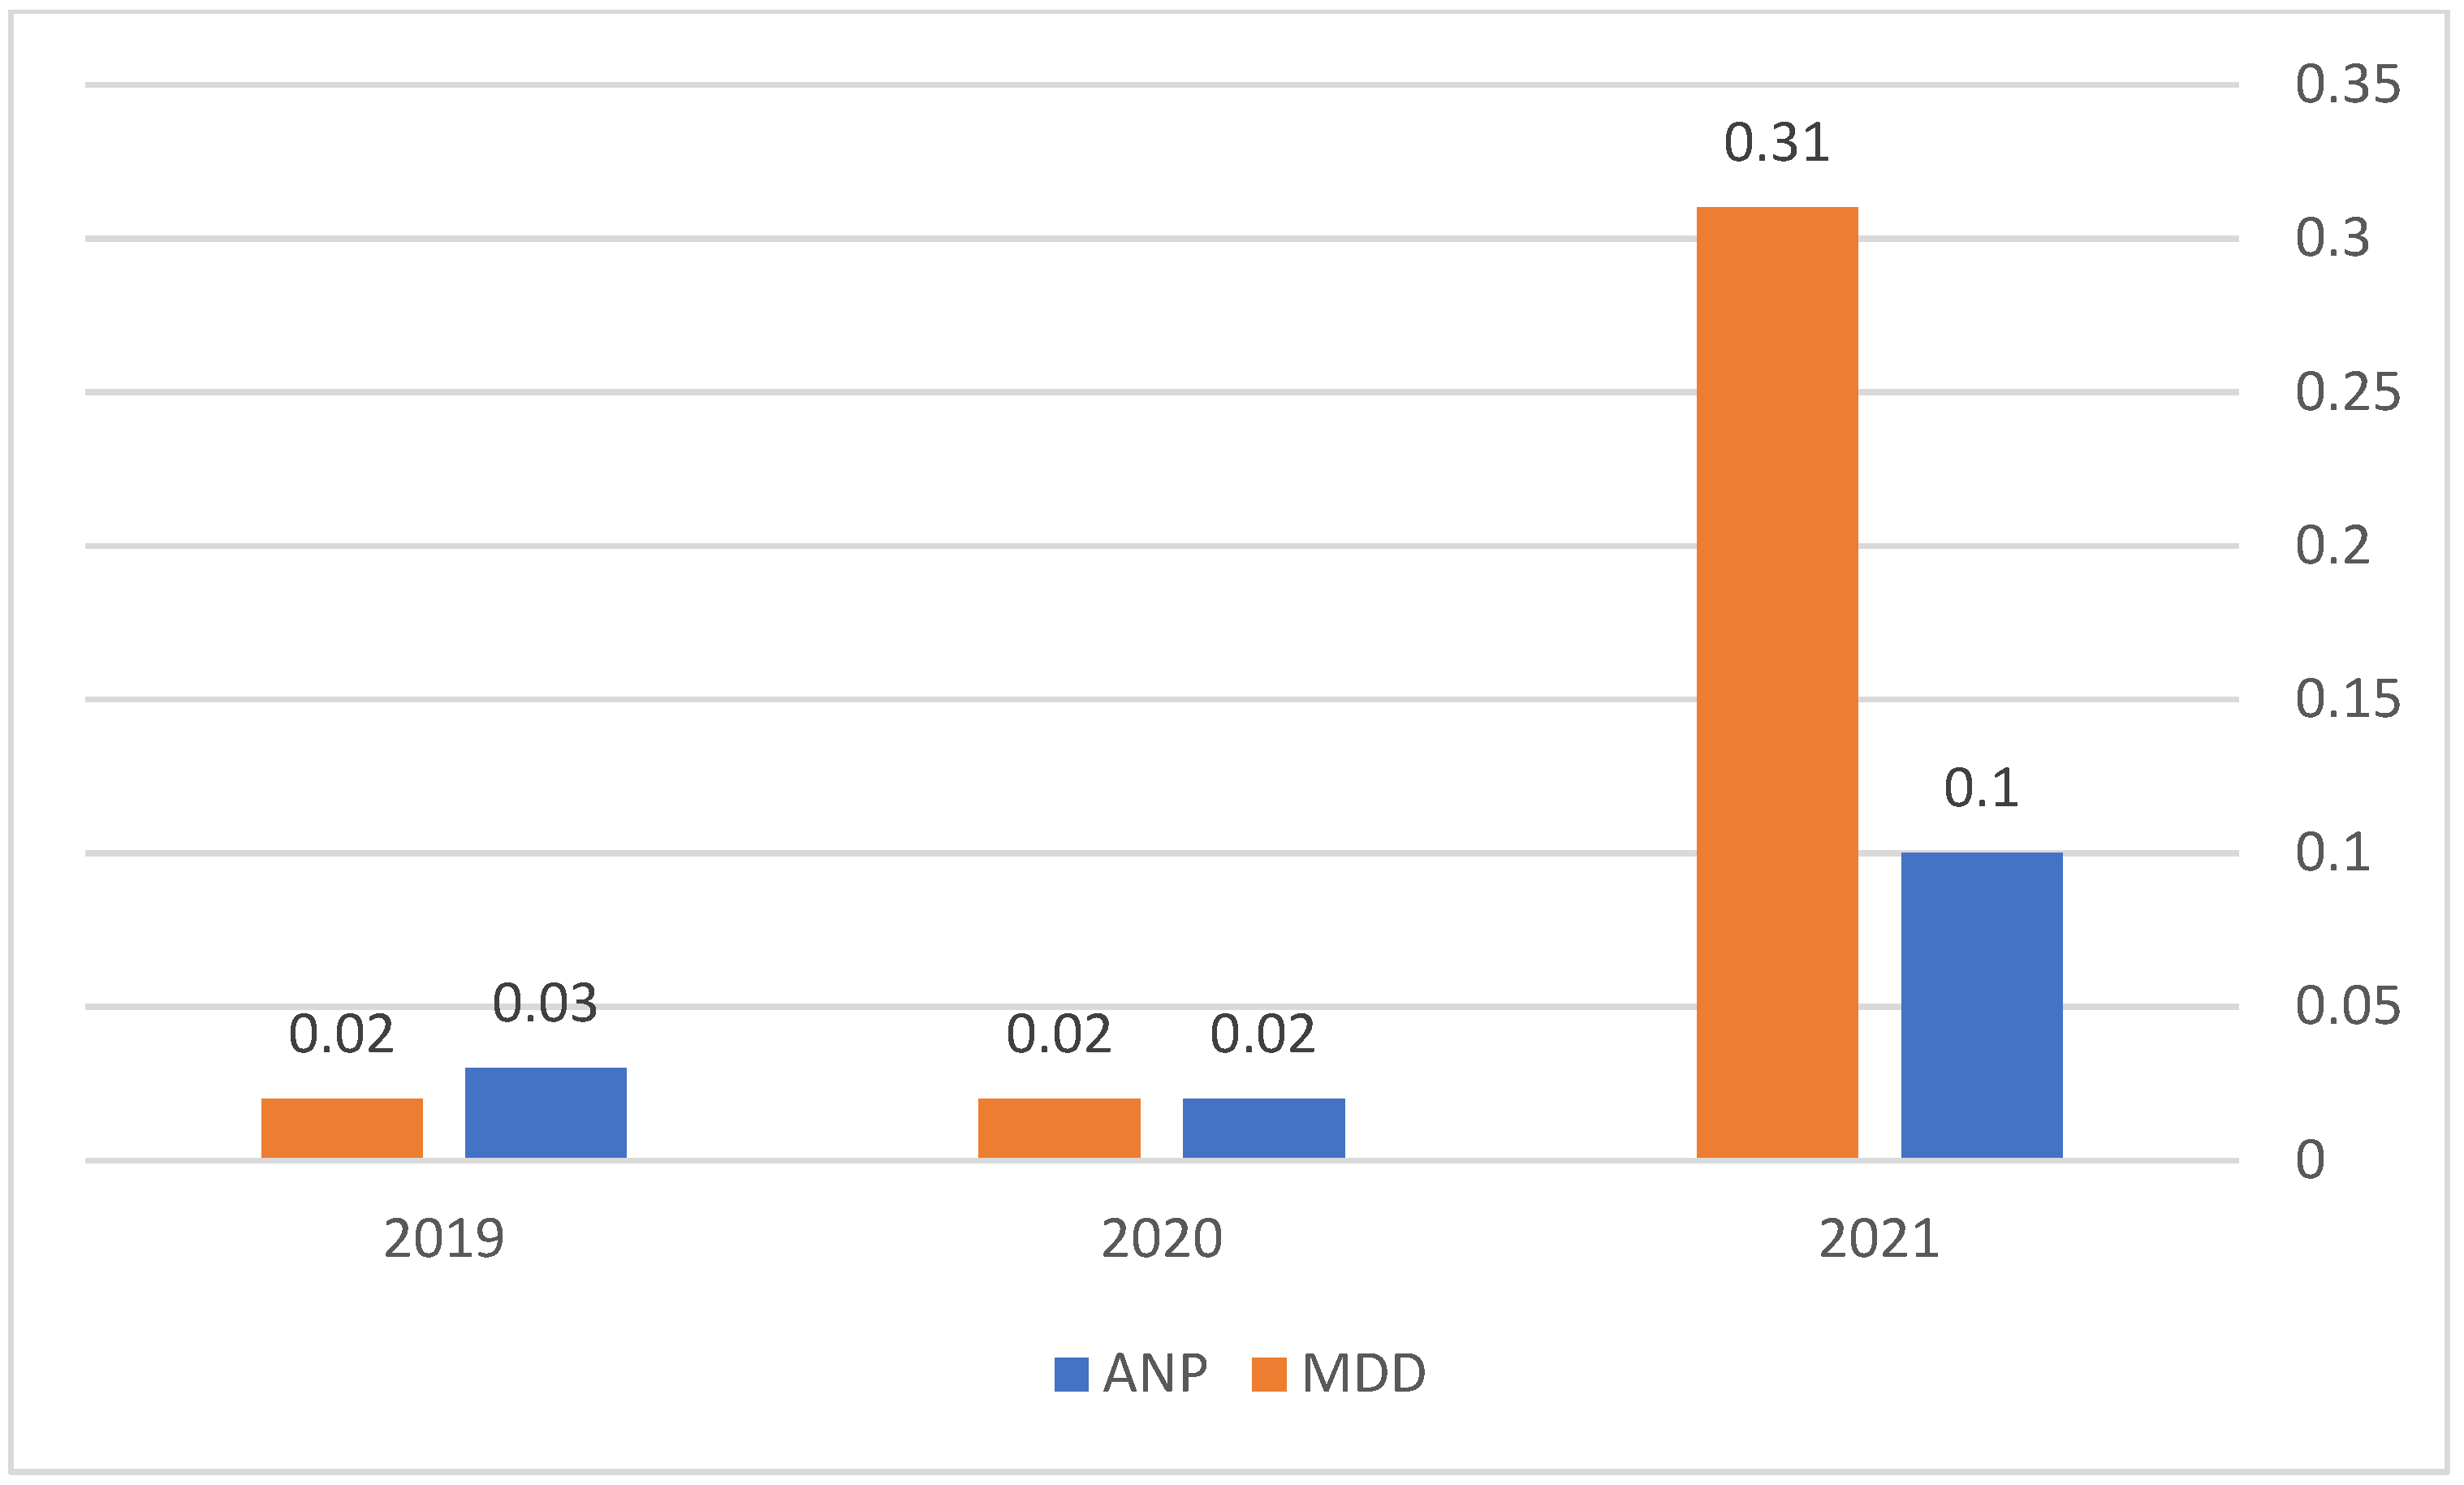
Table 5 shows that the system’s best performance was achieved using a much longer period than the other examined cryptocurrencies and with worse results. The best result was achieved using a 53 day setup, which was $1.76 NP and which was beaten by the B&H strategy by 4.8% and $0.31 MDD. Although the system generated positive NP for long trades, it generated net losses for all short trades. Figure 7 demonstrates that the average NP and MDD per trade varies over time using the best setup for Cardano.
Figure 7 show that in 2021, our system’s performance and risk rose dramatically in comparison to 2019 and 2020. The ANP was $0.1 compared to $0.03 and $0.02 in 2019 and 2020, respectively. The MDD also rose to $0.31, signaling that the risk involved in trading rose dramatically.
5. Conclusions and Future Research
This research is the first attempt to design and test cryptocurrency trading systems based on second order stochastic dominance. The time scope used in this research varies from the beginning of January 2015 for Bitcoin and the beginning of May 2018 for Cardano until the end of September 2021. Results show that our system can predict price trends of cryptocurrencies and in most cases outperform the B&H simple strategy. Our system’s best performance was achieved trading XRP, Binance Coin, Ethereum, and Bitcoin. Although our system also generated a positive NP for Cardano, it failed to outperform the simple B&H strategy. For all currencies the system better predicts long trends than short trends. The best short trends predicted were achieved trading XRP and the worst trading Cardano. Future research can try to predict cryptocurrency prices using stochastic behaviors and try to predict intraday price movements using those behaviors.
Funding
This research was funded by West Galilee College.
Data Availability Statement
Upon request.
Conflicts of Interest
The author declares no conflict of interest.
References
- Vidal-Tomás, D.; Ibáñez, A.M.; Farinós, J.E. Herding in the cryptocurrency market: CSSD and CSAD approaches. Financ. Res. Lett. 2019, 30, 181–186. [Google Scholar] [CrossRef]
- Gama Silva, P.V.J.; Klotzle, M.C.; Pinto, A.C.F.; Gomes, L.L. Herding behavior and contagion in the cryptocurrency markets. J. Behav. Exp. Financ. 2019, 22, 41–50. [Google Scholar] [CrossRef]
- Ortu, M.; Uras, N.; Conversano, C.; Destefanis, G.; Bartolucci, S. On Technical trading and social media indicators in cryptocurrencies’ price classification through deep learning. arXiv 2021, arXiv:2102.08189. [Google Scholar]
- Liu, X. Target and position article—Analyzing the impact of user-generated content on B2B Firms’ stock performance: Big data analysis with machine learning methods. Ind. Mark. Manag. 2020, 86, 30–39. [Google Scholar] [CrossRef]
- Sohangir, S.; Wang, D.; Pomeranets, A.; Khoshgoftaar, T.M. Big data: Deep learning for financial sentiment analysis. J. Big Data 2018, 5, 3. [Google Scholar] [CrossRef] [Green Version]
- Kim, Y.B.; Kim, J.G.; Kim, W.; Im, J.H.; Kim, T.H.; Kang, S.J.; Kim, C.H. Predicting fluctuations in cryptocurrency transactions based on user comments and replies. PLoS ONE 2016, 11, 8. [Google Scholar] [CrossRef] [PubMed] [Green Version]
- Garcia, D.; Schweizer, F. Social signals and algorithmic trading of bitcoin. Rev. Sociol. Open Sci. 2015, 2, 9. [Google Scholar] [CrossRef] [PubMed] [Green Version]
- Matta, M.; Lunesu, L.; Marchesi, M. The Predictor Impact of Web Search Media on Bitcoin Trading Volumes. In Proceedings of the 7th International Joint Conference on Knowledge Discovery, Knowledge Engineering and Knowledge Management, Lisbon, Portugal, 12–14 November 2015. [Google Scholar]
- Baek, C.; Elbeck, M. Bitcoin as an investment or speculative vehicle? A first look. Appl. Econ. Lett. 2014, 22, 30–34. [Google Scholar] [CrossRef]
- Chow, Y.S.; Robbins, H.; Siegmund, D. Great Expectations: The Theory of Optimal Stopping; Houghton Mifflin: Boston, MA, USA, 1971. [Google Scholar]
- Liu, Y.; Yang, A.; Zhang, J.; Jingjing, Y. An optimal stopping problem of detecting entry points for trading modeled by geometric Brownian motion. Comput. Econ. 2020, 55, 827–843. [Google Scholar] [CrossRef]
- Cohen, G. Forecasting bitcoin trends using algorithmic learning systems. Entropy 2020, 8, 838. [Google Scholar] [CrossRef] [PubMed]
- Cohen, G. Optimizing candlesticks patterns for bitcoin’s trading systems. Rev. Quant. Financ. Account. 2021, 57, 1155–1167. [Google Scholar] [CrossRef]
- Balcilar, M.; Bouri, E.; Gupta, R.; Roubaud, D. Can volume predict Bitcoin returns and volatility? A quantiles-based approach. Econ. Model. 2017, 64, 74–81. [Google Scholar] [CrossRef] [Green Version]
- Brandvold, M.; Molner, P.; Vagstad, K.; Valstad, O.C.A. Price discovery on Bitcoin exchanges. J. Int. Financ. Mark. Inst. Money 2015, 36, 18–35. [Google Scholar] [CrossRef]
- Feng, W.; Wang, Y.; Zang, Z. Informed trading in the Bitcoin market. Financ. Res. Lett. 2018, 26, 63–70. [Google Scholar] [CrossRef]
- McCarthy, O.; Hillenbrand, S. Heterogeneous Investors and Stock Market Fluctuations. SSRN. Available online: https://papers.ssrn.com/sol3/papers.cfm?abstract_id=3944887 (accessed on 1 November 2021).
- Fry, J.; Cheah, E.T. Negative bubbles and shocks in cryptocurrency markets. Int. Rev. Financ. Anal. 2016, 47, 343–352. [Google Scholar] [CrossRef] [Green Version]
- Fry, J. Booms, busts and heavy tails: The story of Bitcoin and cryptocurrency markets? Econ. Lett. 2018, 171, 225–229. [Google Scholar] [CrossRef] [Green Version]
Figure 1.
Uptrends and a downtrend of Bitcoin’s daily price.

Figure 2.
Two months of Bitcoin daily price oscillation.

Figure 3.
Bitcoin average NP and MDD per trade for 2017–2021. Note: ANP = average trade net profit, MDD = maximum loss per trade. The data for 2021 is until the end of September 2021.
Figure 3.
Bitcoin average NP and MDD per trade for 2017–2021. Note: ANP = average trade net profit, MDD = maximum loss per trade. The data for 2021 is until the end of September 2021.

Figure 4.
Ethereum average NP and MDD per trade for 2017–2021. Note: ANP = average trade net profit, MDD = maximum loss per trade. The data for 2021 is until the end of September 2021.
Figure 4.
Ethereum average NP and MDD per trade for 2017–2021. Note: ANP = average trade net profit, MDD = maximum loss per trade. The data for 2021 is until the end of September 2021.

Figure 5.
XRP average NP and MDD per trade for 2018–2021. Note: ANP = average trade net profit, MDD = maximum loss per trade. The data for 2021 is until the end of September 2021.
Figure 5.
XRP average NP and MDD per trade for 2018–2021. Note: ANP = average trade net profit, MDD = maximum loss per trade. The data for 2021 is until the end of September 2021.

Figure 6.
Binance Coin average NP and MDD per trade for 2018–2021. Note: ANP = average trade net profit, MDD = maximum loss per trade. The data for 2021 is until the end of September 2021.
Figure 6.
Binance Coin average NP and MDD per trade for 2018–2021. Note: ANP = average trade net profit, MDD = maximum loss per trade. The data for 2021 is until the end of September 2021.

Figure 7.
Cardano average NP and MDD per trade for 2019–2021. Note: ANP = average trade net profit, MDD = maximum loss per trade. The data for 2021 is until the end of September 2021.
Figure 7.
Cardano average NP and MDD per trade for 2019–2021. Note: ANP = average trade net profit, MDD = maximum loss per trade. The data for 2021 is until the end of September 2021.


Table 1.
Results for Bitcoin trades.
| Days | 10 | 11 | 12 | 13 | 14 | 15 | |
|---|---|---|---|---|---|---|---|
| B&H$ | 60,361 | 60,361 | 60,361 | 60,361 | 60,361 | 60,361 | |
| All Trades | NP | 52,121 | 56,436 | 71,825 | 73,051 | 62,445 | 50,040 |
| PF | 1.56 | 1.65 | 1.93 | 1.98 | 1.78 | 1.64 | |
| MDD | 11,424 | 7515 | 5952 | 5716 | 6751 | 10,425 | |
| $ Gap | −8240 | −3925 | 11,464 | 12,690 | 2084 | −10,321 | |
| % Gap | −13.6% | −6.5% | 19% | 21% | 3.45% | −17% | |
| Long Trades | NP | 56,272 | 58,457 | 66,158 | 67,070 | 61,767 | 48,747 |
| PF | 2.68 | 2.90 | 3.25 | 3.40 | 3.10 | 2.62 | |
| Short Trades | NP | −4151 | −2021 | 5667 | 5981 | 678 | 1293 |
| PF | 0.93 | 0.96 | 1.12 | 1.13 | 1.01 | 1.03 |
Table 2.
Results for Ethereum trades.
| Days | 22 | 23 | 24 | 25 | 26 | 27 | |
|---|---|---|---|---|---|---|---|
| B&H$ | 3741 | 3741 | 3741 | 3741 | 3741 | 3741 | |
| All Trades | NP | 4385 | 4653 | 4741 | 4018 | 4357 | 4215 |
| PF | 2.36 | 2.49 | 2.54 | 2.24 | 2.48 | 2.39 | |
| MDD | 262 | 181 | 199 | 257 | 311 | 411 | |
| $ Gap | 644 | 912 | 1000 | 277 | 616 | 474 | |
| % Gap | 17.2% | 24.4% | 26.7% | 7.4% | 16.5% | 12.7% | |
| Long Trades | NP | 3719 | 3869 | 3916 | 3556 | 3724 | 3655 |
| PF | 4.11 | 4.23 | 4.20 | 3.69 | 4.01 | 3.80 | |
| Short Trades | NP | 666 | 784 | 825 | 462 | 633 | 560 |
| PF | 1.32 | 1.40 | 1.45 | 1.24 | 1.37 | 1.32 |
Table 3.
Results for XRP trades.
| Days | 12 | 13 | 14 | 15 | 16 | 17 | |
|---|---|---|---|---|---|---|---|
| B&H$ | 0.39 | 0.39 | 0.39 | 0.39 | 0.39 | 0.39 | |
| All Trades | NP | 1.22 | 2.39 | 1.39 | 1.46 | 1.23 | 1.15 |
| PF | 1.40 | 2.05 | 1.51 | 1.57 | 1.47 | 1.44 | |
| MDD | 0.17 | 0.21 | 0.25 | 0.33 | 0.26 | 0.28 | |
| $ Gap | 0.83 | 2.00 | 1.00 | 1.07 | 0.84 | 0.76 | |
| % Gap | 207% | 502% | 250% | 274% | 215% | 195% | |
| Long Trades | NP | 0.81 | 1.39 | 0.91 | 0.94 | 0.83 | 0.77 |
| PF | 1.70 | 2.45 | 1.65 | 1.70 | 1.59 | 1.56 | |
| Short Trades | NP | 0.41 | 1.00 | 0.48 | 0.52 | 0.41 | 0.38 |
| PF | 1.21 | 1.76 | 1.36 | 1.43 | 1.33 | 1.29 |
Table 4.
Results for Binance Coin trades.
| Days | 23 | 24 | 25 | 26 | 27 | 28 | |
|---|---|---|---|---|---|---|---|
| B&H$ | 472.6 | 472.6 | 472.6 | 472.6 | 472.6 | 472.6 | |
| All Trades | NP | 732 | 755 | 805 | 826 | 780 | 783 |
| PF | 3.36 | 3.72 | 4.21 | 4.48 | 4.29 | 4.35 | |
| MDD | 15.8 | 26.7 | 22.4 | 20.8 | 30.4 | 19.6 | |
| $ Gap | 259.4 | 282.4 | 332.4 | 353.4 | 307.4 | 310.4 | |
| % Gap | 54.9% | 59.7% | 70.3% | 74.7% | 65% | 65.7% | |
| Long Trades | NP | 600 | 612 | 637 | 648 | 624 | 626 |
| PF | 6.75 | 8.30 | 8.79 | 10.55 | 10.15 | 10.40 | |
| Short Trades | NP | 132 | 143 | 168 | 178 | 156 | 157 |
| PF | 1.64 | 1.74 | 1.99 | 2.06 | 1.92 | 1.93 |
Table 5.
Results for Cardano trades.
| Days | 50 | 51 | 52 | 53 | 54 | 55 | |
|---|---|---|---|---|---|---|---|
| B&H$ | 1.85 | 1.85 | 1.85 | 1.85 | 1.85 | 1.85 | |
| All Trades | NP | 1.66 | 1.69 | 1.68 | 1.76 | 1.75 | 1.75 |
| PF | 2.06 | 2.09 | 2.08 | 2.18 | 2.17 | 2.19 | |
| MDD | 0.26 | 0.25 | 0.36 | 0.31 | 0.41 | 0.36 | |
| $ Gap | −0.19 | −0.16 | −0.17 | −0.09 | −0.10 | −0.10 | |
| % Gap | −10.3% | −8.6% | −9.2% | −4.8% | −5.4% | −5.4% | |
| Long Trades | NP | 1.86 | 1.88 | 1.87 | 1.92 | 1.92 | 1.93 |
| PF | 3.34 | 3.42 | 3.41 | 3.640 | 3.63 | 3.72 | |
| Short Trades | NP | −0.20 | −0.19 | −0.20 | −0.16 | −0.17 | −0.18 |
| PF | 0.73 | 0.75 | 0.74 | 0.79 | 0.78 | 0.76 |
Publisher’s Note: MDPI stays neutral with regard to jurisdictional claims in published maps and institutional affiliations. |
© 2021 by the author. Licensee MDPI, Basel, Switzerland. This article is an open access article distributed under the terms and conditions of the Creative Commons Attribution (CC BY) license (https://creativecommons.org/licenses/by/4.0/).
Share and Cite
MDPI and ACS Style
Cohen, G. Trading Cryptocurrencies Using Second Order Stochastic Dominance. Mathematics 2021, 9, 2861. https://doi.org/10.3390/math9222861
AMA Style
Cohen G. Trading Cryptocurrencies Using Second Order Stochastic Dominance. Mathematics. 2021; 9(22):2861. https://doi.org/10.3390/math9222861
Chicago/Turabian StyleCohen, Gil. 2021. "Trading Cryptocurrencies Using Second Order Stochastic Dominance" Mathematics 9, no. 22: 2861. https://doi.org/10.3390/math9222861
Note that from the first issue of 2016, this journal uses article numbers instead of page numbers. See further details here.