Article

A Mixed Strategy of Higher-Order Structure for Link Prediction Problem on Bipartite Graphs

1
School of Information Science and Engineering, Yanshan University, Qinhuangdao 066004, China
2
Department of Mathematics and Computer Science, Hengshui University, Hengshui 053000, China
3
LMIB and School of Mathematical Sciences, Beihang University, Beijing 536002, China
*
Author to whom correspondence should be addressed.
Mathematics 2021, 9(24), 3195; https://doi.org/10.3390/math9243195
Submission received: 14 October 2021 / Revised: 7 December 2021 / Accepted: 8 December 2021 / Published: 10 December 2021
(This article belongs to the Topic Machine and Deep Learning)

Abstract

:
Link prediction tasks have an extremely high research value in both academic and commercial fields. As a special case, link prediction in bipartite graphs has been receiving more and more attention thanks to the great success of the recommender system in the application field, such as product recommendation in E-commerce and movie recommendation in video sites. However, the difference between bipartite and unipartite graphs makes some methods designed for the latter inapplicable to the former, so it is quite important to study link prediction methods specifically for bipartite graphs. In this paper, with the aim of better measuring the similarity between two nodes in a bipartite graph and improving link prediction performance based on that, we propose a motif-based similarity index specifically for application on bipartite graphs. Our index can be regarded as a high-order evaluation of a graph’s local structure, which concerns mainly two kinds of typical 4-motifs related to bipartite graphs. After constructing our index, we integrate it into a commonly used method to measure the connection potential between every unconnected node pair. Some of the node pairs are originally unconnected, and the others are those we select deliberately to delete their edges for subsequent testing. We make experiments on six public network datasets and the results imply that the mixture of our index with the traditional method can obtain better prediction performance w.r.t. precision, recall and AUC in most cases. This is a strong proof of the effectiveness of our exploration on motifs structure. Also, our work points out an interesting direction for key graph structure exploration in the field of link prediction.

1. Introduction

Complex network models can be used to study a large number of systems in both natural and social relations, e.g., gene networks, social networks and knowledge networks. These types of networks often have the properties of structural complexity, connection diversity, meta-complication, etc. which make them difficult to process and study [1]. However, with the development of computer technology and the improvement of computing power, researchers can process large-scale network data more effectively, which boosts different kinds of research topics based on complex networks. Among all those topics, link prediction is one of the most concerned and important which aims to use known network information (links and node features) to infer the missing connection between a pair of nodes that should have existed or predict the possible future interaction between two nodes. This technique is widely used in areas such as recommender systems, community discovery, and bioinformatics [2].
In the field of link prediction, there are three types of methods commonly applied by researchers. The first type is of methods based on node similarity metrics such as CN (Common Neighborhood), AA (Adamic-Adar) [3] and CCLP [4]. Local similarity measures usually depend on the nature of the common neighbor nodes and it is easy to calculate, while the global similarity indexes focus more on the global structure of the network, but suffer from the high computational complexity because they usually involve the calculation of multiple nodes and links. In addition, methods based on network embedding are also well studied and used. M Zhang and Y Chen proposed a graph neural network (GNN) based link prediction architecture in literature [5] and H Wang used multiple deep autoencoders to map each node to a low-dimensional feature space [6]. The last type of methods is based on random walks, represented by restart random walk (RWR) and extended restart random walk (ROWER) [7]. This type of methods designs different random walk algorithms to calculate the stable probability of a node transferring to another and uses the probability as a measure to infer the possibility of connecting edges.
In this paper, we propose a new similarity index specifically designed for bipartite networks inspired by the concept motifs, which is very instructive in the exploration of graph structure. Motifs was first proposed by Milo et al. in literature [8], defined as statistically significant patterns of interconnections or subgraphs recurring in certain network.
Different from the usual usage of motifs, in our research, we consider the 4-motifs structure instead of the common 3-motifs one to build our similarity index and combine it with the well-known existing index used in collaborative filtering. We use our mixed index to measure the connection probability between unconnected nodes and test its predictive effect in six real-world bipartite networks. The significance and contributions of our research are summarized as follows:
  • We propose a new motif-based similarity index that tries to capture more structural information from bipartite networks, which may be neglected by simply examining edges or nodes. This construction is very enlightening and can be extended by considering different motifs.
  • We combine our index with a traditional widely-applied similarity measure and use the mixed index to predict links.
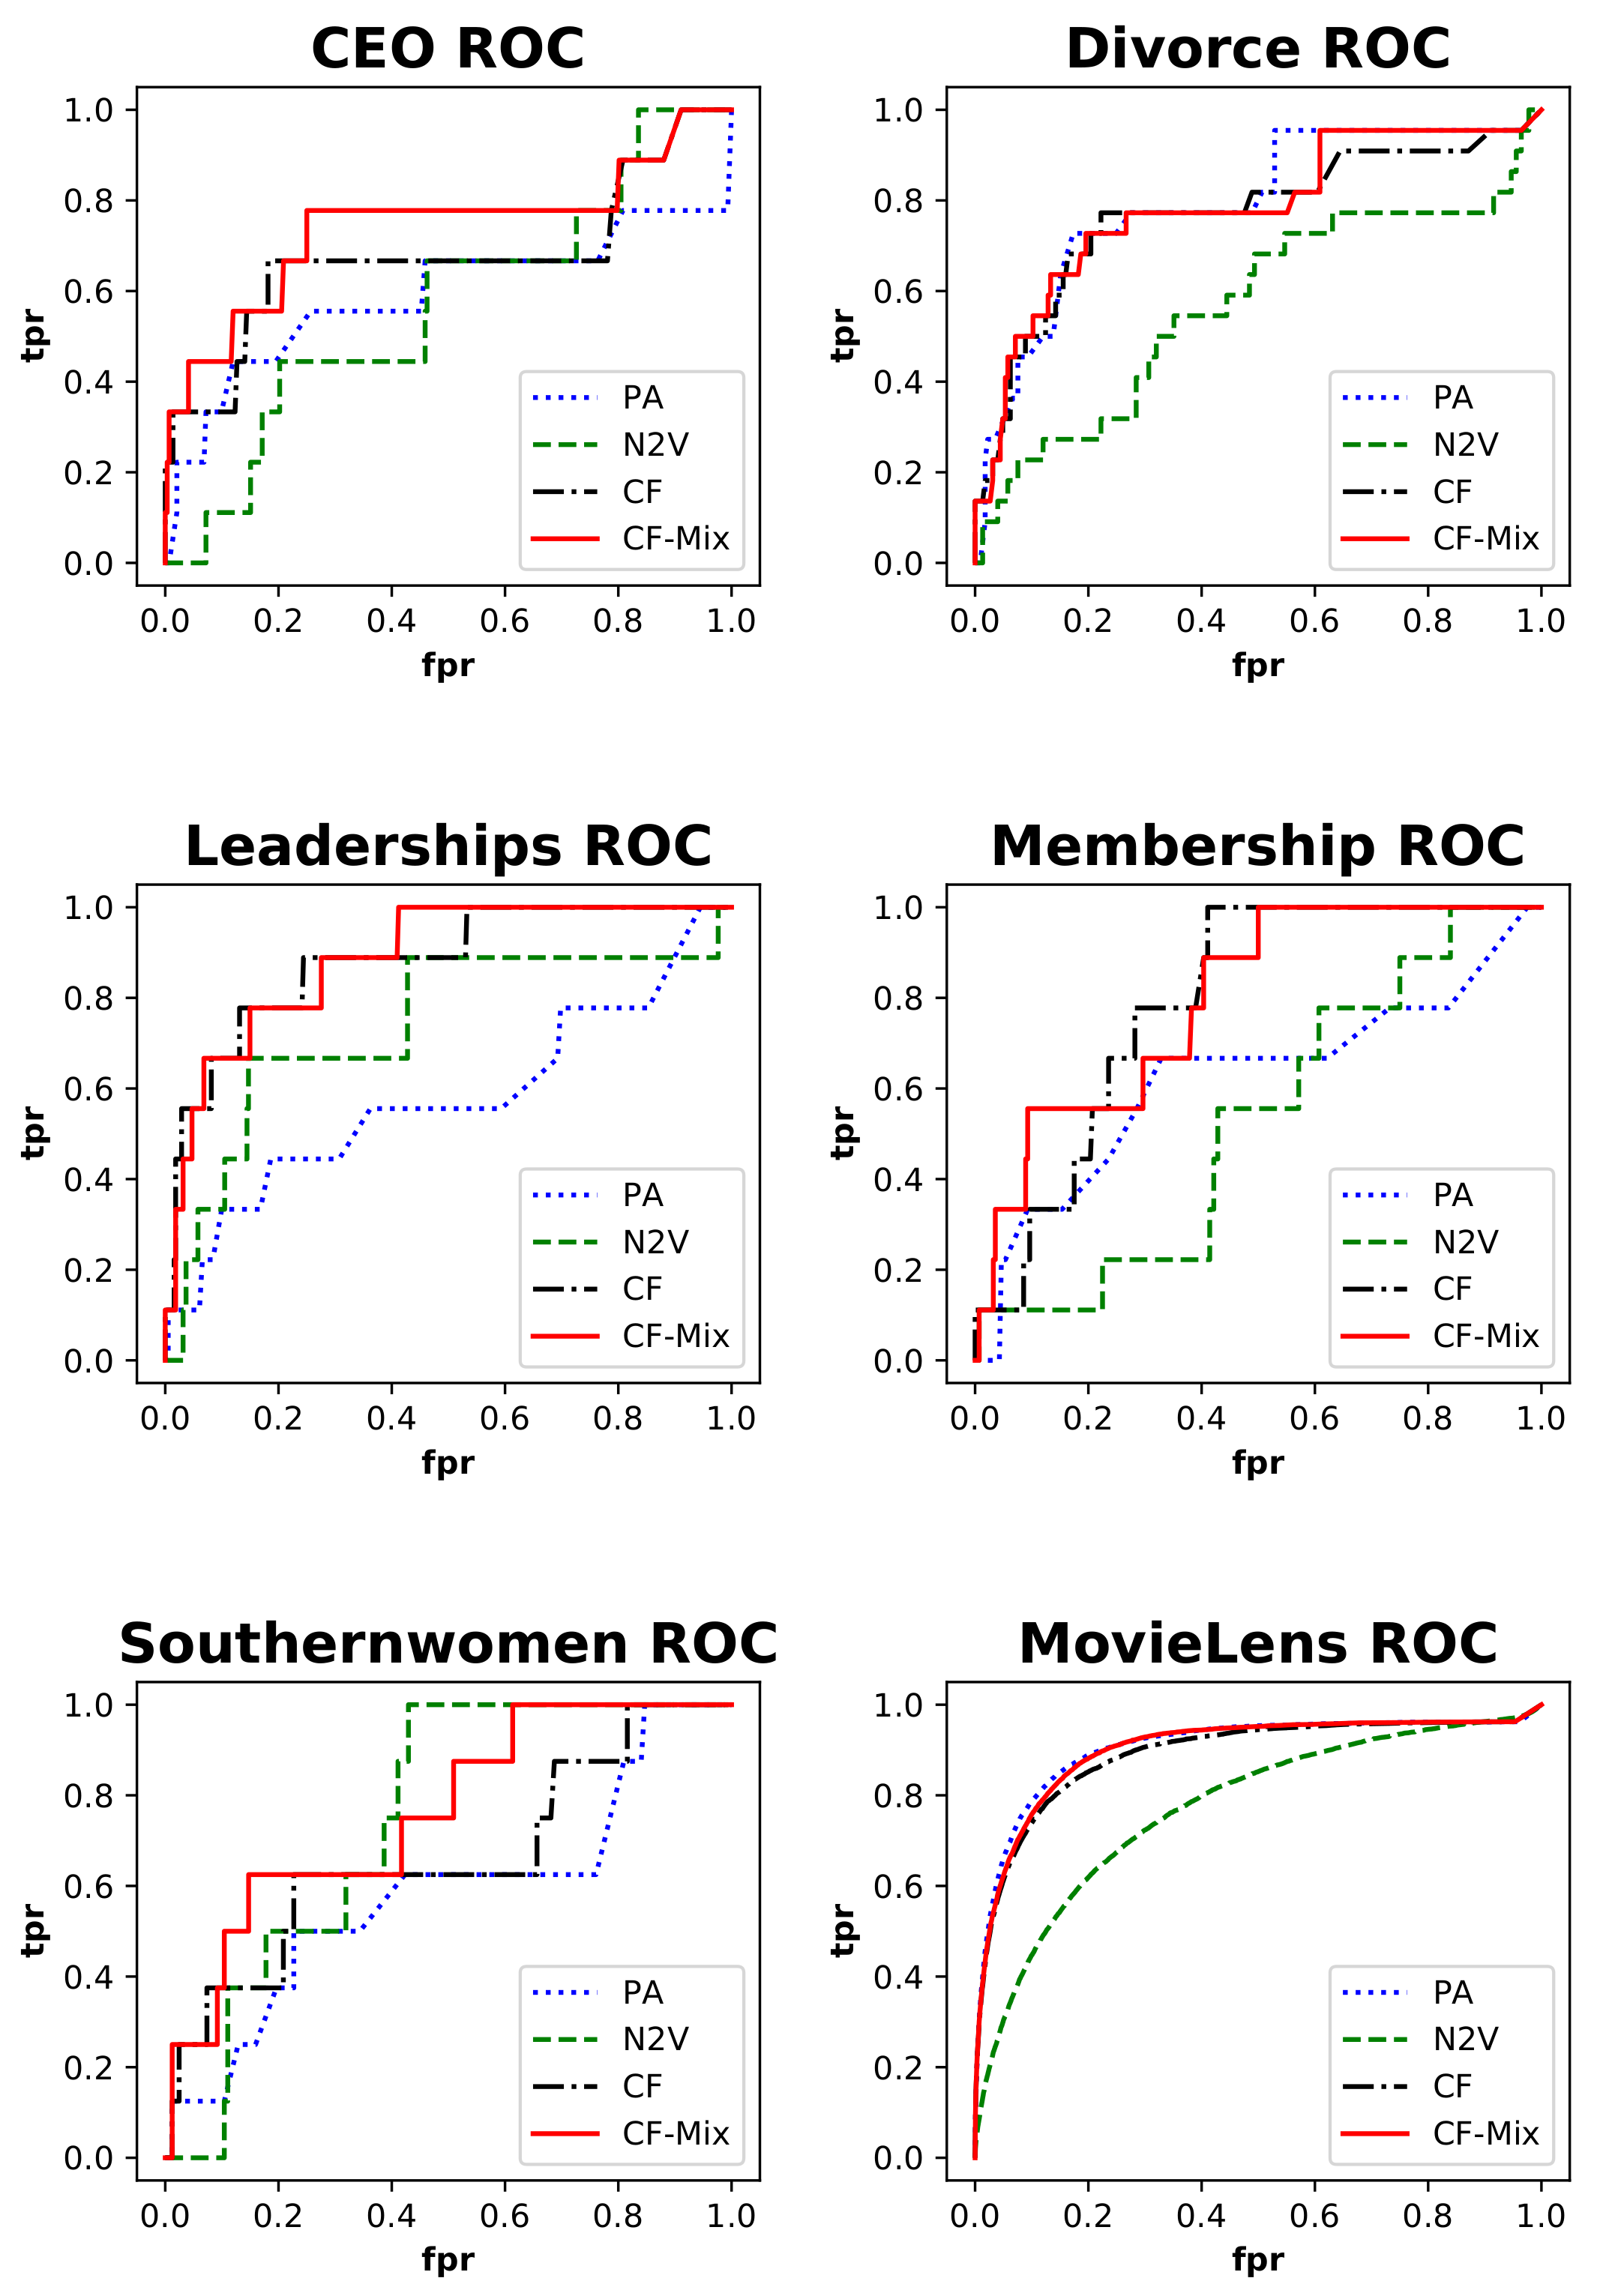
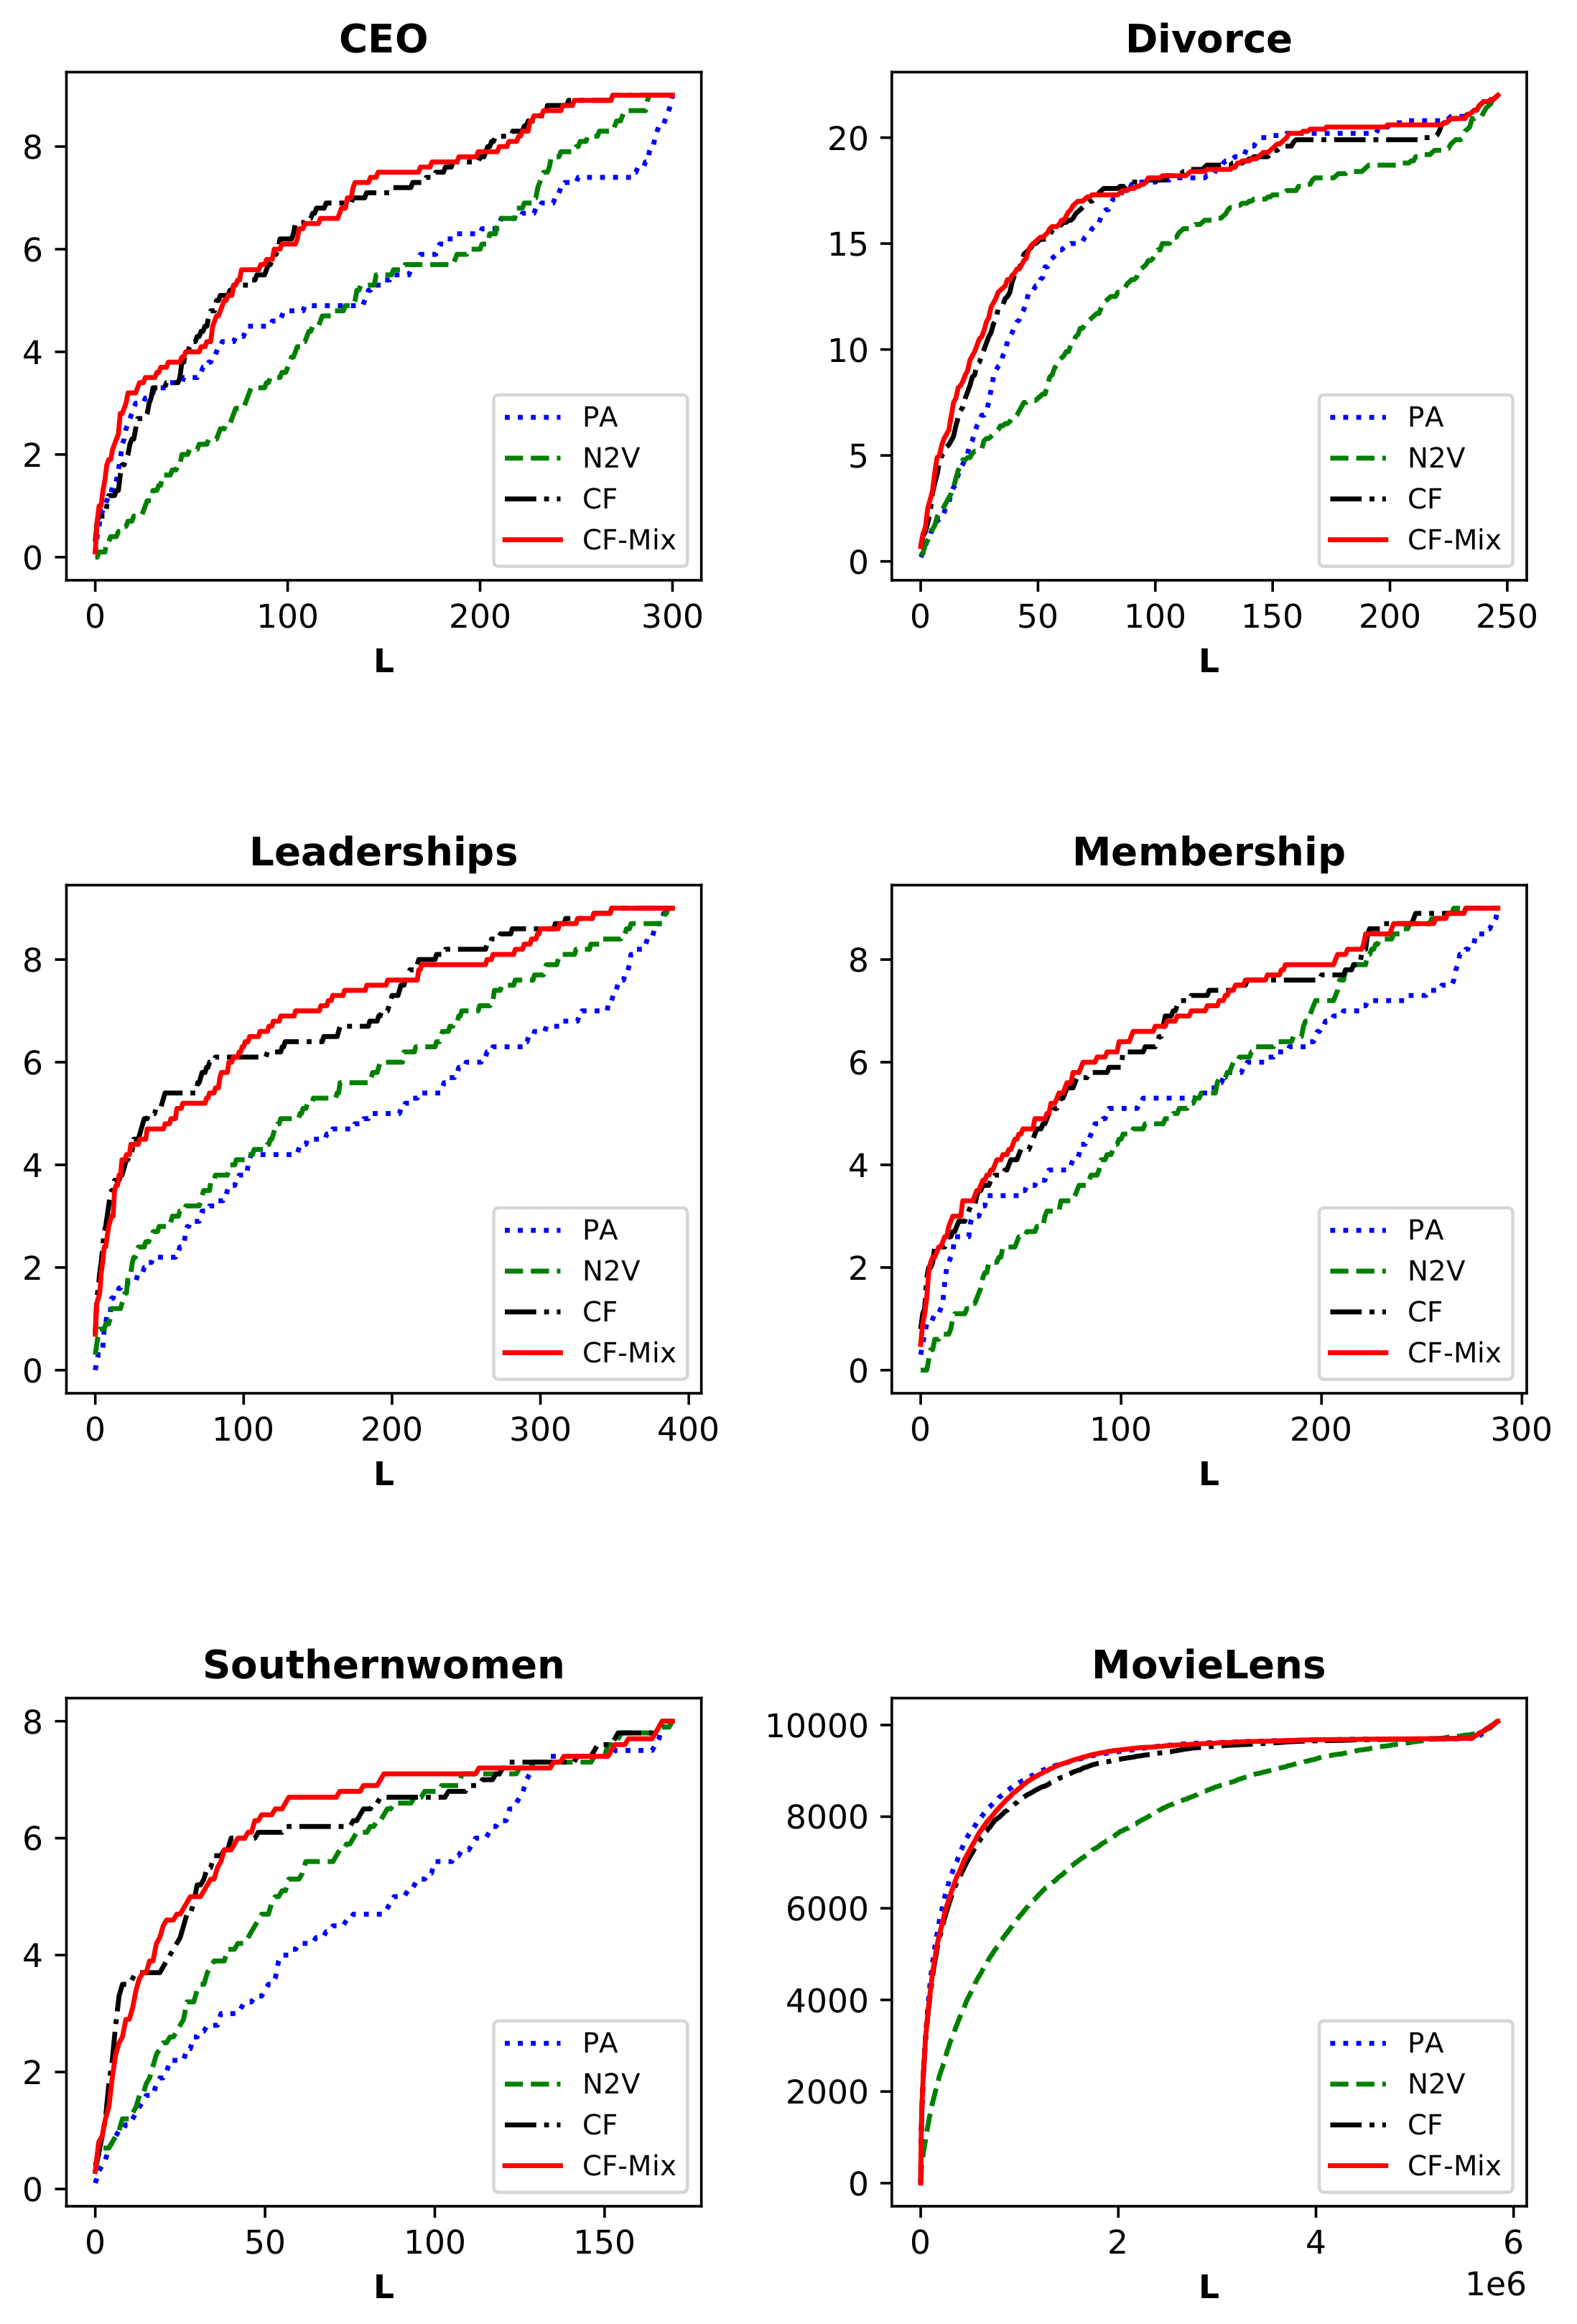
  • We experiment with our mixed index on six public benchmark datasets and acquire better prediction accuracy and generalization ability in most cases.
The rest of the paper proceeds as follows. Section 2 summarizes the related work on link prediction in bipartite graph and recommendation algorithms. Section 3 introduces our proposed similarity measure, its definition and properties. Section 4 describes the experiments and analyzes the performance of our index. Finally, we conclude the paper with future work in Section 5.

2. Related Work

2.1. Link Prediction in Bipartite Graph

Many networks in real life can be regarded as bipartite graphs e.g., authorship network, customer-item network, usage logs and so on. How to make link prediction in these cases is a topic of concern, but it should be noted that there are some major differences between this task on bipartite graphs and unipartite graphs. In a unipartite graph, several assumptions are made, such as new edges tending to form triangle structures and nodes tending to form communities in which they are well-connected [9]. However, as a comparison, these assumptions no longer hold in a bipartite graph due their unique structure. For instance, the triangle structure (three interconnected nodes) does not exist in bipartite graphs because nodes in bipartite graphs are separated into two categories and nodes of the same category cannot be connected. Therefore, predicting the potential link between two nodes sharing the same neighbor is logically wrong. Nonetheless, those algorithms that do not take triangle numbers or common neighbors connections into account might still work, such as the preferential attachment model [10], which measures the similarity between two nodes by the production of their own degrees and infers connections based on this. In contrast to the direct neighborhood fashion, the link prediction problem could also be considered in an algebraic way. These methods correspond to matrix decomposition and can be solved by using iterative algorithms, such as the von Neumann Pesudokernal Method [11]. With the development of machine learning, several machine learning approaches are also provided and introduced in this area. Benchettara considered expressing the link prediction problem as a two class discrimination problem, and applied classical supervised machine learning methods to solve it [12]. Xin Li and Hsinchun Chen [13] took advantage of the structure of a bipartite graph and proposed a kernel-based random walk method to solve the problem. Gao mapped the bipartite network onto a unipartite network and performed link prediction only within the CNPs (candidate node pair) [14].

2.2. Recommendation Algorithms

In previous studies, collective local structure of a graph is the most commonly considered feature when designing recommendation algorithms. The following are three representative methods among them, which will be taken for comparison in this paper.
PA (Preferential Attachment) is a similarity function proposed by Albert Barabasi et al. [10] in 1999. It is based on the simple idea that a high degree nodes tend to be connected to each other compared with low degree nodes. This is also known as the rich-get-richer concept. The calculation formula is as follows, which means the production of the number of neighbors of node i and node j.
S P A ( i , j ) = | Γ i |   ×   | Γ j | ,
where Γ i is the neighborhood nodes set of i.
N2V (Node2vec) is an algorithm devised for graph representation [15]. It can be seen as an extension of DeepWalk, also a well-known framework for representational learning on a graph [16]. Using node2vec, we can learn the low-dimensional feature representation for each node, which can be used for downstream machine learning tass such as node classification, community detection and especially link prediction [17]. Once we acquire the graph embedding, we simply apply the Euclidean distance between each node pair to measure the similarity.
CF (Collaborative Filtering) is one of the earliest and most successful techniques used by the recommender system. It was first proposed by Goldberg et al., [18] which introduced the first collaborative filtering recommender system Tapestry. After that, Resnick et al. [19] proposed the first automated collaborative filtering system GroupLens, which aimed to help users find their favorite news among a large number of online news. Due to the great success of GroupLens, more and more researchers have been conducting research on collaborative filtering, and the research results published in major journals have also been increasing year by year. In general, collaborative filtering methods can be divided into two categories: memory-based methods and model-based methods [20]. Memory-based collaborative filtering uses the entire user-item rating dataset for calculation, and each user is an integral part of the rating prediction process. Memory-based collaborative filtering selects a fraction of neighbor users with similar interests for the target user and predicts the target user’s score on the item based on the scores of its neighbors. Typical memory-based collaborative filtering methods include Neighbor-Based collaborative filtering and its improved algorithm [21,22]. Model-based collaborative filtering first learns from the training dataset to obtain a complex model. It then derives the target user’s score for the unrated items based on the learned model and the target user’s scored data, etc.

3. Methods

The similarity measurements for bipartite-graph recommender systems are classified as item-based similarity and user-based similarity, both of which focus on the common neighbors of targeted nodes. For example, the similarity between two items i , j can be defined as the number of users that once had these two items. Also, normalization is always introduced to make the similarity more reasonable, such as the cosine-similarity-based Salton Index (SA) [23],
S S A ( i , j ) = | Γ i Γ j | | Γ i |   ×   | Γ j | .
And in the frame of item-based CF index, the interest of user u on item j can be defined as
P u j = i Γ u S ( i , j ) ,
where S ( i , j ) is the similarity between items i , j and the summation is always performed on items with the top k similarities.
The similarity of the CF index is always related to the common neighbor information of targeted items i , j 
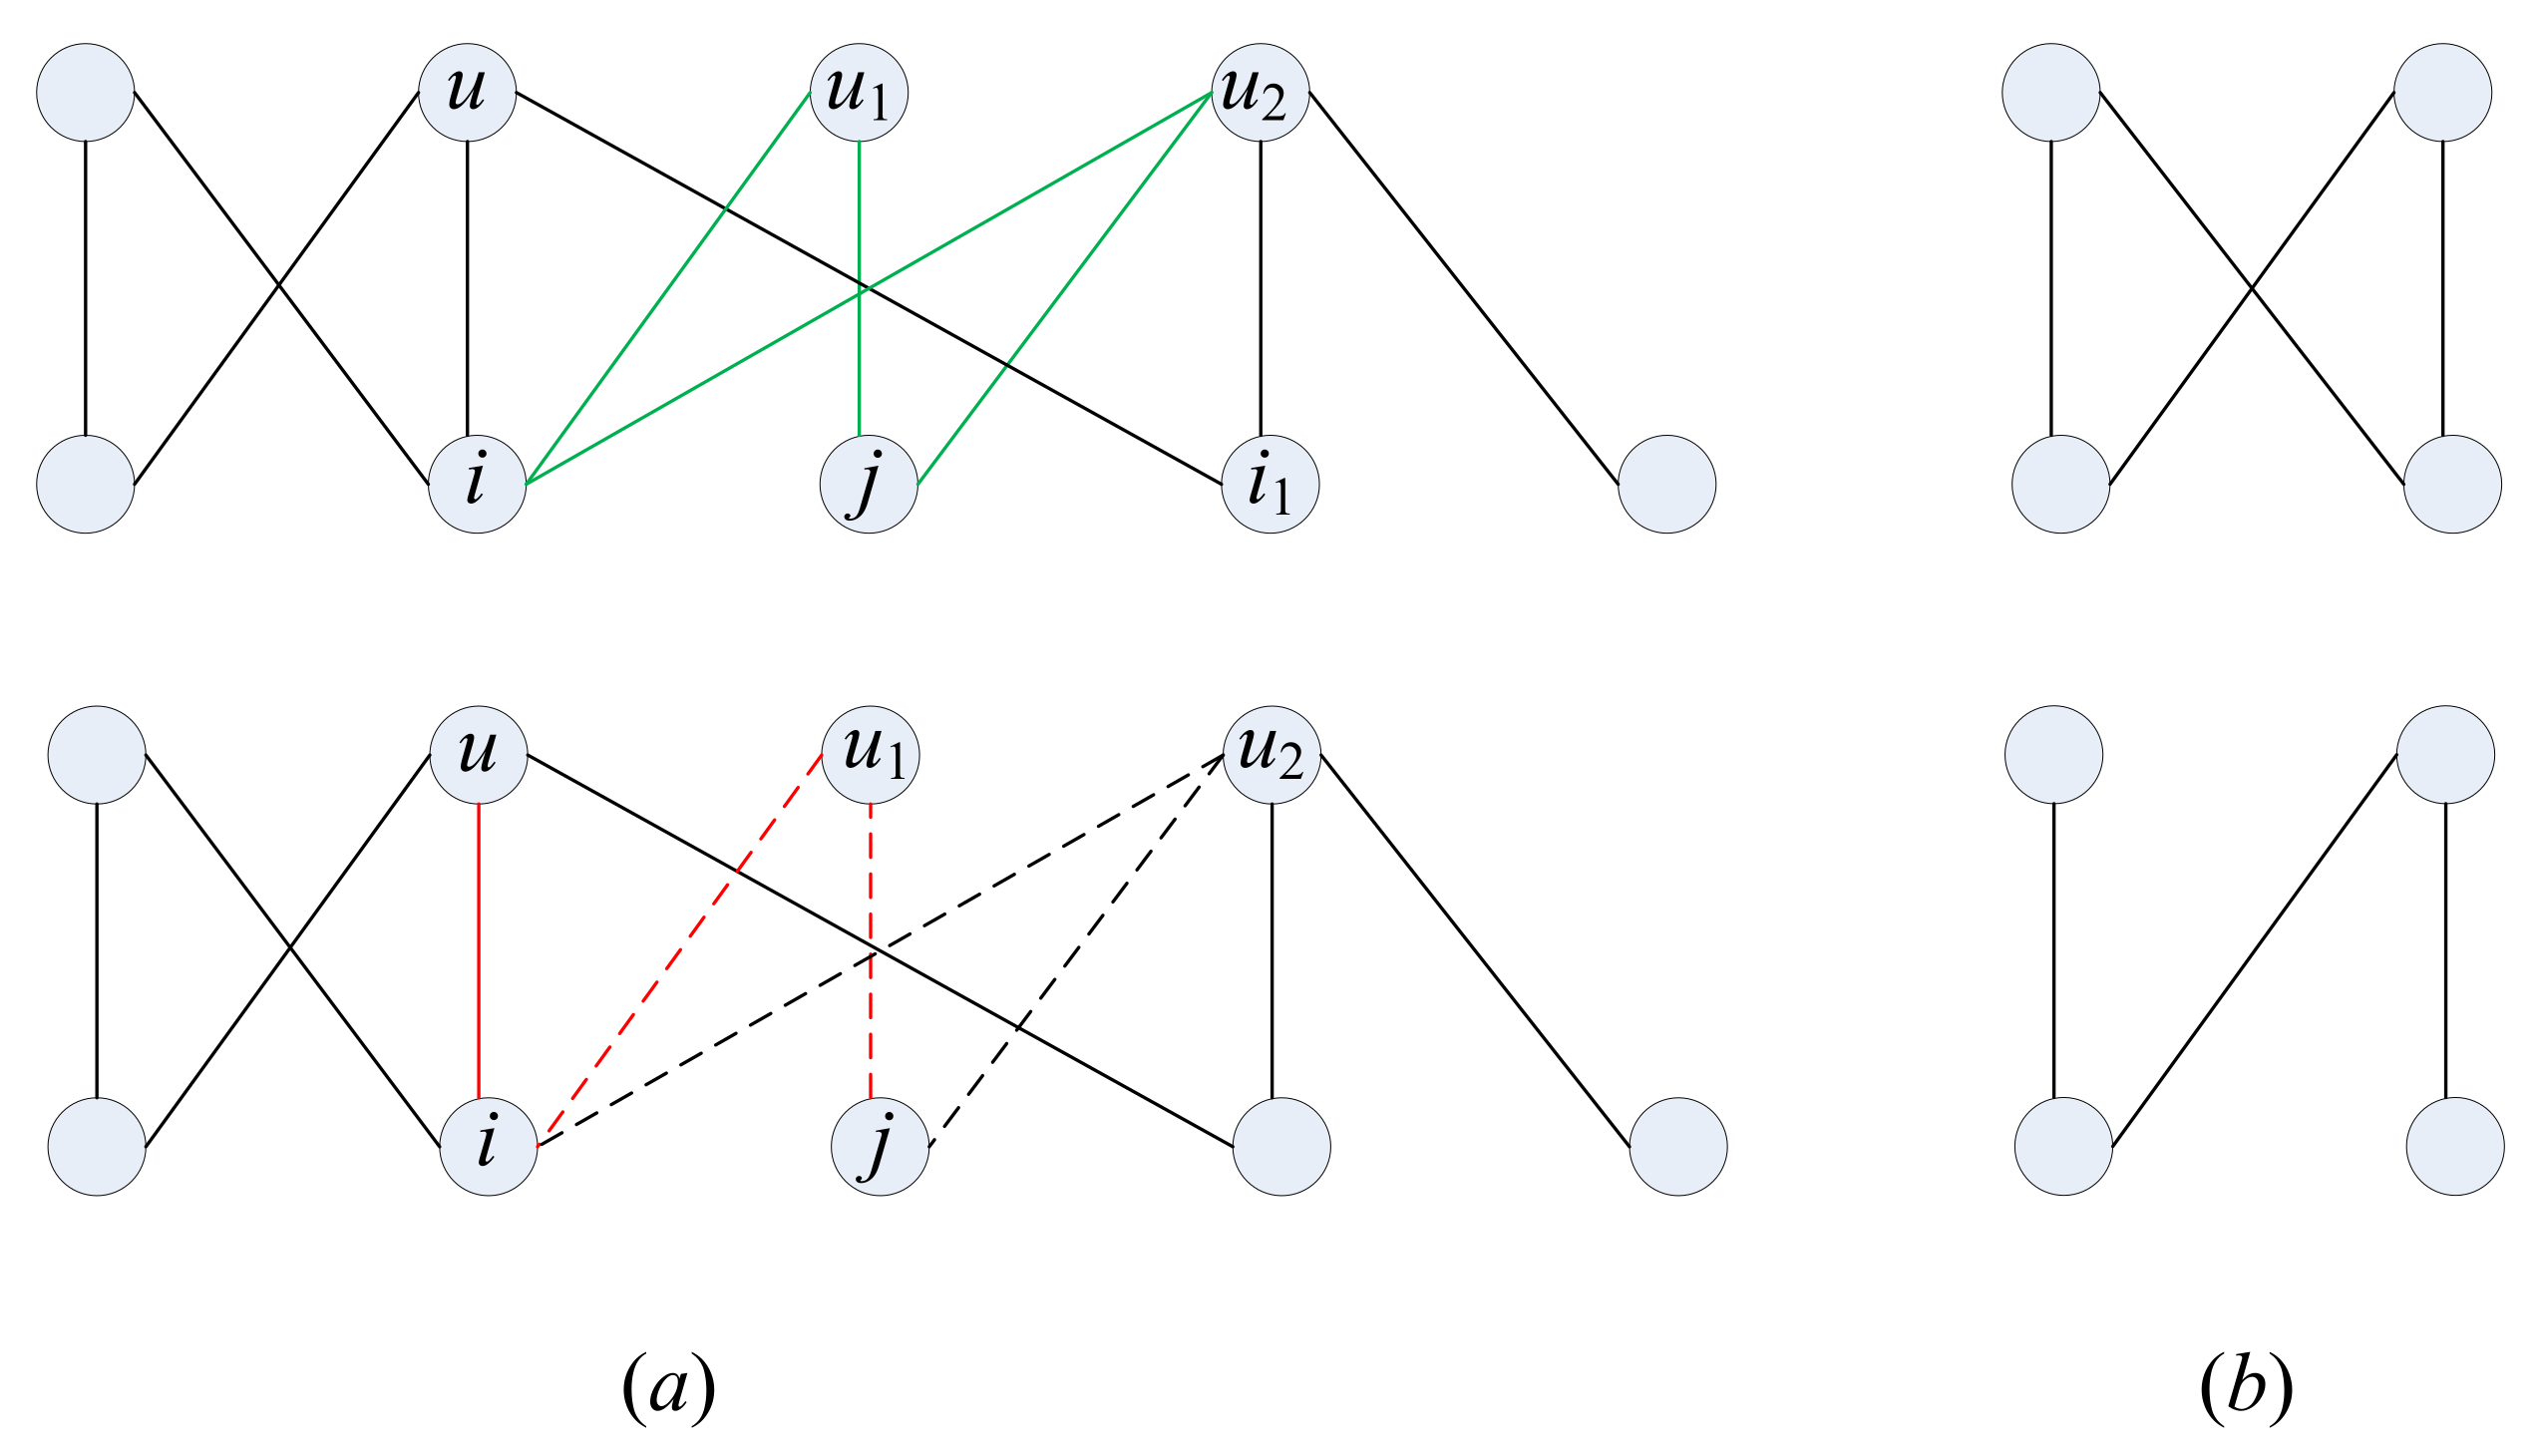
, which neglects the structural information in their local environment. To reflect more local structures, a motif-based similarity will be introduced to reveal the local connection density,
S M ( i , j ) = | C y c l e ( i , j ) | | C h a i n ( i , j ) | ,
where C y c l e ( i , j ) is the set of four cycles involving items i , j and C h a i n ( i , j ) is the set of four chains involving i , j . A schematic view of the difference between S M ( i , j ) and S S A ( i , j ) is shown in Figure 1a. Similar to the CF index, the potential of connection between user u and item j can be defined as
P u j M = i Γ u S M ( i , j ) = i Γ u | C y c l e ( i , j ) | | C h a i n ( i , j ) | .
In the viewpoint of the study of motifs and the example in Figure 1, traditional similarity indexes mostly consider the common neighbors, which are indeed three motifs. However, our proposed motif-based similarity considers the four motif such as four chains or four cycles, which can be treated as a high-order evaluation on the local structures. Combining the effect of CF index and the P M index, a mixed strategy for the potential evaluation between user u and item j can be given as
P u j C F M i x = P u j S A + P u j M = i Γ u ( | Γ i Γ j | | Γ i |   ×   | Γ j | + λ | C y c l e ( i , j ) | | C h a i n ( i , j ) | ) ,
where the first term in the summation can be viewed as a three order structure (3-motif) statistics, the second term is a four order structure (four motif) statistics and λ 
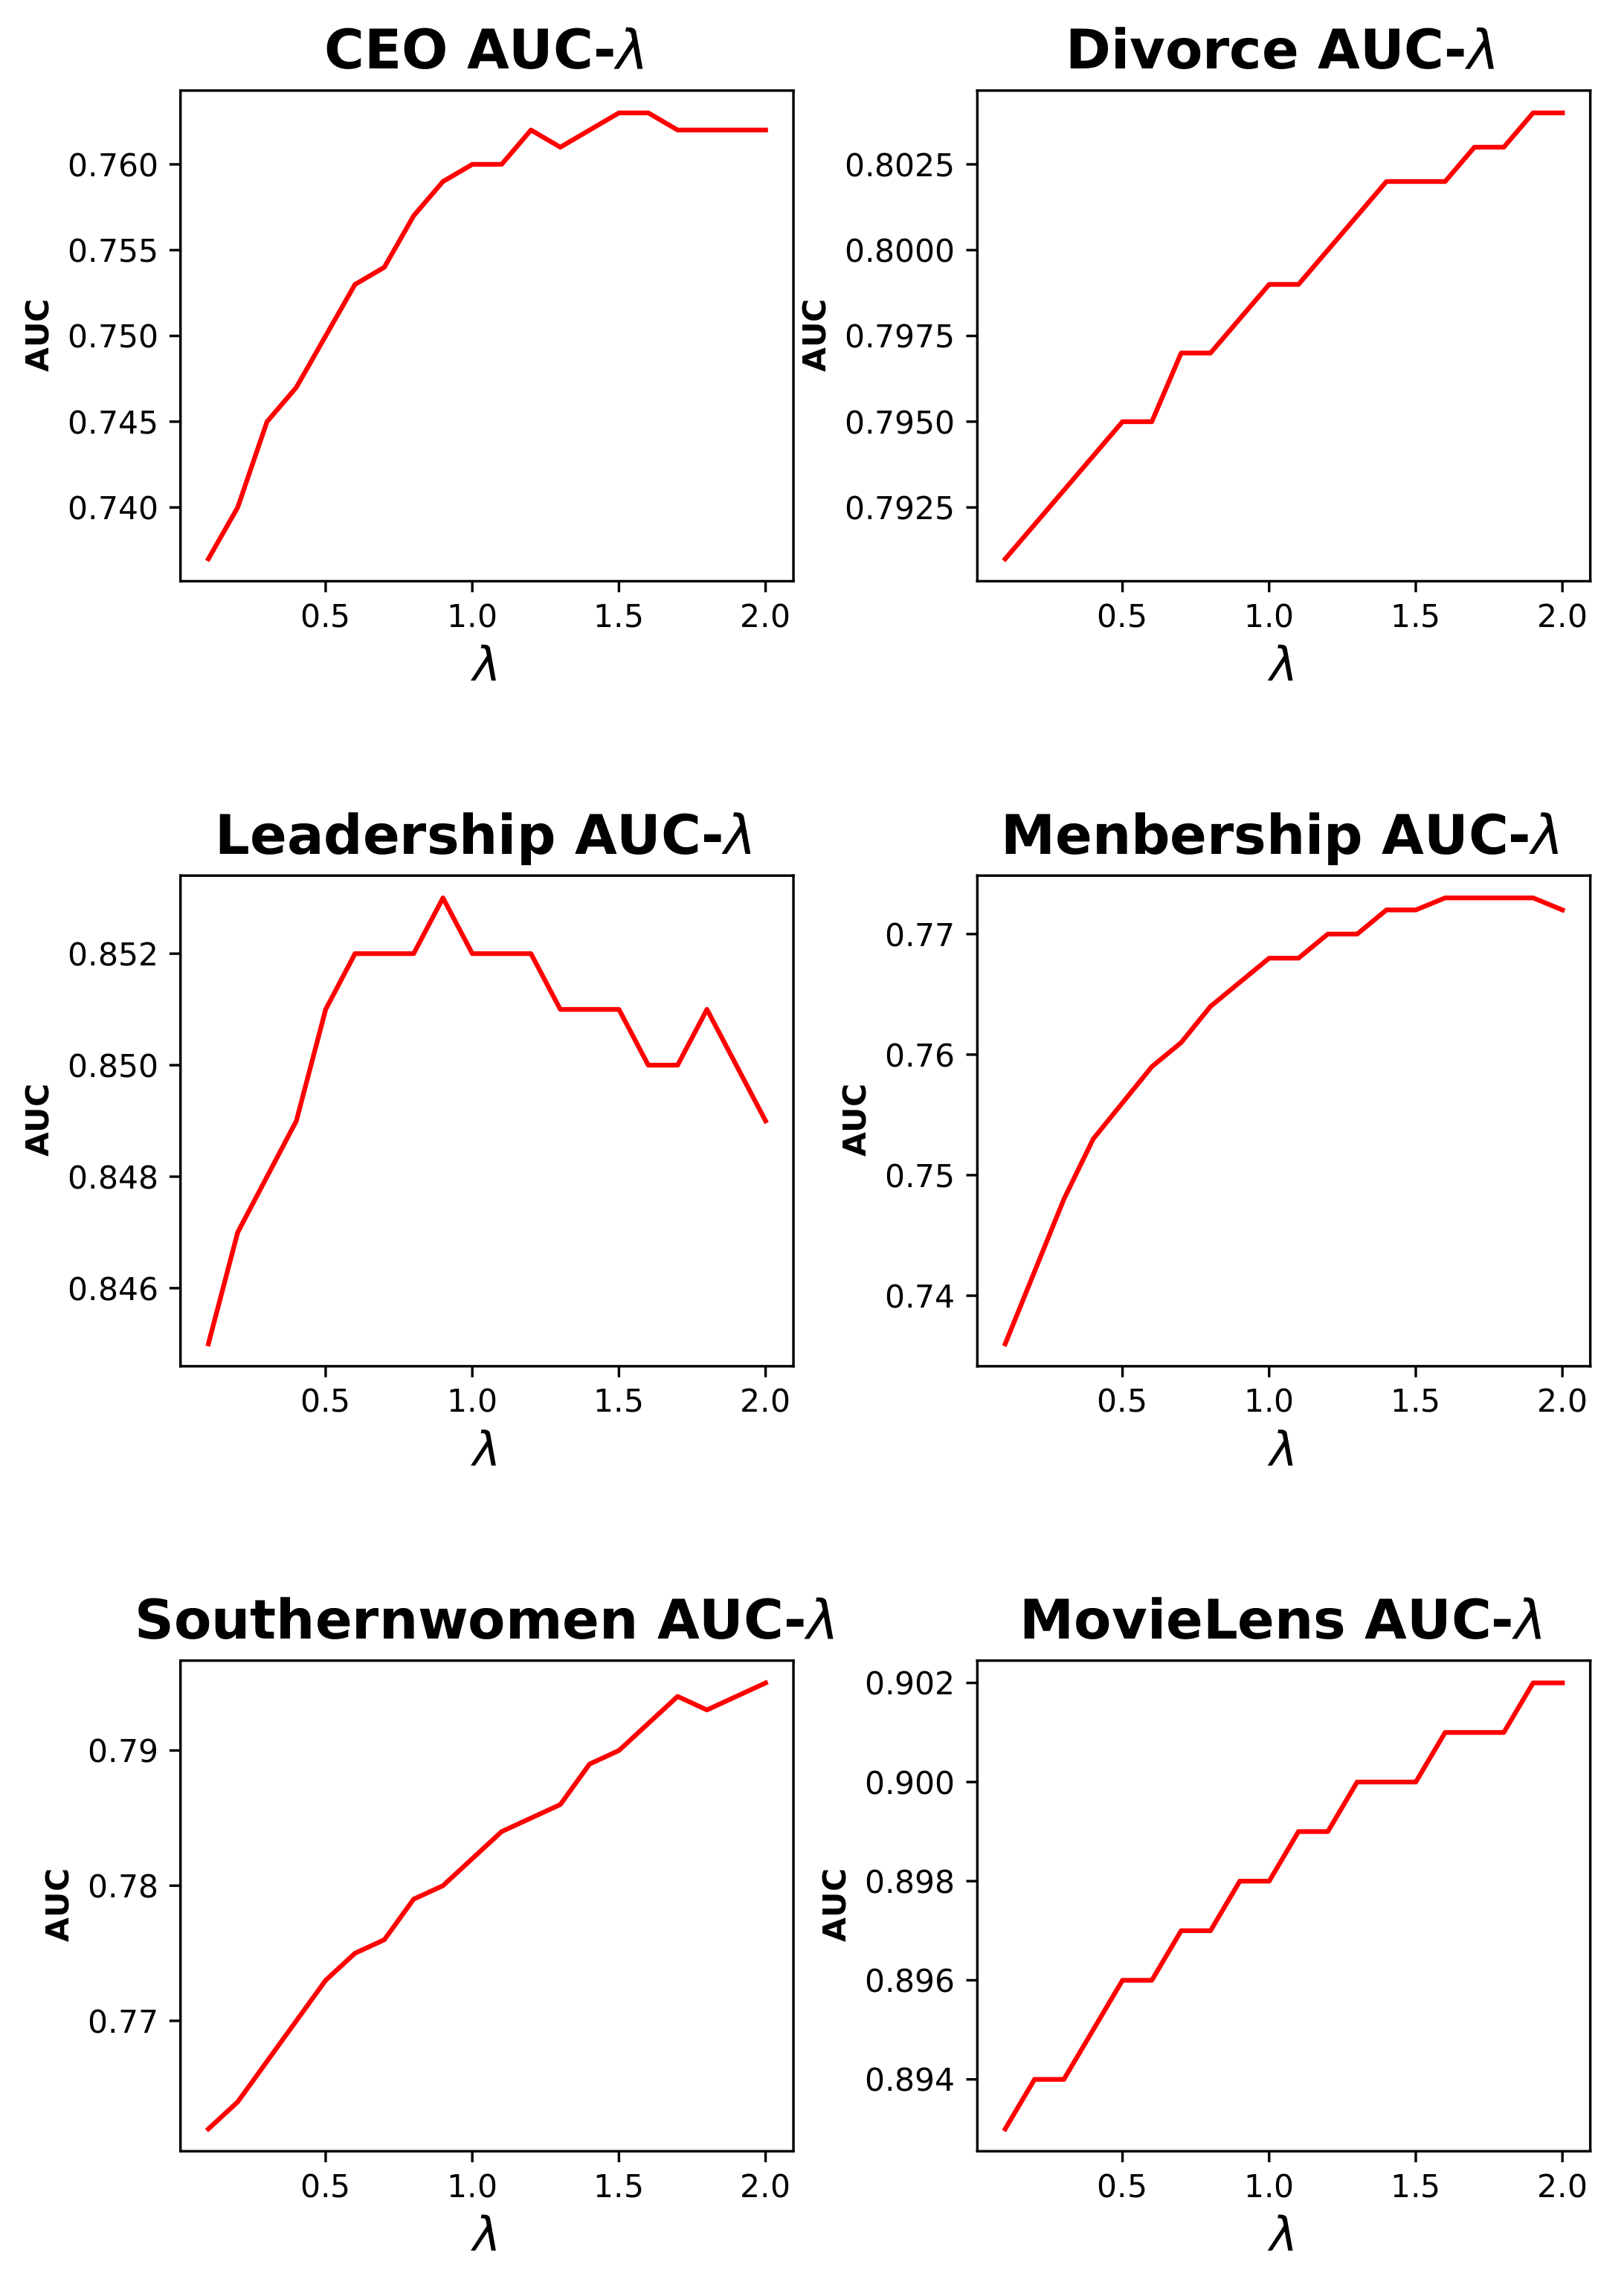
is an adjustable weight measuring the contribution of four motifs in the definition. There is no definite standard for the choice of weight λ . As we will see in the experiments section, the best value of λ is different in different networks. With regard to application, we strongly recommend that users test different values of λ and select the best one.
The definition of the CF-Mix index combines two kinds of local structures and can reflect more local structural information. Also, inspired by the Taylor formula expansion, higher order characteristics can describe more details of the potential correlations among objects. As four cycles of targeted items i , j in the CF-Mix index only emerge in the common neighbors, the counting of four cycles only exploit special structures with thier common neighborhood of i , j , which brings no more time consumption. For the 4 chains with item j as an end, it is induced by nodes i , j and one of their common neighbors with some neighbors of node i. So the counting of such four chains only consider the wedges’ (induced by i , j and one of their common neighbors) number multiplied by degree of i, which does not increase the computational complexity. Thus, the CF-Mix index has no more time consumption than the CF but it contains more information.
For items i , j , counting the number of C h a i n ( i , j ) covers that of C y c l e ( i , j ) because C y c l e ( i , j ) belongs to C h a i n ( i , j ) . Therefore, to find all the members of C h a i n ( i , j ) , the main effort is to enumerate all the neighbors of item i and j and check whether i connects j’s neighbor or j connects i’s neighbor. The number of such operation will not exceed | Γ i |   ×   | Γ j | and its computational cost will not be greater than O ( N ) , in which N is the number of users. Also, to find all the members of C y c l e ( i , j ) , we need to find all the common neighbors of i and j, so the computational cost will not be greater than O ( N ) either. Therefore, the computational cost of calculating P u j C F M i x between user u and item j will be at the level of O ( M N ) , in which M is the number of items. In addition, detecting four motifs structures has the same computational cost as three motifs structures, and this can be generalized to more complicated motifs structures on bipartite graphs.

4. Experiments

4.1. Implementation

We use Python to implement our proposed strategy and do the whole experiments. Every index we discuss has a very concise definition in the form of calculation formula so the programming process is not difficult. Below, we present the pseudo code of the implementation of our proposed motif-based similarity index S M and CF-Mix index in Algorithms 1–3.

4.2. Data

Here, we introduce the six datasets we used, each of which is a bipartite graph. CEO: This dataset is an affiliation network which consists of the CEOs of 26 corporations and their affiliation with 15 clubs, cultural boards, and corporate boards of directors. This network was originally collected by Galaskiewicw (1985) [24]. Divorce: This dataset describes the grounds for divorce allowed in each of the 50 states in the U.S. There are nine grounds in total, which are incompatibility, cruelty, desertion, nonsupport, alcohol, felony, impotence, insanity, and separation [25]. Leadership: This dataset describes the relationship between 22 companies and 20 company directors. If a person is the director of a company, then they will be connected by a link [26]. Membership: This dataset shows the membership information of corporate executive officers in social organizations such as clubs and boards [27]. Southernwomen: This dataset consists of 32 nodes, out of which 18 represent 18 women and the remaining 14 represent 14 informal social events. It records which women met forwhich events [28]. MovieLens: This is a classic dataset used in recommender system testing, which records the ratings given to movies by the audience [29]. We deliberately selected the above 6 networks with a large span in network scale in order to test the performance of our proposed method. We hoped it could work well in both small-scale and large-scale networks.
Algorithm 1 Motif-based similarity S M .
Input: 
Graph matrix G, node x, node y of the same node type
Output: 
S M similarity of node x and node y
1:
function count of cycle(node x, node y)
2:
     N x neighbors of node x
3:
     N y neighbors of node y
4:
     C o u n t 0
5:
    for i in N x  do
6:
        for j in N y  do
7:
           if i and j is connected then
8:
                C o u n t + = 1
9:
           end if
10:
        end for
11:
    end for
12:
    return  C o u n t
13:
end function
14:
function count of chain(node x, node y)
15:
     N x neighbors of node x
16:
     N y neighbors of node y
17:
     N x y common neighbors of node x , y
18:
     C o u n t | N x y | [ ( | N x | 1 ) + ( | N y | 1 ) ]
19:
    return  C o u n t
20:
end function
21:
function S M  calculation(node x, node y)
22:
    return Count of Cycle( x , y )/Count of Chain( x , y )
23:
end function
Algorithm 2 S S A similarity used in CF.
Input: 
Graph matrix G, node x, node y of the same node type
Output: 
S S A similarity of node x and node y
1:
function S S A  calculation(node x, node y)
2:
     N x neighbors of node x
3:
     N y neighbors of node y
4:
    return  | N x N y | / | N x | | N y |
5:
end function
Algorithm 3 CF-Mix index.
Input: 
Graph matrix G, node x, node y of different node types, weight λ
Output: 
Potential of connection between node x and node y
1:
function CF-Mix calculation(node x, node y)
2:
     N x neighbors of node x
3:
     S c o r e 0
4:
    for i in N x  do
5:
         S c o r e + = S M Calculation( x , i ) + λ * S S A Calculation( x , i )
6:
    end for
7:
    return  S c o r e
8:
end function
In Table 1, some statistics like nodes’ number N, edges’ number M, average degree <k> and average shortest path length <d> for the datasets CEO, Divorce, Leadership, Membership, Southernwomen and MovieLens are provided.

4.3. Results

In the following data analysis, on each network, 90% edges will be randomly selected for training and the remaining 10% edges will be used for testing. We calculate the similarity-based index value (including our proposed index and baseline indexes) between every pair of nodes with no edges. Then, we sort these values in descending order. Theoretically, the pair of nodes with higher value are more likely to be connected in the sense that the value reflects the connection potential between them by definition. Therefore, we select the different parameter L and connect the pair of nodes whose index value is among the top L.
Firstly, we use ROC curve and AUC value to measure the generalized predictive ability of different indexes. The ROC curve (receiver operating characteristic curve) is created by plotting TPR (true positive rate) against FPR (false positive rate) at different discrimination threshold. It illustrates the variation of a binary classifier’s classification ability with the change of threshold. Usually, the threshold is selected from the minimum and maximum of the target score at equal intervals. The total number of thresholds is determined by the user according to the specific requirements of plotting. To better quantify the information contained in the curve, the AUC (area under the curve) is often calculated with it. The larger the AUC value is, the stronger the classification ability of the classifier is [30]. In Table 2, the Area Under Curves (AUC) of PA, N2V, CF and CF-Mix on the datesets CEO, Divorce, Leadership, Membership, Southern-Women and MovieLens are given to illustrate the efficiency of the CF-Mix index. On all the six datasets, our proposed CF-Mix index performs better than others except on the PA index. Especially on CEO, Membership and Southernwomen, significant improvements have been achieved. Also, it can be seen that the results of CF-Mix always has better performance than CF, which reflects the effect of high-order structures in link prediction. In Figure 2, the Receiver Operating Characteristic (ROC) curves for different datasets are given to show the comparison on the studied indexes.
In addition, a top-L precision  L T / L is also considered, which is defined as the right predicted L T edges in the top L edges ( L = 20 in all the experiments) with highest score by the indexes studied. In Table 3 and Table 4, the top-L precision and corresponding recall values are calculated to show the efficiency of the CF-Mix index. It can be seen that CF-Mix outperforms the others except on the MovieLens dataset, but the performance of CF-Mix always works no worse than the CF. In Figure 3, the dynamic changes of the cumulated right-predicted edge number L T with different values of L on all the datasets are provided to show the evolution of the top-L precision for different indexes.
Based on the above results, the efficiency of the CF-Mix index can be obtained due to higher order structures. While most of the recommendation rules take advantage of local information, especially common neighbor information, to predict potential connections, proper selection of valuable structures and deep excavation on some key motifs structures can promote the efficiency of link prediction algorithms. Certainly, different order structures may have different influences on the link prediction accuracy and the parameter λ has a function to regulate the contribution of different structures (three motifs and four motifs in this paper), which is shown in Figure 4. From the results, it can be seen that the best AUC values on different networks are achieved with λ > 1 except the Leadership, which reflects that the four motifs have a relative larger contribution than three motifs to describe the local structure information.
In general, our proposed index CF-Mix outperforms other indexes in most cases. In terms of AUC, CF-Mix has the largest value compared to others on all those six datasets except Movielens. Even on Movielens, there is only a tiny gap between CF-Mix and the best-performing index PA. The same situation also occurs in terms of prediction precision, in which case our index CF-Mix achieves the best performance on most datasets. Finally, with regard to recall, CF-Mix is always the best performing index. In a word, the above results indicate that our proposed index has excellent predictive effect.

5. Conclusions and Discussions

The link prediction problem on bipartite graphs is a widely researched topic in graph learning, and most of the recommendation rules focus on the local structures or user/item based similarity. In this paper, a motif-based similarity for items is proposed based on some typical four motif structures, which sufficiently uses the relations of the targeted user and item, and a CF-Mix index based on the classical CF index, but considering both three motifs and four motifs is provided for potential edge prediction. Experiments on some real-world datasets show the efficiency of our proposed method, and the contribution of four motifs on different networks is also discussed by optimizing the mixed parameter λ .
As a generalization, other higher order structures such as five motifs or six motifs can also be used to optimize the definition of the CF-Mix index, but corresponding higher computational complexity will arise, which will create a large obstacle for large-scale networks. Higher order motifs may lead to a sharp increasing of the motif number, and the effective way to detect key motifs in local structures (e.g., random walk) will be an interesting direction for link prediction investigation, which will be studied in our future work.Also, the similarity measurement and link prediction problem based on graph structure can provide an alternative research tool for synchronization and control of complex networks, especially those with a bipartite structure. The similarity measurement proposed in this paper, which is based on high-order topology of bipartite graphs, can be applied to the collaborative control and synchronization optimization of complex networks by effectively combining neural network methods [31,32]. This is also an important and meaningful research direction.
In terms of application, our proposed method also has huge potential. Up to now, link prediction methods have been successfully applied to many fields. For instance, Kagan et al. utilized link prediction algorithms to detect fake profiles in social networks [33]. Meanwhile, Berlusconi et al. [34] and Calderoni et al. [35] applied this technique to criminology studies, which is a very practical and meaningful scenario. On the other hand, Barbieri et al. presented a link prediction-based method to make user recommendations on Twitter and Flickr [36], while Pham et al. carried out link prediction experiments in the biomedical domain to exploit potential protein interaction [37]. In view of the great success of our proposed method on test datasets, we have begun to consider how to apply it in practice, which is also an open topic for researchers to study.

Author Contributions

Conceptualization, C.L., Q.Y., B.P. and T.C.; methodology, C.L.; software, Q.Y., B.P., T.C. and Q.C.; validation, C.L., Q.Y., B.P., T.C., Q.C. and J.L.; formal analysis, C.L.; investigation, C.L.; resources, C.L.; data curation, Q.Y., B.P. and T.C.; writing—original draft preparation, C.L. and B.P.; writing—review and editing, C.L., Q.Y., B.P., T.C., Q.C. and J.L.; visualization, C.L.; supervision, C.L.; project administration, C.L.; funding acquisition, C.L. All authors have read and agreed to the published version of the manuscript.

Funding

This work is supported by the Fundamental Research Funds for the Central Universities, the Research and Development Program of China (Grant No. 2018AAA0101100), the Beijing Natural Science Foundation (Grant Nos. 1192012, Z180005) and National Natural Science Foundation of China (Grant No. 62050132).

Institutional Review Board Statement

Not applicable.

Informed Consent Statement

Not applicable.

Data Availability Statement

Not applicable.

Acknowledgments

All the authors thank Xiangnan Feng and Ruizhi Zhang for their beneficial discussions.

Conflicts of Interest

The authors declare no conflict of interest.

References

  1. Strogatz, S. Exploring complex networks. Nature 2001, 410, 268–276. [Google Scholar] [CrossRef] [PubMed] [Green Version]
  2. Senior, A.W.; Evans, R.; Jumper, J.; Kirkpatrick, J.; Sifre, L.; Green, T.; Qin, C.; Žídek, A.; Nelson, A.W.; Bridgl, A.; et al. Improved protein structure prediction using potentials from deep learning. Nature 2020, 577, 706–710. [Google Scholar] [CrossRef] [PubMed]
  3. Adamic, L.A.; Adar, E. Friends and neighbors on the web. Soc. Netw. 2003, 25, 211–230. [Google Scholar] [CrossRef] [Green Version]
  4. Wu, Z.; Lin, Y.; Wang, J. Link prediction with node clustering coefficient. Phys. A Stat. Mech. Appl. 2016, 452, 1–8. [Google Scholar] [CrossRef] [Green Version]
  5. Zhang, M.; Chen, Y. Link prediction based on graph neural networks. Adv. Neural Inf. Process. Syst. 2018, 31, 5165–5175. [Google Scholar]
  6. Wang, H.; Zhang, F.; Hou, M.; Xie, X.; Guo, M.; Liu, Q. Shine: Signed heterogeneous information network embedding for sentiment link prediction. In Proceedings of the Eleventh ACM International Conference on Web Search and Data Mining, Los Angeles, CA, USA, 5–9 February 2018. [Google Scholar]
  7. Jin, W.; Jung, J.; Kang, U. Supervised and extended restart in random walks for ranking and link prediction in networks. PLoS ONE 2019, 14, 3. [Google Scholar] [CrossRef] [PubMed] [Green Version]
  8. Milo, R.; Shen-Orr, R.; Itzkovitz, S.; Kashtan, N.; Chklovskii, D.; Alon, U. Network motifs: Simple building blocks of complex networks. Science 2002, 298, 824–827. [Google Scholar] [CrossRef] [PubMed] [Green Version]
  9. Leskovec, J.; Backstrom, L.; Kumar, R.; Tomkins, A. Microscopic evolution of social networks. In Proceedings of the 14th ACM SIGKDD International Conference on Knowledge Discovery and Data Mining, Las Vegas, NC, USA, 24–27 August 2008. [Google Scholar]
  10. Barabasi, A.; Albert, R. Emergence of scaling in random networks. Science 1999, 286, 509–512. [Google Scholar] [CrossRef] [PubMed] [Green Version]
  11. Ito, T.; Shimbo, M.; Kudo, T.; Matsumoto, Y. Application of kernels to link analysis. In Proceedings of the Eleventh ACM SIGKDD International Conference on Knowledge Discovery in Data Mining, Chicago, IL, USA, 21–24 August 2005. [Google Scholar]
  12. Benchettara, N.; Kanawati, R.; Rouveirol, C. Supervised machine learning applied to link prediction in bipartite social networks. In Proceedings of the 2010 International Conference on Advances in Social Networks Analysis and Mining, Odense, Denmark, 9–11 August 2010. [Google Scholar]
  13. Li, X.; Chen, H. Recommendation as link prediction in bipartite graphs: A graph kernel-based machine learning approach. Decis. Support Syst. 2013, 54, 880–890. [Google Scholar] [CrossRef]
  14. Gao, M.; Chen, L.; Li, B.; Li, Y.; Liu, W.; Xu, Y.C. Projection-based link prediction in a bipartite network. Inf. Sci. 2017, 376, 158–171. [Google Scholar] [CrossRef]
  15. Grover, A.; Leskovec, J. Node2vec: Scalable feature learning for networks. In Proceedings of the 22nd ACM SIGKDD International Conference on Knowledge Discovery and Data Mining, New York, NY, USA, 24–27 August 2016. [Google Scholar]
  16. Perozzi, B.; Al-Rfou, R.; Skiena, S. DeepWalk: Online learning of social representations. In Proceedings of the 20th ACM SIGKDD International Conference on Knowledge Discovery and Data Mining, New York, NY, USA, 24–27 August 2014. [Google Scholar]
  17. De Winter, S.; Decuypere, T.; Mitrovic, S.; Baesens, B.; De Weerdt, J. Combining temporal aspects of dynamic networks with Node2Vec for a more efficient dynamic link prediction. In Proceedings of the 2018 IEEE/ACM International Conference on Advances in Social Networks Analysis and Mining, Barcelona, Spain, 28–31 August 2018. [Google Scholar]
  18. Goldberg, D.; Nichols, D.; Oki, B.M.; Terry, D. Using Collaborative Filtering to Weave an Information Tapestry. Commun. ACM 1992, 35, 61–70. [Google Scholar] [CrossRef]
  19. Resnick, P.; Iacovou, N.; Suchak, M.; Bergstrom, P.; Riedl, J. GroupLens: An Open Architecture for Collaborative Filtering of Netnews. In Proceedings of the ACM Conference on Computer Supported Cooperative Work, New York, NY, USA, 22–26 October 1994. [Google Scholar]
  20. Breese, J.; Heckerman, D.; Kadie, C. Empirical Analysis of Predictive Algorithms for Collaborative Filtering. In Proceedings of the 14th Conference on Uncertainty in Artificial Intelligence, Madison, WI, USA, 24–26 July 1998. [Google Scholar]
  21. Kaufman, L.; Rousseeuw, P. Finding Groups in Data: An Introduction to Cluster Analysis; John Wiley & Sons Inc.: New York, NY, USA, 1990; p. 342. [Google Scholar]
  22. Ester, M.; Kriegel, H.; Sander, J.; Xu, X. A Density Based Algorithm for Disco-vering Clusters in Large Spatial Databases with Noise. In Proceedings of the 2nd International Conference on Knowledge Discovery and Data Mining, Portland, OR, USA, 2–4 August 1996. [Google Scholar]
  23. Chowdhury, G. Introduction to Modern Information Retrieval, 3rd ed.; Facet Publishing: London, UK, 2010; p. 448. [Google Scholar]
  24. Wasserman, S.; Faust, K. Social Network Analysis: Methods and Applications; Cambridge University Press: Cambridge, UK, 1994; p. 825. [Google Scholar]
  25. Pajek Datasets. Available online: http://vlado.fmf.uni-lj.si/pub/networks/data/ (accessed on 1 January 2021).
  26. Barnes, R.; Burkett, T. Structural Redundancy and Multiplicity in Corporate Networks. Connections 2010, 30, 4–20. [Google Scholar]
  27. Faust, K. Centrality in Affiliation Networks. Soc. Netw. 1997, 19, 157–191. [Google Scholar] [CrossRef]
  28. Davis, A.; Gardner, B.; Gardner, M. Deep South; The University of Chicago Press: Chicago, IL, USA, 1941. [Google Scholar]
  29. Harper, F.; Konstan, J. The MovieLens Datasets: History and Context. ACM Trans. Interact. Intell. Syst. 2015, 5, 1–19. [Google Scholar] [CrossRef]
  30. Fawcett, T. An introduction to ROC analysis. Pattern Recognit. Lett. 2006, 27, 861–874. [Google Scholar] [CrossRef]
  31. Zhang, W.; Yang, X.; Yang, S.; Alsaedi, A. Finite-time and fixed-time bipartite synchronization of complex networks with signed graphs. Math. Comput. Simul. 2021, 188, 319–329. [Google Scholar] [CrossRef]
  32. Zou, Y.; Su, H.; Tang, R.; Yang, X. Finite-time bipartite synchronization of switched competitive neural networks with time delay via quantized control. ISA Trans. 2021. [Google Scholar] [CrossRef] [PubMed]
  33. Kagan, D.; Elovichi, Y.; Fire, M. Generic anomalous vertices detection utilizing a link prediction algorithm. Soc. Netw. Anal. Min. 2018, 8, 27. [Google Scholar] [CrossRef] [Green Version]
  34. Berlusconi, G.; Calderoni, F.; Parolini, N.; Verani, M.; Piccardi, C. Link prediction in criminal networks: A tool for criminal intelligence analysis. PLoS ONE 2018, 11, e0154244. [Google Scholar] [CrossRef] [PubMed]
  35. Francesco, C.; Salvatore, C.; Pasquale, D.; Annamaria, F.; Giacomo, F. Robust link prediction in criminal networks: A case study of the Sicilian Mafia. Expert Syst. Appl. 2020, 161, 113666. [Google Scholar]
  36. Barbieri, N.; Bonchi, F.; Manco, G. Who to follow and why: Link prediction with explanations. In Proceedings of the 20th ACM SIGKDD International Conference on Knowledge Discovery and Data Mining–KDD’14, New York, NY, USA, 24–27 August 2014. [Google Scholar]
  37. Pham, C.; Dang, T. Link Prediction for Biomedical Network. In Proceedings of the 12th International Conference on Advances in Information Technology, Bangkok, Thailand, 29 June–1 July 2021. [Google Scholar]
Figure 1. (a) A schematic view of the difference between the items similarity of CF index and motif-based measurement. In the left upper subgraph, the items i , j have two common neighbors u 1 , u 2 and the similarity related to the CF index is based on the characteristics of u 1 , u 2 . In the left lower subgraph, two kinds of four motifs are considered. One is the red 4-chain u , i , u 1 , j and another is the dashed four cycle u 1 , i , u 2 , j , u 1 . The similarity based on the motif structures calculates the ratio of four cycles to four chains related to items i , j . (b) The two four motifs used in the similarity are illustrated: the right upper one is the four cycle and the right lower is the four chain.
Mathematics 09 03195 g001
Figure 2. The ROC curves of index PA, N2V, CF and CF-Mix. The vertical axis shows TPR (true positive rate) and the horizontal axis represents FPR (false positive rate). Each result is the average on 100 such experiments.
Mathematics 09 03195 g002
Figure 3. The results of prediction by the PA, N2V, CF and CF-Mix indexes. The vertical coordinate is the cumulative number of predicted edges L T , the horizontal coordinate is L. Each result is the average on 100 such experiments.
Mathematics 09 03195 g003
Figure 4. The variation of the AUC values by the mixed parameter λ for the CF-Mix indexes. Each result is the average on 100 such experiments.
Mathematics 09 03195 g004
Table 1. Statistics of Network datasets, including number of nodes and edges, average degree and clustering coefficient.
NetsNM<k><d>
CEO41984.782.44
Divorce592257.632.2
Leadership44994.52.76
Membership40954.752.45
Southernwomen32895.562.31
MovieLens10,334100,83619.523.39
Table 2. Link prediction accuracy of compared similarity indexes estimated by AUC. Each result is the average on 100 such experiments.
AUCPAN2VCFCF-Mix
CEO0.590.5710.7330.763
Divorce0.7720.6620.7890.804
Leadership0.6330.7350.8420.853
Membership0.6040.590.7280.773
Southernwomen0.5840.6930.760.795
MovieLens0.9060.7730.8930.902
Table 3. Link prediction accuracy of compared indexes estimated by precision. Each result is the average on 100 such experiments.
PrecisionPAN2VCFCF-Mix
CEO0.110.040.1350.165
Divorce0.2750.240.3450.39
Leadership0.1050.0750.2150.215
Membership0.130.050.140.19
Southernwomen0.110.0850.180.215
MovieLens0.7500.650.65
Table 4. Link prediction accuracy of compared indexes estimated by recall. Each result is the average on 100 such experiments.
RecallPAN2VCFCF-Mix
CEO0.2440.0890.30.367
Divorce0.250.2180.3140.355
Leadership0.2330.1670.4780.478
Membership0.2890.1110.3110.422
Southernwomen0.2750.2120.450.538
MovieLens0.00100.0010.001
Publisher’s Note: MDPI stays neutral with regard to jurisdictional claims in published maps and institutional affiliations.

