
Global Food Security, Economic and Health Risk Assessment of the COVID-19 Epidemic


Abstract
:1. Introduction
2. Literature Review
3. Materials and Methods
3.1. Design of Variables
3.2. Multiple Factor Analysis (MFA)
4. Results
4.1. Validation of the MFA Results
4.2. Robustness Test of Variances
5. Discussion
6. Conclusions
Author Contributions
Funding
Institutional Review Board Statement
Informed Consent Statement
Data Availability Statement
Acknowledgments
Conflicts of Interest
References
- Valaskova, K.; Durana, P.; Adamko, P. Changes in Consumers’ Purchase Patterns as a Consequence of the COVID-19 Pandemic. Mathematics 2021, 9, 1788. [Google Scholar] [CrossRef]
- McKibbin, W.; Fernando, R. The Global Macroeconomic Impacts of COVID-19: Seven Scenarios. Asian Econ. Pap. 2021, 20, 1–30. [Google Scholar] [CrossRef]
- UNDG. Mainstreaming the 2030 Agenda for Sustainable Development—Reference Guide to UN Country Teams; United Nation Development Group: New York, NY, USA, 2017. [Google Scholar]
- Allen, C.; Metternicht, G.; Wiedmann, T. National pathways to the Sustainable Development Goals (SDGs): A comparative review of scenario modelling tools. Environ. Sci. Policy 2016, 66, 199–207. [Google Scholar] [CrossRef] [Green Version]
- Clay, E. Chapter 2: Food Security: Concepts and Measurement. In World Food Summit; 1996; Available online: http://www.fao.org/fileadmin/templates/faoitaly/documents/pdf/pdf_Food_Security_Cocept_Note.pdf (accessed on 26 July 2021).
- Bhatt, A.; Arora, P.; Prajapati, S.K. Occurrence, fates and potential treatment approaches for removal of viruses from wastewater: A review with emphasis on SARS-CoV-2. J. Environ. Chem. Eng. 2020, 8, 104429. [Google Scholar] [CrossRef]
- Arndt, C.; Lewis, J.D. The HIV/AIDS pandemic in South Africa: Sectoral impacts and unemployment. J. Int. Dev. 2001, 13, 427–449. [Google Scholar] [CrossRef]
- Liu, J.; Hammitt, J.K.; Wang, J.; Tsou, M. Valuation of the risk of SARS in Taiwan. Health Econ. 2005, 14, 83–91. [Google Scholar] [CrossRef] [Green Version]
- Noy, I.; Doan, N.; Ferrarini, B.; Park, D. Measuring the Economic Risk of COVID-19. Glob. Policy 2020, 11, 413–423. [Google Scholar] [CrossRef]
- Epstein, J.M. Modelling to contain pandemics. Nature 2009, 460, 687. [Google Scholar] [CrossRef] [Green Version]
- Horobet, A.; Simionescu, A.A.; Dumitrescu, D.G.; Belascu, L. Europe’s war against COVID-19: A map of countries’ disease vulnerability using mortality indicators. Int. J. Environ. Res. Public Health 2020, 17, 6565. [Google Scholar] [CrossRef]
- Mathers, C.D.; Lopez, A.D.; Murray, C.J.L. The Burden of Disease and Mortality by Condition: Data, Methods, and Results for 2001. In Global Burden of Disease and Risk Factors; The International Bank for Reconstruction and Development/The World Bank: Washington, DC, USA, 2006; pp. 1–22. ISBN 0821362623. [Google Scholar]
- Ahmad, A.; Chung, R.; Eckenwiler, L.; Ganguli-Mitra, A.; Hunt, M.; Richards, R.; Saghai, Y.; Schwartz, L.; Scully, J.L.; Wild, V. What does it mean to be made vulnerable in the era of COVID-19? Lancet 2020, 395, 1481–1482. [Google Scholar] [CrossRef]
- Hallegatte, S.; Bangalore, M.; Vogt-Schilb, A. Assessing Socioeconomic Resilience to Floods in 90 Countries; World Bank: Washington, DC, USA, 2016; p. 7663. [Google Scholar]
- Schoenbaum, S.C. Economic impact of influenza. Am. J. Med. 1987, 82, 26–30. [Google Scholar] [CrossRef]
- Lee, J.-W.; McKibbin, W.J. Globalization and Disease: The Case of SARS. Asian Econ. Pap. 2004, 3, 113–131. [Google Scholar] [CrossRef]
- McKibbin, W.J.; Sidorenko, A.A. Global Macroeconomic Consequences of Pandemic Influenza; Lowy Institute for International Policy: Sydney, Australia, 2006. [Google Scholar]
- Gangemi, S.; Billeci, L.; Tonacci, A. Rich at risk: Socio-economic drivers of COVID-19 pandemic spread. Clin. Mol. Allergy 2020, 18, 1–3. [Google Scholar] [CrossRef]
- Wu, T. The socioeconomic and environmental drivers of the COVID-19 pandemic: A review. Ambio 2021, 50, 822–833. [Google Scholar] [CrossRef] [PubMed]
- Chou, J.; Kuo, N.-F.; Peng, S.-L. Potential Impacts of the SARS Outbreak on Taiwan’s Economy. Asian Econ. Pap. 2004, 3, 84–99. [Google Scholar] [CrossRef]
- Hai, W.; Zhao, Z.; Wang, J.; Hou, Z.-G. The Short-Term Impact of SARS on the Chinese Economy. Asian Econ. Pap. 2004, 3, 57–61. [Google Scholar] [CrossRef]
- Siu, A.; Wong, Y.C.R. Economic Impact of SARS: The Case of Hong Kong. Asian Econ. Pap. 2004, 3, 62–83. [Google Scholar] [CrossRef] [Green Version]
- SolAbility Corona: Economic Impact by Country. Available online: https://solability.com/all-news/corona-risk-exposure-by-country (accessed on 20 July 2021).
- EIU Global Food Security Index (GFSI). Available online: https://foodsecurityindex.eiu.com/Country (accessed on 11 May 2021).
- Ritchie, H.; Ortiz-Ospina, E.; Beltekian, D.; Mathieu, E.; Hasell, J.; Macdonald, B.; Giattino, C.; Appel, C.; Rodés-Guirao, L.; Roser, M. Coronavirus Pandemic (COVID-19). Available online: https://ourworldindata.org/coronavirus (accessed on 26 July 2021).
- Dutta, S.; Bilbao-Osorio, B. The Global Information Technology Report 2013: Living in a Hyperconnected World; World Economic Forum and INSEAD: Geneva, Switzerland, 2012. [Google Scholar]
- World Economic Forum. The Global Competitiveness Report 2017–2018. Available online: https://www.weforum.org/reports/the-global-competitiveness-report-2017-2018 (accessed on 4 February 2019).
- Porter, M.; Schwab, K.; Sala-i-Martin, X.; López-Claros, A. (Eds.) The Global Competitiveness Report 2004–2005; WEF: Alexandria, VA, USA, 2004; ISBN 78-1403949134. [Google Scholar]
- Thurstone, L.L. Multiple factor analysis. Psychol. Rev. 1931, 38, 406–427. [Google Scholar] [CrossRef]
- Escofier, B.; Pages, J. Multiple factor analysis (AFMULT package). Comput. Stat. Data Anal. 1994, 18, 121–140. [Google Scholar] [CrossRef]
- Choisis, J.P.; Thévenet, C.; Gibon, A. Analyzing farming systems diversity: A case study in south-western France. Span. J. Agric. Res. 2012, 10, 605–618. [Google Scholar] [CrossRef] [Green Version]
- Yin, G.; Liu, L.; Yuan, C. Assessing environmental risks for high intensity agriculture using the material flow analysis method —A case study of the Dongting Lake basin in South Central China. Environ. Monit. Assess. 2015, 187, 1–17. [Google Scholar] [CrossRef]
- Máté, D.; Rabbi, M.F.; Novotny, A.; Kovács, S. Grand Challenges in Central Europe: The Relationship of Food Security, Climate Change, and Energy Use. Energies 2020, 13, 5422. [Google Scholar] [CrossRef]
- Visbal-Cadavid, D.; Martínez-Gómez, M.; Escorcia-Caballero, R. Exploring University Performance through Multiple Factor Analysis: A Case Study. Sustainability 2020, 12, 924. [Google Scholar] [CrossRef] [Green Version]
- Pagés, J.; Husson, F. Multiple factor analysis with confidence ellipses: A methodology to study the relationships between sensory and instrumental data. J. Chemom. 2005, 19, 138–144. [Google Scholar] [CrossRef]
- Koren, D.; Lőrincz, L.; Kovács, S.; Kun-Farkas, G.; Vecseriné Hegyes, B.; Sipos, L. Comparison of supervised learning statistical methods for classifying commercial beers and identifying patterns. J. Chemom. 2020, 34, 1–9. [Google Scholar] [CrossRef]
- Bécue-Bertaut, M.; Kern, J.; Hernández-Maldonado, M.-L.; Juresa, V.; Vuletic, S. Health-risk behaviour in Croatia. Public Health 2008, 122, 140–150. [Google Scholar] [CrossRef] [Green Version]
- Bécue-Bertaut, M.; Pagès, J. Multiple factor analysis and clustering of a mixture of quantitative, categorical and frequency data. Comput. Stat. Data Anal. 2008, 52, 3255–3268. [Google Scholar] [CrossRef]
- Zárraga, A.; Goitisolo, B. Simultaneous analysis and multiple factor analysis for contingency tables: Two methods for the joint study of contingency tables. Comput. Stat. Data Anal. 2009, 53, 3171–3182. [Google Scholar] [CrossRef]
- Abdi, H.; Williams, L.J.; Valentin, D. Multiple factor analysis: Principal component analysis for multitable and multiblock data sets. Wiley Interdiscip. Rev. Comput. Stat. 2013, 5, 149–179. [Google Scholar] [CrossRef]
- Pagès, J. Multiple factor analysis and procrustes analysis. In Multiple Factor Analysis by Example Using R; Chapman and Hall: London, UK, 2014; ISBN 9781482205473. [Google Scholar]
- Husson, F.; Josse, J.; Lê, S. FactoMineR: An R Package for Multivariate Analysis. J. Stat. Softw. 2008, 25, 1–18. [Google Scholar] [CrossRef] [Green Version]
- Stone, M. An Asymptotic Equivalence of Choice of Model by Cross-Validation and Akaike’s Criterion. J. R. Stat. Soc. Ser. B 1977, 39, 44–47. [Google Scholar] [CrossRef]
- Kohavi, R. A Study of Cross-Validation and Bootstrap for Accuracy Estimation and Model Selection. In Proceedings of the International Joint Conference on Artificial Intelligence, Montreal, QC, Canada, 20–25 August 1995; Volume 14, pp. 1137–1143. [Google Scholar] [CrossRef]
- Allen, D.M. The Relationship Between Variable Selection and Data Augmentation and a Method for Prediction. Technometrics 1974, 16, 125–127. [Google Scholar] [CrossRef]
- Wilcoxon, F. Individual Comparisons by Ranking Methods. Biom. Bull. 1945, 1, 80–83. [Google Scholar] [CrossRef]
- WHO. Information Note on COVID-19 and NCDs; WHO: Geneva, Switzerland, 2021. [Google Scholar]
- Kashnitsky, I.; Aburto, J.M. COVID-19 in unequally ageing European regions. World Dev. 2020, 136, 105170. [Google Scholar] [CrossRef] [PubMed]
- Azarpazhooh, M.R.; Morovatdar, N.; Avan, A.; Phan, T.G.; Divani, A.A.; Yassi, N.; Stranges, S.; Silver, B.; Biller, J.; Tokazebani Belasi, M.; et al. COVID-19 Pandemic and Burden of Non-Communicable Diseases: An Ecological Study on Data of 185 Countries. J. Stroke Cerebrovasc. Dis. 2020, 29, 105089. [Google Scholar] [CrossRef] [PubMed]
- Schröder, M. Jobless now, sick later? Investigating the long-term consequences of involuntary job loss on health. Adv. Life Course Res. 2013, 18, 5–15. [Google Scholar] [CrossRef] [Green Version]
- Javed, B.; Sarwer, A.; Soto, E.B.; Mashwani, Z.-R. Impact of SARS-CoV-2 (Coronavirus) Pandemic on Public Mental Health. Front. Public Health 2020, 8, 292. [Google Scholar] [CrossRef]
- Ji, Y.; Ma, Z.; Peppelenbosch, M.P.; Pan, Q. Potential association between COVID-19 mortality and health-care resource availability. Lancet Glob. Health 2020, 8, e480. [Google Scholar] [CrossRef] [Green Version]
- Codagnone, C.; Bogliacino, F.; Gómez, C.; Charris, R.; Montealegre, F.; Liva, G.; Lupiáñez-Villanueva, F.; Folkvord, F.; Veltri, G.A. Assessing concerns for the economic consequence of the COVID-19 response and mental health problems associated with economic vulnerability and negative economic shock in Italy, Spain, and the United Kingdom. PLoS ONE 2020, 15, e0240876. [Google Scholar] [CrossRef]
- Pieh, C.; Budimir, S.; Probst, T. The effect of age, gender, income, work, and physical activity on mental health during coronavirus disease (COVID-19) lockdown in Austria. J. Psychosom. Res. 2020, 136, 110186. [Google Scholar] [CrossRef]
- Grané, A.; Albarrán, I.; Merchán, D.E. Impact of Pandemic on European Well-Being: Visualising Scenarios from the SHARE Database. Int. J. Environ. Res. Public Health 2021, 18, 4620. [Google Scholar] [CrossRef] [PubMed]
- Victor, V.; Karakunnel, J.J.; Loganathan, S.; Meyer, D.F. From a Recession to the COVID-19 Pandemic: Inflation–Unemployment Comparison between the UK and India. Economies 2021, 9, 73. [Google Scholar] [CrossRef]
- Sharma, A.; Borah, S.B.; Moses, A.C. Responses to COVID-19: The role of governance, healthcare infrastructure, and learning from past pandemics. J. Bus. Res. 2021, 122, 597–607. [Google Scholar] [CrossRef]
- Muangmee, C.; Kot, S.; Meekaewkunchorn, N.; Kassakorn, N.; Khalid, B. Factors Determining the Behavioral Intention of Using Food Delivery Apps during COVID-19 Pandemics. J. Theor. Appl. Electron. Commer. Res. 2021, 16, 1297–1310. [Google Scholar] [CrossRef]
- Wong, S.H.; Lui, R.N.S.; Sung, J.J.Y. COVID-19 and the digestive system. J. Gastroenterol. Hepatol. 2020, 35, 744–748. [Google Scholar] [CrossRef]
- Lakner, C.; Mahler, D.G.; Negre, M.; Prydz, E.B. How Much Does Reducing Inequality Matter for Global Poverty? World Bank: Washington, DC, USA, 2019. [Google Scholar]
- United Nations. The Secretary-General’s UN COVID-19 Response and Recovery Fund; UN: New York, NY, USA, 2020. [Google Scholar]
- Popp, J.; Lakner, Z.; Harangi-Rákos, M.; Fári, M. The effect of bioenergy expansion: Food, energy, and environment. Renew. Sustain. Energy Rev. 2014, 32, 559–578. [Google Scholar] [CrossRef] [Green Version]
- Blesh, J.; Hoey, L.; Jones, A.D.; Friedmann, H.; Perfecto, I. Development pathways toward “zero hunger”. World Dev. 2019, 118, 1–14. [Google Scholar] [CrossRef]
- Zhang, X.; Vesselinov, V.V. Integrated modeling approach for optimal management of water, energy and food security nexus. Adv. Water Resour. 2017, 101, 1–10. [Google Scholar] [CrossRef]
- Bretschger, L.; Smulders, S. Technologies, preferences, and policies for a sustainable use of natural resources. Resour. Energy Econ. 2011, 33, 881–892. [Google Scholar] [CrossRef]
- Calvin, K.; Bond-Lamberty, B.; Clarke, L.; Edmonds, J.; Eom, J.; Hartin, C.; Kim, S.; Kyle, P.; Link, R.; Moss, R.; et al. The SSP4: A world of deepening inequality. Glob. Environ. Chang. 2017, 42, 284–296. [Google Scholar] [CrossRef] [Green Version]
- Meurens, F.; Dunoyer, C.; Fourichon, C.; Gerdts, V.; Haddad, N.; Kortekaas, J.; Lewandowska, M.; Monchatre-Leroy, E.; Summerfield, A.; Wichgers Schreur, P.J.; et al. Animal board invited review: Risks of zoonotic disease emergence at the interface of wildlife and livestock systems. Animal 2021, 15, 100241. [Google Scholar] [CrossRef] [PubMed]
- Merino-Saum, A.; Baldi, M.G.; Gunderson, I.; Oberle, B. Articulating natural resources and sustainable development goals through green economy indicators: A systematic analysis. Resour. Conserv. Recycl. 2018, 139, 90–103. [Google Scholar] [CrossRef]
- Aceleanu, M.I.; Șerban, A.C.; Țîrcă, D.M.; Badea, L. The rural sustainable development through renewable energy. The case of Romania. Technol. Econ. Dev. Econ. 2018, 24, 1408–1434. [Google Scholar] [CrossRef]
- United Nations Environment Programme. A UN Framework for the Immediate Socio-Economic Response to COVID-19; UN: New York, NY, USA, 2020. [Google Scholar]
- Hamulczuk, M.; Skrzypczyk, M. COVID-19, spatial market integration and producer prices: A case study of EU agri-food markets. Stud. Agric. Econ. 2021, 123, 53–61. [Google Scholar] [CrossRef]


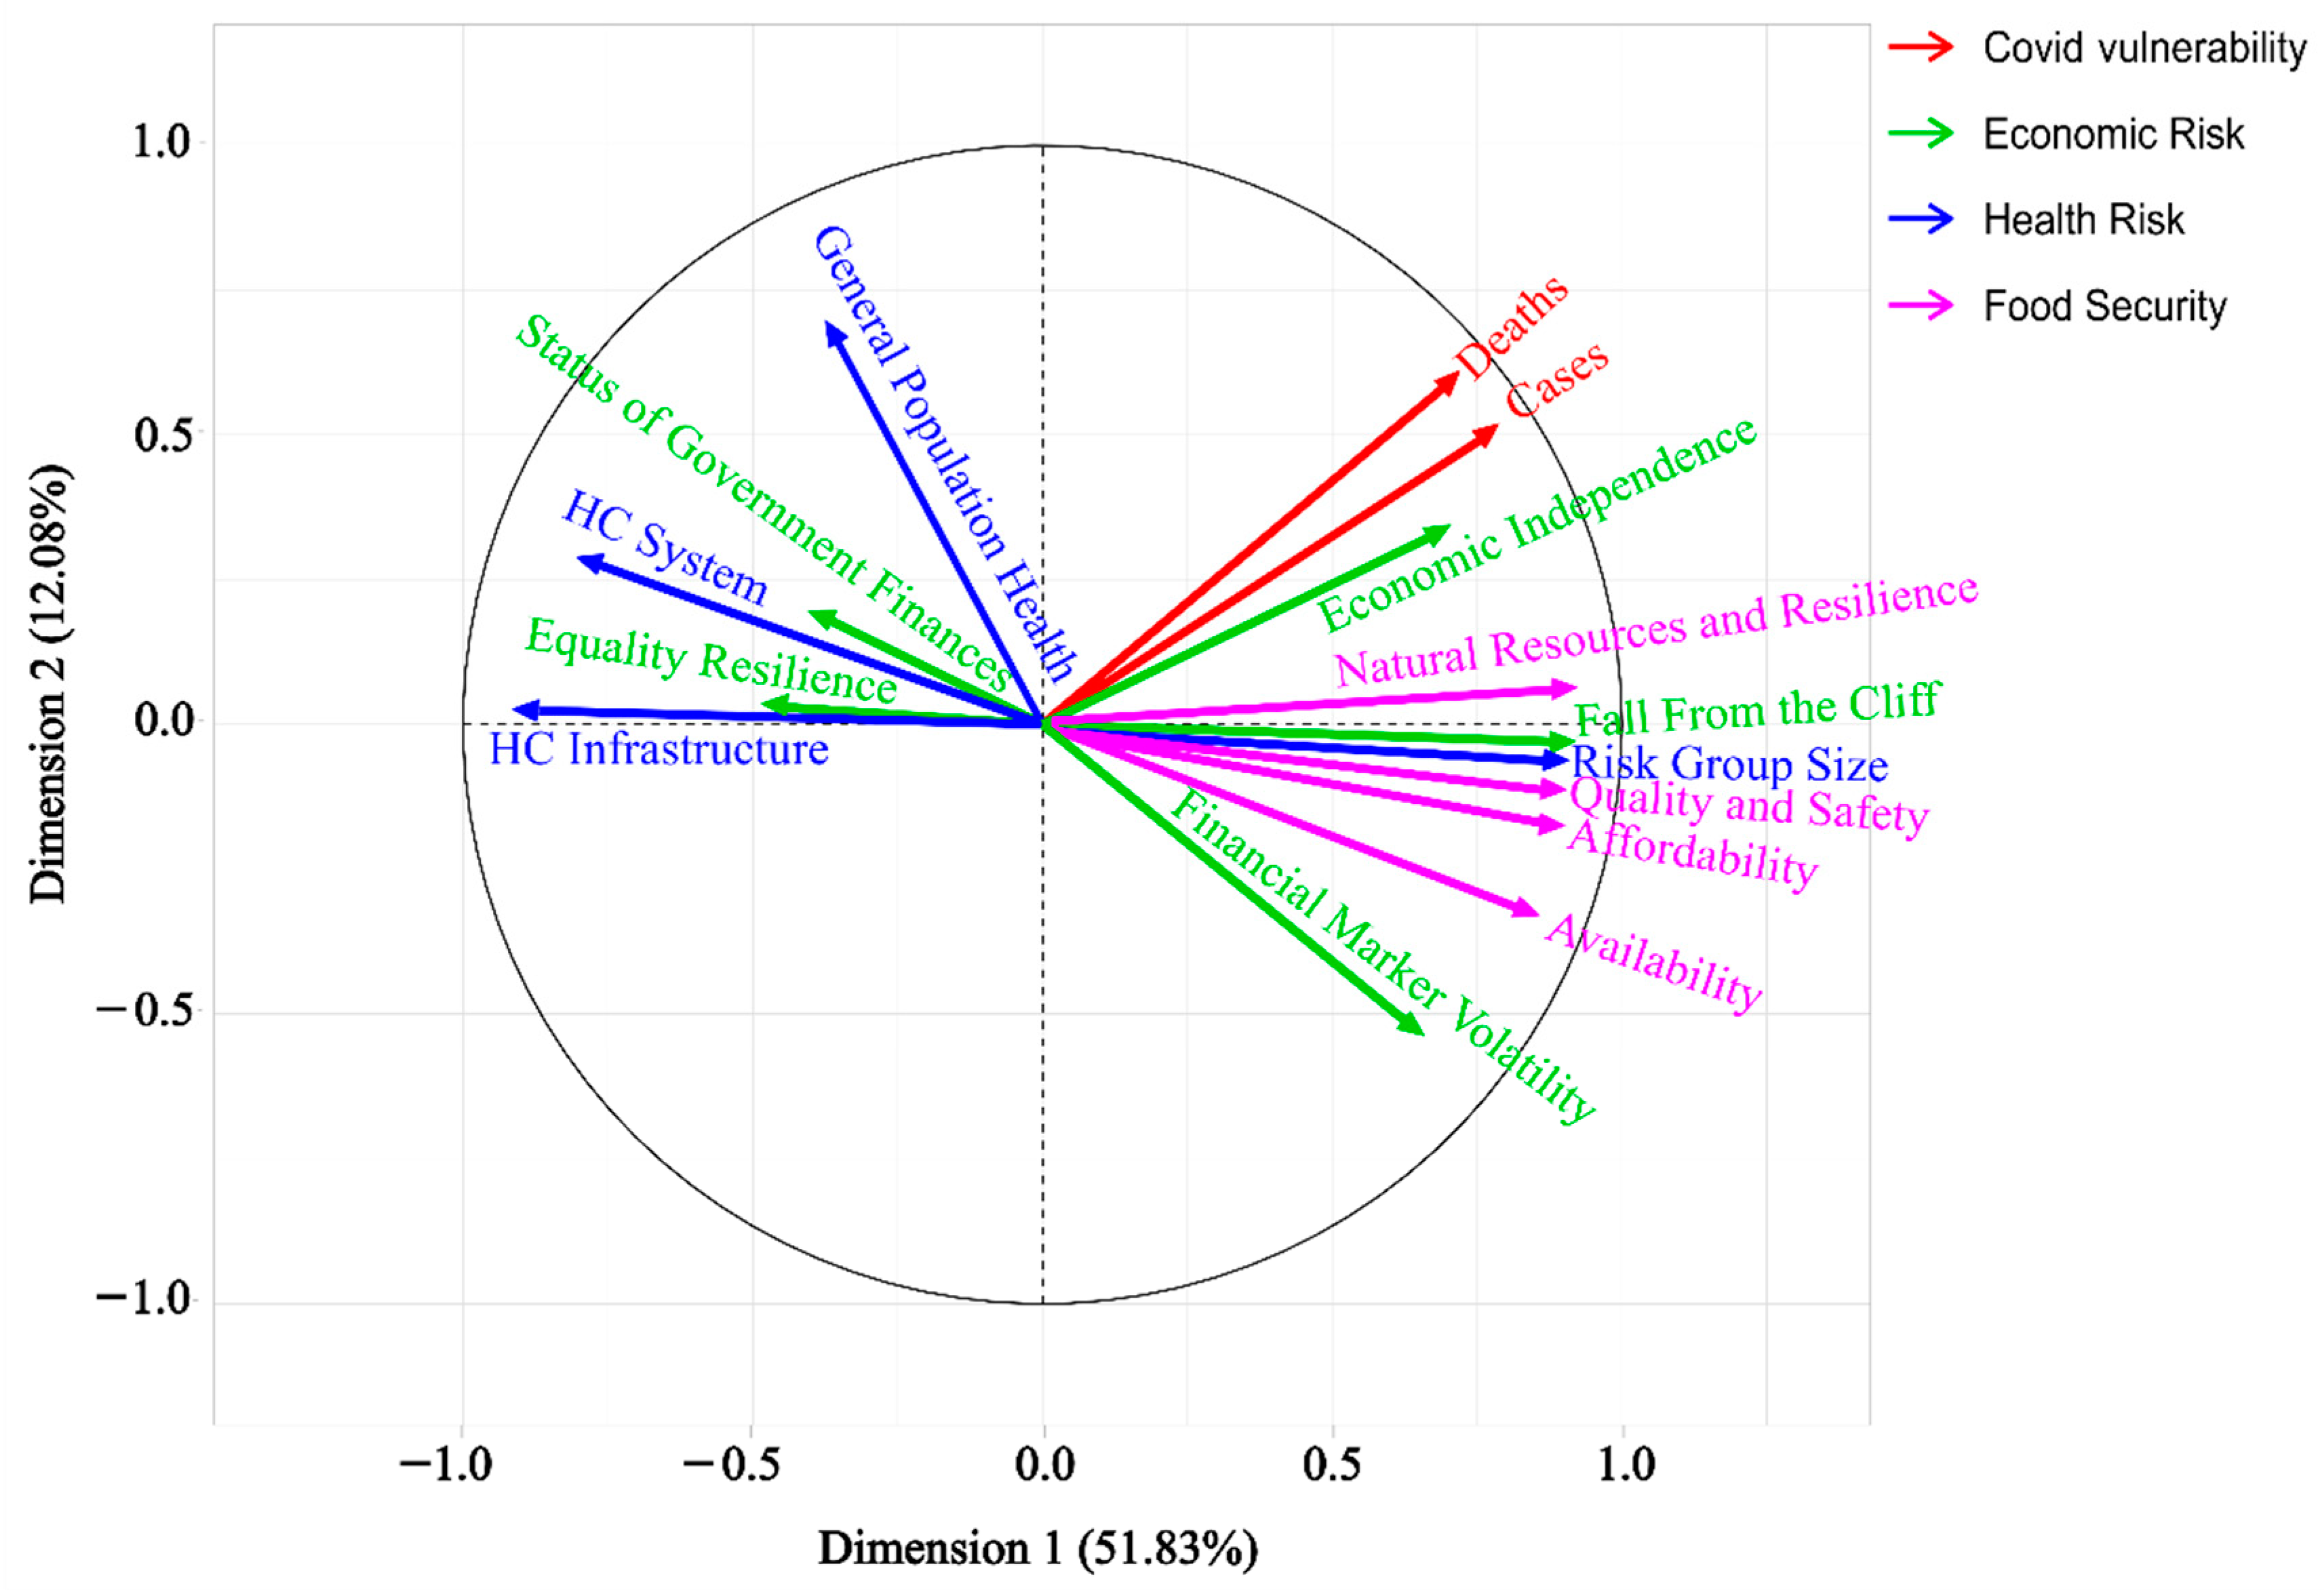
| Pillar | Variables | Description | Measurement | Source |
|---|---|---|---|---|
| Economic Risk | Economic Independence | Dependency on imports/exports, employment in service and agricultural sectors, as well as innovation capabilities | (1–5) 1—least | [23] |
| Fall from the Cliff | A potential 10% reduction in GDP is significantly higher in absolute terms in high-income countries. | (1–5) 1—least | ||
| Equality Resilience | Internal inequality measurements (income and asset share hold by the lowest 20%, 40% and 60%) | (1–5) 1—least | ||
| Status of Government Finance | The current state of government debt and interest payments | (1–5) 1—least | ||
| Financial Markets Volatility | Private and corporate debt, as dependency on stock markets (measured as the value of stock and annual stock turnover) | (1–5) 1—least | ||
| Health Risk | HC (Health Care) Infrastructure | Availability of HC infrastructure (number of beds, doctors and nurses per capita; mortality rate from non-communicable diseases) | (1–5) 5—worst | [23] |
| HC System | HC spending per capita, out-of-pocket affordability for the lower-income segment, government share on spending, the mortality rate of lifestyle diseases | (1–5) 5—worst | ||
| Risk Group Size | Elderly population measured by the percentage of the population over age 65, 50, and 40 | (1–5) 5—eldest | ||
| General Population Health | Life expectancy, mortality rates due to air pollution, and general fitness level measured through average standardised body-mass-index | (1–5) 5—worst | ||
| Global Food Security | Affordability | The ability of consumers to purchase food, their vulnerability to price shocks and the presence of policies to support them | Score (0–100) 100 = best | [24] |
| Availability | The availability ensures sufficient food supply, low risk of supply disruption, and high national capacity to disseminate food and research efforts to expand agricultural output. | Score (0–100) 100 = best | ||
| Quality and Safety | Variety and nutritional quality of average diets and the safety of food | Score (0–100) 100 = best | ||
| Natural Resources and resilience | Exposure to the impacts of climate change; its susceptibility to natural resource risks; and how the country is adapting to these risks | Score (0–100) 100 = best | ||
| COVID Vulnerability | Deaths | Total number of deaths per 1 million residents from the first case (2019) till 18/04/2021 | capita/thousand | [25] |
| Cases | Total number of infections per 1 million residents from the first case (2019) till 18/04/2021 | number of cases/million |
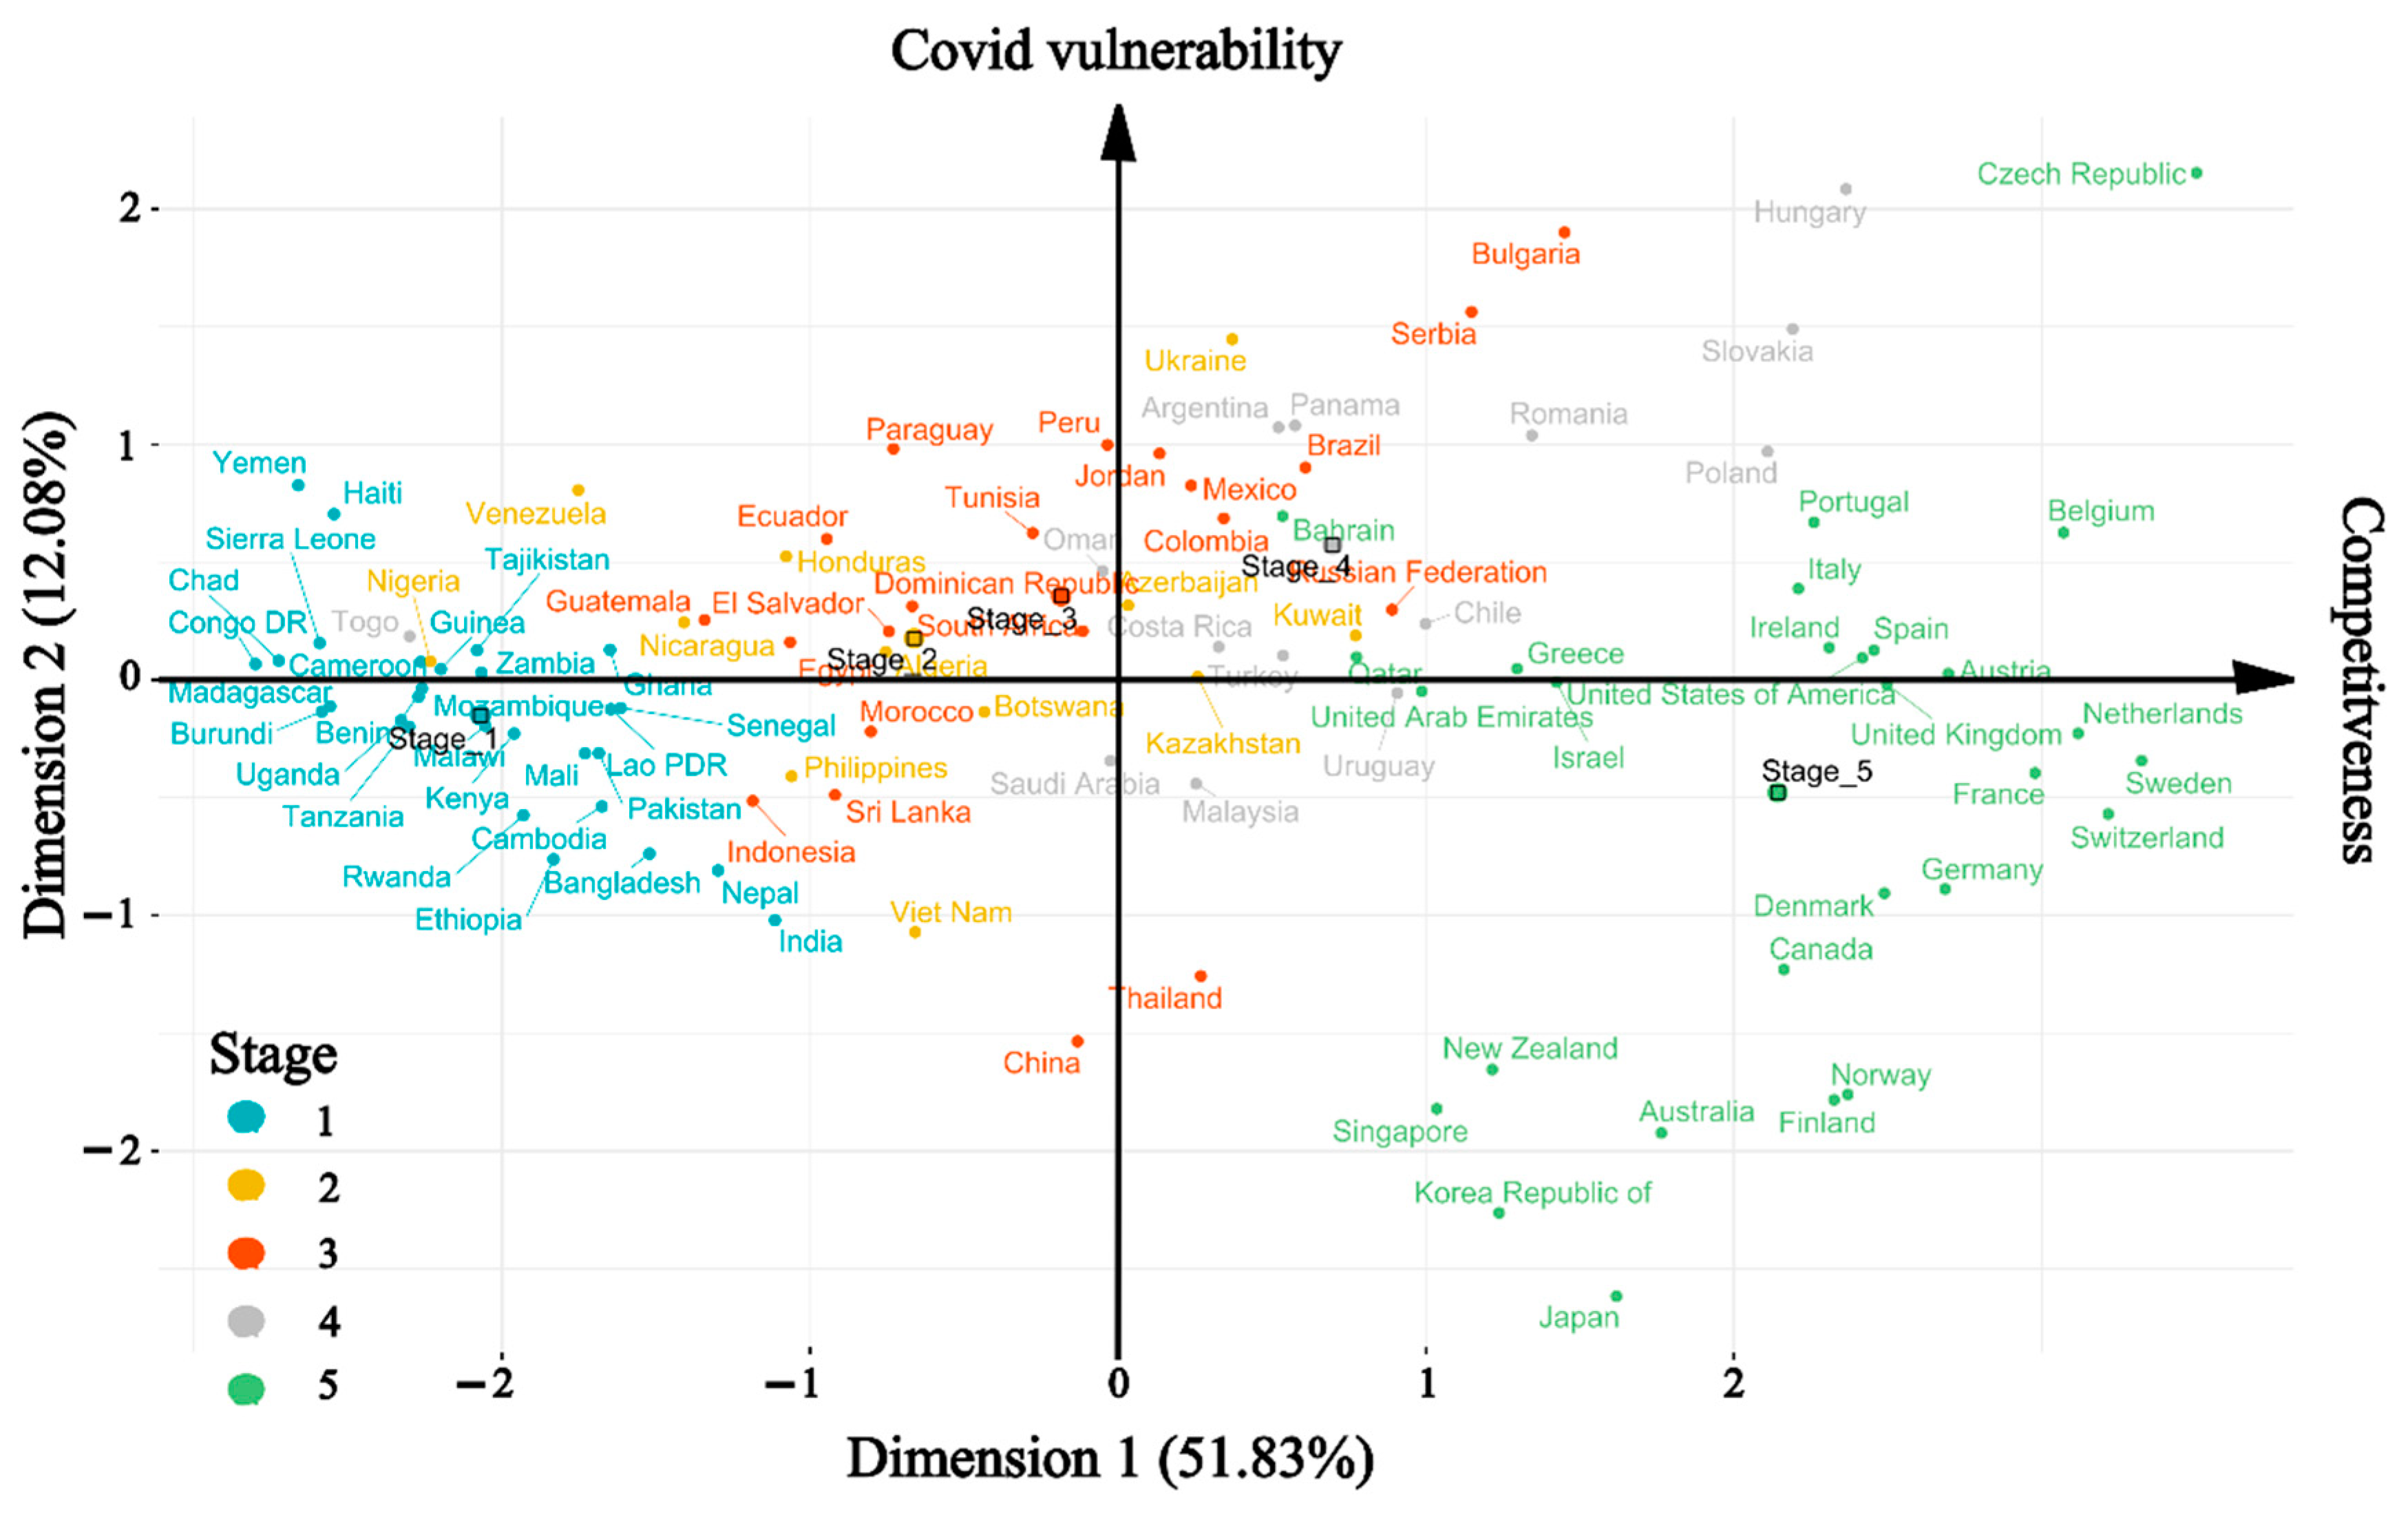
| Type | Rank | Country | COVID | Country | Economic Risk | Country | Health Risk | Country | Food Security |
|---|---|---|---|---|---|---|---|---|---|
| Best | 1 | Bahrain | −1.66 | Tanzania | −2.99 | Japan | −2.21 | Finland | 2.84 |
| 2 | Israel | −1.28 | Uganda | −2.85 | Singapore | −2.21 | Ireland | 2.74 | |
| 3 | Qatar | −1.28 | Burundi | −2.76 | South Korea | −1.99 | Sweden | 2.71 | |
| 4 | Serbia | −1.14 | Chad | −2.6 | Viet Nam | −1.73 | Norway | 2.67 | |
| 5 | Kuwait | −0.89 | Congo DR | −2.38 | Cambodia | −1.57 | Switzerland | 2.62 | |
| 6 | United Arab Emirates | −0.86 | Madagascar | −2.35 | Bangladesh | −1.44 | Denmark | 2.57 | |
| 7 | Netherlands | −0.71 | Nigeria | −2.35 | India | −1.43 | Netherlands | 2.46 | |
| 8 | Turkey | −0.59 | Rwanda | −2.29 | Ethiopia | −1.21 | Canada | 2.42 | |
| 9 | Jordan | −0.56 | Cameroon | −2.29 | Rwanda | −1.21 | USA | 2.42 | |
| 10 | Sweden | −0.47 | Malawi | −2.29 | Nepal | −1.03 | Austria | 2.41 | |
| Worst | 10 | South Africa | 0.42 | South Korea | 2.12 | Azerbaijan | 1.28 | Guinea | −2.35 |
| 9 | Brazil | 0.44 | Finland | 2.18 | Kazakhstan | 1.35 | Haiti | −2.47 | |
| 8 | United Kingdom | 0.59 | Denmark | 2.19 | Slovakia | 1.35 | Venezuela | −2.74 | |
| 7 | Slovakia | 0.65 | United Arab Emirates | 2.19 | South Africa | 1.36 | Burundi | −2.92 | |
| 6 | Ecuador | 0.65 | Australia | 2.2 | Hungary | 1.56 | Mozambique | −2.95 | |
| 5 | Italy | 0.67 | Belgium | 2.21 | Romania | 1.65 | Madagascar | −2.98 | |
| 4 | Peru | 0.72 | Germany | 2.35 | Serbia | 1.88 | Sierra Leone | −3.02 | |
| 3 | Hungary | 1.05 | Sweden | 2.55 | Bulgaria | 1.88 | Chad | −3.10 | |
| 2 | Bulgaria | 1.10 | Netherlands | 2.66 | Ukraine | 2.27 | Congo DR | −3.64 | |
| 1 | Mexico | 1.37 | Switzerland | 3.32 | Russian Federation | 2.32 | Yemen | −3.75 |
| Dimension | Explained Variance (%) | Bootstrap Simulation * (p-Value) | Split-Half Test * (p-Value) | LOO ** Validation for Observations (% of Variation) | LOO ** Validation for Variables (% of Variation) | ||
|---|---|---|---|---|---|---|---|
| Sample Size | |||||||
| n = 10 | n = 50 | n = 100 | |||||
| 1. | 51.8% | 0.722 | 0.916 | 0.940 | 0.841 | 3.6 | 3.5 |
| 2. | 12.1% | 0.102 | 0.384 | 0.600 | 0.220 | 2.0 | 5.7 |
| 3. | 9.6% | 0.614 | 0.992 | 0.952 | 0.656 | 4.6 | 6.8 |
| Pillars | Stages | Sum of Squares | df | Mean Square | F | Sig. |
|---|---|---|---|---|---|---|
| Economic risk | Between | 181.149 | 4 | 45.287 | 63.298 | <0.001 |
| Within | 70.116 | 98 | 0.715 | |||
| Total | 251.264 | 102 | ||||
| Levene Test | 0.984 | 0.420 | ||||
| Health risk | Between | 20.224 | 4 | 5.056 | 8.513 | <0.001 |
| Within | 58.201 | 98 | 0.594 | |||
| Total | 78.425 | 102 | ||||
| Levene Test | 1.014 | 0.404 | ||||
| Food security | Between | 229.909 | 4 | 57.477 | 87.984 | <0.001 |
| Within | 64.021 | 98 | 0.653 | |||
| Total | 293.930 | 102 | ||||
| Levene Test | 0.659 | 0.622 | ||||
| COVID | Between | 2.294 | 4 | 0.573 | 3.324 | 0.013 |
| Within | 16.906 | 98 | 0.173 | |||
| Total | 19.200 | 102 | ||||
| Levene Test | 6.758 | <0.001 |
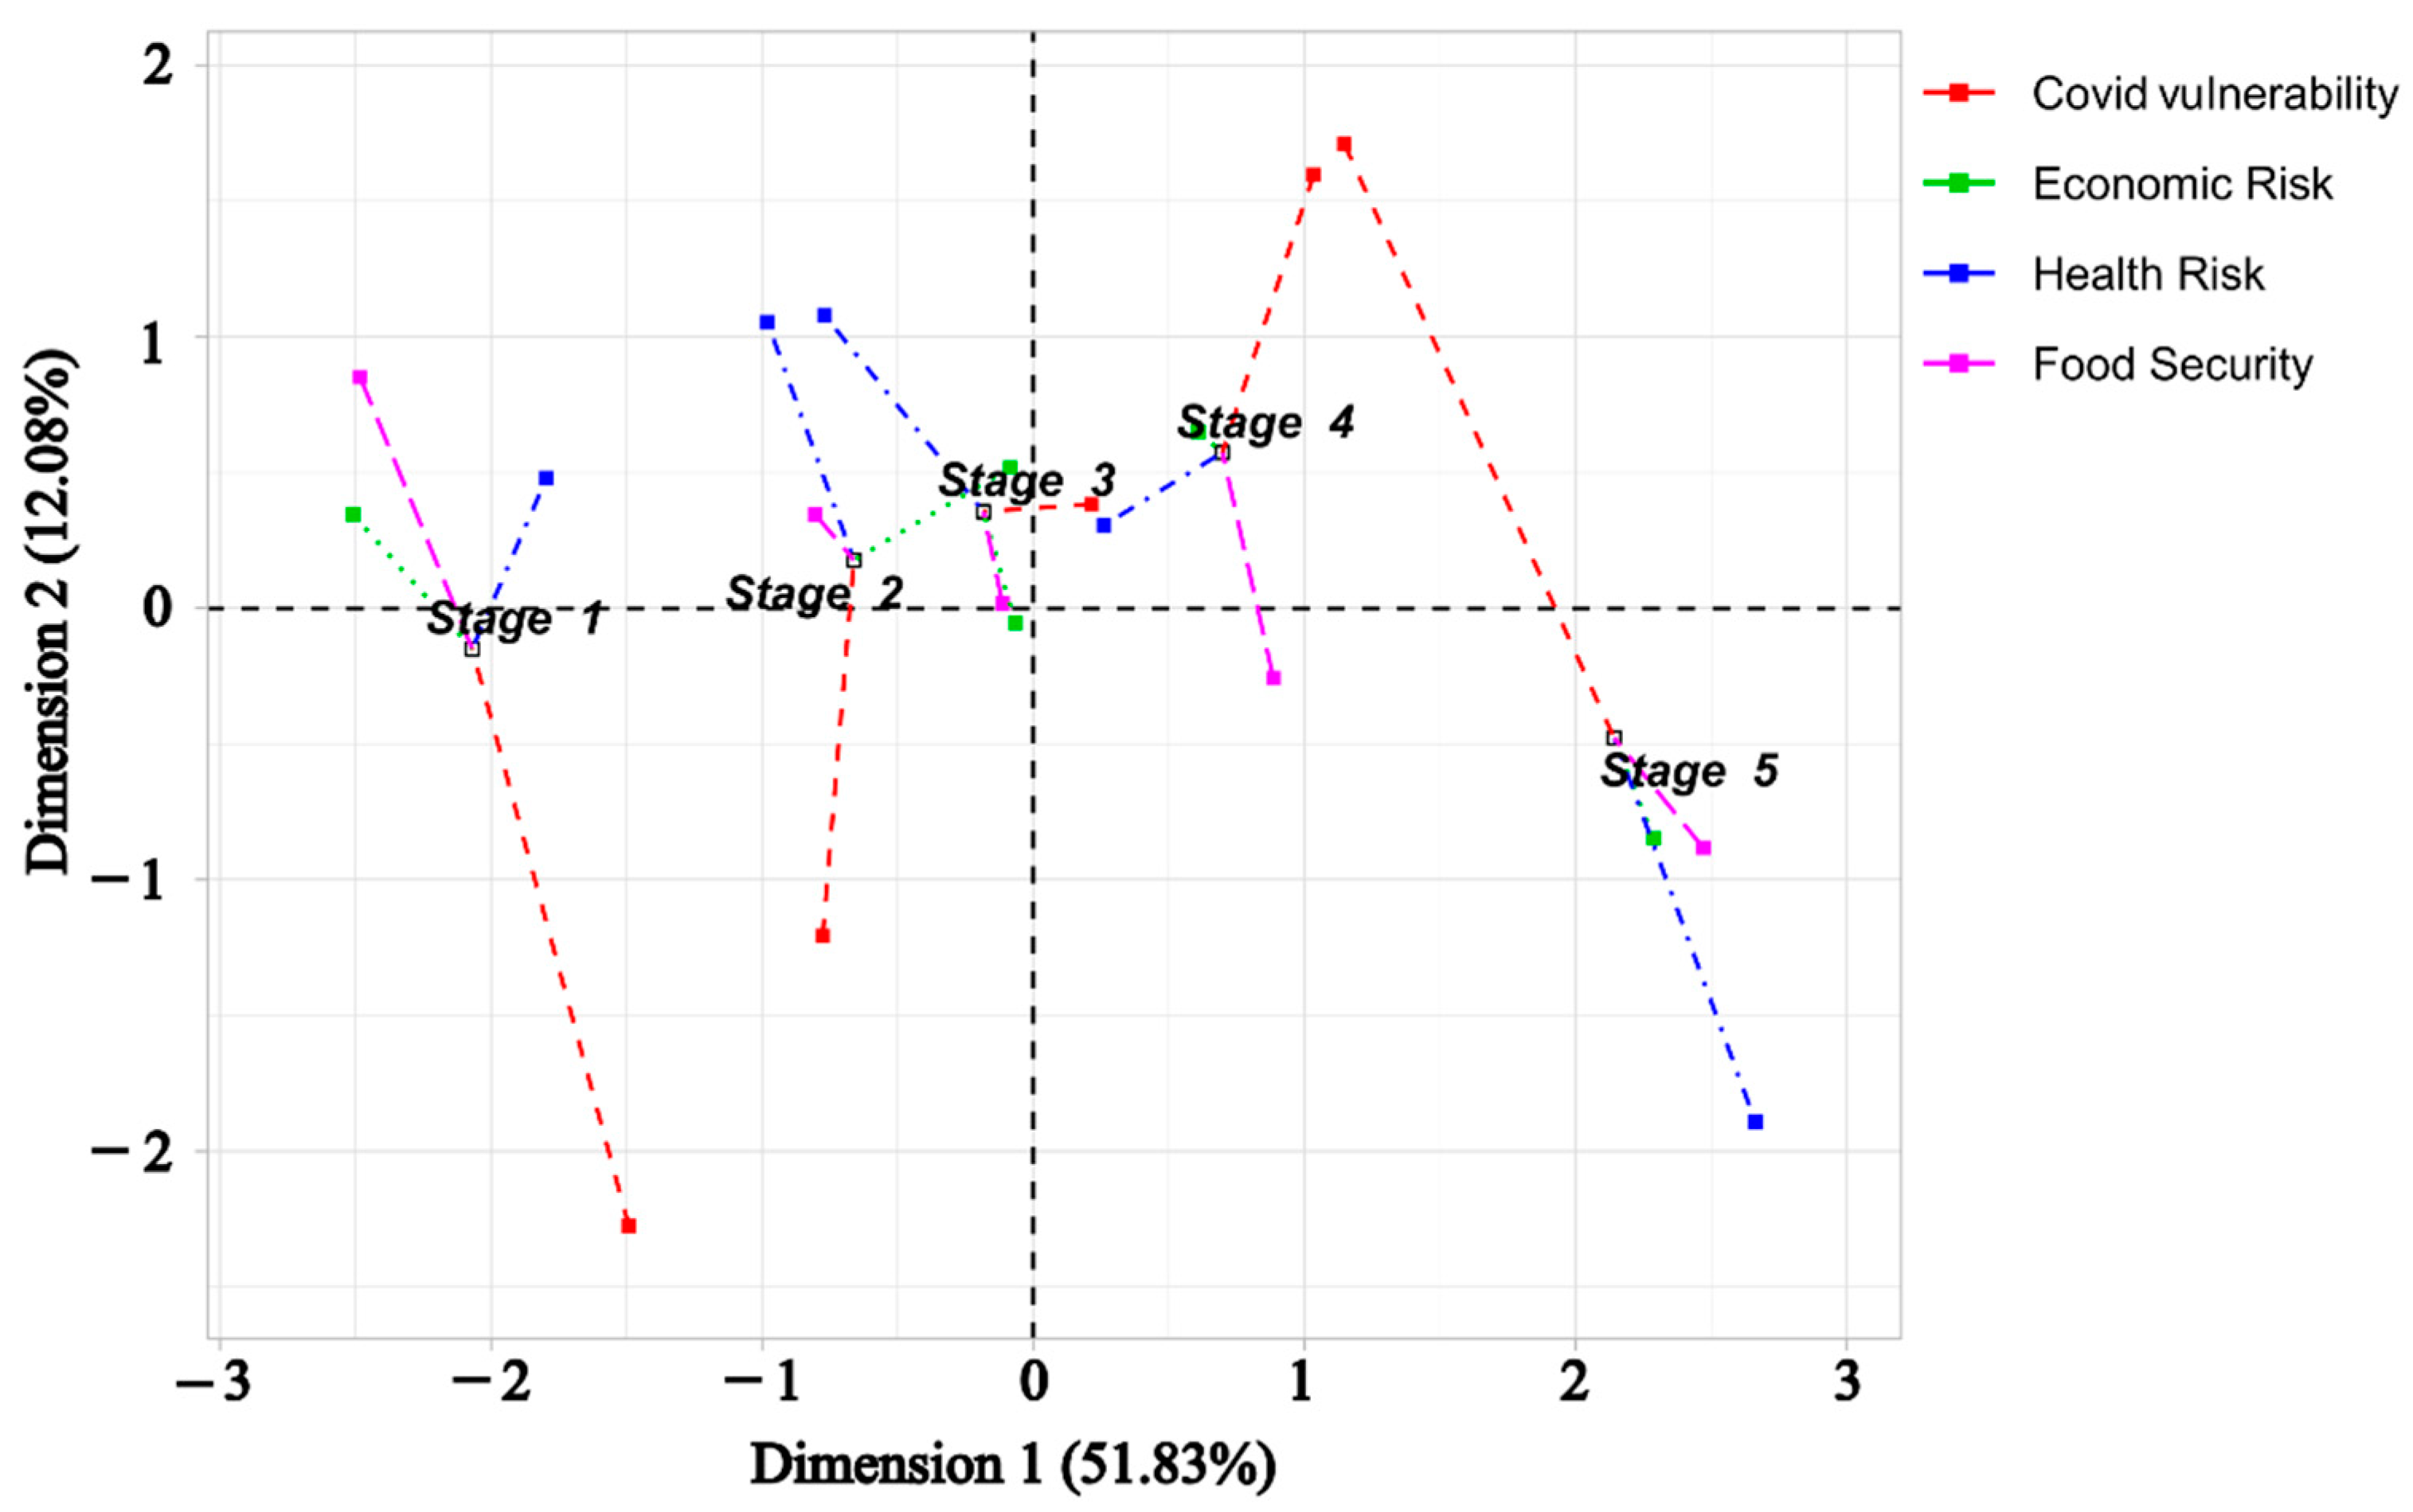
| Stages/Pillars | Economic Risk | Health Risk | Food Security | COVID |
|---|---|---|---|---|
| 1 | −1.90 | −0.54 | −1.98 | 0.05 |
| 2 | −0.02 | 0.42 | −0.64 | −0.06 |
| 3 | 0.04 | 0.53 | −0.08 | 0.22 |
| 4 | 0.42 | 0.42 | 0.70 | 0.04 |
| 5 | 1.67 | −0.24 | 1.96 | −0.21 |
Publisher’s Note: MDPI stays neutral with regard to jurisdictional claims in published maps and institutional affiliations. |
© 2021 by the authors. Licensee MDPI, Basel, Switzerland. This article is an open access article distributed under the terms and conditions of the Creative Commons Attribution (CC BY) license (https://creativecommons.org/licenses/by/4.0/).
Share and Cite
Kovács, S.; Rabbi, M.F.; Máté, D. Global Food Security, Economic and Health Risk Assessment of the COVID-19 Epidemic. Mathematics 2021, 9, 2398. https://doi.org/10.3390/math9192398
Kovács S, Rabbi MF, Máté D. Global Food Security, Economic and Health Risk Assessment of the COVID-19 Epidemic. Mathematics. 2021; 9(19):2398. https://doi.org/10.3390/math9192398
Chicago/Turabian StyleKovács, Sándor, Mohammad Fazle Rabbi, and Domicián Máté. 2021. "Global Food Security, Economic and Health Risk Assessment of the COVID-19 Epidemic" Mathematics 9, no. 19: 2398. https://doi.org/10.3390/math9192398