Article

Automatic Superpixel-Based Clustering for Color Image Segmentation Using q-Generalized Pareto Distribution under Linear Normalization and Hunger Games Search

by
Mohamed Abd Elaziz
1,
Esraa Osama Abo Zaid
2,3,
Mohammed A. A. Al-qaness
4,* and
Rehab Ali Ibrahim
1,5
1
Department of Mathematics, Faculty of Science, Zagazig University, Zagazig 44519, Egypt
2
Department of Mathematics, Faculty of Science, Seuz University, Suez 41522, Egypt
3
Academy of Scientic Research and Technology (ASRT) of the Arab Republic of Egypt, Cairo 11516, Egypt
4
State Key Laboratory for Information Engineering in Surveying, Mapping and Remote Sensing, Wuhan University, Wuhan 430079, China
5
Hubei Engineering Research Center on Big Data Security, School of Cyber Science and Engineering, Huazhong University of Science and Technology, Wuhan 430074, China
*
Author to whom correspondence should be addressed.
Mathematics 2021, 9(19), 2383; https://doi.org/10.3390/math9192383
Submission received: 11 August 2021 / Revised: 16 September 2021 / Accepted: 18 September 2021 / Published: 25 September 2021

Abstract

:
Superixel is one of the most efficient of the image segmentation approaches that are widely used for different applications. In this paper, we developed an image segmentation based on superpixel and an automatic clustering using q-Generalized Pareto distribution under linear normalization (q-GPDL), called ASCQPHGS. The proposed method uses the superpixel algorithm to segment the given image, then the Density Peaks clustering (DPC) is employed to the results obtained from the superpixel algorithm to produce a decision graph. The Hunger games search (HGS) algorithm is employed as a clustering method to segment the image. The proposed method is evaluated using two different datasets, collected form Berkeley segmentation dataset and benchmark (BSDS500) and standford background dataset (SBD). More so, the proposed method is compared to several methods to verify its performance and efficiency. Overall, the proposed method showed significant performance and it outperformed all compared methods using well-known performance metrics.

1. Introduction

Image Segmentation is a key component of various computer vision applications. It aims to divide a given image into perceptual regions, in which pixels in each region belong to a same visual object with small feature variations. Image segmentation approaches have been widely implemented in various applications, such as object detection [1,2], remote sensing images [3,4], medical images [5], agriculture image [6] and many other applications.
One of the most effective segmentation methods is called superpixel segmentation, which implements an over-segmentation on input images. The process of superpixel segmentation is to divide a given image into small, compact and regular regions, that contain pixels with similar texture, spatial positions brightness, color, and so on [7]. In contrast to other segmentation approaches, in general superpixel has strong boundary coherence and it is easy to control the produced segments [7]. Therefore, superpixel segmentation approach has received wide attentions and have been adopted in different applications, such as object tracking [8,9], boundary detection [10], object detection [11], and others [12,13,14,15,16].
Earlier, various methods have been adopted for image segmentation with superpixels. Levinshtein et al. [17] proposed a geometric flow algorithm depending on the local gradient of the image to initiate superpixels with uniform sizes and compactness. In [18], a method called USEQ was proposed for superpixel extraction. The spatial and color information were utilized to represent pixels and superpixels, and to reduce computational cost. After that they adopted a maximum posteriori estimation to generate superpixels. Di et al. [19] proposed a superpixel image segmentation method using a hierarchical multi-level segmentation scheme. They applied simple liner iterative clustering approach to segment the input image, and then they applied simple liner iterative clustering to further segment the generated superpixels. Finally, adjacent superpixels are merged depending on probability distribution similarity. More so, different images were considered to evaluate the proposed method, including Berkeley and 3Dircadb datasets. In literature, different machine learning and deep learning approaches have been adopted with superpixels for image segmentations. For example, in [20], superpixels method based on the unsupervised learning technique was employed for oropharyngeal cancer image segmentation. Mi and Chen [21] presented a superpixel-enhanced Deep Neural Forest (DNF) for semantic segmentation of remote sensing images. The DNF was developed to enhance classification accuracy, and a Superpixel-enhanced Region Module was developed to reduce noise. Huang and Ding [22] developed a generic image segmentation algorithm using the properties of a fully convolutional network and superpixels. Most recently, metaheuristic optimization algorithms also have been adopted in a few studies for superpixel segmentation, and they showed prominent performance. For example, Mittal and Saraswat [23] applied a modified gravitational search algorithm with superpixel clustering for nuclei segmentation. Moreover, Chakraborty and Mali [24] proposed superpixel based image segmentation for COVID-19 CT scan images using a modified flower pollination algorithm (FPA) with type 2 fuzzy clustering.
In general, the superpixel image segmentation based on clustering techniques have been established their performance in comparison with the other image segmentation methods. However, the main drawbacks of these clustering image segmentation method is the process of determine the number of clusters and their cluster centers. To tackling this limitation, several automatic clustering image segmentation have been developed. For example, the automatic fuzzy clustering method is presented in [25]. It is depends on using Density peaks clustering (DPC) to determine the number of clusters. In, authors presented a robust self-sparse fuzzy clustering and applied it to segmented the image using clustering techniques. These methods provided results better than those methods that required to determine the number of clusters.
However, these methods have some limitations that influence on its quality and still require more enhancements. For example, they are use the traditional DPC that depends on the linear generalized extreme value (GEV) distribution [26] to determine the cluster center. This traditional GEV is not more accurate since the estimation of the distribution based on extracted blocks maxima, considered by this approach, involves a loss of information.
Therefore, this motivated us to propose an alternative clustering method based on modified DPC using q-Generalized Pareto distribution under linear normalization (q-GPDL). In addition, using the Hunger Games Search (HGS) [27] to determine the cluster centers. HGS was inspired by the social animals’ characteristics in searching for food. For each iteration, the HGS searches for an optimal location, similar to animals forage, and hunger values or weights simulate the impact of animals’ hunger. It was evaluated with different optimization problems, and it achieved prominent performance compared to other swarm intelligence and MH algorithms.
In this study, we propose superpixel-Based automatic clustering method for color image segmentation. The developed method, named ASCQPHGS, starts by applying superpixel algorithm to presegmented the image. Followed by using the modified DPC based on GEVL to automatic determine the number of clusters. Then, the HGS generates a set of solutions and each of them represents the clustering centers. To evaluate the quality of each solution, the fitness function that uses CS-index is computed and the best of them is determined. The next process is to update the solutions using the operators of HGS and check the stop conditions and in case they are met then the best solution is used to segmented the image and compute the performance measures.
Therefore, the summary of the main contributions and novelty of this study are:
  • Proposed an superpixel-based automatic clustering method and applied it for color image segmentation.
  • Present an extension for Generalized Pareto distribution under linear normalization (GPDL), named q-GPDL. In addition, deduce its quantile function and estimate its parameters using Maximum Likelihood Estimation.
  • Improve the behavior of DPC by using q-GPDL.
  • Apply Hunger Games Search (HGS) as clustering method to determine the center of each cluster then segmented the image.
  • Evaluate the performance of the developed method using real-world datasets and compared it with other MH techniques and state-of-the-art methods.
The rest of this study is introduced as: In Section 2, preliminaries of Clustering problem formulation for image segmentation, q-Generalized Pareto distribution under linear normalization, and Hunger Games Search are introduced. Section 3 presents the proposed automatic superpixel clustering method for color image segmentation, and Section 4 introduces the comparison results and discussion of the developed method with other methods. Section 5 presents the conclusion and future work of this study.

2. Background

2.1. Clustering Problem Formulation for Image Segmentation

With this section, the general formulation of the automatic clustering (AC) problem for image segmentation is introduced. The AC is defined as the process of dividing the image (I), which contains N X samples, into different K m a x clusters. This can be performed by maximizing the between-cluster variation simultaneous with minimizing the within-cluster variation [28].
So, the mathematical definition of AC problem can be formulated by assuming the image I contains N X samples X = [ X 1 , X 2 , , X N X ] . In addition, X i = [ X i 1 , X i 2 , , X i D ] where D is the total number of pixels. Then clustering approach aims to divid X into K m a x cluster (i.e., C 1 , C 2 , , C K m a x ) subject to [28]:
l = 1 K m a x C l = X , C l ϕ , l = 1 , , K m a x
C l C l 1 = ϕ , l , l 1 = 1 , 2 , , K m a x , l l 1
Density Peaks clustering (DPC) [29] is one of the most popular clustering techniques that can be used to solve different cluster problems. The main goal of DPC is to find the points that have the largest peaks of density. DPC assumes the cluster centers are those points that have density higher than others in their neighbors. As well as, the distance between the clustering centers is larger than the distance between them and other points.
The mathematical representation of DPC is given as: consider the given image (data) X = [ X 1 , X 2 , , X n ] (where n is the number of samples belongs to X). The DPC starts by calculating the distance ( d i j ) between X i and X j ( i , j = 1 , 2 , , n , and i j ). Then calculate the density ρ i of X i as:
ρ i = i = 1 N ξ d i j d c ,
where d c is the cut-off distance and ξ is the kernel function which defined as:
ξ ( β ) = 1 , β > 0 0 , o t h e r w i s e ,
where β represents the parameter of ξ function. The next process is find the minimum distance ( δ i ) as:
δ i = m i n j : ρ j > ρ i ( d i j ) , ρ j > ρ i m a x j ( d i j ) , o t h e r w i s e ,
From Equations (3) and (5), the clustering centers are those pixels that have high ρ and large δ . In addition, DPC has ability to avoid limitations of other techniques when the one cluster has two pixels that have high ρ with a small distance between them. Actually, the lead to divide the cluster into sub-clusters. So, DPC using the following formula to avoid this situation by considering the clustering centers are those have higher θ value than other pixels.
θ = min ρ * , δ *
where
ρ * = ρ ρ m i n ρ m a x ρ m i n , δ * = δ δ m i n δ m a x δ m i n

2.2. Generalized Pareto Distribution under Linear Normalization (GPDL)

For extreme order statistics, the maximum of independent and identically distributed (i.i.d) random variables has one of the three types: Frichet type with heavy tail, Gumbel type, whose upper tail, and Weibull type with finite upper tail.
The generalized extreme value (GEVL) is a generalized family of the Gumbel, Frichet and Weibull depends on only one and it is formulated as:
H ( x ; k , σ , μ ) = exp { ( 1 + k ( x μ σ ) ) 1 k } , ( 1 + k ( x μ σ ) ) > 0
In Equation (8), k , σ and μ denote the shape, scale and location parameter, respectively.
GEVL in Equation (8) has been applied to find the value of threshold to determine the optimal number of clustering centers. This main aim of this process is to enhance the quality of image segmentation [5].
Provost et al. [30] introduced the Cumulative Distribution Functions (cdf) and Probability Density Functions (pdf) of the q-GEVL and q-Gumbel (by setting ξ 0 in the q-GEVL) are defined as in Equations (9) and (10), respectively:
G ( x ; μ , σ , k , q ) = [ 1 + q ( k ( s x m ) + 1 ) 1 k ] 1 q , k 0 , q 0 ( 1 + q e ( s x m ) ) 1 q , k 0 , q 0
and
g ( x ; μ , σ , k , q ) = s ( 1 + k ( s x m ) ) 1 k 1 × [ 1 + q ( k ( s x m ) + 1 ) 1 k ] 1 q 1 k 0 , q 0 ( 1 + q e ( s x m ) ) 1 q 1 s e ( s x m ) k 0 , q 0
where s = 1 σ and m = μ σ .
The generalized Pareto distribution under linear normalization (GPDL) is considered as a foremost pillar of the POT approach. The GPDL is the limit distribution of scaled excesses over high thresholds, which has the form 1 + log H ( x ; k , σ , μ ) .

2.3. Hunger Games Search

Hunger Games Search (HGS) is is a novel optimization algorithm enhanced by Yutao and Huiling [27].The algorithm emulates the animals conducts and hunger actions, where Hunger has the responsibility of one of the most crucial homeostatic motivations for decisions, behaviours, and actions in the life of animals.
HGS can be modeled as following, start with a population Z which has a number of solutions N for each of them, the objective function noted as F i t i as well as the finest solution noted as Z b . After initialization stage, modernization stage comes in which the previous solutions are modernized by utilizing the Equation (11), where through such stage, a cooperation among animals for reaching food is perfected.
Z ( t + 1 ) = Z t × 1 + r a n d , r 1 < l W 1 × Z b + R × W 2 × Z b Z t , r 1 > l , r 2 > E W 1 × Z b R × W 2 × Z b Z t , r 1 > l , r 2 < E
where in the previous equation, r 1 and r 2 exemplify arbitrary numbers in addition to r a n d which exemplifies random normal distribution. The parameter R represents a number updated in the interval [ a , a ] which is able to decide the searching interval where it depends on the entire iterations as:
R = 2 × s × r a n d s , s = 2 × 1 t T
In Equation (12), T is the number of iterations. E exemplifies a coefficient, clarified in Equation (11), which corresponds the variation control for X and defined as:
E = sech F i t i F i t b
where F i t b is the best fitness value and Sech denotes the hyperbolic function (i.e., sech x = 2 e x e x ).
Furthermore, W 1 and W 2 represent the weights of hunger clarified in Equations (14) and (15).
W 1 = H i × N S H × r 4 , r 3 < l 1 , r 3 > l
W 2 = 2 1 e ( | H i S H | ) × r 5
The parameters r 3 , r 4 and r 5 exemplifies arbitrary number in the range [0,1]. S H identifies the hungers feeling for all solutions sum given by:
S H = i H i
As well as, H i corresponds the hunger of each solution H i :
H i = 0 , F i t i = F i t b H i + H n , o t h e r w i s e
The coefficient F i t b corresponds the finest objective value and F i t i corresponds the fitness of current solution X i . In addition, H n represents a new hunger given as:
H n = L H × 1 + r , T H < L H T H , o t h e r w i s e
T H = 2 F i t i F i t b F i t w F i t b × r 6 × U B L B
In Equation (18), hunger sensation H is restricted with lower boundary ( L W ). The last parameter F i t w corresponds the worst objective value and r 6 [ 0 , 1 ] is arbitrary value corresponding to the negative or positive effects on hunger occurred by some factors. The steps of HGS are given in Algorithm 1.
Algorithm 1 Steps of HGS.
  1:
Insert the iterations number given by T , the solutions number given by N
  2:
initialize the population Z .
  3:
while   t T   do
  4:  
calculate the objective value for the solutions Z i .
  5:  
Identify the finest solution Z b , F i t b , F i t W
  6:  
Modernize the value of H i using Equation (17)
  7:  
Modernize W 1 and W 2 using Equations (14) and (15), respectively.
  8:  
for   i = 1 : N   do
  9:   
Modernize R using Equation (12).
  10:    
Modernize E using Equation (13).
  11:    
Update Z i using Equation (11).
  12:  
end for
  13:  
t = t + 1
  14:
end while
  15:
Get Z b

3. Proposed Method

In this section, we introduce the developed method for color image segmentation based on superpixel and automatic clustering using q-Generalized Pareto distribution under linear normalization (q-GPDL) and Hunger Games Search. However, in the beginning we introduces the modified version of Generalized Pareto distribution under linear normalization that named q-GPDL. Since, it has been used to improve the behavior of DPC algorithm.

3.1. q-Generalized Pareto Distribution under Linear Normalization (q-GPDL)

In this paper, we introduce the q G P D L which has the form 1 + log G ( x ; k , σ , μ , q ) . Then, the cdf and pdf of q G P D L are respectively:
Ψ ( x ; μ , σ , k , q ) = 1 + log [ 1 + q ( k ( s x m ) + 1 ) 1 k ] 1 q , k 0 , q 0 1 + log 1 + q e ( s x m ) ) 1 q , k 0 , q 0
and
ψ ( x ; μ , σ , k , q ) = s ( 1 + k ( s x m ) ) 1 k 1 1 + q ( k ( s x m ) + 1 ) 1 k k 0 , q 0 s e ( s x m ) 1 + q e ( s x m ) k 0 , q 0
where k is the shape parameter, μ is the threshold value and σ is the scale parameter.

3.1.1. The Quantile Function

The quantile function of the q G P D L ( k 0 ) and q G P D L ( k 0 ) can be readily formulated as:
x p = Ψ 1 ( q , k , σ , μ ) = σ k ( q k ( e q ( p 1 ) 1 ) k 1 ) + μ k 0 , q 0 σ log q e q ( 1 p ) 1 + μ k 0 , q 0
In Equation (22), p is the probability of quantile. So, the point x i is assumed to be a clustering center in the case the the following criteria is met.
θ > x ^ p

3.1.2. Maximum Likelihood Estimation (MLE)

To identify the parameters of the q-GPDL whose density functions are in Equation (21), one has to maximize log-likelihood function subject to its parameters. Suppose the observations x i , i = 1 , , n , so the log-likelihood of q-GPDL model is given by
( x ; μ , σ , k , q ) = n log σ ( 1 + 1 k ) i = 1 n log ( 1 + k ( x i μ σ ) ) i = 1 n log ( 1 + q ( k ( x i μ σ ) + 1 ) 1 k )
The system of the log-likelihood is given as:
μ = ( k + 1 ) i = 1 n 1 1 + A i q i = 1 n ( 1 + A i ) 1 1 k 1 + q ( 1 + A i ) 1 k = 0
σ = ( k + 1 ) i = 1 n A i 1 + A i q i = 1 n A i ( 1 + A i ) 1 1 k 1 + q ( 1 + A i ) 1 k n k = 0
k = i = 1 n log ( 1 + A i ) ( k + 1 ) i = 1 n A i 1 + A i
q i = 1 n ( 1 + A i ) 1 k ( log ( A i + 1 ) A i A i + 1 ) 1 + q ( 1 + A i ) 1 k = 0
and
q = i = 1 n ( 1 + A i ) 1 k 1 + q ( 1 + A i ) 1 k = 0
where A i = k ( x i μ σ ) in Equation (24).

3.2. Framework of the Developed ASCQPHGS Method

The stages of the developed method are given in Figure 1. First, the developed ASCQPHGS method performs a presegmentation for the given image using a superpixel algorithm since the time computational of using superpixel image is less than the using the pixel in original image. Then the DPC method is applied to the results obtained from superpixel algorithm to produce a decision-graph. The output of using decision-graph is two groups and those ones that have the largest ρ and δ are considered as centers of clustering. Finally, the proposed HGS as clustering method is used to segment the image. In this stage, HGS starts by producing a set of N agents which contains the cluster centers. Then the fitness value for each agent is computed and the best of them is determined. The next step is to update the agents using the operators of HGS as discussed in Section 2.3 until reached to the stop conditions. Thereafter, the best solution that represents the cluster center is used to segmented the image and the quality of segmented image is computed using different performance metrics.
The details of each stages of the developed ASCQPHGS as a image segmentation approach are given in the following.

3.2.1. Initial Stage

Within this stage, the developed methods starts by receiving the tested image (I). Then the DPC is applied since it performs clustering nearly in semiautomatic form and the number of clusters can be determined based on decision-graph (DG). However, the DPC produces similarity matrix with large size that leads to high computational cost and memory overflow, in addition to forget the spatial information of I. To tackling this problems, the superpixel methods can be used to reduce the similarity matrix since they have ability to maintain the structuring information and the texture of image. After that, the DPC based on QGEVL is used to automatically determine the number of cluster.
In the first step of this stage, we following [31] by applying the multiscale morphological gradient reconstruction based watershed transform (MMGRWT) as a superpixel algorithm, since it established its efficiency as discussed in [25]. The output of MMGRWT is an image superpixel matrix with smaller size than original image. The next step is to calculate the value of ρ using Equation (3) and the value of δ using Equation (5). The third step is to determine the value of θ as defined in Equation (6) based on the maximum likelihood approach to identify the the parameters of QGEVL using θ as input. Then the number of cluster centers ( K m a x ) are determined by using Equation (23).

3.2.2. Encoding of Solution in HGS

The HGS starts by setting the initial value for a set of N agents and each of them represent the cluster centers. For the input matrix ( S R N S × D ), that obtained from using superpixel algorithm, the dimension ( D X ) of each agent Z i is K m a x × D . Therefore, the encoding of each agent can be formulated as:
Z i = [ C i 1 , C i 2 , , C i K m a x ] = r a n d × ( U B i j L B i j ) + L B i j , j = 1 , 2 , , K m a x × D
where C i j is the jth cluster center of the solution i. For clarity, consider S R 2 (i.e., 2D dataset) and K m a x = 4 , and Z i = [ 15.8 , 11.1 , 3.5 , 9.3 , 2.4 , 5.7 , 12.3 , 8.9 ] . This indicates that the centers of the first cluster is (15.8, 11.1), second cluster is (3.5, 9.3), third cluster is (2.4, 5.7), and fourth cluster is (12.3, 8.9).

3.2.3. Compute Fitness Value

To compute the fitness value for each agent Z i Z , we using the CS-index ( C S I ) that defined as [32]:
C S I = 1 K m a x k = 1 K m a x 1 | C k | Z i C K max X j C k d ( Z i , X j ) 1 K m a x k = 1 K m a x min k , k k d ( C k , C k )
In Equation (30), | C k | denotes the total samples in C k . k = [ 1 , 2 , , K m a x ] denotes the index of cluster center that doesn’t equal to k.

3.2.4. Update Population

The first step in this phase, is to find the best agent Z b that has the smallest C S I . Then using the operators of HGS to update the value of agents Z as given in Algorithm 2. The steps of updating the agents are repeated gain till reached to the terminal conditions and returning Z b . Thereafter, image is segmented based on the value of Z b and the quality of segmentation is computed using different the performance measures.
Algorithm 2 Steps of developed ASCQPHGS clustering for color segmentation.
  1:
Insert the color image I, determine total number of iterations T , total number of solutions N
  2:
Apply the superpixel MMGRWT algorithm to reduce the size of original image I.
  3:
Compute the value of ρ using Equation (3) and δ using Equation (5).
  4:
Determine the value of θ using Equation (6) and the MLE to identify the parameters of QGEVL using θ as input.
  5:
Determine the number of clusters ( K m a x ) using Equation (23).
  6:
Generate population Z according to ( K m a x ) as defined in Equation (29).
  7:
t = 1
  8:
while   t T   do
  9:  
Compute fitness value for Z i , i = 1 , 2 , , N as defined in Equation (30).
  10:   
Find the finest solution Z b , which has the smallest F i t b and determine the worst fitness F i t W .
  11:   
Update H i using Equation (17)
  12:   
Update W 1 and W 2 using Equations (14) and (15), respectively.
  13:   
Update Z i using Equation (11)
  14:   
t = t + 1
  15:
end while
  16:
Return Z b
  17:
Segment I based on Z b and compute the performance.

4. Experimental and Results

To evaluate the performance of the developed method, a set of different MH techniques are used in the comparison. For example, Slime mould algorithm (SMA) [33], Barnacles mating optimizer (BMO) [34], atom search optimization (ASO) [35], ASO based on particle swarm optimization (ASOPSO) [36], Hunger games search (HGS) [37]. In addition, the automatic fuzzy clustering framework (FCM) [25], and Density Peaks clustering (DPC) [29]. In addition, we compare the results of developed method with the modified version of FCM and DPC using the QGEV and this modifications given as FCMQGPDL and DPCQGPDL, respectively. The parameter setting of these algorithms depends on the original implementation of each of them. In addition, there are three parameters for FCM namely maximal number of iterations (is 50), minimal error threshold ( 10 5 ) and the weighting exponent (is 2).

4.1. Datasets Description

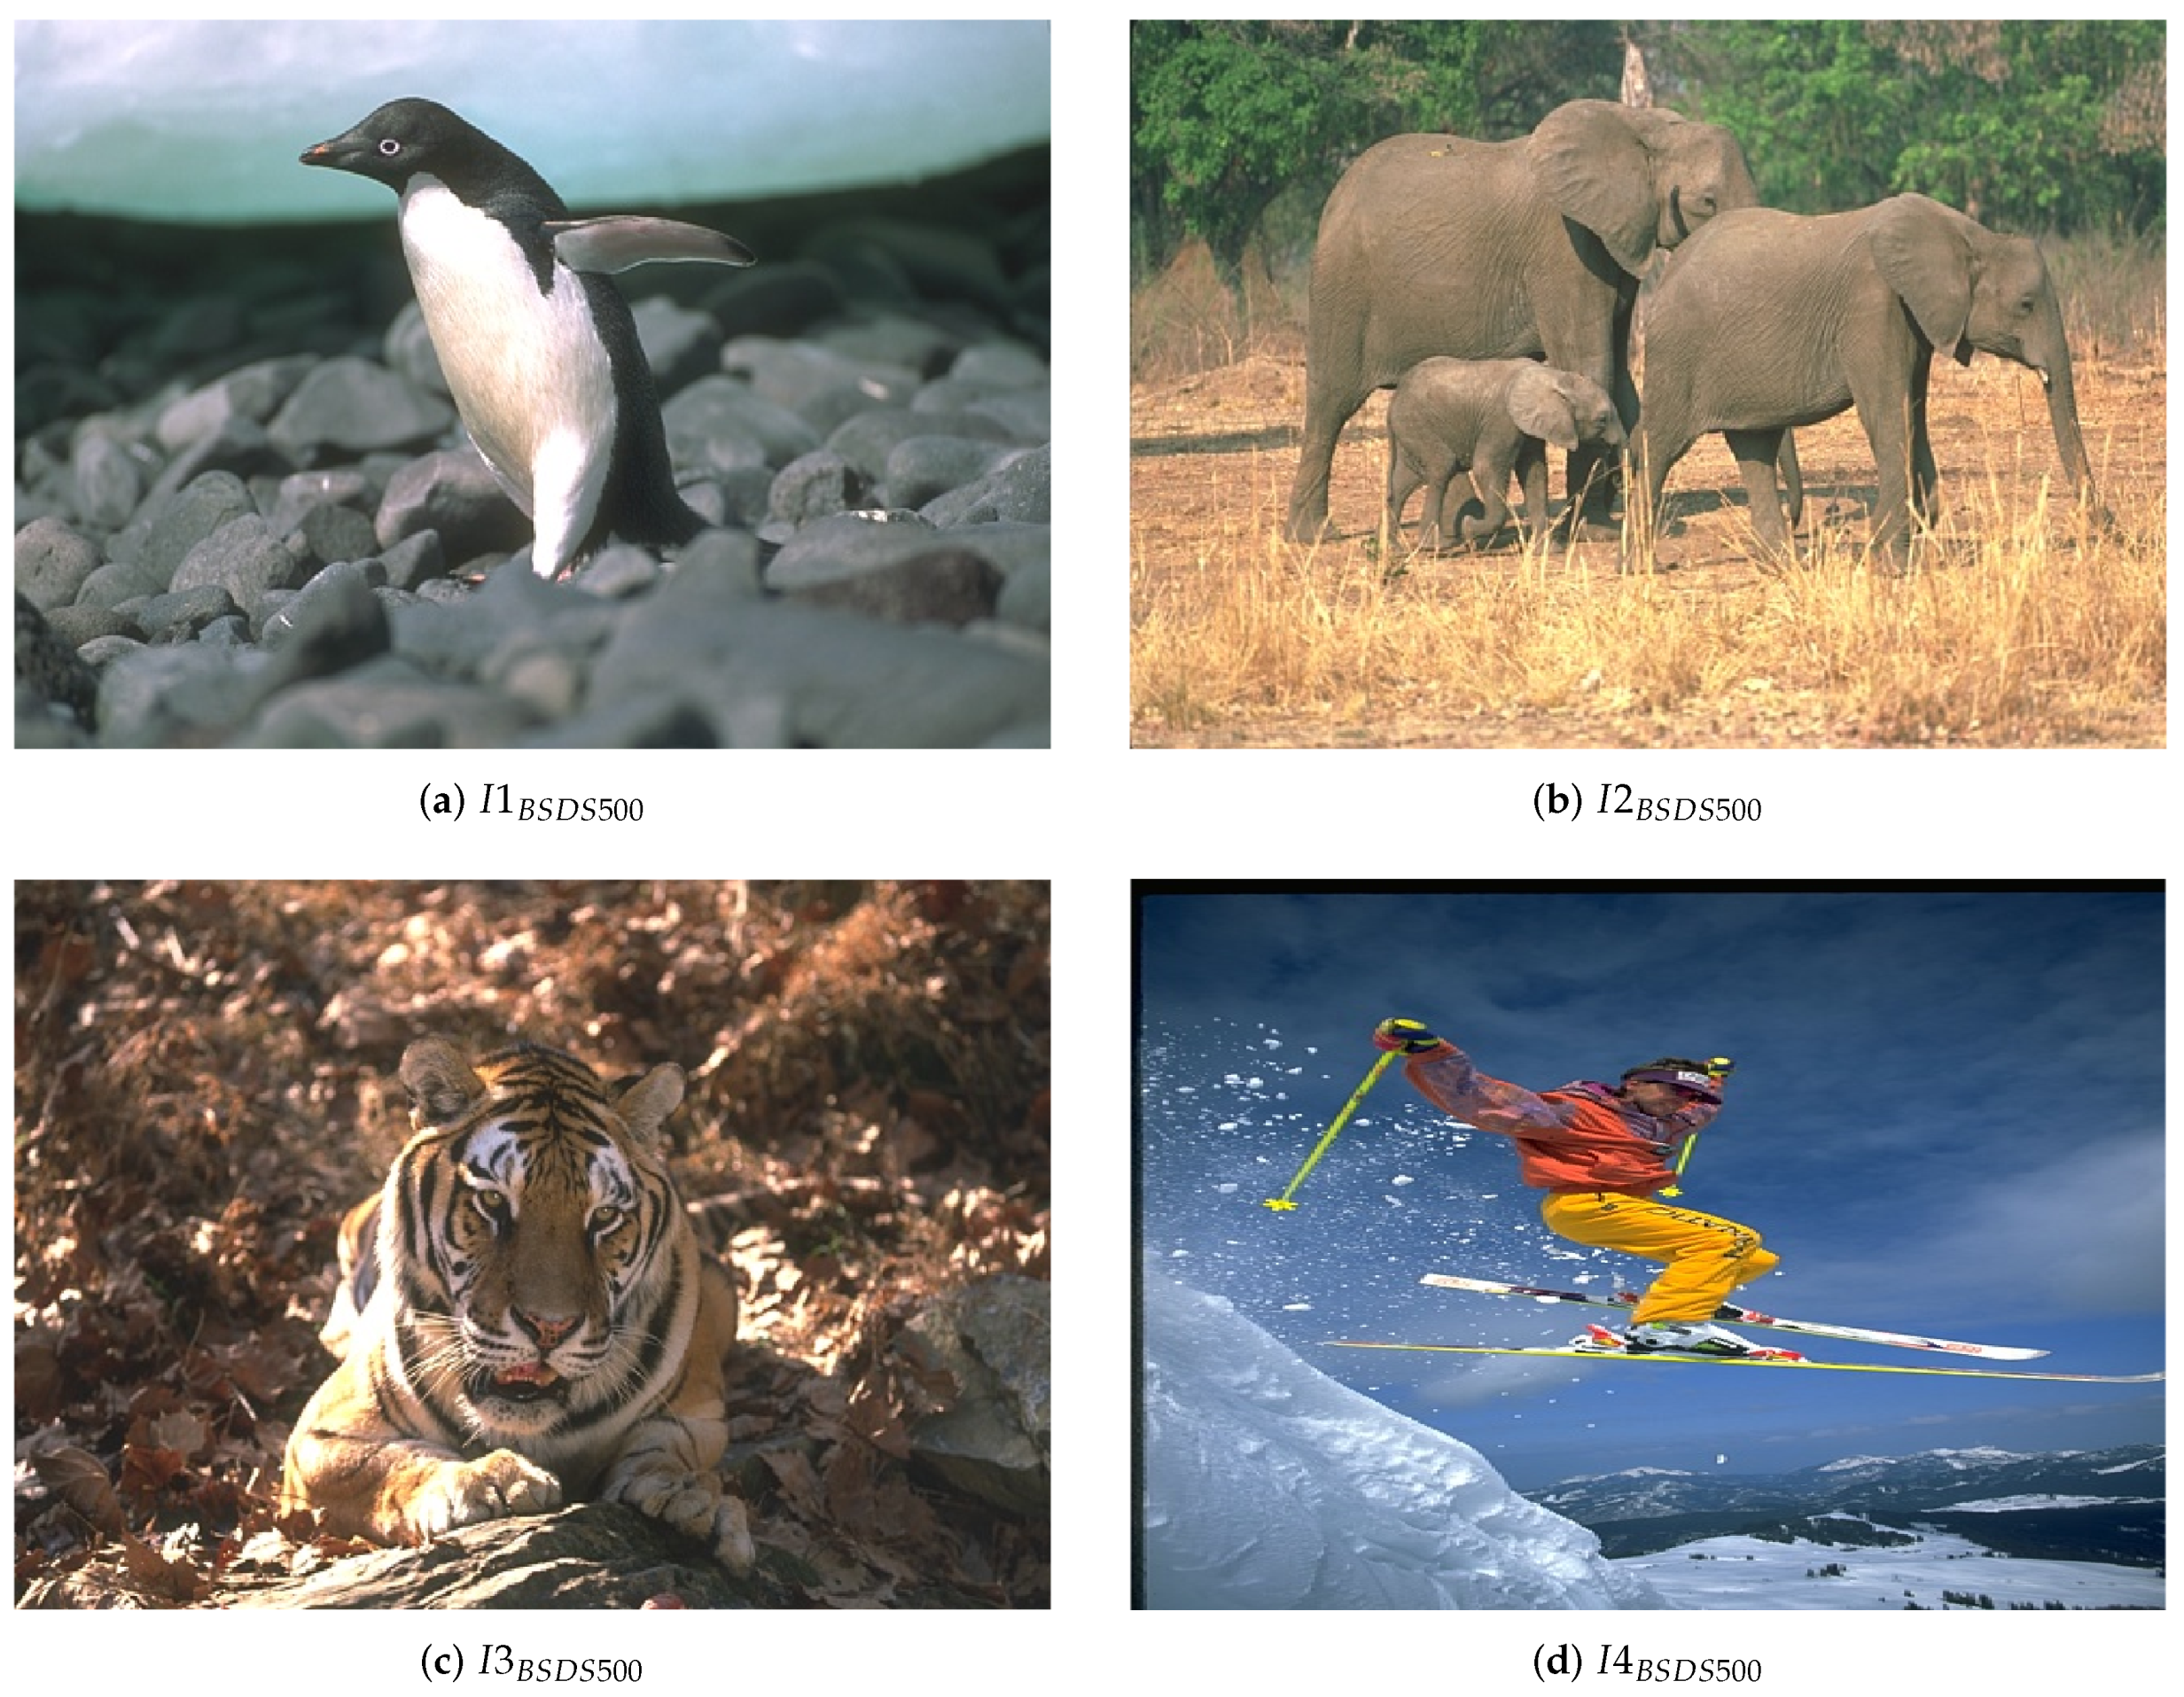
Within this section, we used two real-world dataset images to assess the performance of the developed method. The images in the first dataset are collected from Berkeley segmentation dataset and benchmark (BSDS500) [38]. These images are divided into testing and training sets which consists of 200 and 300 images, respectively each of them has size 481 × 321. An example of BSDS500 is given in 
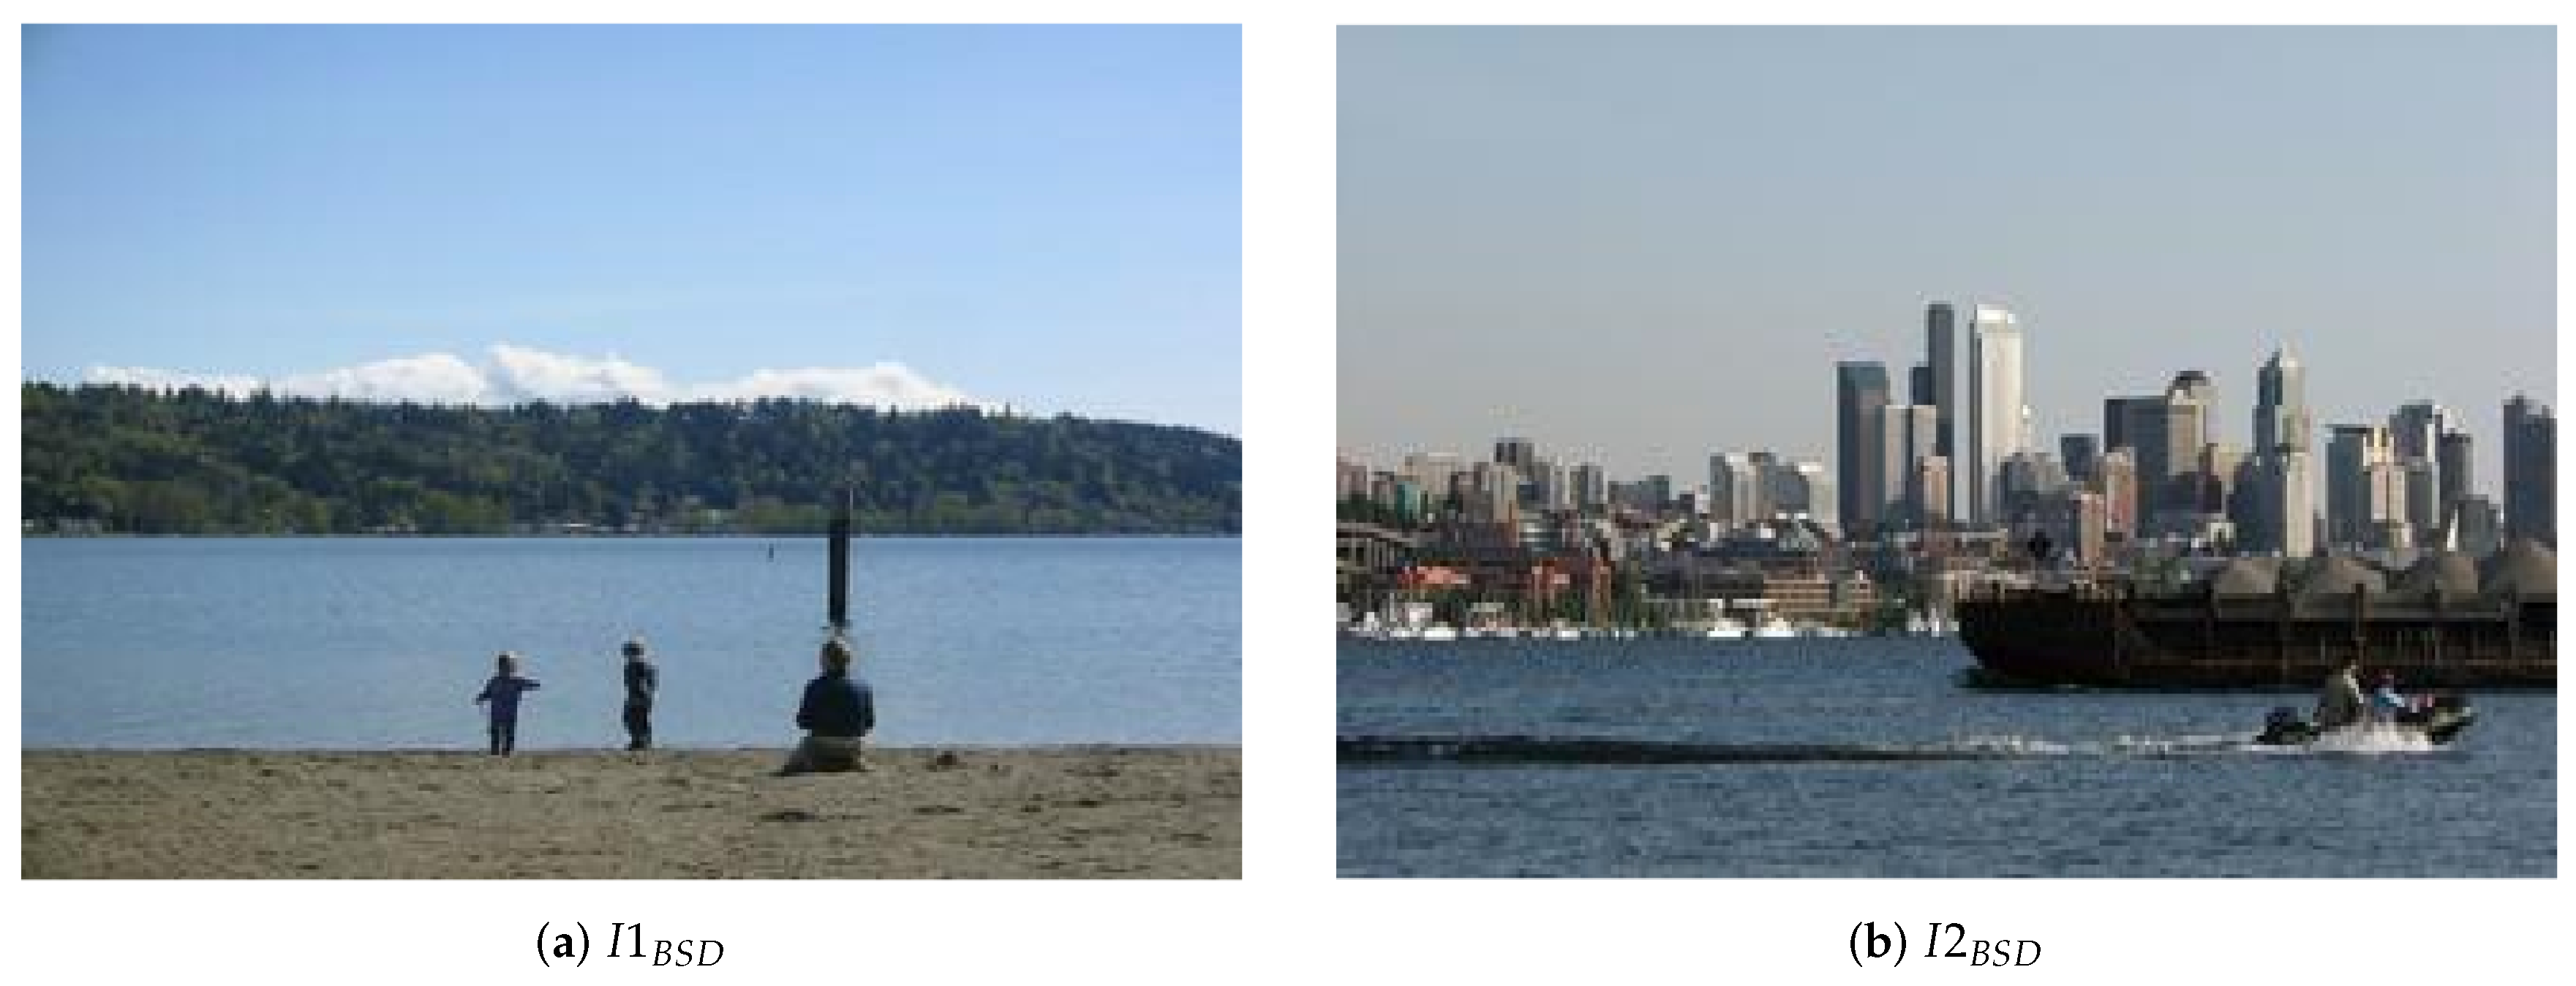
Figure 2 shows an example of four images from this type of images. Moreover, there is a set of ground truth for each image variant from four to nine and each of these ground truth is obtained by one human subject. The Stanford background dataset (SBD) [39] is the second dataset and it contains 715 images which represents an outdoor images. Figure 3 shows an example of four images from this type of images. In these images, there are objects with vague foreground boundaries, multiple foreground objects and the accommodation of detailed background regions in ground truth segmentations. This makes these images are more challenging when applied to evaluate the superpixels segmentation methods.

4.2. Performance Metrics

A set of performance metrics are used to measure the quality of the competitive segmentation approaches. These metrics are probabilistic rand index (PRI), the variation of information (VI), the global consistency error (GCE), and the boundary displacement error (BDE) [40]. The definition of these metrics are given in the following:
  • probabilistic rand index ( P R I ): It computes the the similarity of labels and it is applied to compute the classification of pixel-wise.
    P R I ( S , S g ) = 1 T i < j [ c i j p i j + ( 1 c i j ) ( 1 p i j ) ]
    where c i j and p i j denote the event that pixels i and j have the same label and its probability.
  • variation of information ( V O I ): is applied for clustering comparison and it depends on the distance of the conditional entropy between results of two clusters.
    V O I ( S , S g ) = H ( S | S g ) + H ( S g | S )
    where H ( S | S g ) and H ( S g | S ) are the conditional entropies.
  • global consistency error (GCE): It measures the global error between two segmented images that are mutually consistent.
  • boundary displacement error (BDE): It computes the average of the displacement error of pixels between two segmented images.
In general, the algorithm that provides higher PRI with low value of VOI, BDE, and GCE is considered the best one.

4.3. Results and Discussion

The comparison results between the developed method and other methods using BSDS500 are given in Table 1. It can be observed that the developed HGS provides better results than other methods in terms of performance measures. In terms of RI, VOI, and BDE, the ASOPSO allocates the second rank, followed HGS, which provides results better than other MH techniques. However, the BMO provides better results than other MH methods in terms of GCE.
Moreover, the comparative results of the developed HGS with other models using SBD dataset are given in Table 2. One can be seen from these results that HGS provides better results in terms of RI, VOI, and BDE. However, the FCM based on QGEV provides results better than other methods in terms of GCE.
Figure 4 depicts the average of the developed method and other methods among the tested two real-world images datasets. From these results it can be seen that the developed ASCQPHGS image segmentation method provides better average among the two datasets in terms of all performance measures.
For further analysis the performance of the developed method, the non-parametric Friedman test is applied to the obtained results. This test is used to determine if there is a significant difference between ASCQPHGS and other algorithms or not. This decision is taken based on the p-value obtained by Friedman test and in case of the p-value is less than 0.05, then there is a significant difference. Otherwise (i.e., p-value > 0.05), this indicates there is no a significant difference between ASCQPHGS and competitive algorithms.
Table 3 depicts the mean rank obtained by Friedman test for each algorithm over the two tested datasets (i.e., SBD and BSD500). It can be observed from these results that the developed ASCQPHGS has the largest mean rank in terms of RI, and smallest mean rank in terms of VOI, GCE, and BDE. In addition, ASOPSO allocates the second rank in terms of RI, followed by modified version of FCM (i.e., FCMQGPDL). Meanwhile, in terms of VOI, each of SMA and ASO allocates the second rank, followed by DPCQGPDL and ASOPSO. In terms of GCE, FCM, BMO, and SMA allocate the second, third, and fourth rank, respectively. Finally, the FCMQGPDL, ASOPSO, and DPCQGPDL acheive the second, third, and fourth rank, respectively.
Figure 5 and Figure 6 depict the segmentation of I 4 B S D S 500 and I 1 B S D from BSDS500 and BSD datasets. It can be seen from this segmentation, the high ability of the developed method to split the objects inside the image. In addition, the influence of q-GPDL is better than other traditional GEV.

4.4. Comparison with Literature Works

The results of the ASCQPHGS method is compared with a set of well-known superpixel cluster methods that have been applied to segmented the BSDS500 dataset. The methods including FCM [41], Superpixel-based fast FCM (SFFCM) [31], Significantly fast and robust FCM (FRFCM) [42], Neighbourhood weighted FCM (NWFCM) [43], Adaptive FCM based on local noise detecting (NDFCM) [44], A fuzzy clustering approach toward hidden Markov random field models for enhanced spatially constrained (HMRF-FCM) [45], fast and robust FCM algorithms incorporating local information (FGFCM) [46], A robust fuzzy local information C-means clustering (FLICM) [47], A possibilistic FCM (PFCM) [48], General type-2 FCM for uncertain fuzzy clustering (MSFCM) [49], FCM with local information and kernel metric (KWFLICM) [50], A novel type-2 FCM (AWSFCM) [51].
Table 4 shows the comparison between the results of developed method and the collected results of other literature works. From these results, we observed that the developed ASCQPHGS has better results than other methods in terms of performance measures. The main reason of this high quality of the developed ASCQPHGS is combining the behaviour of superpixel algorithm that leads to decrease the computational time and memory requirements. As well as, using the modified version of DPC based on Generalized Extreme Types Under Linear Normalization (GEVL).

5. Conclusions

In this paper, an alternative color image segmentation method has been developed. This method depends on using the superixel algorithm to reduce the memory requirements. In addition, to determine the number of clusters, a modified version of density peak clustering algorithm has been introduced based on a definition of Generalized Pareto distribution under linear normalization (GPDL), named q-GPDL. This distribution avoid the limitations of traditional generalized extreme value that used in DPC. Finally, to determine the cluster centers, the Hunger Games Search has been used since it has high ability to explore the search space which leads to enhance the convergence towards the optimal solution. The comparison results between the developed method and other methods based on metaheuristic techniques have been conducted using two real image datasets named BSDS500 and Stanford background dataset (SBD). These results provide evident about the superiority of the developed method over either the MH techniques or the state-of-the-art methods.
Besides, the developed method can be applied in future to different clustering-based image segmentation problems. In addition, it can be extent as multi-objective clustering optimization problems. Also, it can applied to different applications such as remote sensing, medical image classification and others.

Author Contributions

All authors contributed equally to this study. All authors have read and agreed to the published version of the manuscript.

Funding

This work was supported by the Academy of Scientific Research and Technology (ASRT), Egypt, under Grant 6622.

Institutional Review Board Statement

Not applicable.

Informed Consent Statement

Not applicable.

Data Availability Statement

Berkeley segmentation dataset and benchmark (BSDS500) [38]. The Stanford background dataset (SBD) [39].

Conflicts of Interest

The authors declare no conflict of interest.

References

  1. Zhuang, H.; Low, K.S.; Yau, W.Y. Multichannel pulse-coupled-neural-network-based color image segmentation for object detection. IEEE Trans. Ind. Electron. 2011, 59, 3299–3308. [Google Scholar] [CrossRef]
  2. Ahmed, A.; Jalal, A.; Rafique, A.A. Salient Segmentation based Object Detection and Recognition using Hybrid Genetic Transform. In Proceedings of the 2019 International Conference on Applied and Engineering Mathematics (ICAEM), Taxila, Pakistan, 27–29 August 2019; pp. 203–208. [Google Scholar]
  3. Li, M.; Qin, J.; Li, D.; Chen, R.; Liao, X.; Guo, B. VNLSTM-PoseNet: A novel deep ConvNet for real-time 6-DOF camera relocalization in urban streets. Geo-Spat. Inf. Sci. 2021, 1–15. [Google Scholar] [CrossRef]
  4. Xu, L.; Ma, A. Coarse-to-fine waterlogging probability assessment based on remote sensing image and social media data. Geo-Spat. Inf. Sci. 2021, 24, 279–301. [Google Scholar] [CrossRef]
  5. Abd Elaziz, M.; AA Al-Qaness, M.; Abo Zaid, E.O.; Lu, S.; Ali Ibrahim, R.; Ewees, A.A. Automatic clustering method to segment COVID-19 CT images. PLoS ONE 2021, 16, e0244416. [Google Scholar] [CrossRef] [PubMed]
  6. dela Torre, D.M.G.; Gao, J.; Macinnis-Ng, C. Remote sensing-based estimation of rice yields using various models: A critical review. Geo-Spat. Inf. Sci. 2021. [Google Scholar] [CrossRef]
  7. Wang, K.; Li, L.; Zhang, J. End-to-end trainable network for superpixel and image segmentation. Pattern Recognit. Lett. 2020, 140, 135–142. [Google Scholar] [CrossRef]
  8. Conze, P.H.; Tilquin, F.; Lamard, M.; Heitz, F.; Quellec, G. Unsupervised learning-based long-term superpixel tracking. Image Vis. Comput. 2019, 89, 289–301. [Google Scholar] [CrossRef] [Green Version]
  9. Wang, J.; Liu, W.; Xing, W.; Zhang, S. Visual object tracking with multi-scale superpixels and color-feature guided kernelized correlation filters. Signal Process. Image Commun. 2018, 63, 44–62. [Google Scholar] [CrossRef]
  10. Thirumavalavan, S.; Jayaraman, S. An improved teaching–learning based robust edge detection algorithm for noisy images. J. Adv. Res. 2016, 7, 979–989. [Google Scholar] [CrossRef] [Green Version]
  11. Li, D.; Wang, Q.; Member, I.; Kong, F. Superpixel-feature-based multiple kernel sparse representation for hyperspectral image classification. Signal Process. 2020, 176, 107682. [Google Scholar] [CrossRef]
  12. Jing, H.; He, X.; Han, Q.; Abd El-Latif, A.A.; Niu, X. Saliency detection based on integrated features. Neurocomputing 2014, 129, 114–121. [Google Scholar] [CrossRef]
  13. Abd EL-Latif, A.A.; Abd-El-Atty, B.; Venegas-Andraca, S.E. Controlled alternate quantum walk-based pseudo-random number generator and its application to quantum color image encryption. Phys. A Stat. Mech. Appl. 2020, 547, 123869. [Google Scholar] [CrossRef]
  14. Li, L.; Abd-El-Atty, B.; Abd El-Latif, A.A.; Ghoneim, A. Quantum color image encryption based on multiple discrete chaotic systems. In Proceedings of the 2017 Federated Conference on Computer Science and Information Systems (FedCSIS), Prague, Czech Republic, 3–6 September 2017; pp. 555–559. [Google Scholar]
  15. Abd El-Latif, A.A.; Yan, X.; Li, L.; Wang, N.; Peng, J.L.; Niu, X. A new meaningful secret sharing scheme based on random grids, error diffusion and chaotic encryption. Opt. Laser Technol. 2013, 54, 389–400. [Google Scholar] [CrossRef]
  16. Abd el Latif, A.A.; Abd-el Atty, B.; Amin, M.; Iliyasu, A.M. Quantum-inspired cascaded discrete-time quantum walks with induced chaotic dynamics and cryptographic applications. Sci. Rep. 2020, 10, 1930. [Google Scholar] [CrossRef]
  17. Levinshtein, A.; Stere, A.; Kutulakos, K.N.; Fleet, D.J.; Dickinson, S.J.; Siddiqi, K. Turbopixels: Fast superpixels using geometric flows. IEEE Trans. Pattern Anal. Mach. Intell. 2009, 31, 2290–2297. [Google Scholar] [CrossRef] [Green Version]
  18. Huang, C.R.; Wang, W.A.; Lin, S.Y.; Lin, Y.Y. USEQ: Ultra-fast superpixel extraction via quantization. In Proceedings of the 2016 23rd International Conference on Pattern Recognition (ICPR), Cancun, Mexico, 4–8 December 2016; pp. 1965–1970. [Google Scholar]
  19. Di, S.; Liao, M.; Zhao, Y.; Li, Y.; Zeng, Y. Image superpixel segmentation based on hierarchical multi-level LI-SLIC. Opt. Laser Technol. 2021, 135, 106703. [Google Scholar] [CrossRef]
  20. Fouad, S.; Randell, D.; Galton, A.; Mehanna, H.; Landini, G. Unsupervised superpixel-based segmentation of histopathological images with consensus clustering. In Proceedings of the Annual Conference on Medical Image Understanding and Analysis, Edinburgh, UK, 11–13 July 2017; Springer: Berlin/Heidelberg, Germany, 2017; pp. 767–779. [Google Scholar]
  21. Mi, L.; Chen, Z. Superpixel-enhanced deep neural forest for remote sensing image semantic segmentation. ISPRS J. Photogramm. Remote Sens. 2020, 159, 140–152. [Google Scholar] [CrossRef]
  22. Huang, J.Y.; Ding, J.J. Generic Image Segmentation in Fully Convolutional Networks by Superpixel Merging Map. In Proceedings of the Asian Conference on Computer Vision, Kyoto, Japan, 30 November–4 December 2020. [Google Scholar]
  23. Mittal, H.; Saraswat, M. An automatic nuclei segmentation method using intelligent gravitational search algorithm based superpixel clustering. Swarm Evol. Comput. 2019, 45, 15–32. [Google Scholar] [CrossRef]
  24. Chakraborty, S.; Mali, K. SuFMoFPA: A superpixel and meta-heuristic based fuzzy image segmentation approach to explicate COVID-19 radiological images. Expert Syst. Appl. 2021, 167, 114142. [Google Scholar] [CrossRef]
  25. Lei, T.; Liu, P.; Jia, X.; Zhang, X.; Meng, H.; Nandi, A.K. Automatic fuzzy clustering framework for image segmentation. IEEE Trans. Fuzzy Syst. 2019, 28, 2078–2092. [Google Scholar] [CrossRef] [Green Version]
  26. Kotz, S.; Nadarajah, S. Extreme Value Distributions: Theory and Applications; World Scientific: Singapore, 2000. [Google Scholar]
  27. Yang, Y.; Chen, H.; Heidari, A.A.; Gandomi, A.H. Hunger games search: Visions, conception, implementation, deep analysis, perspectives, and towards performance shifts. Expert Syst. Appl. 2021, 177, 114864. [Google Scholar] [CrossRef]
  28. Jain, A.K.; Murty, M.N.; Flynn, P.J. Data clustering: A review. ACM Comput. Surv. 1999, 31, 264–323. [Google Scholar] [CrossRef]
  29. Rodriguez, A.; Laio, A. Clustering by fast search and find of density peaks. Science 2014, 344, 1492–1496. [Google Scholar] [CrossRef] [PubMed] [Green Version]
  30. Provost, S.B.; Saboor, A.; Cordeiro, G.M.; Mansoor, M. On the q-generalized extreme value distribution. REVSTAT-Stat. J. 2018, 16, 45–70. [Google Scholar]
  31. Lei, T.; Jia, X.; Zhang, Y.; Liu, S.; Meng, H.; Nandi, A.K. Superpixel-based fast fuzzy C-means clustering for color image segmentation. IEEE Trans. Fuzzy Syst. 2018, 27, 1753–1766. [Google Scholar] [CrossRef] [Green Version]
  32. Chou, C.H.; Su, M.C.; Lai, E. A new cluster validity measure and its application to image compression. Pattern Anal. Appl. 2004, 7, 205–220. [Google Scholar] [CrossRef]
  33. Ewees, A.A.; Abualigah, L.; Yousri, D.; Algamal, Z.Y.; Al-qaness, M.A.; Ibrahim, R.A.; Abd Elaziz, M. Improved Slime Mould Algorithm based on Firefly Algorithm for feature selection: A case study on QSAR model. Eng. Comput. 2021, 1–15. [Google Scholar] [CrossRef]
  34. Sulaiman, M.H.; Mustaffa, Z.; Saari, M.M.; Daniyal, H.; Musirin, I.; Daud, M.R. Barnacles mating optimizer: An evolutionary algorithm for solving optimization. In Proceedings of the 2018 IEEE International Conference on Automatic Control and Intelligent Systems (I2CACIS), Shah Alam, Malaysia, 20 October 2018; pp. 99–104. [Google Scholar]
  35. Zhao, W.; Wang, L.; Zhang, Z. Atom search optimization and its application to solve a hydrogeologic parameter estimation problem. Knowl.-Based Syst. 2019, 163, 283–304. [Google Scholar] [CrossRef]
  36. Abd Elaziz, M.; Nabil, N.; Ewees, A.A.; Lu, S. Automatic data clustering based on hybrid atom search optimization and sine-cosine algorithm. In Proceedings of the 2019 IEEE Congress on Evolutionary Computation (CEC), Wellington, New Zealand, 10–13 June 2019; pp. 2315–2322. [Google Scholar]
  37. AbuShanab, W.S.; Abd Elaziz, M.; Ghandourah, E.I.; Moustafa, E.B.; Elsheikh, A.H. A new fine-tuned random vector functional link model using Hunger games search optimizer for modeling friction stir welding process of polymeric materials. J. Mater. Res. Technol. 2021, 14, 1482–1493. [Google Scholar] [CrossRef]
  38. Arbelaez, P.; Maire, M.; Fowlkes, C.; Malik, J. Contour detection and hierarchical image segmentation. IEEE Trans. Pattern Anal. Mach. Intell. 2010, 33, 898–916. [Google Scholar] [CrossRef] [Green Version]
  39. Gould, S.; Fulton, R.; Koller, D. Decomposing a scene into geometric and semantically consistent regions. In Proceedings of the 2009 IEEE 12th International Conference on Computer Vision, Kyoto, Japan, 27 September–4 October 2009; pp. 1–8. [Google Scholar]
  40. Wang, X.; Tang, Y.; Masnou, S.; Chen, L. A global/local affinity graph for image segmentation. IEEE Trans. Image Process. 2015, 24, 1399–1411. [Google Scholar] [CrossRef]
  41. Bezdek, J.C.; Ehrlich, R.; Full, W. FCM: The fuzzy c-means clustering algorithm. Comput. Geosci. 1984, 10, 191–203. [Google Scholar] [CrossRef]
  42. Lei, T.; Jia, X.; Zhang, Y.; He, L.; Meng, H.; Nandi, A.K. Significantly fast and robust fuzzy c-means clustering algorithm based on morphological reconstruction and membership filtering. IEEE Trans. Fuzzy Syst. 2018, 26, 3027–3041. [Google Scholar] [CrossRef] [Green Version]
  43. Zaixin, Z.; Lizhi, C.; Guangquan, C. Neighbourhood weighted fuzzy c-means clustering algorithm for image segmentation. IET Image Process. 2014, 8, 150–161. [Google Scholar] [CrossRef]
  44. Guo, F.F.; Wang, X.X.; Shen, J. Adaptive fuzzy c-means algorithm based on local noise detecting for image segmentation. IET Image Process. 2016, 10, 272–279. [Google Scholar] [CrossRef]
  45. Chatzis, S.P.; Varvarigou, T.A. A fuzzy clustering approach toward hidden Markov random field models for enhanced spatially constrained image segmentation. IEEE Trans. Fuzzy Syst. 2008, 16, 1351–1361. [Google Scholar] [CrossRef]
  46. Cai, W.; Chen, S.; Zhang, D. Fast and robust fuzzy c-means clustering algorithms incorporating local information for image segmentation. Pattern Recognit. 2007, 40, 825–838. [Google Scholar] [CrossRef] [Green Version]
  47. Krinidis, S.; Chatzis, V. A robust fuzzy local information C-means clustering algorithm. IEEE Trans. Image Process. 2010, 19, 1328–1337. [Google Scholar] [CrossRef] [PubMed]
  48. Pal, N.R.; Pal, K.; Keller, J.M.; Bezdek, J.C. A possibilistic fuzzy c-means clustering algorithm. IEEE Trans. Fuzzy Syst. 2005, 13, 517–530. [Google Scholar] [CrossRef]
  49. Linda, O.; Manic, M. General type-2 fuzzy c-means algorithm for uncertain fuzzy clustering. IEEE Trans. Fuzzy Syst. 2012, 20, 883–897. [Google Scholar] [CrossRef]
  50. Gong, M.; Liang, Y.; Shi, J.; Ma, W.; Ma, J. Fuzzy c-means clustering with local information and kernel metric for image segmentation. IEEE Trans. Image Process. 2012, 22, 573–584. [Google Scholar] [CrossRef] [PubMed]
  51. Mishro, P.K.; Agrawal, S.; Panda, R.; Abraham, A. A novel type-2 fuzzy C-means clustering for brain MR image segmentation. IEEE Trans. Cybern. 2020, 51, 3901–3912. [Google Scholar] [CrossRef]
Figure 1. The steps of developed ASCQPHGS for color image segmentation.
Mathematics 09 02383 g001
Figure 2. Examples of BSDS500 images.
Mathematics 09 02383 g002
Figure 3. Examples of SBD images.
Mathematics 09 02383 g003aMathematics 09 02383 g003b
Figure 4. Comparison results between ASCQPHGS and other models in terms of PRI, VOI, GCE, and BDE.
Mathematics 09 02383 g004
Figure 5. Segmentation of image I 4 B S D S 500 from BSDS500 datasets using the competitive algorithms.
Mathematics 09 02383 g005aMathematics 09 02383 g005b
Figure 6. Segmentation of image I 1 B S D from BSD datasets using the competitive algorithms.
Mathematics 09 02383 g006aMathematics 09 02383 g006b
Table 1. Results of competitive techniques for the BSDS500.
RIVOIGCEBDE
DPCQGPDL0.81731.97020.25878.6165
DPC0.81841.96790.25928.5876
FCMQGPDL0.81841.96860.25938.5914
FCM0.75372.05230.219812.9771
SMA0.82761.86850.22238.9728
BMO0.82321.87430.21989.4888
ASO0.82961.87000.22649.0037
ASOPSO0.83391.86140.22708.5360
ASCQPHGS0.83611.85610.20778.3777
Table 2. Results of competitive techniques for the SBD.
RIVOIGCEBDE
DPCQGPDL0.65401.88080.244715.6244
DPC0.65171.88640.244315.8201
FCMQGPDL0.65451.88040.204915.6116
FCM0.61421.86020.206817.7728
SMA0.62271.88250.221316.9126
BMO0.61791.88430.218817.1358
ASO0.62691.88190.225316.8736
ASOPSO0.62811.88580.226416.5644
ASCQPHGS0.66881.85410.216915.5535
Table 3. Friedman test results of the developed ASCQPHGS and other methods using SBD and BSD500 datasets.
DPCQGPDLDPCFCMQGPDLFCMSMABMOASOASOPSOASCQPHGS
RI4.54.755.7514.53.55.56.59
VOI67.555.54.564.551
GCE7.57.591.7542.75561.5
BDE43.5396.586.53.51
Table 4. Comparison with other literature works.
PRI”VIGCEBDE
FCM0.72.870.3714.01
FGFCM0.692.920.3814.29
HMRF-FCM0.722.590.3314.22
FLICM0.712.730.3513.47
NWFCM0.712.790.3613.7
NDFCM0.692.930.3812.95
FRFCM0.762.670.37-
SFFCM0.732.180.2514.13
PFCM [48]0.722.970.42-
KWFLICM [50]0.742.830.4-
RSFFCA0.782.120.28-
AWSFCM [51]0.752.740.38-
MSFCM [49]0.742.850.4-
ASCQPHGS0.83611.85610.20778.3777
Publisher’s Note: MDPI stays neutral with regard to jurisdictional claims in published maps and institutional affiliations.

