Multiple Criteria Decision-Making for Developing an International Game Participation Strategy: A Novel Application of the Data Envelopment Analysis (DEA) Two-Stage Efficiency Process


Abstract
:1. Introduction
1.1. Background
1.2. Objectives
2. Methods
2.1. Statistical Analysis
2.1.1. DEA
2.1.2. Operational Definitions
2.2. Research Procedure and Data Processing
3. Results
3.1. Expenditure Efficiency for the 2019 ITTF World Tour
3.1.1. Efficiency Analysis
3.1.2. Returns to Scale Analysis
3.1.3. Slack Variable Analysis
3.2. Prize-Winning Efficiency for the 2019 ITTF World Tour
3.2.1. Efficiency Analysis
3.2.2. Returns to Scale Analysis
3.2.3. Slack Variable Analysis
3.3. Game Participation Strategy for the 2021 ITTF World Tour
4. Discussion
4.1. Discussion of the 2019 ITTF World Tour Expenditure Analysis
4.1.1. Game Expenditure Efficiency
4.1.2. Slack Variable Analysis
4.2. Discussion of the 2019 ITTF World Tour Prize-Winning Analysis
4.2.1. Prize-Winning Efficiency
4.2.2. Slack Variable Analysis
4.3. Discussion of the 2021 ITTF World Tour Game Participation Strategy
5. Conclusions and Recommendations
5.1. Conclusions
5.2. Recommendations
Author Contributions
Funding
Institutional Review Board Statement
Informed Consent Statement
Data Availability Statement
Conflicts of Interest
References
- Farrell, M.J. The Measurement of Productive Efficiency. J. R. Stat. Soc. Ser. A 1957, 120, 253–290. [Google Scholar] [CrossRef]
- Charnes, A.; Cooper, W.W.; Rhodes, E. Measuring the efficiency of decision making units. Eur. J. Oper. Res. 1978, 2, 429–444. [Google Scholar] [CrossRef]
- Banker, R.D.; Charnes, A.; Cooper, W.W. Some Models for Estimating Technical and Scale Inefficiencies in Data Envelopment Analysis. Manag. Sci. 1984, 30, 1078–1092. [Google Scholar] [CrossRef] [Green Version]
- Larissa, B.; Maran, R.M.; Ioan, B.; Anca, N.; Mircea-Iosif, R.; Horia, T.; Gheorghe, F.; Speranta, M.E.; Dan, M.I. Adjusted Net Savings of CEE and Baltic Nations in the Context of Sustainable Economic Growth: A Panel Data Analysis. J. Risk Financ. Manag. 2020, 13, 234. [Google Scholar] [CrossRef]
- Bătrâncea, L.; Nichita, A. Which is the best government? Colligating tax compliance and citizens’ insights regarding authorities’ actions. Transylv. Rev. Adm. Sci. 2015, 11, 5–22. [Google Scholar]
- Ruiz, J.L.; Pastor, D.; Pastor, J.T. Assessing Professional Tennis Players Using Data Envelopment Analysis (DEA). J. Sports Econ. 2011, 14, 276–302. [Google Scholar] [CrossRef]
- Guzmán, I. Measuring Efficiency and Sustainable Growth in Spanish Football Teams. Eur. Sport Manag. Q. 2006, 6, 267–287. [Google Scholar] [CrossRef]
- Hu, L.H.; Kang, C.N. The efficiency analysis of the CPBL players before and after the signing of mul-ti-year-contracts. Phys. Educ. J. 2019, 52, 95–107. [Google Scholar] [CrossRef]
- Lewis, H.F.; Sexton, T.R.; Lock, K.A. Player Salaries, Organizational Efficiency, and Competitiveness in Major League Baseball. J. Sports Econ. 2007, 8, 266–294. [Google Scholar] [CrossRef]
- Lin, W.B. An Application of the Metafrontier and Technical Gap Ratio in Sport. Phys. Educ. J. 2015, 48, 383–398. [Google Scholar] [CrossRef]
- Lin, C.-H. Effects of Different Ball Size and Ability on Table Tennis Backhand Block Learning. Sports Exerc. Res. 2013, 15, 269–276. [Google Scholar] [CrossRef]
- Meza, L.A.; Valério, R.P.; De Mello, J.C.C.S. Assessing the Efficiency of Sports in Using Financial Resources with DEA Models. Procedia Comput. Sci. 2015, 55, 1151–1159. [Google Scholar] [CrossRef] [Green Version]
- Volz, B. Minority Status and Managerial Survival in Major League Baseball. J. Sports Econ. 2009, 10, 522–542. [Google Scholar] [CrossRef] [Green Version]
- Bhat, Z.U.H.; Sultana, D.; Dar, Q.F. A comprehensive review of data envelopment analysis (DEA): Approach in sports. J. Sports Econ. Manag. 2019, 9, 82–109. [Google Scholar]
- Cooper, W.W.; Ramón, N.; Ruiz, J.L.; Sirvent, I. Avoiding large differences in weights in cross-efficiency evaluations: Ap-plication to the ranking of basketball players. J. Cent. Cathedra Bus. Econ. Res. J. 2011, 4, 197–215. [Google Scholar] [CrossRef]
- Miceli, T.J.; Volz, B.D. Debating Immortality: Application of Data Envelopment Analysis to Voting for the Baseball Hall of Fame. Manag. Decis. Econ. 2012, 33, 177–188. [Google Scholar] [CrossRef]
- Kulikova, L.I.; Goshunova, A.V. Efficiency measurement of professional football clubs: A non-parametric approach. Life Sci. J. 2014, 11, 117–122. [Google Scholar]
- Chitnis, A.; Vaidya, O. Performance Assessment of Tennis Players: Application of DEA. Procedia Soc. Behav. Sci. 2014, 133, 74–83. [Google Scholar] [CrossRef] [Green Version]
- Chmait, N.; Westerbeek, H.; Eime, R.; Robertson, S.; Sellitto, C.; Reid, M. Tennis influencers: The player effect on social media engagement and demand for tournament attendance. Telemat. Inform. 2020, 50, 101381. [Google Scholar] [CrossRef]
- International Table Tennis Federation, ITTF Table Tennis World Ranking. Available online: https://www.ittf.com/rankings/ (accessed on 22 June 2021).
- Golany, B.; Roll, Y. An application procedure for DEA. Omega 1989, 17, 237–250. [Google Scholar] [CrossRef]
- Morrison, A.; Wensley, R. Boxing up or Boxed in A Short History of the Boston Consulting Group Share/Growth Matrix. J. Mark. Manag. 1991, 7, 105–129. [Google Scholar] [CrossRef]
- Mut, E.; Kanuma, N.T.; Rusatira, E.; Kwiringirimana, T.; Mugenzi, P.; Govere, I.; Foti, R. Analysis of coffee export mar-keting in Rwanda: Application of the Boston consulting group matrix. Afr. J. Bus. Manag. 2009, 3, 210–219. [Google Scholar] [CrossRef]
- Sarrico, C.S.; Dyson, R.G. Using DEA for planning in UK universities—an institutional perspective. J. Oper. Res. Soc. 2000, 51, 789–800. [Google Scholar] [CrossRef]
- Wang, Y.; Li, Y.; Jan, C.; Chang, K. Evaluating firm performance with balanced scorecard and data envelopment analysis. Wseas. Trans. Bus. Econ. 2013, 10, 24–39. [Google Scholar]
- Birafane, M.; Liu, W.; Khalikov, S. The Strategic Positioning of Moroccan Seaports: An Application of the Boston Consulting Group Growth-share Matrix. Open Transp. J. 2020, 14, 133–142. [Google Scholar] [CrossRef]
- Hambrick, D.C. Environmental scanning and organizational strategy. Strat. Manag. J. 1982, 3, 159–174. [Google Scholar] [CrossRef]
- Morita, H.; Hirokawa, K.; Zhu, J. A slack-based measure of efficiency in context-dependent data envelopment analysis. Omega 2005, 33, 357–362. [Google Scholar] [CrossRef]
- Sickles, R.C.; Zelenyuk, V. Measurement of Productivity and Efficiency; Cambridge University Press (CUP): Cambridge, UK, 2019. [Google Scholar]
- Chen, C.-H.; Lin, W.-B.; Yang, S.-C.; Hsiao, R. Multiple Criteria Decision-Making: A Novel Applications of Network DEA Model. Processes 2020, 8, 1482. [Google Scholar] [CrossRef]
- Wang, C.-N.; Tsai, H.-T.; Ho, T.-P.; Nguyen, V.-T.; Huang, Y.-F. Multi-Criteria Decision Making (MCDM) Model for Supplier Evaluation and Selection for Oil Production Projects in Vietnam. Processes 2020, 8, 134. [Google Scholar] [CrossRef] [Green Version]
- Coelli, T. A guide to DEAP version 2.1: A data envelopment analysis (computer) program. Cent. Effic. Product. Anal. 1996, 96, 1–49. [Google Scholar]
- Guzmán, I.; Morrow, S. Measuring efficiency and productivity in professional football teams: Evidence from the English Premier League. Cent. Eur. J. Oper. Res. 2007, 15, 309–328. [Google Scholar] [CrossRef]
- Rogge, N.; Van Reeth, D.; Van Puyenbroeck, T. Performance evaluation of Tour de France cycling teams using data en-velopment analysis. In Proceedings of the XIV IASE & IV ESEA Conference on Sports Economics, London, UK, 6–7 September 2012. [Google Scholar]
- Terrien, M.; Andreff, W. Organisational efficiency of national football leagues in Europe. Eur. Sport Manag. Q. 2019, 20, 205–224. [Google Scholar] [CrossRef]
- Herrero-Prieto, L.C. Evaluating the Efficiency of Cultural Travel Destinations: A DEA Approach. In Enhancing Participation in the Arts in the EU; Springer Science and Business Media LLC.: Berlin, Germany, 2017; pp. 237–248. [Google Scholar]
- Hofmarcher, M.M.; Paterson, I.; Riedel, M. Measuring Hospital Efficiency in Austria—A DEA Approach. Health Care Manag. Sci. 2002, 5, 7–14. [Google Scholar] [CrossRef] [PubMed]
- Glass, A.J.; Kenjegalieva, K.; Taylor, J. Game, set and match: Evaluating the efficiency of male professional tennis players. J. Prod. Anal. 2015, 43, 119–131. [Google Scholar] [CrossRef] [Green Version]
- Sitarz, S. The medal points’ incenter for rankings in sport. Appl. Math. Lett. 2013, 26, 408–412. [Google Scholar] [CrossRef]
- Parshakov, P.; Zavertiaeva, M. Determinants of performance in eSports: A country-level analysis. Int. J. Sport Financ. 2018, 13, 34–51. [Google Scholar]
- Júnior, S.G.; De Mello, J.S.; Meza, L.A. Sequential use of ordinal multicriteria methods to obtain a ranking for the 2012 Summer Olympic Games. WSEAS Trans. Syst. 2014, 13, 223–230. [Google Scholar]
- Gontijo, T.S. A two-stage DEA model to evaluate the efficiency of countries at the Rio 2016 Olympic Games. Econ. Bull. 2019, 39, 1538–1545. [Google Scholar]
- Hsieh, L.-F.; Chin, J.-B.; Wu, M.-C. Cost efficiency and service effectiveness for university e-libraries in Taiwan. Electron. Libr. 2014, 32, 308–321. [Google Scholar] [CrossRef]
- Mokhtarian, P.L.; Chen, C. TTB or not TTB, that is the question: A review and analysis of the empirical literature on travel time (and money) budgets. Transp. Res. Part A Policy Pract. 2004, 38, 643–675. [Google Scholar] [CrossRef] [Green Version]
- Park, S.; Woo, M.; Nicolau, J.L. Determinant Factors of Tourist Expenses. J. Travel Res. 2020, 59, 267–280. [Google Scholar] [CrossRef]
- Voltaire, B.; Galy, O.; Coste, O.; Racinais, S.; Callis, A.; Blonc, S.; Hertogh, C.; Hue, O. Effect of Fourteen Days of Acclimatization on Athletic Performance in Tropical Climate. Can. J. Appl. Physiol. 2002, 27, 551–562. [Google Scholar] [CrossRef]
- Peng, T.L. A Study of the 2004 Athens Olympics Strategic Management. J. Taiwan Soc. Sport Manag. 2015, 15, 193–212. [Google Scholar] [CrossRef]
- Knust, S. Scheduling non-professional table-tennis leagues. Eur. J. Oper. Res. 2010, 200, 358–367. [Google Scholar] [CrossRef]
- Durán, G.; Durán, S.; Marenco, J.; Mascialino, F.; Rey, P.A. Scheduling Argentina’s professional basketball leagues: A variation on the Travelling Tournament Problem. Eur. J. Oper. Res. 2019, 275, 1126–1138. [Google Scholar] [CrossRef]


| Event | Points (According to the Ranking) | ||||||||
|---|---|---|---|---|---|---|---|---|---|
| 1 | 2 | 3 | 8 | 16 | 32 | ||||
| Platinum (P) | 2250 | 1800 | 1465 | 1125 | 900 | 675 | |||
| Regular (R) | 1800 | 1440 | 1170 | 900 | 720 | 540 | |||
| Date | Location | Event | Prize Money (According to the Ranking) in USD | ||||||
| 1 | 2 | 3 | 8 | 16 | 32 | Total | |||
| 01/15–01/20 | Hungary: Budapest | R | 18,500 | 9200 | 4500 | 2200 | 1100 | 700 | 65,500 |
| 03/26–03/31 | Qatar: Doha | P | 33,000 | 17,000 | 8000 | 4000 | 2500 | 1500 | 126,000 |
| 05/28–06/02 | China: Shen Zhen | P | 44,000 | 22,000 | 10,600 | 5900 | 3300 | 2050 | 170,000 |
| 06/04–06/09 | Hong Kong: Hong Kong | R | 18,600 | 9200 | 4500 | 2200 | 1200 | 800 | 68,000 |
| 06/12–06/16 | Japan: Kitakyushu | P | 30,000 | 15,000 | 7500 | 3750 | 2100 | 1200 | 111,000 |
| 07/02–07/07 | Korea: Busan | R | 16,000 | 8000 | 4000 | 2000 | 1000 | 750 | 60,000 |
| 07/09–07/14 | Australia: Geelong | P | 35,000 | 17,500 | 8350 | 5000 | 3000 | 1800 | 142,000 |
| 08/13–08/18 | Bulgaria: Panagyurishte | R | 21,000 | 10,600 | 5500 | 2800 | 1400 | 750 | 77,000 |
| 08/20–08/25 | The Czech Republic: Olomouc | R | 21,000 | 10,600 | 5500 | 2800 | 1400 | 750 | 77,000 |
| 10/01–10/06 | Sweden: Stockholm | R | 18,500 | 9200 | 4500 | 2200 | 1100 | 700 | 65,500 |
| 10/08–10/13 | Germany: Bremen | P | 30,000 | 15,000 | 7500 | 3750 | 2100 | 1200 | 111,000 |
| 11/12–11/17 | Austria: Linz | P | 30,000 | 15,000 | 7500 | 3500 | 2000 | 1000 | 106,000 |
| Items. | Definition | Study |
|---|---|---|
| Local travel expense | These expenses are determined based on the 2020 table for the foreign per diem allowance amount according to the central governmental agency (USD/day) | Herrero-Prieto [36] |
| Days | Match day | Hofmarcher et al. [37] |
| Flight distance | This distance is calculated from Taipei to the city hosting the event (km) | Glass et al. [38] |
| Actual points | The actual points allocated in each event | Sitarz [39] |
| Best points | The champion points of each game | |
| Prize money | The actual prize money of each event | Parshakov & Zavertiaeva [40]. Glass et al. [38] |
| Highest prize money | The champion prize money of each event | |
| Participants | Participants of each game in 2019 | Júnior et al. [41] |
| Best ranking | Best ranking of each game in 2019 | Silveira Gontijo [42] |
| Event Location | Entrance Fee (USD) | Daily Travel Expense (USD) | Days | Local Travel Expense | Flight Distance (Km) | Best Points | Highest Prize Money | Participants | Best Ranking of TPE |
|---|---|---|---|---|---|---|---|---|---|
| Hungary | 187 | 234 | 6 | 1404 | 8856 | 1800 | 18,500 | 208 | 16 |
| Qatar | 207 | 290 | 6 | 1740 | 6930 | 2250 | 33,000 | 162 | 8 |
| China | 207 | 180 | 6 | 1080 | 499 | 2250 | 44,000 | 153 | 32 |
| Hong Kong | 187 | 308 | 6 | 1848 | 807 | 1800 | 18,600 | 131 | 32 |
| Japan | 207 | 206 | 5 | 1030 | 1359 | 2250 | 30,000 | 104 | 2 |
| Korea | 187 | 220 | 6 | 1320 | 1342 | 1800 | 16,000 | 124 | 32 |
| Australia | 207 | 212 | 6 | 1272 | 7419 | 2250 | 35,000 | 118 | 16 |
| Bulgaria | 187 | 127 | 6 | 762 | 8790 | 1800 | 21,000 | 165 | 8 |
| The Czech Republic | 187 | 126 | 6 | 756 | 9029 | 1800 | 21,000 | 207 | 1 |
| Sweden | 187 | 253 | 6 | 1518 | 8344 | 1800 | 18,500 | 161 | 32 |
| Germany | 207 | 180 | 6 | 1080 | 9081 | 2250 | 30,000 | 199 | 32 |
| Austria | 207 | 185 | 6 | 1110 | 9129 | 2250 | 30,000 | 192 | 8 |
| Event Location | Input | Output | Efficiency | Returns to Scale | Efficiency Ranking | |||||
|---|---|---|---|---|---|---|---|---|---|---|
| Local Travel Expense | Flight Distance | Best Points | Prize Money | CRSTE | VRSTE | SE | ||||
| Hungary | R | 1404 | 8856 | 1800 | 18,500 | 0.563 | 0.626 | 0.899 | Irs | 10 |
| Qatar | P | 1740 | 6930 | 2250 | 33,000 | 0.586 | 0.598 | 0.980 | Drs | 9 |
| China | P | 1080 | 499 | 2250 | 44,000 | 1.000 | 1.000 | 1.000 | - | 1 |
| Hong Kong | R | 1848 | 807 | 1800 | 18,600 | 0.495 | 0.618 | 0.800 | Irs | 12 |
| Japan | P | 1030 | 1359 | 2250 | 30,000 | 1.000 | 1.000 | 1.000 | - | 1 |
| Korea | R | 1320 | 1342 | 1800 | 16,000 | 0.635 | 0.793 | 0.800 | Irs | 8 |
| Australia | P | 1272 | 7419 | 2250 | 35,000 | 0.796 | 0.824 | 0.966 | Drs | 7 |
| Bulgaria | R | 762 | 8790 | 1800 | 21,000 | 0.995 | 1.000 | 0.995 | Irs | 4 |
| The Czech Republic | R | 756 | 9029 | 1800 | 21,000 | 1.000 | 1.000 | 1.000 | - | 1 |
| Sweden | R | 1518 | 8344 | 1800 | 18,500 | 0.524 | 0.593 | 0.884 | Irs | 11 |
| Germany | P | 1080 | 9081 | 2250 | 30,000 | 0.907 | 0.954 | 0.951 | Drs | 5 |
| Austria | P | 1110 | 9129 | 2250 | 30,000 | 0.883 | 0.928 | 0.952 | Drs | 6 |
| mean | 1243 | 5965 | 2025 | 26,300 | 0.782 | 0.828 | 0.936 | |||
| Event Location | Local Travel Expense (USD) | Flight Distance (Km) | ||||
|---|---|---|---|---|---|---|
| Original | Suggested | Difference | Original | Suggested | Difference | |
| Hungary | 1404 | 879 | 525 | 8856 | 5545 | 3311 |
| Qatar | 1740 | 1040 | 700 | 6930 | 1175 | 5755 |
| Hong Kong | 1848 | 1808 | 40 | 807 | 499 | 308 |
| Korea | 1320 | 1047 | 273 | 1342 | 1064 | 278 |
| Australia | 1272 | 1048 | 224 | 7419 | 1051 | 6368 |
| Bulgaria | 762 | 762 | 0 | 8790 | 8790 | 0 |
| Sweden | 1518 | 900 | 618 | 8344 | 4950 | 3394 |
| Germany | 1080 | 1030 | 50 | 9081 | 1359 | 7722 |
| Austria | 1110 | 1030 | 80 | 9129 | 1359 | 7770 |
| Event Location | Input | Output | Efficiency | Returns to Scale | Efficiency Ranking | |||
|---|---|---|---|---|---|---|---|---|
| Participants | Actual Points | Prize Money (USD) | CRSTE | VRSTE | SE | |||
| Hungary | 208 | 720 | 1100 | 0.200 | 0.400 | 0.500 | drs | 10 |
| Qatar | 162 | 1125 | 4000 | 0.401 | 0.625 | 0.642 | drs | 4 |
| China | 153 | 675 | 2050 | 0.255 | 0.375 | 0.680 | drs | 7 |
| Hong Kong | 131 | 540 | 800 | 0.238 | 0.300 | 0.794 | drs | 9 |
| Japan | 104 | 1800 | 15,000 | 1.000 | 1.000 | 1.000 | - | 1 |
| Korea | 124 | 540 | 750 | 0.252 | 0.300 | 0.839 | drs | 8 |
| Australia | 118 | 900 | 3000 | 0.441 | 0.500 | 0.881 | drs | 3 |
| Bulgaria | 165 | 900 | 2800 | 0.315 | 0.500 | 0.630 | drs | 6 |
| The Czech Republic | 207 | 1800 | 21,000 | 0.703 | 1.000 | 0.703 | drs | 2 |
| Sweden | 161 | 540 | 700 | 0.194 | 0.300 | 0.646 | drs | 12 |
| Germany | 199 | 675 | 1200 | 0.196 | 0.375 | 0.523 | drs | 11 |
| Austria | 192 | 1125 | 3500 | 0.339 | 0.625 | 0.542 | drs | 5 |
| mean | 160 | 945 | 4658 | 0.378 | 0.525 | 0.698 | ||
| Event Location | Points | Prize Money | ||||||
|---|---|---|---|---|---|---|---|---|
| Champion | Original | Suggested | Difference | Champion | Original | Suggested | Difference | |
| Hungary | 1800 | 720 | 1800 | 1080 | 18,500 | 1100 | * 18,500 | 17,400 |
| Qatar | 2250 | 1125 | 1800 | 675 | 33,000 | 4000 | 18,379 | 14,379 |
| China | 2250 | 675 | 1800 | 1125 | 44,000 | 2050 | 17,854 | 15,804 |
| Hong Kong | 1800 | 540 | 1800 | 1260 | 18,600 | 800 | 16,573 | 15,773 |
| Korea | 1800 | 540 | 1800 | 1260 | 16,000 | 750 | * 16,000 | 15,250 |
| Australia | 2250 | 900 | 1800 | 900 | 35,000 | 3000 | 15,816 | 12,816 |
| Bulgaria | 1800 | 900 | 1800 | 900 | 21,000 | 2800 | 18,553 | 15,753 |
| Czech | 1800 | 1800 | 1800 | 0 | 21,000 | 21,000 | 21,000 | 0 |
| Sweden | 1800 | 540 | 1800 | 1260 | 18,500 | 700 | 18,320 | 17,620 |
| Germany | 2250 | 675 | 1800 | 1125 | 30,000 | 1200 | 20,534 | 19,334 |
| Austria | 2250 | 1125 | 1800 | 675 | 30,000 | 3500 | 18,500 | 15,000 |
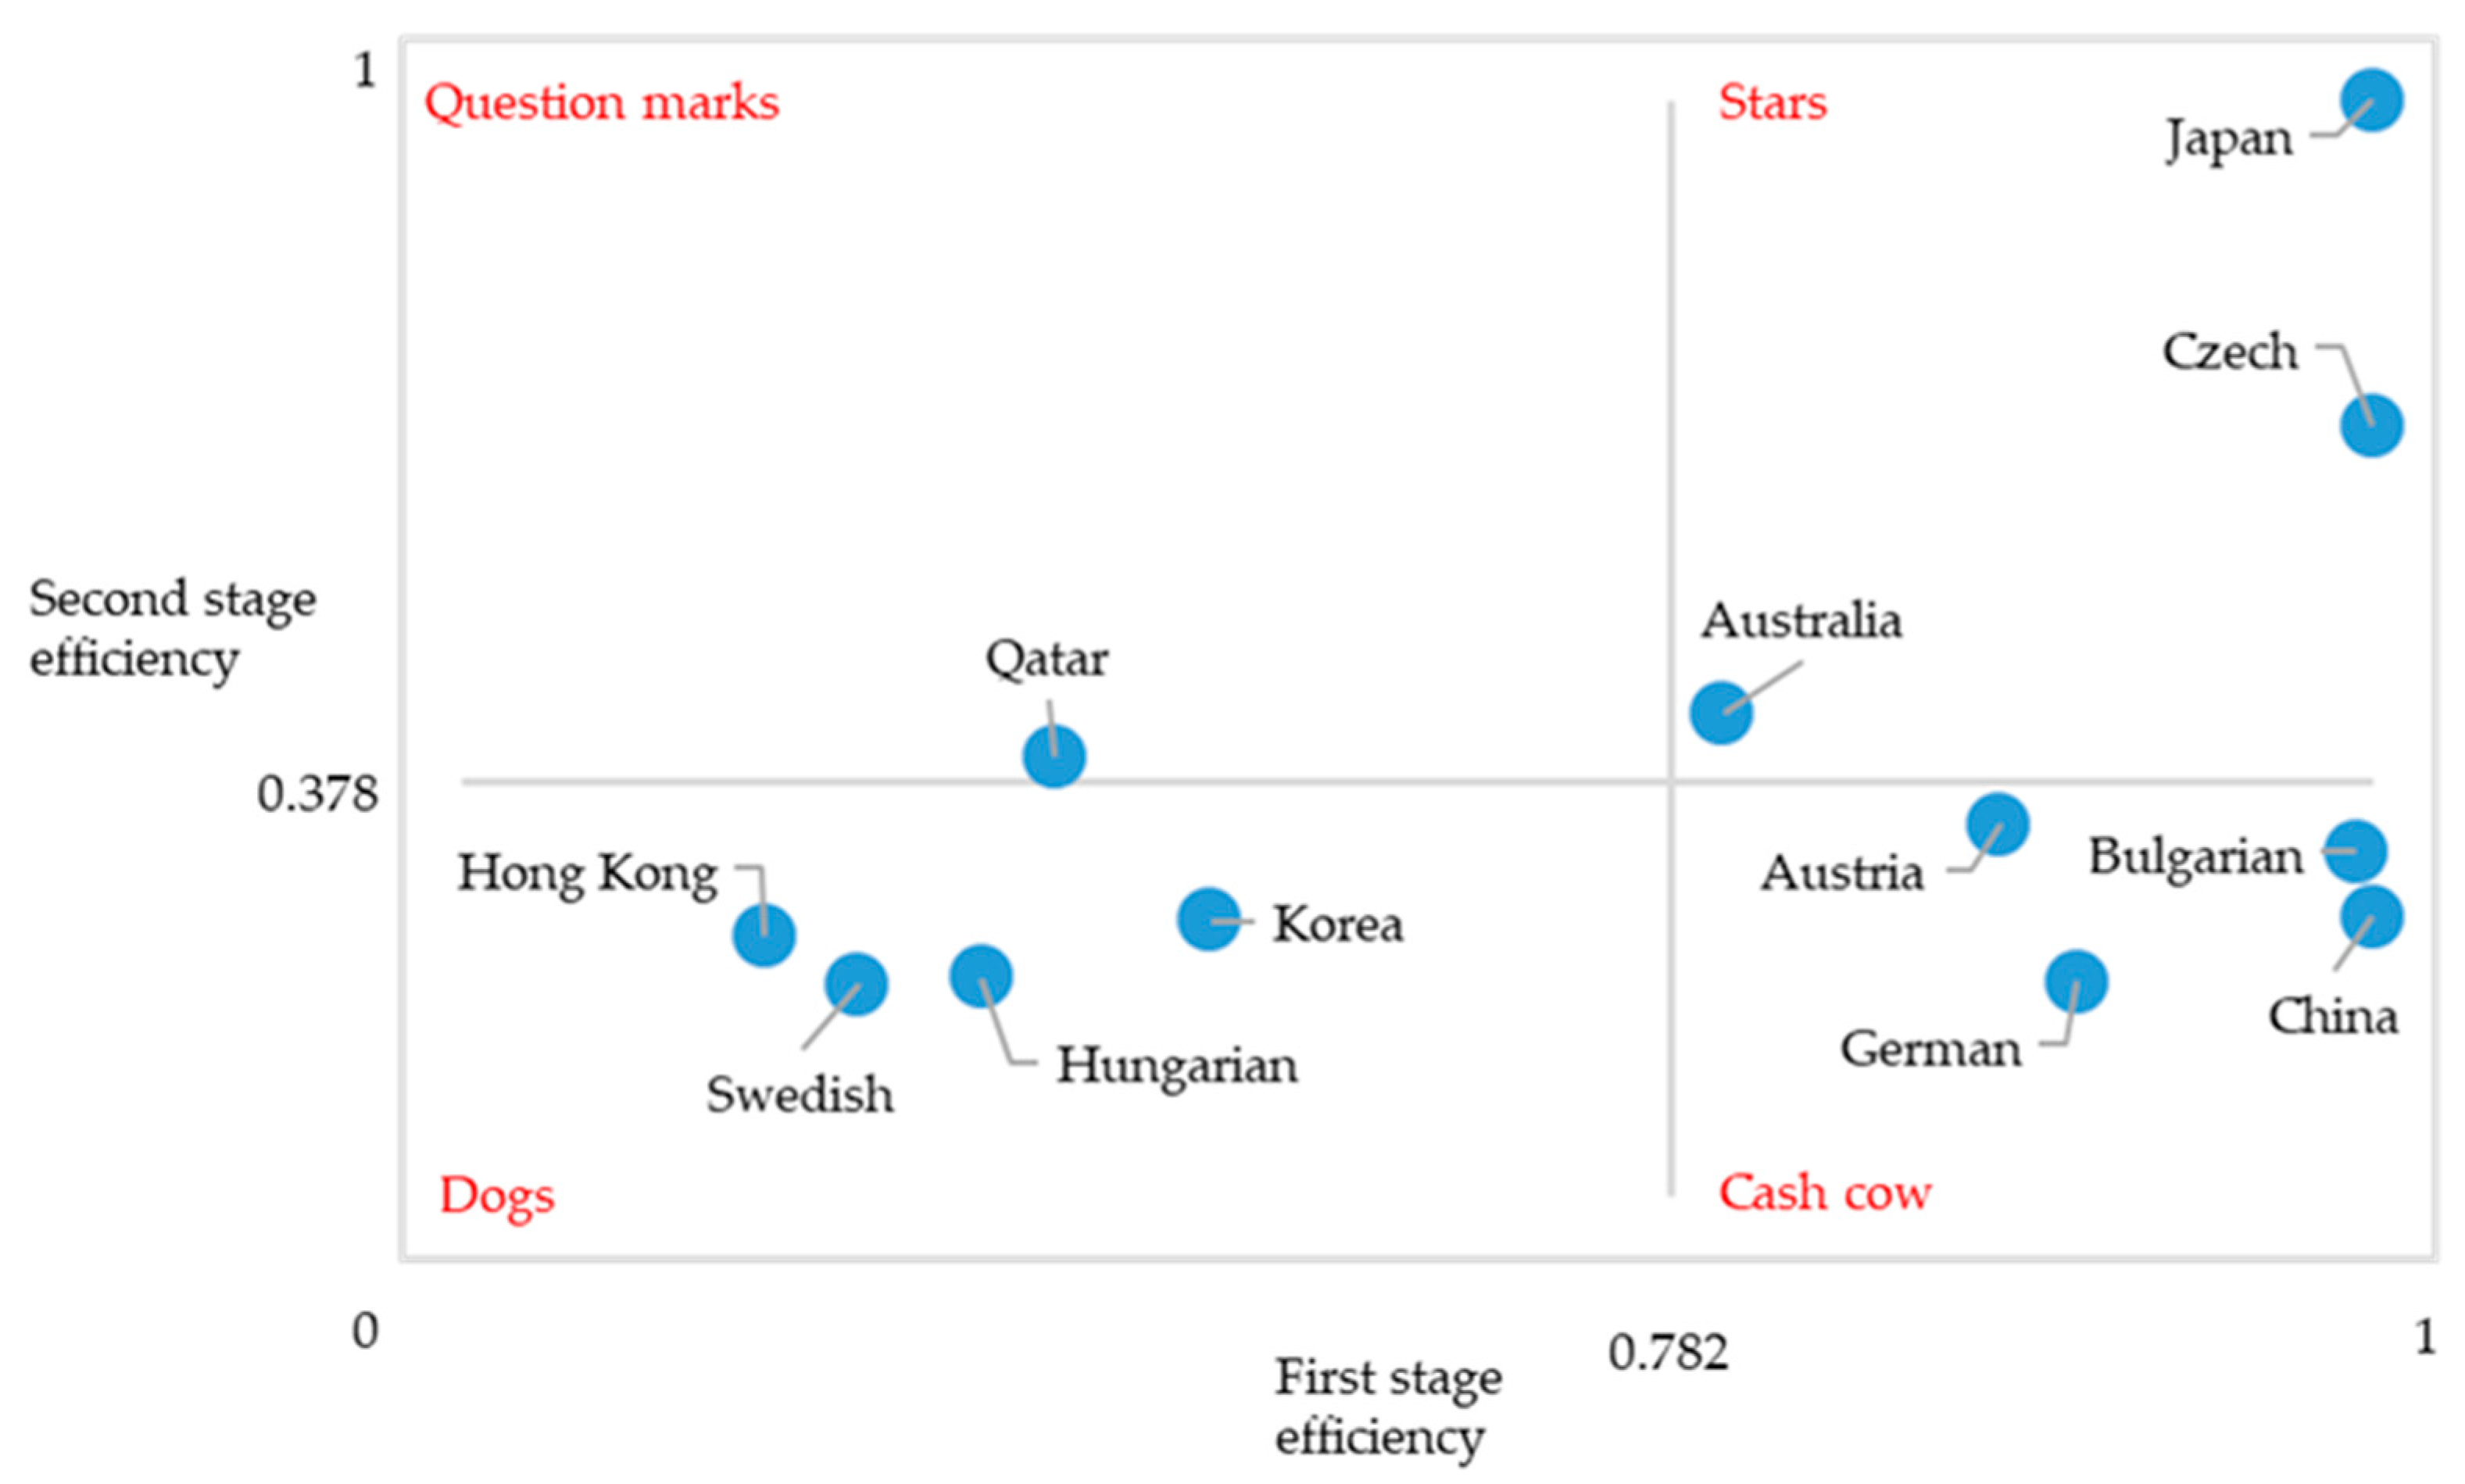
| Event Location | First Stage Efficiency (Ranking) | Second Stage Efficiency (Ranking) | BCG Matrix |
|---|---|---|---|
| Hungary | 0.563 (10) | 0.200 (10) | Dog |
| Qatar | 0.586 (9) | 0.401 (4) | Question mark |
| China | 1.000 (1) | 0.255 (7) | Cash cows |
| Hong Kong | 0.495 (12) | 0.238 (9) | Dog |
| Japan | 1.000 (1) | 1.000 (1) | Stars |
| Korea | 0.635 (8) | 0.252 (8) | Dog |
| Australia | 0.796 (7) | 0.441 (3) | Stars |
| Bulgaria | 0.995 (4) | 0.315 (6) | Cash cows |
| The Czech Republic | 1.000 (1) | 0.703 (2) | Stars |
| Sweden | 0.524 (11) | 0.194 (12) | Dog |
| Germany | 0.907 (5) | 0.196 (11) | Cash cows |
| Austria | 0.883 (6) | 0.339 (5) | Cash cows |
| mean | 0.782 | 0.378 |
Publisher’s Note: MDPI stays neutral with regard to jurisdictional claims in published maps and institutional affiliations. |
© 2021 by the authors. Licensee MDPI, Basel, Switzerland. This article is an open access article distributed under the terms and conditions of the Creative Commons Attribution (CC BY) license (https://creativecommons.org/licenses/by/4.0/).
Share and Cite
Chen, Y.-C.; Hu, L.-H.; Lu, W.C.; Wu, J.-Z.; Yang, J.-J. Multiple Criteria Decision-Making for Developing an International Game Participation Strategy: A Novel Application of the Data Envelopment Analysis (DEA) Two-Stage Efficiency Process. Mathematics 2021, 9, 1700. https://doi.org/10.3390/math9141700
Chen Y-C, Hu L-H, Lu WC, Wu J-Z, Yang J-J. Multiple Criteria Decision-Making for Developing an International Game Participation Strategy: A Novel Application of the Data Envelopment Analysis (DEA) Two-Stage Efficiency Process. Mathematics. 2021; 9(14):1700. https://doi.org/10.3390/math9141700
Chicago/Turabian StyleChen, Yi-Chieh, Lin-Huan Hu, Wan Chen Lu, Jei-Zheng Wu, and Jiun-Jen Yang. 2021. "Multiple Criteria Decision-Making for Developing an International Game Participation Strategy: A Novel Application of the Data Envelopment Analysis (DEA) Two-Stage Efficiency Process" Mathematics 9, no. 14: 1700. https://doi.org/10.3390/math9141700