Article

Apply Fuzzy DEMATEL to Explore the Decisive Factors of the Auto Lighting Aftermarket Industry in Taiwan

1
College of Management, Da-Yeh University, Changhua 51591, Taiwan
2
College of Music and Movie & TV, Tianjin Normal University, Tianjin 300384, China
3
Department of Management and Information, NOU, New Taipei 247031, Taiwan
4
Department of Business Administration, Feng Chia University, Taichung 40724, Taiwan
5
Department of Business Administration, Da-Yeh University, Changhua 51591, Taiwan
6
Department of Information Management, Da-Yeh University, Changhua 51591, Taiwan
*
Author to whom correspondence should be addressed.
Mathematics 2020, 8(7), 1187; https://doi.org/10.3390/math8071187
Submission received: 18 June 2020 / Revised: 15 July 2020 / Accepted: 16 July 2020 / Published: 19 July 2020
(This article belongs to the Special Issue Fuzzy Applications in Industrial Engineering)

Abstract

:
Continuous improvement and innovation are solid foundations for the company to maintain excellent performance and competitive advantage. As the limited resources possessed by companies generally result in the incapability of implementing several improving plans simultaneously, researchers advocate that companies should evaluate the influential relationships among key success factors (KSFs) to explore the more dominant determinants for designing improving actions. This study focused on the auto lighting aftermarket (AM) industry in which the KSFs have not yet been adequately performed to explore the decisive criteria of an improvement strategy. After a literature review and a survey of experts, a preliminary list of suitable evaluation criteria was derived. Consequently, the fuzzy and decision-making trial and evaluation laboratory (DEMATEL) method were employed to analyze and establish the causal relationship among criteria. This study contributes to the auto lighting AM industry by using a novel approach for identifying and prioritizing the KSFs. The result indicates that product integrity was the “cause” construct on the constructs of operating cost, quality and brand, technology development, and customer satisfaction. These findings contribute to help practitioners better design effective improvement strategies.

1. Introduction

Nowadays, the booming demand for vehicles in emerging markets has provided an excellent opportunity for business expansion and brought about the rise of manufacturers in developing countries in Asia. The flourish of the global-borderless automobile industry makes the auto parts manufacturers face fierce competition on business and product innovations. Normally, the aftermarket (AM) parts manufacturing has the obvious characteristic of small quantity and diversified production, and most of the enterprises in this industry were small and medium enterprises (SMEs). In Taiwan, the automobile component industry supply chain is complete and has the advantage of specialization and flexible manufacturing. There are around 3000 related Taiwanese manufacturers who possessed international competitiveness and have continuously invested in R&D and production technology improvement [1]. In recent years, car lights have switched from halogen bulbs to light-emitting diodes. Such changes profoundly challenged the AM parts manufacturers and future business operation management. Companies have been required to offer products and services that meet clients’ requirements in terms of shorter lead-time, higher quality, competitive prices, and responsive customer service in a global context.
As global competition becomes more intense, understanding the key success factors (KSFs) of enterprises is fundamental to the survival and growth of enterprises [2,3,4,5], especially for developing strategies to help companies continuing their business operations [2,6]. There have been many studies on KSFs in the past, and different research methods were used, e.g., case studies [7,8], statistical surveys [9,10,11,12], conceptual reasoning [13], and literature review [14,15]. The results of these studies show that the competitiveness of successful companies is based on the advantages of successfully mastering the KSFs of the industry. However, the relationship between the multi-dimensioned industrial KSFs is complex. In addition, due to the limitation of resources, companies are not feasible to optimize all key factors simultaneously. This leads the identification of more influential KSFs which are very important, in doing so, managers of companies can grasp the dominant KSFs to maximize the effectiveness of limited resources and sustain a focal firm’s competitive advantages in the long run [16,17]. However, such an influence–relations evaluation has not yet been adequately performed in the auto lighting AM industry which is topic scholars who have studied the KSFs rarely discuss. Therefore, this study intends to use a novel method to respond to the critical and urgent need of Taiwanese auto lighting AM parts manufacturers, to help them develop effective strategic guidance with efficient resource allocation directions for sustainable competitive advantages.
This study integrates the fuzzy technique with DEMATEL for several reasons. First, due to the multi-dimensional and interactive nature of industrial KSFs, methods of assessment that combine quantitative viewpoints and qualitative analysis can overcome the concerns of subjective and inaccurate traditional methods. Second, the fuzzy theory has been widely used in multi-criteria management decision analysis. In the fuzzy theory, experts can directly use natural semantics to evaluate, and then the semantic description is converted into the assessor’s evaluation value of the degree of relationship or possibility of the occurrence of different events through different membership function relationships. So, the evaluator can easily and fully express the evaluation value of his subjective judgment. Third, DEMATEL is suitable for the analysis and evaluation of uncertain and ambiguous context such as the competitive auto lighting AM industry. The DEMATEL mainly analyzes the tangled and complex correlation of multi-criteria in social science problems and explores the relevance and causality between various criteria. It made up the weakness of traditional statistical analysis methods by obtaining the directionality and degree of influence between indicators. To our knowledge, The DEMATEL method has not yet been applied in the context of the auto lighting AM industry.
In this study, we attempt to establish a comprehensive framework of KSFs in the auto lighting AM industry. First, 20 indicators of the KSFs were identified and summarized from the literature review as well as the consultation of practical experts. Then, factors analysis and the DEMATEL method were applied to explore the causal relationships and to confirm the KSFs’ causality and influence degree. So, enterprises can choose the most favorable business strategy guidelines according to their business strategy gap.

2. Literature Review

2.1. Auto Lighting Industry

The auto lighting industry is a highly capitalized, technological, and industrialized integrated industry in which scope covers machinery, mold manufacturing, light bulb manufacturing, automation, electronics, information, materials and chemicals, trade, plastics, vacuum plating, etc. The employment-to-population ratio in the automobile industry is much higher than the general technology industry [18]; therefore, most of the developing countries look at the automobile and its related industries as essential developing forces.
In Taiwan, the automobile component industry growing fast. Even at the time of the financial crisis in 2008, the total production value reached 183.9 billion NT, and the sub-industry of auto lighting components accounted for 12.7 billion NT, showing the highest growth rate among related industries. In 2009, the world was affected by the financial turmoil and impacted the automotive component industry. Large European and American companies gradually outsource the manufacturing of automobile components. In the meantime, the auto lighting industry experienced rapid growth, due to the technological paradigm shift from traditional halogen bulbs to light-emitting diodes (LEDs), which grew to 38.69 billion NT in 2017 [19]. Therefore, such a continued growth in the auto lighting industry drives innovation in Taiwan’s automobile industry.
The automobile supply chain in Taiwan is well-established and closely clustered which is characterized as a dense supply network of upstream, middle, and downstream with flexibility in production and agility in customer response [1]. Most manufacturers in this sector are SMEs that operate as original equipment manufacturers (OEMs) [18]. The production value of Taiwan’s auto lighting AM industry accounts for a total of 60% of the global.

2.2. Key Success Factors

Daniel [20] first proposed the concept of key success factors and believed that most industries have three to six KSFs. If an enterprise can flexibly master and better use it, the company will have a competitive advantage. Aaker [21] believed that KSFs refer to the most important competitiveness and assets of the company. Aaker and Moorman [22] further pointed out that companies “only by grasping the KSFs of the industry, can they establish a lasting competitive advantage”. The KSFs are the basic factor of the company’s success and performance in the field of management activities [23,24]. These factors refer to satisfactory operating results in the field of management activities which can ensure the excellent performance of individuals, departments, or enterprises [25,26]. Therefore, the KSFs are the top priority in industry analysis, and it is also an important control variable in management and a source of competitive advantage. Besides, Boynton and Zmud [27] pointed out that the KSFs are some things that managers or enterprises must give special and continuous attention if they want to have a competitive advantage or achieve excellent performance. This definition includes the main factors of the current and future business activities of the company, so the KSFs are an important ingredient to achieve quality management [15], organizational goals [28,29,30], and organizational performance [31,32].
Also, the KSFs will vary with different industries, time, and market [33]. For example, the KSFs of Taiwan’s information industry can be summarized into six major factors: marketing and product innovation capability, design and process innovation capability, mass production capacity, product line integrity capability, service support capability, cost efficiency capability. Among these, the “marketing and product innovation capability” and “design and process innovation capability” are the most important criteria [34]. Another example of a KSF is the bio-industry in Taiwan, in this context, the manufacturing R&D innovation capability, manufacturing quality control capability, product commercialization capability, technology R&D and innovation capability, technical and R &D personnel quality training capability, qualities of senior executives [35] are six elemental factors. Furthermore, the KSFs of the Taiwan service industry include three main factors: technical capability, service development and brand strategy, and excellent customer service [36]. For the silicon wafer material industry in Taiwan, the KSFs are five major factors: management culture, corporate vision, production and support systems, capital cost management capability, technological innovation, market development capability, and cooperation with political and economic laws [37]. Finally, for the cement industry in Taiwan, the KSFs include the material price control capability, cost leadership capability, master customer loyalty to the company, the capability of strategic alliances in the same industry, and different industries [38,39]. In sum, based on the above review, we can see that the KSFs among different industries share consistent concepts in terms of operating cost, technology development, quality and brand, product integrity, and customer satisfaction.
The automobile industry is the most important section that strives to achieve quality management, low production costs, continuous improvement of processes, development of the supply chain, and adoption of advanced technology [40]. Roth and Miller [41] pointed out that the success factors of the manufacturing include manufacturing competitive capabilities such as quality, flexibility, delivery, and cost, etc. When a focal company has a good manufacturing competitive capability, this capability will further improve its business performance. Works of several scholars provide us with different points of view regarding the management of the auto lighting AM industry; these insights further contribute to our understanding of the potential KSFs, e.g., the performance level [42], component integration [43], component quality [44], new product development performance [45], customer demands [46], and business performance [47]. Based on the above literature, this study summarizes the KSFs of Taiwan auto lighting AM industry, as five factors: business cost, quality and brand, technological development, product integrity, customer satisfaction.
Business cost is one of the factors that be might essential in affecting companies’ competitive advantage [48]. Cost reduction is the most important management activity in the operation of the enterprise, as it directly affects the survival capability of companies; cost reduction can be achieved through promoting standardization of materials [49,50,51,52]. Porter [53] believes that the more bargaining power over the suppliers the companies have, the more competitive advantage they have, and the more reduction of their operating costs [54]; the price of key components purchased are key in affecting production costs [55]. Through outsourcing, operating costs can be decreased and business performance can be improved [56,57]. Furthermore, mass production can also beneficial in reducing operating costs [58]. The quality of products/services can be secured through applying incentive and reward systems [59,60] which can effectively reduce the loss of resources and the operating costs [18]. In sum, the operating cost construct in the present study contained six indicators: promoting standardization of materials, bargaining power over the suppliers, key component prices, outsourcing production, mass production, incentive, and reward system.
Brands can enhance corporate recognition and customer satisfaction and establish a long-term competitive advantage [61]. High-quality products/services can help companies to improve their brand image [62]; thus, quality and brand are one of the KSFs for business operations [63]. The qualities of service and service environment [61,64] can be achieved through establishing a quality certification and management system [65]. Moreover, researchers studying the auto lighting industry believe that brand awareness and reputation [47], process productivity improvement [46], planning future vision [44], and profit feedback to the community [66] are all elements of the quality and brand construct. Therefore, this construct in the present study included six factors: brand awareness and reputation, obtained quality certification, process productivity improvement, planning future vision, profit feedback to the community, perfect quality management system.
In Taiwan, auto parts manufacturers are mostly SMEs, and for these enterprises, the technology capability is one of the KSFs [39]. Also, strong mold development capability is an important criterion for the successful global expansion of Taiwanese auto lighting AM manufacturers [67]. Some scholars studying the auto lighting industry identified that the technological development construct contains the concepts of cross-border collaborations [42], product portfolio strengthening [18], optical technology improvement [43], senior executive support [66], cross-departmental teams support [47], etc. Therefore, the technology development constructs in this study include six indicators, that are: mold development capability, cross-border collaborative development, product portfolio enhancement, optical technology improvement, senior executive support, and cross-departmental teams supporting each other.
Product integrity is another KSF for the business operation of the auto lighting industry [18]. The capabilities of flexible, miniature and diversified production is another important criterion for success for a manufacturer in a competitive global market [67]. The traditional mass production of single-style has been unable to meet customer demands, and the holding of the ability to customize large-scale production is one important competitive advantages of Taiwanese manufacturers [68]. Also, the scholars pointed out that product integrity includes product differentiation [44], product value-added [45], and accelerating of new product introduction frequency [46]. Consequently, the construct of product integrity in this study included five indicators: product differentiation, miniature production and diversified production, product value-added, acceleration of new product introduction frequency, and customized manufacturing.
As companies are required to respond to customer demand quickly [69,70], customer satisfaction is an elemental construct in the KSFs of the automobile industry [40]. Customer satisfaction is also an important indicator in measuring customer satisfaction [71] and achieving corporate performance [72,73,74]. In addition, factors that can improve customer satisfaction include shortening the operation time [75] and on-time delivery [76]. Some scholars pointed out building global marketing channels [66] and maintaining the level of creativity and innovation are also influential [44]. Therefore, customer satisfaction in the present study included five indicators, that are: on-time delivery, shortening the operation time of customers/suppliers, building global marketing channels, quick response to customer demands, and maintaining the level of creativity and innovation.
Based on the abovementioned literature, this study creates a structural framework of the constructs and indicators under each construct to represent the collection of KSFs in terms of the auto lighting AM industry. To enhance the validity of the factors, this study adopted in-depth interviews with industry experts to evaluate and finalize the list of indicators; finally, a total of 28 critical indicators were obtained as shown in Appendix A (the definition of KSFs of the auto lighting aftermarket industry) and Appendix B (the questionnaire used in this study).
The KSFs of business management are generally integrated as a system of multi-dimensional constructs and indicators. The relationships among indicators are complicated and might be interdependent. According to a study by Millson and Wilemon [77], the reason for the failure of business management is because they ignored the integration of key factors required for success. Chen et al. [78] further pointed out the need to simultaneously consider the causal relationship of different key factors when designing a business strategy. Grasping the few decisive factors help managers to utilize the limited resources most efficiently. Since companies generally hold limited resources in hand to achieve strategic goals, concentration strategies are indispensable [2]. Moreover, as the external environment is dynamic, the KSFs are not static and should be a contextual fit. In the past, scholars have put forward many different opinions, but in fact, it is difficult to produce a consensus set. It is more difficult to propose the KSFs for specific industry [3]. Therefore, for any industry, the question is, how to identify and understand the relationships among KSFs to help to develop a suitable business strategy? The present study aimed to fill this gap in the context of the auto lighting AM industry.

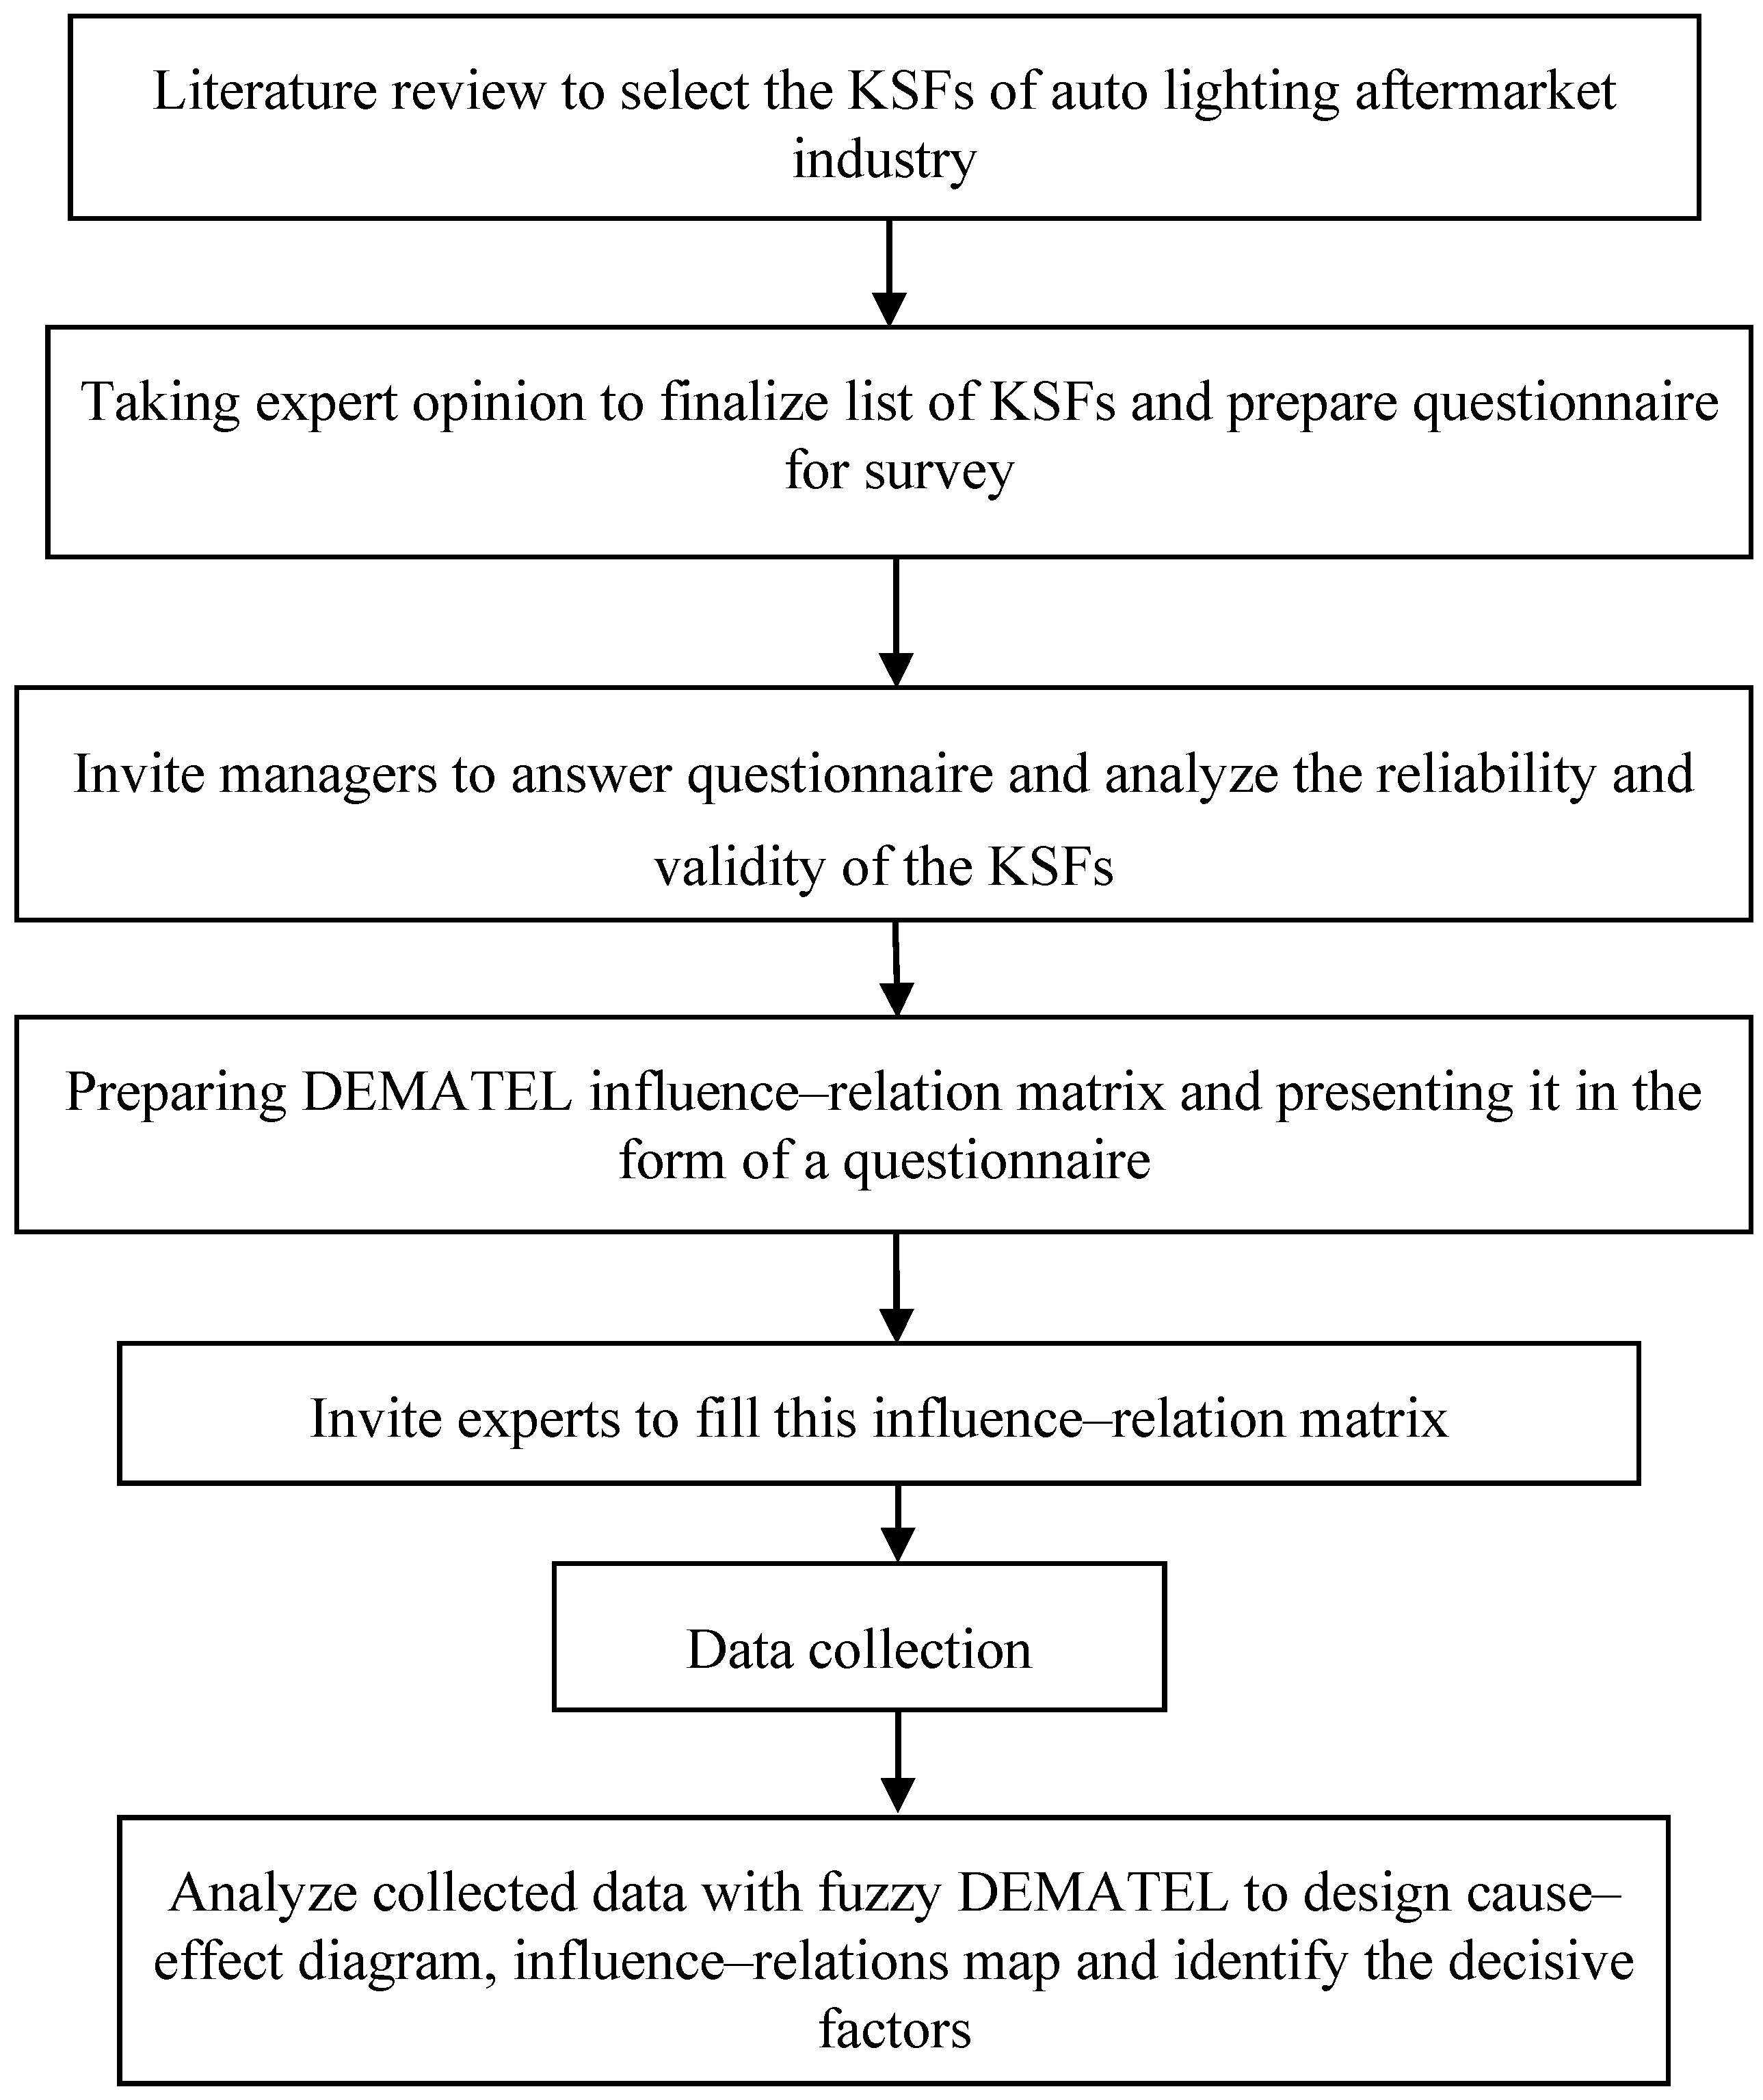
3. Research Methodology

The purpose of this research was to establish the cause and effect relationship among the KSFs of the auto lighting AM industry. To help in structuring the methodology followed, a research flowchart was used as shown in Figure 1. The research flowchart mainly depicts the process structure for analyzing the KSFs and then identifying the decisive factors.

The Fuzzy DEMATEL Approach

The DEMATEL technique is a comprehensive method for building and analyzing a structural model of causal relationships among various factors. The steps of the fuzzy DEMATEL approach process are presented below:
Step 1. Set-up direct relationship matrix Z: The first step of the fuzzy DEMATEL analysis is setting-up a direct relationship matrix Z (see Table 1) and presenting it in the form of a questionnaire for data collection.
Step 2: Define factors for evaluation and design a fuzzy semantic scale. In this step, it is first to prepare the critical factors for evaluation. Due to the fact of either imprecise or vague definitions of critical factors and incomplete information about relation, the causal relationships evaluation process is associated with uncertainty and complexity. Experts usually use Lingus to express the relationships. Fuzzy logic is a useful tool for capturing the ambiguity and multiplicity of linguistic judgment meanings required to express causal relationships. For dealing with the ambiguities of human assessments, the linguistic variable “influence” is used with five linguistic terms [79] as {Very high, High, Low, Very low, No} that is expressed in positive triangular fuzzy numbers (lij, mij, rij) as shown in Table 2.
After a fuzzy semantic scale was designed, experts were then invited and the direct relationship matrix was sent. Experts were asked to pairwise compare and make assessments in terms of influences and directions between factors in direct relationship matrix Z as shown in Table 1.
Step 3: Establish a fuzzy directed-relation matrix. After the experts finished comparing and assessing the influences and directions between factors, based on Table 2, the linguistic variable “influence” was transformed into positive triangular fuzzy numbers, then the initial fuzzy direct correlation matrix Z ˜ obtained as shown in (1).
Z ˜ = C 1 C 2 C n [ 0 ˜ z ˜ 12 z ˜ 21 0 ˜ z ˜ 1 n z ˜ 2 n z ˜ n 1 z ˜ n 2 0 ˜ ]
And Z ˜ i j = ( l i j , m i j , r i j ) . is the triangular fuzzy number, and the diagonal line value Z ˜ i i , i = 1 , 2 , , n is (0, 0, 0.25).
Step 4: Normalized fuzzy directed-relation matrix Z ˜ . For normalizing fuzzy direct-relation matrix, let:
a ˜ i j = j = 1 n z ˜ i j = ( j = 1 n l i j , j = 1 n m i j , j = 1 n r i j )
and:
r = max ( max 1 i n ( j = 1 n r i j ) , max 1 j n ( i = 1 n r i j ) )
Then, the normalized fuzzy direct-relation matrix X ˜ can be obtained as:
X ˜ = r 1 Z ,
X ˜ = [ x ˜ 11 x ˜ 12 x ˜ 21 x ˜ 22 x ˜ 1 n x ˜ 2 n x ˜ m 1 x ˜ m 2 x ˜ m n ]
where
x ˜ i j = z ˜ i j r = ( l i j r , m i j r , r i j r )
Step 5: Total fuzzy relation matrix T ˜ . When the normalized fuzzy direct relation matrix is obtained, let I am denoted as the identity matrix, then the total fuzzy relation matrix T ˜ can be obtained from the following equation:
T ˜ = X ˜ + X ˜ 2 + + X ˜ k = X ˜ ( I + X ˜ + X ˜ 2 + + X ˜ k 1 ) = X ˜ ( I + X ˜ + X ˜ 2 + + X ˜ k 1 ) ( I X ˜ ) ( I X ˜ ) 1 = X ˜ ( I X ˜ ) 1 ,   when   lim k X ˜ k = [ 0 ] n x n
T ˜ = [ t ˜ 11 t ˜ 12 t ˜ 21 t ˜ 22 t ˜ 1 n t ˜ 2 n t ˜ m 1 t ˜ m 2 t ˜ m n ]
when
t ˜ i j = ( l i j , m i j , , r i j )
[ l i j ] = X ˜ 1 × ( I X ˜ l ) 1 [ m i j ] = X ˜ m × ( I X ˜ m ) 1 [ r i j ] = X ˜ r × ( I X ˜ r ) 1
Step 6: Defuzzify the total fuzzy relation matrix T ˜ . Through formula (5), the total fuzzy relation matrix T ˜ can be defuzzified into a crisp total-relation matrix T.
t i j = [ ( r i j l i j ) + ( m i j l i j ) ] 3 + l i j
Step 7: Sum up the rows and columns. The sum of rows and the sum of columns are separately denoted as d and r within the total-relation matrix T through the formulas (6):
T = [ t i j ]   ,   i , j { 1 , 2 , , n }
d = ( d i ) n × 1 = [ j = 1 n t i j ] n × 1 ; r = ( r j ) 1 × n = [ i = 1 n t i j ] 1 × n
Step 8: Analyzing and establishing a structural model. The purpose of the DEMATEL analysis is to assess the cause-effect relationships between factors and establish a structural model. According to the definition of the causal diagram in DEMATEL analysis, the causal diagram between factors can be acquired by mapping the dataset of the value (d + r) and (dr), where the horizontal axis (d + r) was made by adding d to r, and the vertical axis (dr) was made by the subtracting d from r. The value (d + r) represents the strength of influence between the factors, also known as centrality, that depicts the prominence or importance degree of each factor, more value means more infection. Also, (dr) presents the relation of the factors, known as causality, and stands for the mutual influence can divide the factors into a cause and an effect group. The plus value (dr) indicates that the factors belong to the cause group; the higher the value the more influence. The minus value (dr) signifies that the factors are regarded as the effect group [80]. To clearly define each factor’s implication in the causality diagram, the mean average of the (d + r) and (dr), it was set as the origin point, so the cause-effect diagram was further divided into four quadrants as cause factor, other factors, independent factor, and effect factor [81]. Then, the causal diagram can be constructed to visualize the factors’ position in relationships.
Furthermore, the total-relation matrix T provides information on how one factor influences another. The influence–relation map which indicates the cause-effect relationship among factors can be established based on the total-relation matrix T. To avoid over-complicated causality when drawing the influence–relation map, decision-maker group should set up a threshold value to filter out some negligible relationships. This way enables the decision-maker to choose only the relationships greater than the threshold value and to map the cause-effect relationship accordingly. Generally, the mean average of the total-relation matrix T was set as the threshold [82]. Hence, the causal diagrams visualized the complicated causal relationships of factors into a structural model, providing valuable insights for business strategy development. Further, with the help of a causal diagram, managers can make proper decisions by recognizing the difference between cause and effect factors.

4. A Practical Case Study

4.1. The Subject of a Case Study

The DP Company is an internationally recognized automobile lighting products-and-services company, particularly noted for the aftermarket section, earning annual revenue of about $519.66 million in 2019. Due to the increasingly fierce regional and global competition, DP Company has been required to supply products and services that meet clients’ needs with shorter lead time, higher quality, competitive prices, and improved customer service in a global context. Thus, even though the market shares of the DP Company’s auto lighting AM section are ranked as top in the world, the company is continuously looking for ways to keep their competitive advantages. In this case, the identification of industrial KSFs and influence–relationships are essential for strategy development. In the present literature, in the context of the auto lighting AM industry, a comprehensive cause-effect framework has not yet been adequately performed. The DP Company took advice from the authors and formed a competency development team that recruited several general managers to implement an improvement program. The following part shows how DP Company utilized our proposed fuzzy DEMATEL method to evaluate and segment the KSFs for better planning and implementing a competency development project.

4.2. Applications of the Proposed Method

4.2.1. Analysis of the Questionnaires

The competency development team followed the step procedure of our proposed method in Figure 1. First, they applied literature review and expert consultation to select KSFs for the auto lighting AM industry. In the end, 28 factors were selected as listed in Appendix A. These factors were further used in the design of the questionnaire for which a factor analysis was applied to examine the reliability and validity. By using the fuzzy DEMATEL method, the DP company can evaluate and get a comprehensive understanding of the relationships among KSFs.
Our sampling target was 80 experts who worked as main/senior manager in the auto lighting-related companies. The questionnaire was distributed via email and post, and, 58 returned it thus yielding a 70% response rate. After the deletion of the incomplete samples, the final number of useful samples was 56.
Our sample firm belongs to several segments of the automobile industry, including the automotive industry/locomotive sector (25%), the plastic injection sector (17.9%), and the machinery sector (12.5%). Besides, more than 64% of our sample firms have operated for less than 20 years; more than 55.2% have achieved their annual revenues to 1 million dollars or above. The majority (65.3%) of our sample are middle-size (i.e., more than 500 but fewer than 5000 employees) enterprises. Furthermore, 55.7% of the respondents are department managers or senior managers who have rich experience in management in auto lighting-related industries.

4.2.2. Factor Analysis

Here, factor analysis was used to determine whether the constructs of KSFs are sufficiently valid and reliable. According to the recommendations of Hairet al. [83], the deletion criteria for factor analysis are (1) commonalities less than 0.5; (2) the absolute value of factor loading is above 0.5; (3) two-factor loading appears, and the difference is less than 0.2.
Following these criteria, a total of eight indicators such as “mass production” were deleted. The retained 20 indicators are classified into five constructs, as “operating costs”, “quality and brand”, “technology development”, “product integrity”, and “customer satisfaction”. The cumulative explanatory variance was 69.5%. Furthermore, the composite reliability (CR) of the five constructs ranged between 0.65 and 0.83 and was above the 0.60 benchmark recommended by Bagozzi and Yi [84]. While the average variance extracted (AVE) from the five constructs ranged from 0.32 to 0.54, it was a little low for the threshold value of 0.5 recommended by Fornell and Larcker [85], except two constructs which had values that exceeded 0.5. The confirmatory factor analysis results are summarized in Table 3.
The goodness-of-fit of our model (in Table 4) was χ2/df = 2.886, which was less than the standard score of three suggested by Bentler and Bonett [86]. The goodness of fit index (GFI) had a score of 0.835, exceeding the 0.8 recommended by Hair et al. [83]. The adjusted goodness of fit index (AGFI) has a score of 0.816 exceeding the 0.8 recommended by Scott [87]. The root mean square error of approximation (RMSEA) had a score of 0.083 and was a little higher than the requirement (less than 0.8) suggested by Hair et al. [83]. All the scores of the normed-fit index (NFI) (0.922), Tucker-Lewis Index (TLI) (0.934), and competitive fit index (CFI) (0.947) exceed 0.9 recommended by Brown and Cudeck [88]. The results in Table 4 show the values of goodness-of-fit indices of the KSFs measurement model exceeded the minimum hurdle value.

4.2.3. Analyzing Cause and Effect Relations among the Main Constructs

To appropriately evaluate the relationships between constructs and indicators, the authors constructed a group of experts who are managers in marketing, financial, production, human resource, and information technology departments in the DP company. The group of 28 experts comprised five experts from the administration department, eight experts from the product development department, four experts from the production management department, two experts from the finance department, four experts from the planning department, three experts from the human resource department, and two experts from the information department. Each of these experts brought concerns and desires into the decision, which had to be reconciled by a consensus that was necessary since all parties would contribute to the success or failure of the decision. Moreover, to facilitate the experts’ holistic understanding of the objectives of the development project, what Fuzzy DEMATEL method is, and how to use direct relationship Matrix Z to pairwise compare and assess, a workshop was held to explain and practice. After that, following our proposal process and Fuzzy DEMATEL method, the causality and strength of the influence relationships among major constructs and indicators are evaluated. In this report, only the detailed evaluation process of major constructs was demonstrated, as follow:
Step 1: Set-up a direct relationship with Matrix Z. To collect experts’ influence–relation assessment of the main constructs and indicators, a direct relationship matrix Z was set up in Table 1.
Step 2: Define evaluation factors and design a fuzzy semantic scale: In this study, the evaluation main constructs were: operating cost (A1), quality and brand (A2), technology development (A3), product integrity (A4), and customer satisfaction (A5). Table 2 shows the fuzzy semantic scale and its corresponding fuzzy number, attribution function, etc., based on the classification of Li [79]. Then, we sent the direct relationship matrix to experts and asked them to make a pair-wise comparison among constructs and indicators. Also, the experts assess in terms of influences and directions among factors in the direct relationship matrix Z as shown in Table 1 (a sample only).
Step 3: Establish a fuzzy directed-relation matrix. Based on Table 2, we obtained the influences and directions among factors. The linguistic variable “influence” was transformed into positive triangular fuzzy numbers, then the initial fuzzy direct correlation matrix Z ˜ obtained. By using the arithmetic average to integrate the judgment, we got the initial fuzzy direct-relation matrix Z ˜ as shown in Table 5.
Step 4: Normalized fuzzy directed-relation matrix. By applying Equation (2), the calculated maximum r-value was 3.91. Then, Equation (3) was used to convert all the values in the fuzzy direct-relation matrix to obtain the normalized fuzzy direct-relation matrix Z ˜   as shown in Table 6.
Step 5: Establish a total fuzzy directed-relation matrix T ˜ . After obtaining the normalized fuzzy direct-relation matrix, the total fuzzy directed-relation matrix can be obtained by using the Equation (4).
Step 6: Defuzzify the total fuzzy directed-relation matrix T ˜ . Through Equation (5), the total fuzzy directed-relation matrix T ˜ can be defuzzified into a crisp total-relation matrix T as shown in Table 7. From the values in the total relation matrix, we can see the mutual relationship among these constructs. However, to indicate the proper relation and avoid overcomplicating the influence–relations map, this study applied the mean average as the threshold [82] if a value was higher than the threshold (3.51), its relationship will be shown in the influence–relations map.
Step 7: Analyzing and sum of rows and the sum of columns. The sum of rows and the sum of columns are separately denoted as d and r within the total-relation matrix T which can be obtained by using Equation (6) and the centrality (d + r) and causality (dr) also directly obtained, as shown in Table 8. Furthermore, the mean average of the (d + r) and (dr) was set as the origin point, the causal diagram could be acquired by mapping a dataset of (d + r, dr) and divided into four quadrants as shown in Figure 2.
As it can be seen in Table 8, the constructs of customer satisfaction (A5) and technology development (A3) had the greatest centrality (d + r) value. The construct of product integrity (A4) had a positive value in causality (dr), while the constructs of operating cost (A1), quality and brand (A2), technology development (A3), and customer satisfaction (A5) had negative causality (dr) values. This indicates that A4 plays a causal role in affecting A1, A2, A3, and A5. Based on the causal relationship analysis of the centrality and causality, A4 is the strongest influencing construct, and the most affected construct is A5. The A2 was also identified as an independent construct due to the fact of its low centrality as well as causality. This result indicates that the DP company should consider “product integrity” (A4) as its priority to improve its management competency.
Step 8: Analyzing and building an influence–relation map. Based on the influence–relation information given in Table 7, the influence–relation map indicating cause and effect relationship among construct can be illustrated as in Figure 2. In Figure 2, the dotted line represents a construct that affects another, and the double arrow indicates that the two constructs affect each other. Looking at Table 7 and Figure 2, product integrity (A4) is the “cause” that mostly affects the other “effect” constructs, i.e., the construct operating cost (A1), quality and brand (A2), technology development (A3), and customer satisfaction (A5). Among the effect groups, customer satisfaction had the strongest intensity and represents the final effect of the successful business operation and management of the DP company. The (dr) value of quality and brand was far lower than other constructs, which means although it is the most affected construct, the impact is small. Also, the operation cost, technology development, product integrity, and customer satisfaction all interact with each other. This means that the DP company must strengthen the technology development capability to meet customer demands, the actions will inevitably increase the operating costs and improve product integrity. Therefore, how to achieve customer satisfaction through technology development while effectively control the costs and obtaining benefits is an issue challenging the DP Company. Moreover, the relationship between product integrity and customer satisfaction might be circular, because there are a large effect and high importance between the two constructs.

4.2.4. Analyzing Cause and Effect Interrelations among Indicators

For the sake of further understanding, follow the same analysis process, the interrelationships among indicators under each construct were analyzed. The results of the degree of centrality and causality among indicators under each construct are listed in Table 9. Moreover, the cause-effect diagram and influence–relations map among indicators under various constructs shown in Figure 3.
From Table 9 and Figure 3a, for the construct “operating cost”, the indicator B2 had the biggest value of centrality (d + r). Regarding causality (dr), the indicators B1 and B4 were the cause indicators with a positive value, and B1 had the strongest influence power. In contrast, B2 and B3 were the effect indicators with negative causality (dr) value. Based on the causal relationship’s analysis of centrality and causality, B1 was the strongest influence indicator. The most affected indicator was B2. To control operating costs, when considering the construct’s indicator, the DP company was suggested to choose B1 as the determining criterion under the operating cost construct, which was the key criterion to effectively control costs.
The construct “quality and brand” can be found in Table 9 and Figure 3b. The centrality (d + r), C3′s value had the greatest influence. In the causality (dr), the values of C2 and C3 were positive, which means these were the cause indicators, and C3 was the strongest one. Conversely, the value of the C1 was negative as an effective indicator. Subject to the causal relationship’s analysis of centrality and causality, C3 was the strongest influence criterion, and C1 was the most affected criterion. To improve the quality and brand, the DP company was suggested to take C3 as the decisive and main indicator.
Regarding the construct “technology development”, it can be understood from Table 9 and Figure 3c. About centrality (d + r), D2′s value had the greatest influence. In the causality (dr) part, the three indicators D2, D4, and D5′s value were positive, indicating that these were cause indicators, and D5 was the strongest one. Contrarily, the two indicators D1 and D3 were negative in value which means these were effect indicators, and D1 had the largest negative value. Grounded on the causal relationship’s analysis of centrality and causality, D5 was the strongest influence criterion, and the most affected criterion was D1. With the purpose to enhance the technology development capability, the DP Company must apply D5 as the deciding criterion, and as the primary criterion for enhancing the technology development capability.
The results of the construct “product integrity” can be observed in Table 9 and Figure 3d. In the centrality (d + r) part, E4 had the greatest impact. In the causality (dr) part, the two indicators E1 and E4′s value were positive—cause indicators—and E4 was the strongest one. On the other hand, the two indicators E2 and E3 had negative values, which were effect indicators, and E3 had the maximum negative value. Contingent on the causal relationship’s analysis of centrality and causality, E4 was the strongest influence criterion, and the most affected criterion was E3. Concerning improving product integrity, the DP company was suggested to implement E4 as the most decisive criterion, i.e., the chief criterion, for the construct of product integrity.
From Table 9 and Figure 3e, we can see the relationships among indicators of the construct “customer satisfaction”. In terms of centrality (d + r), the indicator F4 has the greatest impact. In the causality (dr) part, the two indicators F3 and F4′s values were positive, which were causal indicators, and F3 was the strongest one. In contrast, the two indicator F1 and F2′s values were negative which represents these were the effect indicators and the F1 criterion had the largest negative value. The causal relationship’s analysis of centrality and causality reveals that F3 was the strongest influence criterion, and F1 was the most affected criterion. To improve customer satisfaction, when thinking over the indicator of this construct, the DP company was suggested to employ F3 as the decisive criterion, and the major criterion for improving customer satisfaction.

5. Result and Discussions

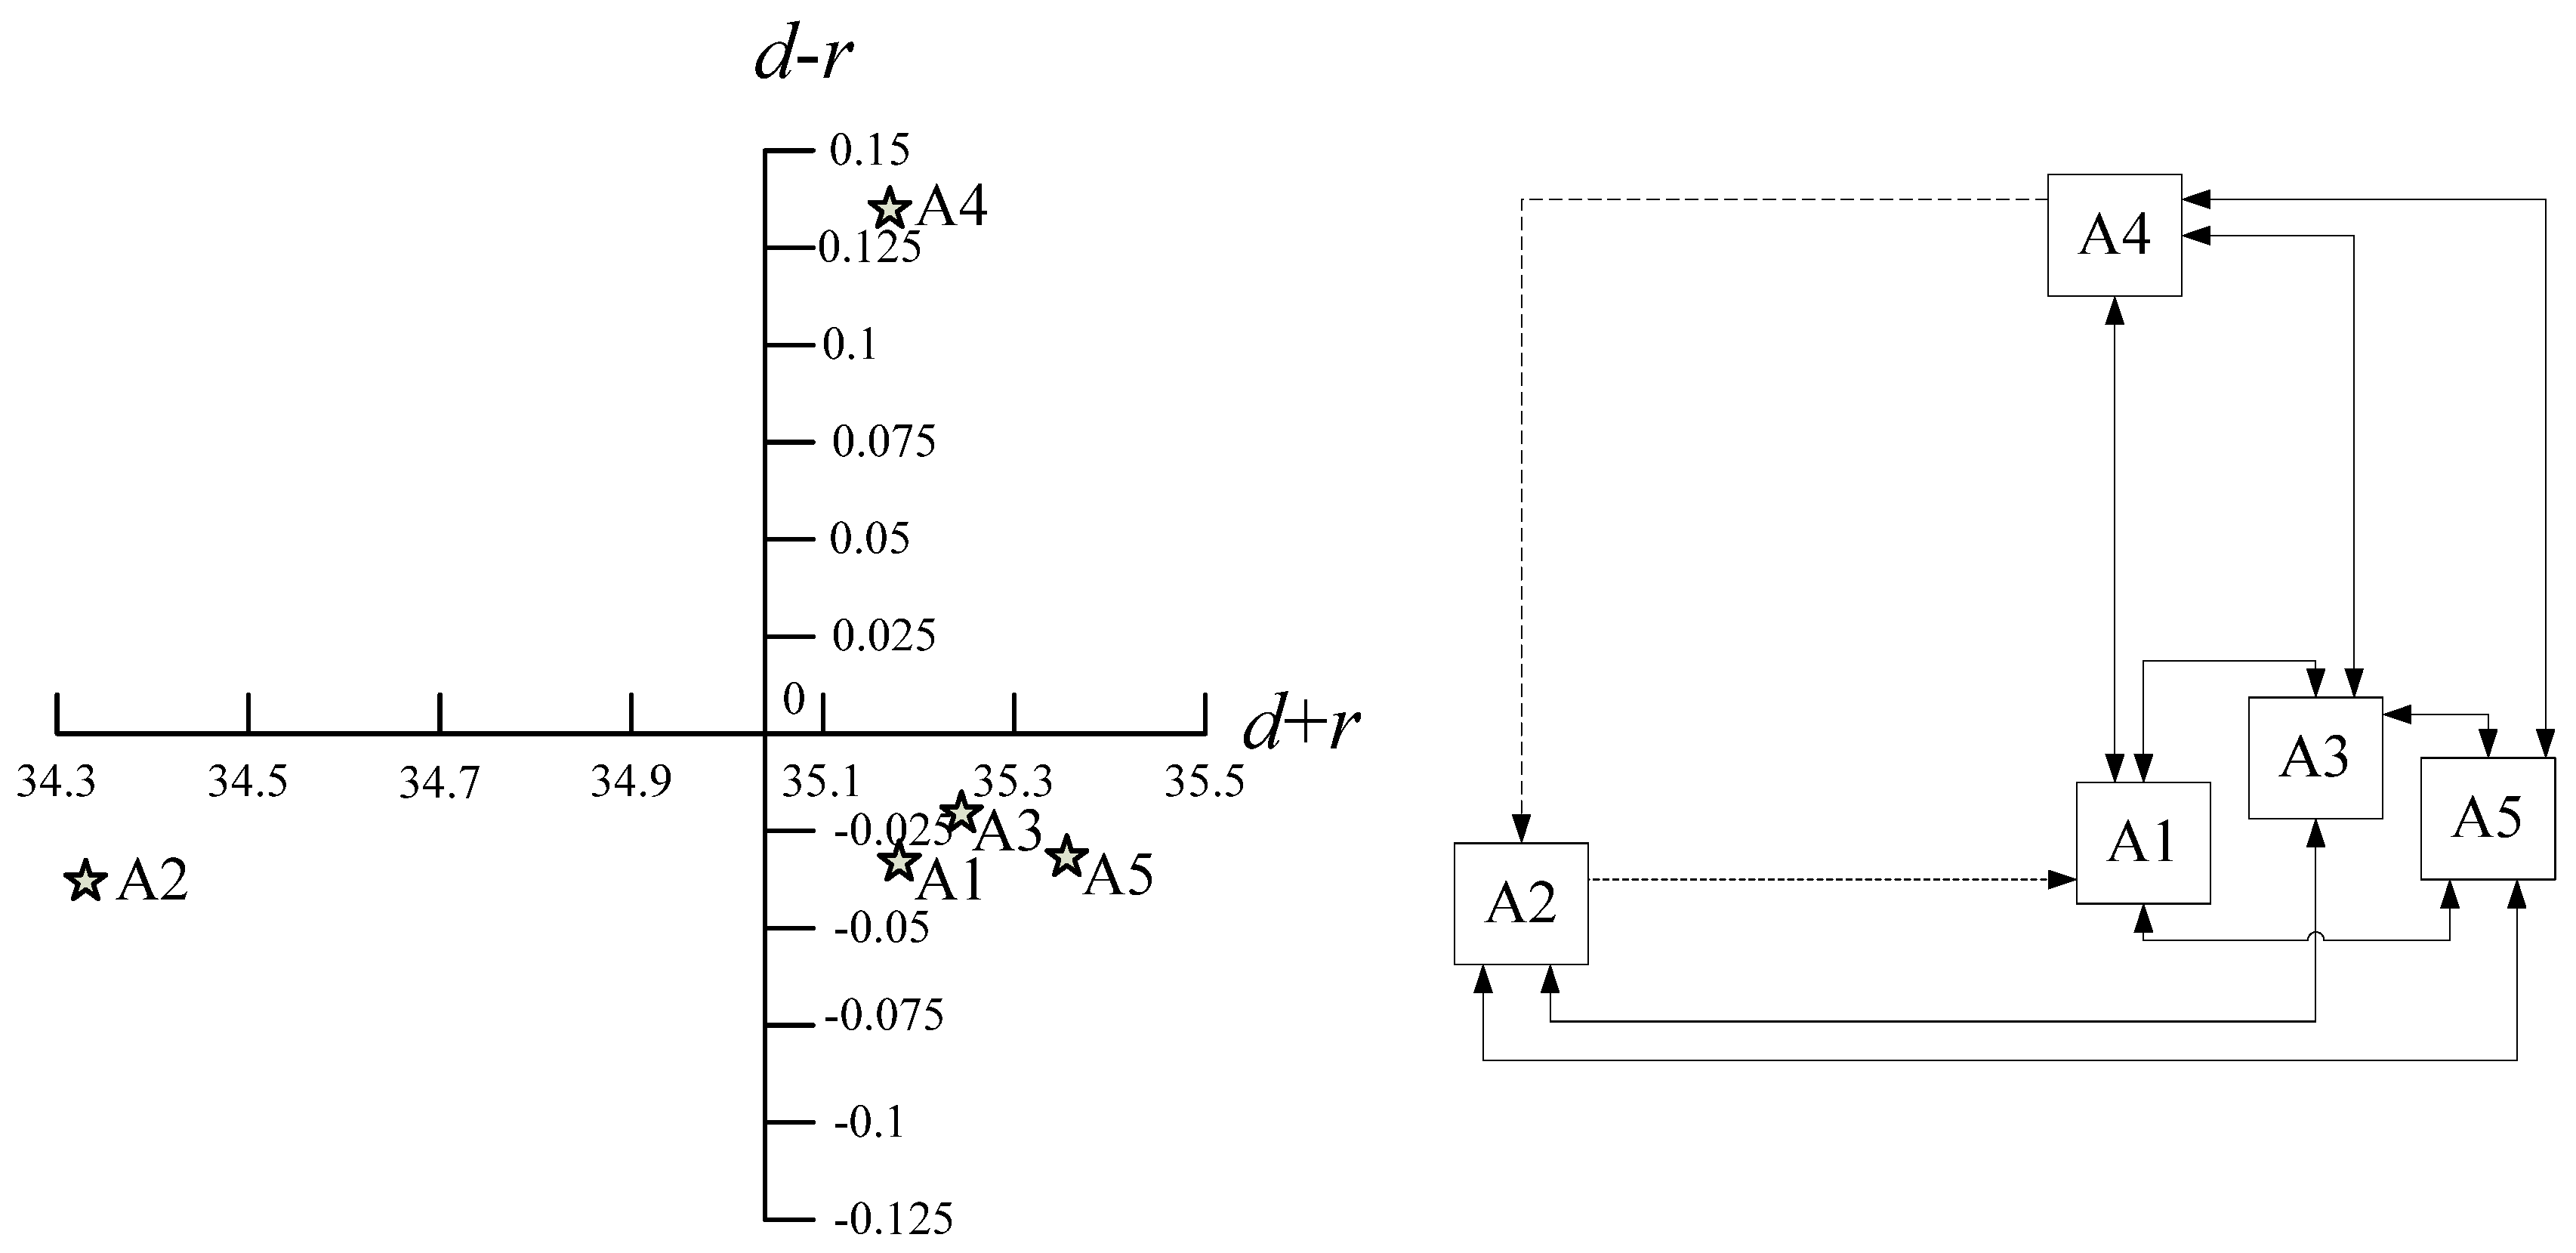
5.1. Results of Main Construct Analysis

The result of the main construct analysis illustrates that “customer satisfaction (A5)” had the highest strength than the other constructs, and A2 had the weakest strength. Therefore, the influence sequence among the five constructs is customer satisfaction (A5) > technology development (A3) > operating cost (A1) > product integrity (A4) > quality and brand (A2). This result suggests that the DP company invests its resource mostly in enhancing “customer satisfaction”.
According to the (dr) value, the causality between constructs was determined; the five main constructs of KSFs for improving the operation and management competency can be divided into cause and effect groups. If the construct’s (dr) value is positive, it will be classified into a cause group. The value of A4 is positive and has a direct effect on the other constructs. Therefore, the DP company was suggested to treat A4 as an important target for the development of KSFs. Moreover, strengthening the constructs of the cause groups will improve the other constructs of KSFs for company operation and management. Also, because A4 had the most impact on others, it should be listed as the most important construct for the development operation and management.
The mean average of the centrality (d + r) was 35.059, and its value was nominated as the threshold. The constructs of KSFs were consequently categorized into the 1st, 3rd, and 4th quadrants. As shown in the quadrant position of the cause-effect diagram in Figure 2, the A4 was in the 1st quadrant which is belonged to the construct with a higher centrality and a higher causality. Compared with the constructs in other quadrants, the constructs in this quadrant occupy a relatively important position, and the construct in the 3rd quadrant was A2, which is regarded as the construct with a lower centrality and a lower causality. Due to the construct within this quadrant, it does not dispatch any influence on others it is listed as the least important construct for DP company business operation and management development. There are three constructs in the 4th quadrant, i.e., A1, A3, and A5, which are pertained to the higher centrality but a lower causality. These constructs can be strengthened by the enhancement of the construct in the 1st quadrants.
It can be known in Figure 2, that the five constructs are related to each other, and the arrow direction of A4 points to others shows a powerful strength but is less been influenced. Therefore, to establish and improve the four main constructs, i.e., operating costs, technology development, and customer satisfaction, the DP company needs to form the product integrity with the product differentiation, customized manufacturing, etc. However, A5 had great strength but it was an affected construct; thus, it dispatched less influence on other constructs. This result indicates that, when improving the four constructs—A1, A2, A3, A4—customer satisfaction (A5) is, consequently, improved. Consequently, product integrity is the decisive construct of the KSFs for DP Company. It affects the other four such as operating cost, quality and brand, technology development, and customer satisfaction; So, if DP Company can constitute product differentiation and enhance the integrity of customized manufacturing products, it will increase their probability of operating success.

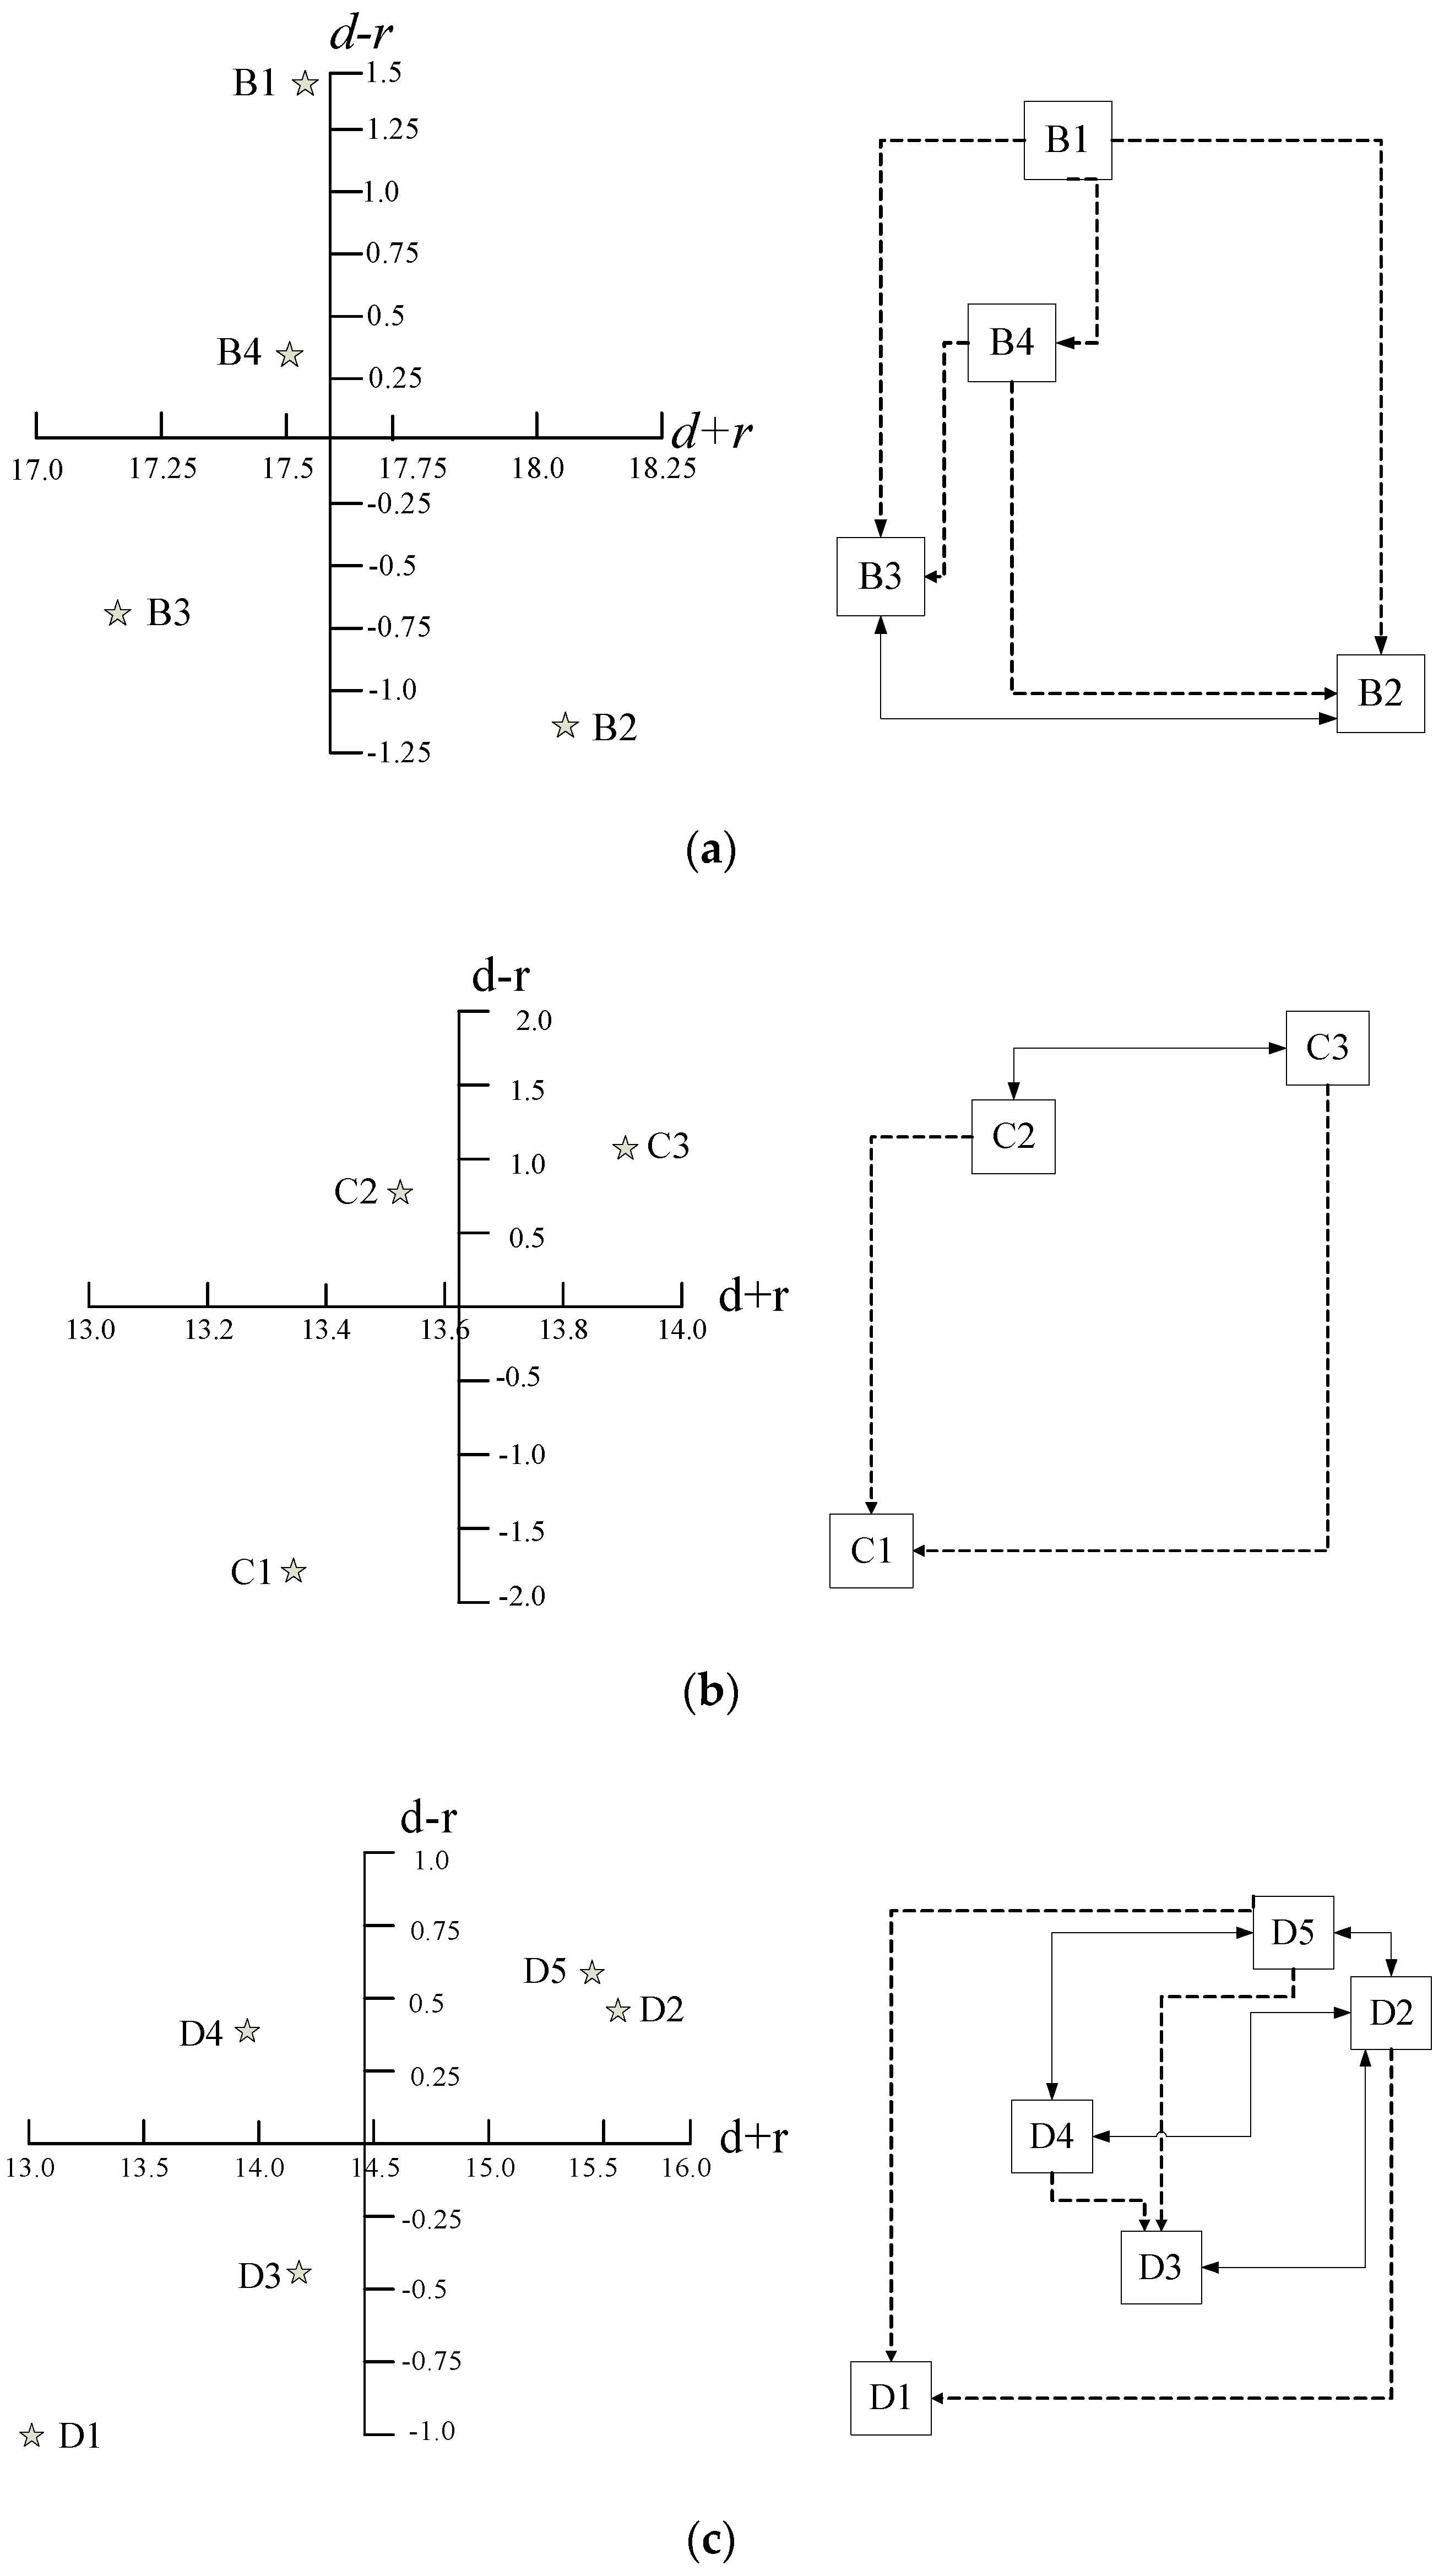
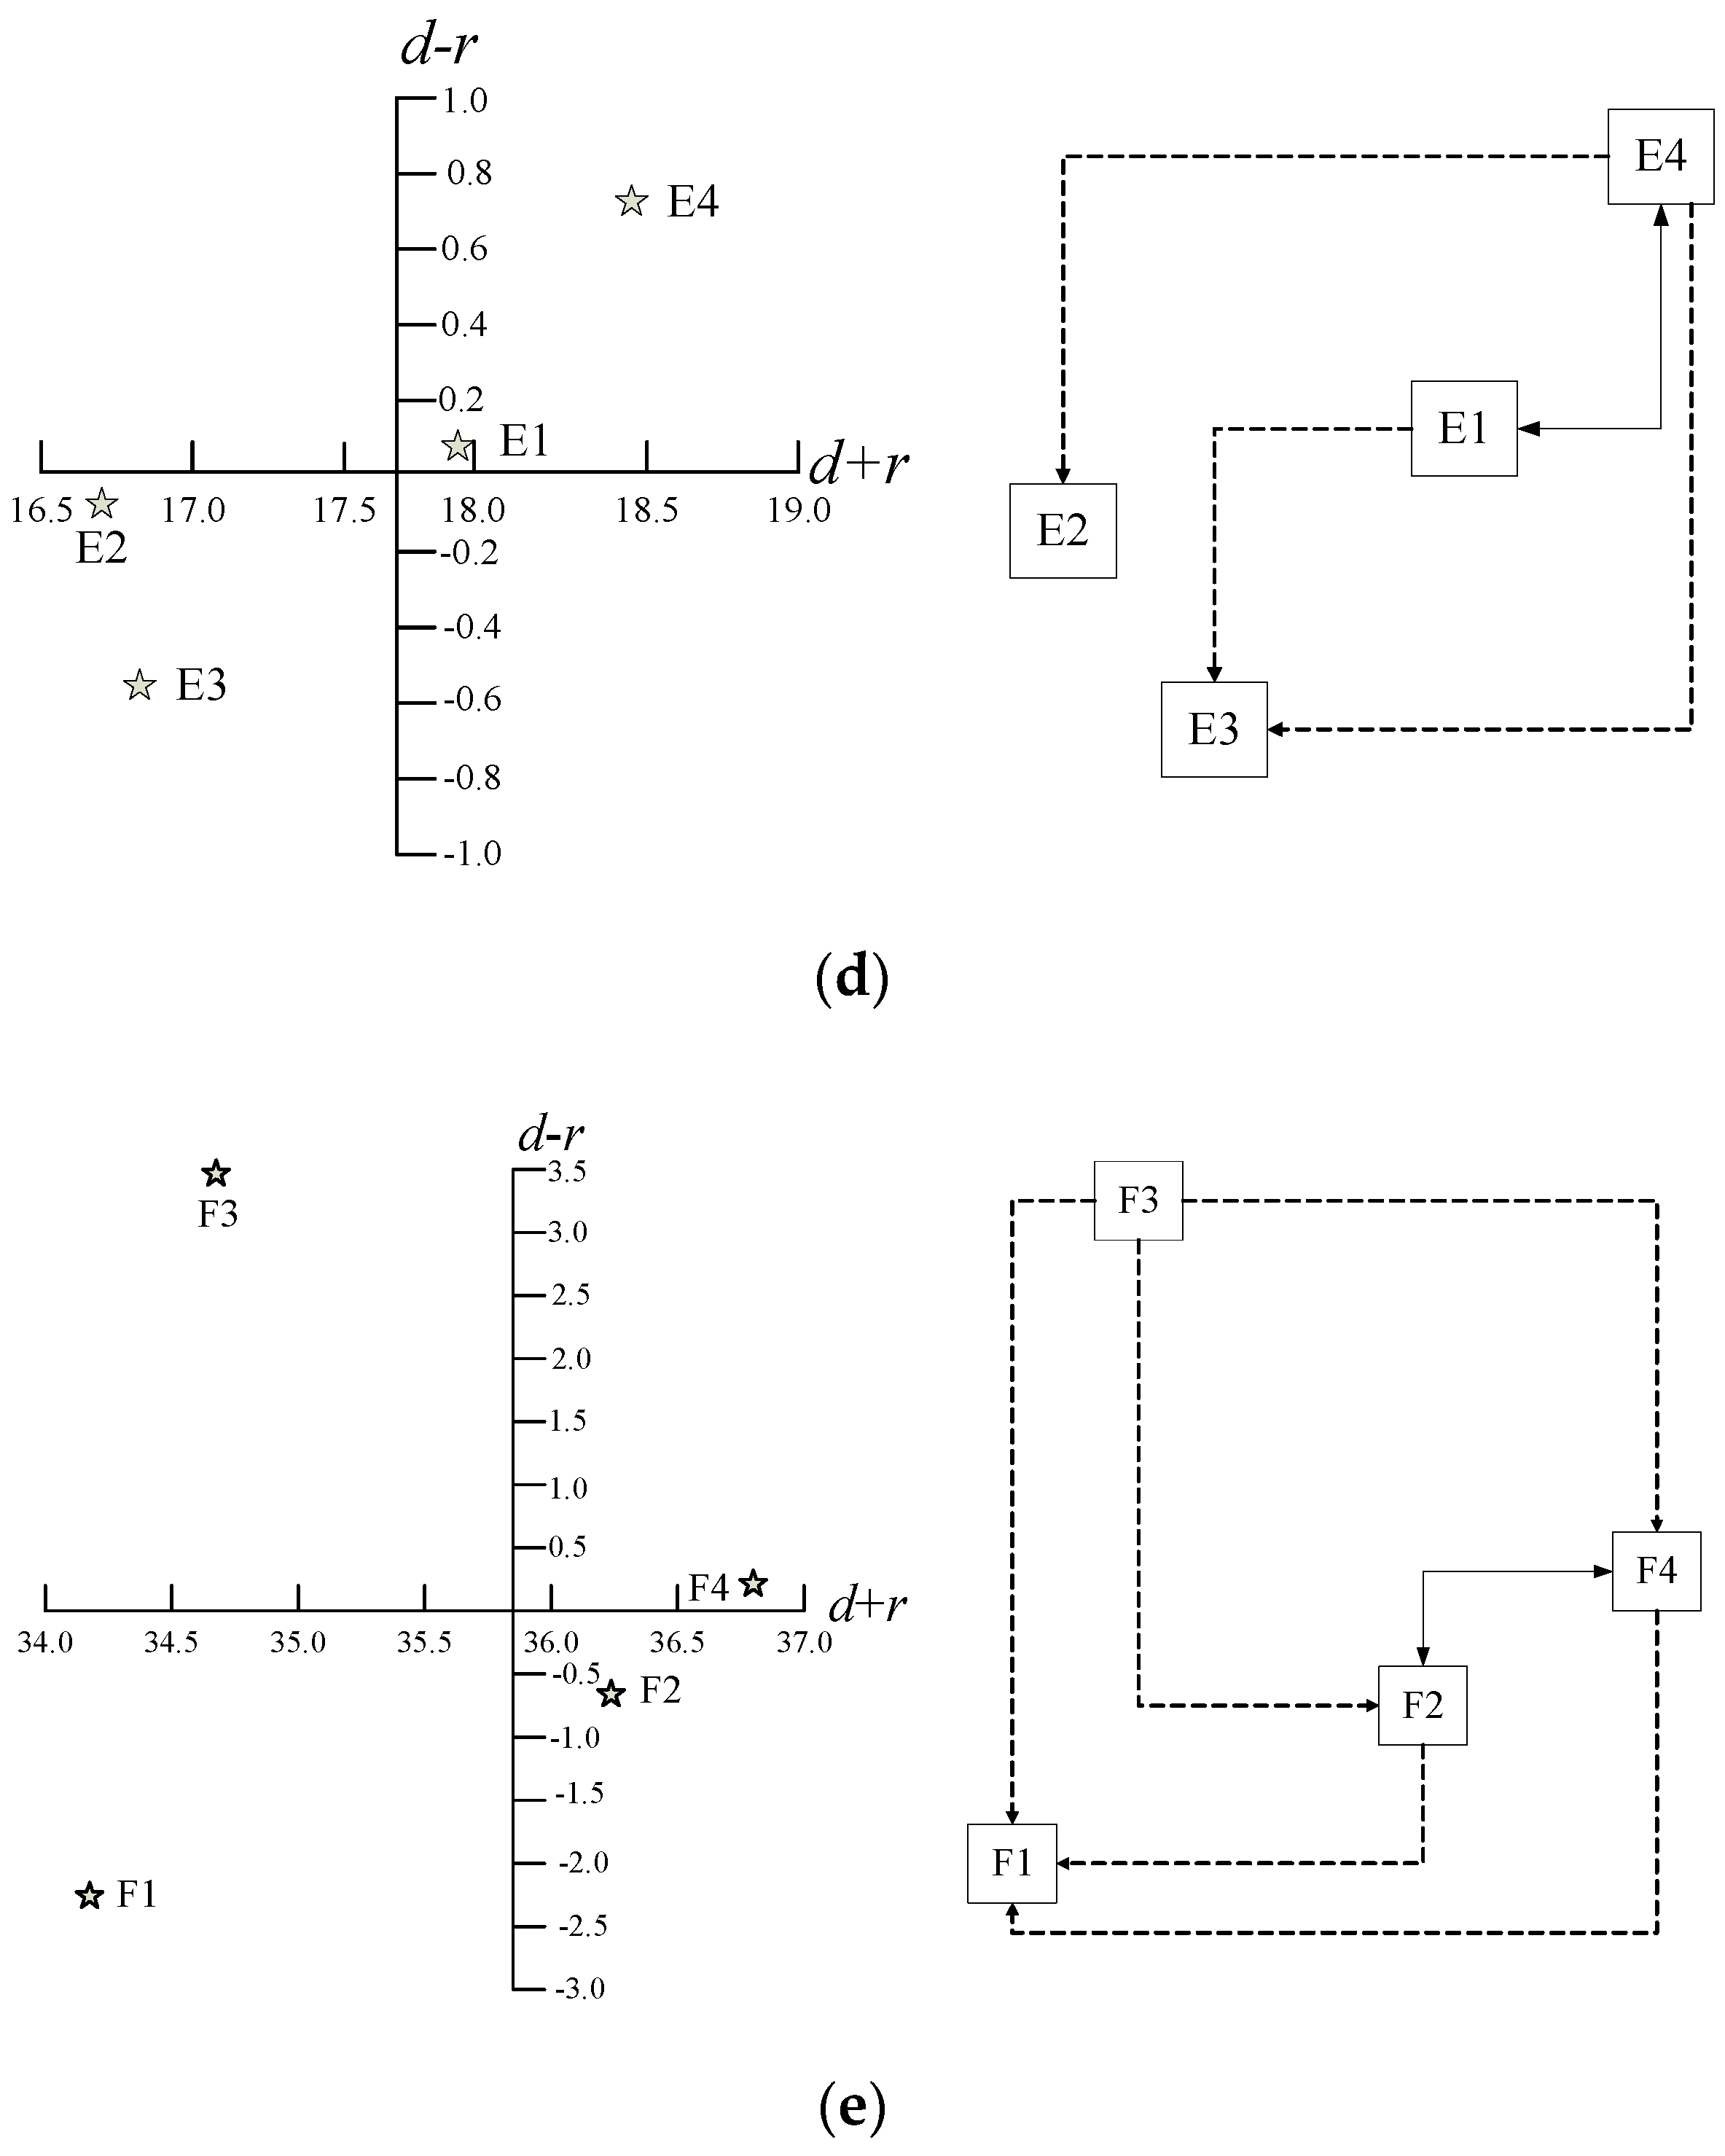
5.2. Results of Indicators under Various Construct

5.2.1. Operating Cost

From Table 9, we can see that there are two positive causality values (dr), B1, and B4, which are the causes that dispatch influence on others. One is the main core due to the high value. In the auto lighting AM industry, the existence of various types of cars leads to the various types of lighting and related components. Our result shows that when standardized materials can be produced, the bargaining power of buyers can further be improved, thereby the cost of components can be reduced. It can be known from Figure 3a that B3′s causality (dr) is negative and centrality (d + r) value is the lowest but has a strong mutual relationship with the B2. Therefore, reducing the B3 does not have much influence on operating costs. As most of the key components are controlled by the specific suppliers, e.g., the LED module, the purchaser might able to obtain better bargaining space through bulk purchasing, while still incapable of decreasing purchasing price.
The centrality’s (d + r) means the average of operating costs was 17.586 and was named as the threshold. The indicator under the operating cost dropped into the 2nd, 3rd, and 4th quadrants, are shown in Table 9. The two indicators in the 2nd quadrant with a lower centrality but a higher causality, B1, and B4 for operating costs, will affect the indicator in the 4th quadrant. The criterion in the 3rd quadrant was B3, with both a lower centrality and causality. The indicators in the 3rd quadrant did not impact on other indicators under the operating cost and were listed as the least important criteria for this construct. The criterion in the 4th quadrant had a higher centrality, but a lower causality was B2; it can be strengthened by the improvement of the indicator in the 1st and 2nd quadrants.
When the indicators in the 2nd quadrant improved, those indicators in the 4th quadrant will subsequently improve. From Figure 3a, we know that there is a tangled and complex relationship among the indicators under the operating cost. Therefore, the starting point is to improve B1 to control operating costs. Besides, B4 in 2nd quadrant will also impact on B2 in the 4th quadrant. Thus, it is selected as the second. The result shows that promoting standardization of materials is essential for managing operational costs and cause chain effects on the other three indicators. Therefore, fostering the evolution toward standardized materials is an important goal for controlling operating costs, which can improve the power to negotiate prices with suppliers, thereby reducing the costs of automobile parts.

5.2.2. Quality and Brand

In Table 9 and Figure 3b, we can learn that C2 and C3 were the cause indicators. In addition, the interaction relationship between C2 and C3 was strong, so these two indicators must be carried out simultaneously to achieve synergy. C1 is an affected criterion because its centrality (d + r) value is the lowest. This result shows us that the priority action to improve brand awareness and reputation is by obtaining local certification in the European and American markets, e.g., the US CAPA (the Certified Automotive Parts Association) quality certification. Also, the DP company can improve the quality of products by applying a complete quality management system. This action will lead to an improvement in brand awareness and reputation, as well as customers’ confidence in buying the company’s products.
The quality and brand centrality’s (d + r) mean average is 13.602 and is designated as the threshold. The indicators under this construct fell into the 1st, 2nd, and 3rd quadrants. As shown in Table 9, the criterion in the 1st quadrant with both higher centrality and causality was C3. Compared with indicators in other quadrants, the indicators in the 1st quadrant plays a relatively important position. The criterion in the 2nd quadrant with lower centrality but higher causality was C2. It is an important criterion under the quality and brand construct and will affect those criteria in 4th quadrant. The criterion in the 3rd quadrant with both lower centrality and causality is C1. Since the indicator in this quadrant did not affect any indicator under the construct, it was named as the least important indicator.
From Table 9 and Figure 3b, we can find that C3 in the 1st quadrant affects the other two indicators. Therefore, the DP company is suggested to take action on dealing with C3 (perfect quality management system) to improve quality and brand. Also, the C2 in the 2nd quadrant will improve the indicator in the 4th quadrant, so it is titled as the second priority for improving quality and brand. It can be seen that a perfect quality management system is the decisive criterion that affects the other two indicators. Therefore, to improve quality and brand, the establishment of a perfect quality management system is the first essential task and the second action is to obtain quality certification.

5.2.3. Technology Development

From Table 9 and Figure 3c, we can see that there were three positive causality values (dr), D2, D4, and D5. This result indicates that there exist significant mutual influence relationships among. D3 and D1 were effect indicators in the construct of technology development. This implies that the current automobile lighting industry is complicated in both the appearances, optical surfaces, and various functions, e.g., the rear-view mirrors and sidelights, back-lights, and cameras. The completion of D3 will affect the market. D1 was an independent criterion that does not affect any other indicators and is not being affected. Today, mold development technology is a necessary technology for the manufacturers to compete in automobile lighting aftermarket industry.
The mean average of the centrality of technology development (d + r) was 14.470, and its value was assigned as the threshold. The indicator under this construct dropped in the 1st, 2nd, and 3rd quadrants, as shown in Table 9. The two indicators in the 1st quadrant with both a higher centrality and causality were D2 and D5 which are relatively important. The indicator in the 2nd quadrant with a low centrality but a high causality was D4. D4 was an important criterion for technology development as that will affect those indicators in the 4th quadrant. The two indicators in the 3rd quadrant with a low centrality and causality were D1 and D3 which were the least important indicators for technological development.
From Table 9 and Figure 3c, we can see that the relationship of the indicators under this construct was complex and intertwined. D2 and D5 in the 1st quadrant will affect the other three indicators’ thus, the DP Company is suggested to start by handling D2 and D5 to enhance technology development. In addition, the progress toward better optical technology in the 2nd quadrant will improve the indicator under the 4th quadrant, so it was nominated as the second in order. It can be seen that a mutually supported cross-departmental team was the decisive criterion for technology development which affects the other four indicators. Moreover, building a cross-departmental team and adopting cross-border collaborations are crucial to enhance capability in mold development and capability in developing product portfolio.

5.2.4. Product Integrity

In Table 9 and Figure 3d, E4, and E1 with the positive causality values (dr) were the cause indicators that affected other indicators. E3 and E2 with negative causality values were the effect indicators. In terms of impact intensity, E4 was the highest in this group and had a high mutual affection for E1. Furthermore, from Figure 3d, we found that E2 and E3 did not strongly affect other indicators.
The mean average of the centrality of product integrity (d + r) was 17.605 and was selected as the threshold. The indicators under this construct fell into the 1st and 3rd quadrants, as shown in Table 9. The two indicators in the 1st quadrant with high centrality and causality were E1 and E4. Compared with the indicators in other quadrants, the indicator under this construct in this quadrant occupied a relatively important position. E2 and E3 were located in the 3rd quadrant with a low centrality and causality was the least important criterion.
From Table 9 and Figure 3d, we can learn that E1, and E4 in the 1st quadrant will affect the other two indicators. Therefore, the improvements should be made in E1 and E4 as the first priority in improving product integrity. Meanwhile, the indicator E4, “customized manufacturing”, will affect the other three indicators. This implies that the establishment of customized manufacturing, as well as product differentiation, are both important tasks to improve company management.

5.2.5. Customer Satisfaction

From Table 9, F3 and F4 had positive causality values (dr) that were recognized as the main causes of other indicators. F2 and F1 with negative causality values were the effect indicators. It can be further learned from Figure 3e that F3 had a significant impact on other indicators. Also, F2 and F4 had a great influence on each other, showing an important and close relationship. The result reflects that delivery on-time and quickly dealing with customers’ demands are important to the DP company. Building global marketing channels (F3) can shorten the delivery time to improve customer response (F4) and lead to customer satisfaction.
The mean average of the degree of customer satisfaction (d + r) was 35.456, which was determined as the threshold. The indicators under the consumer satisfaction construct dropped into different quadrants, as shown in Table 9. F4 located in the 1st quadrant with both high centrality and causality was a relatively important indicator. In the 2nd quadrant, F3 with low centrality but high causality was important, as it has an impact on the indicators in the 4th quadrant. In the 3rd quadrant, F1 with low centrality and causality, was an indicator that had no impact on any other indicators, was selected as the least important indicator. In the 4th quadrant, F2 with high centrality but low causality was an indicator that can be strengthened by the improvement of the indicator in the 1st and 2nd quadrants.
From Table 9 and Figure 3e, we can see that F4 in the 1st quadrant will affect the other two except F3. Therefore, the DP company was suggested to start from F4. F3 in the 2nd quadrant will also improve the indicators in the 4th quadrant, so it was listed as the second priority for improving customer satisfaction. This result indicates that a quick response to customer demands as well as the building of a global marketing channel to shorten customer/supplier operating time and make on-time delivery have critical impacts on customer satisfaction.

5.3. Discussions

Although KFC management has become a well-understood strategy in business operation and management, companies still encounter big challenges for their implementation, especially with a limited resource. These challenges should be alleviated or even eradicated to promote the KSFs management strategy and to increase overall effectiveness and competitive advantage in the Taiwan automotive lighting AM industry. According to existing researches, our knowledge about the influential factors in KSFs management remains low [16,17]. Compared with studies on KSFs in the past [7,10,11,12,27,29], in our study, the fuzzy DEMATEL method was utilized to quantify interactions among different factors in a complicated environment. From the results of our study, it can figure out the cause-effect categories of factors with the DEMATEL method. The cause factors are identified as determinants. Thus, the proposed method can well tackle subjectivity and fuzziness of experts’ evaluations. Based on the proposed method, the optimization of continuous improvement and innovation projects can be significantly simplified into an optimizing determinant. Through optimizing these determinants, the performance and competitive advantage of the company can be significantly improved. Thus, the proposed method will help industrial managers and decision-makers to optimize their use of resources.

6. Conclusions and Implications

The output value of the Taiwanese auto lighting AM industry is the world’s first and, in recent years, car lights have switched from halogen bulbs to light-emitting diodes. Moreover, the booming demand for vehicles in emerging markets has provided an excellent opportunity for business expansion and has increased manufacturing in China and Southeast Asia countries. Hence, at this critical moment, the industry’s scale can be increased markedly by a proper plan. Previous studies have proved the investment priority order among enterprise development capabilities; however, so far, with limited available resources, there is a lack of a brief discussion about which capability we should prioritize to facilitates this development. This paper focused on the KSFs’ main constructs/indicators for the Taiwanese automotive lighting AM industry. The results of the factor analysis method confirmed these constructs/indicators’ reliability and validity. Also, the fuzzy DEMATEL method was applied to evaluate their causality and strength and finally identified the high-priority investment KSFs for the company and industry.

6.1. Conclusions

About the decisive construct, product integrity was the “cause” that had more impact on other constructs, and constructs of operating cost, quality and brand, technology development, and customer satisfaction, are the “effect” constructs. Among these constructs, customer satisfaction is the most affected one. So, the DP company must first construct product integrity to meet customers’ demands. Furthermore, our result found an important issue for the DP Company, which was how to strengthen technology development to satisfy customers’ demand under controlled operating costs.
Regarding the decisive indicator of various constructs, the operating cost construct was mainly determined by promoting standardized materials which will subsequently impact on the bargaining power of buyers, and key components prices.
Regarding quality and brand, the most influential indicator was the improved quality management system; this indicator has a great mutual influence on acquiring a quality certification and a big impact on brand awareness and reputation. Thus, brand awareness and reputation will be gradually increased through the establishment of perfect quality management. The DP Company was suggested to work on improving product quality and obtain international quality certification.
In enhancing technology development, the essential actions were to engage in cross-functional as well as cross-border collaboration. The effect of product portfolio strengthening will be significant when the DP Company has its internal support teams.
For product integrity, the primary key criterion was customized manufacturing which has a high mutual influence on product differentiation. Under the construct of product integrity, the most affected indicator was to accelerate new product introduction. Implementing customized manufacturing and product differentiation was suggested as competition strategies in a fiercely competitive market. The DP Company was suggested to innovate and introduce new products to meet customer expectations.
Dealing with customer satisfaction, the highest influential indicator was to build global marketing channels. This action will subsequently shorten the operation time of customers/suppliers. Hence, customers’ demands will be responded quickly.

6.2. Managerial Implications

From an integrated and systematic analysis perspective, this study started with a literature review to select the KSFs of auto lighting AM industry and factor analysis to test the validity and reliability. Then, a Fuzzy DEMATEL method was used to deeply analyze the causal relationship among the main constructs and indicators of KSFs, finally, a cause-effect diagram and influence–relations map build. This study identified the decisive constructs and indicators to provide the company with a plan in designing effective improvement strategies. The company and managers involved in the case study are generally benefited by our novel approaches. Our contribution is complementary with Millson and Wilemon [77], who pointed out that the ignorance of integration of KSFs caused the failure of companies’ business operation and management. Also, this study echoing calls from Chen et al. [78], who states that simultaneous consideration of the cause-effect relationships among various key factors is vital in designing business strategies.
Furthermore, our proposed method successfully extends the DEMATEL method by applying both linguistic variables and a fuzzy aggregation method, so that it can effectively deal with vague and imprecise judgments. In particular, the cause-effect diagram can also successfully divide a set of complex factors into a cause group, and an effect group and influence–relations map produce a visible causal diagram. Through the causal diagram, the complexity of a problem is easier to be captured, then profound decisions can be made.
Furthermore, the major findings of this study have significant managerial implications for the government and practitioners. First, we provide recommendations for the government: (1) actions are required to integrate the auto lighting industry into industrial clusters to forester technological development. Because “cross-border collaboration” and “promoting standardization of materials” are the deceive KSFs for the industry, the government is suggested to establish an industrial district in which manufacturers are located nearby to promote inter-firm as well as cross-border coordination for new product developments, standardization, and technological progress. (2) Taiwan government is suggested to plan a key policy in improving the KSFs for the auto lights industry. To promote sustainable development and maintain the competitive advantage of this industry, the government should continually assist and counsel the AM lighting manufacturers to focus their core resources on the above deceive KSFs.
We also give recommendations to the DP company: (1) To improve the enterprise’s brand reputation and quality, the DP company should constitute car light product integrity and components integrity. And the integrity for “small quantity production and diversified production” should be completed on considering “customized manufacturing” and “product differentiation”, the result will satisfy the customers’ demands and the requirements of product specifications, also will enhance the company’s brand leading position in the automotive market, and meet customers’ quality needs. (2) The DP company is suggested to implement control activities on operating costs and enhance its technological development capability simultaneously. The implementing standardization of products and components will strengthen the bargaining power of buyers and reduce the products’ and components’ prices. Through establishing cross-functional collaborations to improve mold development capability and product integrity technological development capability, the DP company will consequently capable to satisfy the customers’ various demands.
However, our study is subject to several limitations that may offer some suggestions for future research. First, the tool is only that—a tool, using it will not in itself lead to continuous improvement. Once an assessment has been made, the results need to be acted on. Furthermore, the accuracy and success of an assessment depend very much on the honesty and perspicacity of the assessors. Second, the constructs and indicators are derived from reviewing recent literature, so all the actual indicators are not necessarily covered. The 20 KSFs are identified for the auto lighting AM-related industry. Hence, new factors can be added/amended depending on the product, industry, and market characteristics of future studies. Third, the membership function of natural-language expression depends on the managerial perspective of the decision-maker. Thus, the decision-maker must be at a strategic level in the company to evaluate the importance and trends of all aspects, such as strategy, marketing, and technology. Fourth, competitive situations are dynamic and different across industries and companies; hence, companies must establish their unique membership function appropriate to their specific environment and strategic considerations. Finally, although our study exhibited an upgraded model rather than models such as importance-performance analysis (IPA) in KSFs prioritizing, it might be beneficial for a company to integrate both IPA and fuzzy DEMATEL approach to catch different theoretical viewpoints and algorithms in prioritizing KSFs. This leads to another direction of future research, to use our model in comparing the KSFs under different manufacturing contexts (such as original equipment manufacturer, original design manufacturer, original equipment supplier, etc.).

Author Contributions

Conceptualization, J.L.; methodology, Y.-F.H. and C.-T.L.; software, C.-H.W.; validation, J.L., Y.-F.H.; formal analysis, C.-H.W. and C.-W.C.; investigation, C.-W.C.; data curation, C.-W.C.; writing—original draft preparation, J.L. and C.-H.W.; writing—review and editing, Y.-F.H. and C.-T.L.; visualization, C.-W.C.; supervision, C.-T.L.; project administration, C.-T.L.; funding acquisition, J.L. and C.-T.L. All authors have read and agreed to the published version of the manuscript.

Funding

This research was funded by Ministry of Science and Technology of R.O.C (Taiwan), grant number MOST 108-2221-E-212-001-MY2.

Conflicts of Interest

The authors declare no conflict of interest.

Appendix A

Table A1. The definition of KSFs of the auto lighting aftermarket industry.
DefinitionReference Literature
Promoting standardization of materialsAbility to standardize manufacturing processes and materials within the company[49,51]
Bargaining power over the suppliersPrice space and flexibility obtained from bargaining with suppliers[53]
Key components pricesBetter price judgment for key components in the manufacturing process[55]
Outsourcing productionProducts are produced and purchased by external companies to reduce costs[56]
Mass productionProducts are produced in larger quantities to reduce costs[58]
Incentive and reward systemDesign incentive and reward systems for various departments[59]
Improve brand awareness and reputationCorporate brand awareness and external reputation[47]
Acquire quality certificationThe ability to successfully obtain various certifications required in the automotive lamp industry[64]
Process productivity improvementAbility to further improve product process yield[46]
Planning a future visionThe operator can plan the vision that leads to the future of the company[44]
Profit feedback to the communityThe business operator can give back to the place after making a profit[66]
Perfect quality management systemComplete quality data management and pass quality control certification or audit[65]
Mold development capabilityNew mold development capabilities[67]
Cross-border collaborative developmentPartners in different technical fields develop products together[42]
Product portfolio strengtheningCombining technology and components of car lamp products to enhance product value[18]
Optical technology improvementCan further enhance the technical capabilities of car lamp sources[43]
Advanced executive supportSenior executives within the company agree to accept grassroots recommendations[66]
Mutually supported cross-departmental teamMake good use of project teams that support each other across departments[47]
Product differentiationDifferences in products from competitors[44]
Miniature production and Diversified productionProducts can be produced more diversely and in smaller quantities[67]
Product value-addedNew products can give customers a sense of added value, such as environmental protection[45]
Accelerating the Introduction Frequency of New productAccelerate the promotion of suitable products in line with market trends[46]
Customized manufacturingEnterprises can meet the manufacture of various types of customized products[68]
On-time deliveryProvide the required products on time according to the time required by the customer[76]
Shortening the operation time of customers/suppliersProvide a complete supply chain platform to reduce operating time[75]
Building global marketing channelsThe marketing channels of car lamp products can be increased[66]
Quick response to customer demandsRespond quickly to customer needs[69,70]
Maintain the level of creativity and innovationEnterprises can make consumers feel the difference between new products[44]

Appendix B

Table A2. The questionnaire used in this study.
Operating CostSDDNASA
1. Promoting standardization of materials
2. Bargaining power over the suppliers
3. Key components prices
4. Outsourcing production
5. Mass production
6. Incentive and reward system
Quality and brandSDDNASA
1. Improve brand awareness and reputation
2. Acquire quality certification
3. Process productivity improvement
4. Planning a future vision
5. Profit feedback to the community
6. Perfect quality management system
Technology developmentSDDNASA
1. Mold development capability
2. Cross-border collaborative development
3. Product portfolio strengthening
4. Optical technology improvement
5.Top manager support
6. Mutually supported cross-departmental team
Product integritySDDNASA
1. Product differentiation
2. Miniature production & Diversified production
3. Product value-added
4. Accelerating the introduction frequency of new product
5. Customized manufacturing
Customer SatisfactionSDDNASA
1. On-time delivery
2. Shortening the operation time of customers/suppliers
3. Building global marketing channels
4. Quick response to customer demands
5. Maintain the level of creativity and innovation
SD—Strongly Disagree, D—Disagree, N—Neutral, A—Agree, SA—Strongly Agree.

References

  1. Industrial Technology Research Institute. Industrial Information Intelligence-Vehicle Industry Analysis. 2015. Available online: http://iekweb3.iek.org.tw/iekppt/client/default.aspx?industry=8 (accessed on 15 June 2019).
  2. Mulatu, A. On the concept of ‘competitiveness’ and its usefulness for policy. Struct. Chang. Econ. Dyn. 2016, 36, 50–62. [Google Scholar] [CrossRef]
  3. Ekici, Ş.Ö.; Kabak, Ö.; Ülengin, F. Linking to compete: Logistics and global competitiveness interaction. Transp. Policy 2016, 48, 117–128. [Google Scholar] [CrossRef]
  4. Voinescu, R.; Moisoiu, C. Competitiveness, Theoretical and Policy Approaches. Towards a More Competitive EU. Procedia Econ. Financ. 2015, 22, 512–521. [Google Scholar] [CrossRef] [Green Version]
  5. Wang, W.P. Evaluating new product development performance by fuzzy linguistic computing. Expert Syst. Appl. 2009, 36, 9759–9766. [Google Scholar] [CrossRef]
  6. Luh, Y.H.; Jiang, W.J.; Huang, S.C. Trade-related spillovers and industrial competitiveness: Exploring the linkages for OECD countries. Econ. Model. 2016, 54, 309–325. [Google Scholar] [CrossRef]
  7. Henderson, K.M.; Evans, J.R. Successful implementation of Six Sigma: Benchmarking General Electric Company. Benchmarking Int. J. 2000, 7, 260–282. [Google Scholar] [CrossRef]
  8. Scherrer-Rathje, M.; Boyleb, T.A.; Deflorin, P. Lean, take two! Reflections from the second attempt at lean implementation. Bus. Horiz. 2009, 52, 79–88. [Google Scholar] [CrossRef]
  9. Black, S.A.; Porter, L.J. Identification of the Critical Factors of TQM. Decis. Sci. 1996, 27, 1–21. [Google Scholar] [CrossRef]
  10. Bortolotti, T.; Boscari, S.; Danese, P. Successful lean implementation: Organizational culture and soft lean practices. Int. J. Prod. Econ. 2015, 160, 182–201. [Google Scholar] [CrossRef] [Green Version]
  11. Lin, S.W. Identifying the Critical Success Factors and an Optimal Solution for Mobile Technology Adoption in Travel Agencies. Int. J. Tour. Res. 2016, 19, 127–144. [Google Scholar] [CrossRef]
  12. Netland, T.H. Critical success factors for implementing lean production: The effect of contingencies. Int. J. Prod. Res. 2016, 54, 2433–2448. [Google Scholar] [CrossRef]
  13. Black, J.T. Design rules for implementing the Toyota Production System. Int. J. Prod. Res. 2007, 45, 3639–3664. [Google Scholar] [CrossRef]
  14. Sila, I.; Ebrahimpour, M. Examination and comparison of the critical factors of total quality management (TQM) across countries. Int. J. Prod. Res. 2003, 41, 235–268. [Google Scholar] [CrossRef]
  15. Näslund, D. Lean and six sigma—Critical success factors revisited. Int. J. Qual. Serv. Sci. 2013, 5, 86–100. [Google Scholar] [CrossRef]
  16. Bian, T.; Deng, Y. Identifying influential nodes in complex networks: A node information dimension approach. Chaos Interdiscip. J. Nonlinear Sci. 2018, 28, 043109. [Google Scholar] [CrossRef] [PubMed]
  17. Fei, L.; Wang, H.; Chen, L.; Deng, Y. A new vector valued similarity measure for intuitionistic fuzzy sets based on OWA operators. Iran. J. Fuzzy Syst. 2019, 16, 113–126. [Google Scholar]
  18. Chen, Z.M. Research on the Key Success Factors of Traditional Industry Management-Taking the Automobile Lamp Industry as an Example. Master’s Thesis, Department of Enterprise Management, Feng Chia University, Taichung, Taiwan, 2015. [Google Scholar]
  19. Statistics Department, Ministry of Economic Affairs. Statistics of Industrial Production, Sales and Inventory Dynamic Survey Products. 2019. Available online: https://dmz26.moea.gov.tw/GMWeb/investigate/InvestigateDA.aspx (accessed on 31 July 2019).
  20. Daniel, D.R. Management Information Crisis. Harv. Bus. Rev. 1961, 39, 111–121. [Google Scholar]
  21. Aaker, D.A. Strategic Market Management; John Wiley & Sons: New York, NY, USA, 1984. [Google Scholar]
  22. Aaker, D.A.; Moorman, C. Strategic Market Management, 11th ed.; John Wiley & Sons: New York, NY, USA, 2017. [Google Scholar]
  23. Laudon, K.C.; Laudon, J.P. Management Information Systems: Managing the Digital Firm, 16th ed.; Pearson Prentice Hall: Upper Saddle River, NJ, USA, 2019. [Google Scholar]
  24. Rockart, J.F. Chief Executives Define Their Own Data Needs. Harv. Bus. Rev. 1979, 57, 81–93. [Google Scholar]
  25. Alazmi, M.; Zairi, M. Knowledge management critical success factors. Total Qual. Manag. Bus. Excell. 2003, 14, 199–204. [Google Scholar] [CrossRef]
  26. Huang, L.S.; Lai, C.P. An investigation on critical success factors for knowledge management using structural equation modeling. Procedia Soc. Behav. Sci. 2012, 40, 24–30. [Google Scholar] [CrossRef] [Green Version]
  27. Boynton, A.C.; Zmud, R.W. An Assessment of Critical Success Factors. Sloan Manag. Rev. 1984, 25, 17–27. [Google Scholar]
  28. Hardaker, M.; Ward, B.K. How to make a teamwork. Harv. Bus. Rev. 1987, 65, 112–120. [Google Scholar]
  29. Fishman, A. Critical success factors: Key to attaining goals. Inside Tuscon Bus. 1998, 8, 10–12. [Google Scholar]
  30. Hayes, B.J. Assessing for Lean Six Sigma Implementation and Success. 2000. Available online: https://www.isixsigma.com/implementation/basics/assessing-lean-six-sigma-implementation-and-success/ (accessed on 30 September 2019).
  31. Guimaraes, T.; Gupta, Y.P.; Rainer, R.K. Empirically Testing the Relationship Between End-User Computing Problems and Information Center Success Factors. Decis. Sci. 1999, 30, 393–413. [Google Scholar] [CrossRef]
  32. Dwyer, S.; Hill, J.; Martin, W. An Empirical Investigation of Critical Success Factors in the Personal Selling Process for Homogenous Goods. J. Pers. Sell. Sales Manag. 2000, 20, 151–159. [Google Scholar]
  33. Lee, M.S. The Study of Key Success Factors for Competitive Advantages as Well as Strategies in Promotion of Agricultural Biotechnology Industry in Taiwan. Agric. Econ. Semi Annu. 2007, 82, 107–156. [Google Scholar]
  34. Wu, Q.S. Empirical Research on Success Factors, Company Capabilities and Alliance Strategies of Taiwan’s Information Electronics Industry. Taiwan Univ. Manag. Ser. 1993, 4, 209–226. [Google Scholar]
  35. Lee, M.S.; Liu, K.N.; Ting, S.M.; Chou, J.N. A Study on the Key Success Factors of Biotechnology Industry in Taiwan. Soochow J. Econ. Bus. 2007, 56, 27–51. [Google Scholar]
  36. Yang, C.C.; Tai, S.H.; Kuo, Y.Y. Empirical Analysis of Critical Success Factors in Service Industry. J. Qual. 2016, 23, 415–424. [Google Scholar]
  37. Hsu, V.; Hsu, M.L.; Ou-Yang, H.H. An Exploration of Key Success Factors for Silicon Wafer Material Industry in Taiwan. J. Sci. Technol. Manag. 2005, 10, 69–96. [Google Scholar]
  38. Chen, S.H.; Yang, B.T.; Lee, P.C. Key Success Factors of Taiwan’s Cement Industry Relocating to the Mainland China. J. Bus. 2019, 27, 1–21. [Google Scholar]
  39. Fan, P.H.; Liao, S.K. A Study of Key Success Factors for the Business Excellent of Taiwan Small and Medium Enterprises. J. Innov. Bus. Manag. 2017, 7, 31–49. [Google Scholar]
  40. Habidin, N.F.; Yusof, S.M. Critical success factors of Lean Six Sigma for the Malaysian automotive industry. Int. J. Lean Six Sigma 2013, 4, 60–82. [Google Scholar] [CrossRef]
  41. Roth, A.V.; Miller, J.G. Success Factors in Manufacturing. Bus. Horiz. 1992, 35, 73–81. [Google Scholar]
  42. Wang, B.J. Global Operational Research Alliance of Automotive AM Parts Industry HUB; Wireless Identification Center, Industrial Technology Research Institute: Hsinchu, Taiwan, 2008. [Google Scholar]
  43. He, X.Y. Lamp Design, Innovative Development; ARTC Vehicle Research Information: Changhua County, Taiwan, 2008; pp. 32–34. [Google Scholar]
  44. Chiu, C.C. Knowledge Management and Case-Based Reasoning Applications for the New Product Development of Vehicle Lighting–Case Study on D Company. Master’s Thesis, Department of Industrial Engineering Management, National Cheng Kung University, Tainan, Taiwan, 2009. [Google Scholar]
  45. Chiu, H.T. Investigation of Knowledge Management and New Product Development Performance of the Automotive Lighting Industry in Tainan Taiwan. Master’s Thesis, Department of Enterprise Management, Southern Taiwan University of Science and Technology, Tainan, Taiwan, 2005. [Google Scholar]
  46. Chen, G.F. Application of Quality Function Development and Value Analysis to Discuss the Development of Aftermarket Automotive Headlight Products. Master’s Thesis, Department of Management, National University of Kaohsiung, Kaohsiung, Taiwan, 2013. [Google Scholar]
  47. Tsai, M.Z.; Zhang, S.J. Taiwan Automotive Components Efficiency Evaluation and Model Construction. J. Ind. Technol. Educ. 2014, 11, 1–13. [Google Scholar]
  48. Wu, W.Y.; Kuo, H.P.; Peng, Y.L. Interrelationships between Organizational Culture, Management Modes, Competitive Advantages and Management Performance for Medical Center. J. Med. Manag. 2002, 3, 17–38. [Google Scholar]
  49. Perera, H.S.C.; Nagarur, N.; Tabucanon, M.T. Component part standardization: A way to reduce the life-cycle costs of products. Int. J. Prod. Econ. 1999, 60, 109–116. [Google Scholar] [CrossRef]
  50. Sanchez-Rodriguez, C.; Hemsworth, D.; Martinez-Lorente, A.R.; Clavel, J.G. An empirical study on the impact of standardization of materials and purchasing procedures on purchasing and business performance. Supply Chain Manag. Int. J. 2006, 11, 56–64. [Google Scholar] [CrossRef] [Green Version]
  51. Sered, Y.; Reich, Y. Standardization and modularization driven by minimizing overall process effort. Comput. Aided Des. 2006, 38, 405–416. [Google Scholar] [CrossRef]
  52. Hsin, C.H. The Establishment of Components Standardization System—A Case Study of NKG Group. Master’s Thesis, Department of Enterprise Management, National Chiao Tung University, Hsinchu, Taiwan, 2011. [Google Scholar]
  53. Porter, M.E. The Five Competitive Forces That Shape Strategy. Harv. Bus. Rev. 2008, 86, 78–93. [Google Scholar]
  54. Ye, W.M. A Research on Relationship of Business Strategy and Competitive Advantage-TFT-LCD Industry in Taiwan. Master’s Thesis, Institute of Enterprise Management, Chung Yuan Christian University, Taoyuan City, Taiwan, 2006. [Google Scholar]
  55. Chuang, Y. Improvement Study of Procurement and Inventory Management of Key Components to Smart Mobile Device Industry—Case study for Smart Mobile Maker S Company. Master’s Thesis, Department of Industrial Engineering and Management, National Chiao Tung University, Hsinchu, Taiwan, 2013. [Google Scholar]
  56. Jiang, H.Y. Analysis of the Impact of Manufacturers’ Foreign Investment and Outsourcing Production on R&D Decisions. Master’s Thesis, Institute of Economics, Taiwan University, Taipei, Taiwan, 2005. [Google Scholar]
  57. Tseng, J.J.; Kao, T.C.; Ho, Y.C. Exploring the Influence of Marketing System and Human Capital on Operating Efficiency of the Life Insurance Industry Based on the Balanced Scorecard Perspective. J. Natl. Chiao Tung Univ. 2005, 25, 179–204. [Google Scholar]
  58. Liao, S.C. Apply Industry of Product Research and Development and Multi Criteria Decision Making for Enhancing Business Excellence. J. Manag. Inf. 2014, 19, 63–93. [Google Scholar] [CrossRef]
  59. Wen, T.Y. The Effect of Incentive Enhancement Factors on Production Performance and Production Qualitzy—A Case Study of S Company. Master’s Thesis, Marketing and Circulation Management Institute, Yu-Da University of Science and Technology, Zaoqiao, Taiwan, 2017. [Google Scholar]
  60. Yang, F.H.; Yang, M.Y.; Yang, F.S. Research on the Relationship between Socialization of Employee Organization of Multinational Enterprises, Internal Marketing and Service Quality. J. Bus. 2011, 19, 69–88. [Google Scholar]
  61. Wu, Q.W.; Liu, Z.Y.; Xu, Y.X. Research on Service Quality and Brand Image of News Website. Inf. Soc. Res. 2008, 15, 153–180. [Google Scholar]
  62. Wu, J.H.; Liu, L.F. The Effect of Product Quality Brand Image and Self-Concept on Customer Relationship. Hongguang J. Humanit. Soc. Sci. 2008, 8, 45–68. [Google Scholar]
  63. Chen, H.Y. The Key Success Factors of Taiwan Long-standing Stores. Master’s Thesis, Institute of Business Automation and Management, National Taipei University of Technology, Taipei, Taiwan, 2009. [Google Scholar]
  64. Hsu, C.L. Some Thoughts on Service Quality Enhancement. Master’s Thesis, Administration of National Taiwan University of Science and Technology, Taipei, Taiwan, 2009. [Google Scholar]
  65. Lin, M.D. The Exploration of Contextual Factors of Total Quality Management in a Medical Center. Master’s Thesis, Institute of Business Administration, Da-Yeh University, Changhua, Taiwan, 2001. [Google Scholar]
  66. Zhan, Z.U. The Analysis of the Core Competency of Taiwanese Auto Lamp Industry. Master’s Thesis, Department of Management and Management, Feng Chia University, Taichung, Taiwan, 2010. [Google Scholar]
  67. Liu, C.P. Research on International Business Strategy of Automobile Component Manufacturers-A Case study of the Tong Yang Group (TYG). Master’s Thesis, Institute of Enterprise Management, National Chengchi University, Taipei, Taiwan, 2007. [Google Scholar]
  68. Chen, J.S.; Ho, C.T.; Tsou, H.T.; Lo, T.K. Mass customization capabilities and agility research: Pre-factors and the impact on corporate competitive advantage. J. Electron. Commer. 2009, 11, 489–518. [Google Scholar]
  69. Ahmad, M.F.; Yusof, S.M.; Yusof, N.M. Comparative study of quality practices between Japanese and non-Japanese based electrical and electronics companies in Malaysia: A survey. J. Teknol. 2007, 47, 75–89. [Google Scholar] [CrossRef] [Green Version]
  70. Snee, R.D.; Gardner, E.C. Putting all together-continuous improvement is better than postponed perfection. In Quality Progress; American Society for Quality (ASQ): Milwaukee, WI, USA, 2008; pp. 56–59. [Google Scholar]
  71. Liao, T.Y.; Lou, Y.C. Service Quality and Customer Satisfaction for Home-delivery Service Providers-Case Study of Five Providers in Taiwan. J. Electron. Commer. 2013, 15, 461–490. [Google Scholar]
  72. Ittner, C.D.; Larcker, D.F. Quality strategy, strategic control systems and organizational performance. Account. Organ. Soc. 1997, 22, 293–314. [Google Scholar] [CrossRef]
  73. Dow, D.; Samson, D.; Ford, S. Exploding the myth: Do all quality management practices contribute to superior quality performance? Prod. Oper. Manag. 1999, 8, 1–27. [Google Scholar] [CrossRef]
  74. Zakuan, N.; Yusof, S.M.; Mat Saman, M.Z.; Shaharoun, A.M. Confirmatory factor analysis of TQM practices in Malaysia and Thailand automotive industries. Int. J. Bus. Manag. 2010, 5, 160–175. [Google Scholar] [CrossRef] [Green Version]
  75. Huang, M.Z. Discuss how public stadiums can improve customer satisfaction from a service quality perspective. NCYU Phys. Educ. Health Recreat. J. 2009, 8, 267–276. [Google Scholar]
  76. Hwang, Y.J.; Huang, L.N.; Ru, K.P.; Yang, S.H. Applying DO-MITIC Problem Solving Methodology to Improve the On-Time Delivery for Procurement. J. Qual. 2008, 15, 355–369. [Google Scholar]
  77. Millson, M.R.; Wilemon, D. Innovation in heavy construction equipment manufacturing: An exploratory study. Int. J. Innov. Manag. 2006, 10, 127–161. [Google Scholar] [CrossRef]
  78. Chen, J.; He, Y.B.; Jin, X. A Study on the Factors that Influence the Fitness between Technology Strategy and Corporate Strategy. Int. J. Innov. Technol. Manag. 2008, 5, 81–103. [Google Scholar] [CrossRef]
  79. Li, R.J. Fuzzy method in group decision making. Comput. Math. Appl. 1999, 38, 91–101. [Google Scholar] [CrossRef] [Green Version]
  80. Tamura, M.; Akazawa, K. Structural modeling and systems analysis of uneasy factors for realizing safe, secure and reliable society. J. Telecommun. Inf. Technol. 2005, 3, 64–72. [Google Scholar]
  81. Hu, H.Y.; Chiu, S.I.; Cheng, C.C. Applying the IPA and DEMATEL models to improve the order-winner criteria: A case study of Taiwan’s network communication equipment manufacturing industry. Expert Syst. Appl. 2011, 38, 9674–9683. [Google Scholar] [CrossRef]
  82. Hsu, C.Y.; Chen, K.T.; Tzeng, G.H. FMCDM with Fuzzy DEMATEL Approach for Customers’ Choice Behavior Model. Int. J. Fuzzy Syst. 2007, 9, 236–246. [Google Scholar]
  83. Hair, J.F.; Black, W.C.; Babin, B.J.; Anderson, R.E.; Tatham, R.L. Multivariate Data Analysis; Pearson Education: Upper Saddle River, NJ, USA, 2006. [Google Scholar]
  84. Bagozzi, R.P.; Yi, Y. On the evaluation of structural equation models. J. Acad. Mark. Sci. 1988, 16, 74–94. [Google Scholar] [CrossRef]
  85. Fornell, C.; Larcker, D.F. Structural Equation Models with Unobservable Variables and Measurement Error; Algebra and Statistics; Sage Publications Sage CA: Los Angeles, CA, USA, 1981. [Google Scholar]
  86. Bentler, P.M.; Bonett, D.G. Significance tests and goodness of fit in the analysis of covariance structures. Psychol. Bull. 1980, 88, 588. [Google Scholar] [CrossRef]
  87. Scott, J.E. The measurement of information systems effectiveness: Evaluating a measuring instrument. ACM SIGMIS Database Database Adv. Inf. Syst. 1995, 26, 43–61. [Google Scholar] [CrossRef]
  88. Browne, M.W.; Cudeck, R. Alternative ways of assessing model fit. Sociol. Methods Res. 1992, 21, 230–258. [Google Scholar] [CrossRef]
Figure 1. Research flowchart.
Mathematics 08 01187 g001
Figure 2. Cause–effect diagram and influence–relation map.
Mathematics 08 01187 g002
Figure 3. Cause–effect diagram and influence–relations map of indicators under various constructs. (a) cause-effect diagram and influence–relations map of operating cost; (b) cause-effect diagram and influence–relations map of quality and brand; (c) cause-effect diagram and influence–relations map of technology development; (d) cause-effect diagram and influence–relations map of product integrity; (e) cause-effect diagram and influence–relations map of customer satisfaction.
Mathematics 08 01187 g003aMathematics 08 01187 g003b
Table 1. Direct relationship matrix Z (A sample only).
A1A2A3A4A5
A102233
A220134
A321021
A433203
Operating cost (A1), Quality and brand (A2), Technology development (A3), product integrity (A4), Customer Satisfaction (A5). Very high influence (4), High influence (3), Low influence (2), Very low influence (1), No influence (0).
Table 2. Linguistic terms and corresponding triangular fuzzy numbers.
Linguistic TermsTriangular Fuzzy Numbers (l,m,r)
Very high influence (VH):4(0.75, 1, 1)
High influence (H):3(0.5, 0.75, 1)
Low influence (L):2(0.25, 0.5, 0.75)
Very low influence (VL):1(0, 0.25, 0.5)
No influence (No):0(0, 0, 0.25)
Table 3. The confirmatory factor analysis results of key success factors.
Main ConstructIndicatorFactor LoadingCRAVE
Operating cost (A1)Promoting standardization of materials (B1)0.7780.770.47
Bargaining power over the suppliers (B2)0.682
Key components prices (B3)0.663
Outsourcing production (B4)0.589
Quality and brand (A2)Improve brand awareness and reputation (C1)0.8390.770.54
Acquire quality certification (C2)0.784
Perfect quality management system (C3)0.552
Technology development (A3)Mold development capability (D1)0.7770.830.50
Cross-border collaborative development (D2)0.761
Product portfolio strengthening (D3)0.696
Optical technology improvement (D4)0.684
Mutually supported cross-departmental team (D5)0.581
Product integrity (A4)Product differentiation (E1)0.6960.700.37
Miniature production and diversified production (E2)0.628
Accelerating the introduction frequency of new product (E3)0.542
Customized manufacturing (E4)0.542
Customer satisfaction (A5)On-time delivery (F1)0.5810.650.32
Shortening the operation time of customers/suppliers (F2)0.553
Building global marketing channels (F3)0.552
Quick response to customer demands (F4)0.581
Table 4. Goodness-of-fit indices of KSFs measurement model.
Fit Indexχ2/dfGFIAGFIRMSEANFITLICFI
Recommended criteria <3>0.8>0.80<0.08>0.90>0.90>0.90
Model results92.059/32 = 2.8860.8350.8160.0830.9220.9350.947
Table 5. The initial fuzzy direct-relation matrix Z ˜ .
A1A2A3A4A5
A1(0.00,0.00,0.25)(0.33,0.56,0.80)(0.52,0.75,0.92)(0.48,0.72,0.89)(0.49,0.73,0.90)
A2(0.38,0.63,0.84)(0.00,0.00,0.25)(0.44,0.69,0.88)(0.31,0.55,0.79)(0.50,0.75,0.92)
A3(0.58,0.83,0.95)(0.50,0.75,0.92)(0.00,0.00,0.25)(0.38,0.63,0.84)(0.48,0.72,0.89)
A4(0.50,0.75,0.92)(0.38,0.63,0.84)(0.54,0.77,0.94)(0.00,0.00,0.25)(0.58,0.83,0.95)
A5(0.44,0.69,0.88)(0.50,0.75,0.92)(0.49,0.73,0.90)(0.54,0.77,0.94)(0.00,0.00,0.25)
Table 6. The normalized fuzzy directed-relation matrix Z ˜ .
A1A2A3A4A5
A1(0.00,0.00,0.06)(0.08,0.14,0.21)(0.13,0.19,0.24)(0.12,0.19,0.23)(0.13,0.19,0.23)
A2(0.10,0.16,0.22)(0.00,0.00,0.06)(0.11,0.18,0.23)(0.08,0.14,0.20)(0.13,0.19,0.24)
A3(0.15,0.21,0.24)(0.13,0.19,0.24)(0.00,0.00,0.06)(0.10,0.16,0.22)(0.12,0.19,0.23)
A4(0.13,0.19,0.24)(0.10,0.16,0.22)(0.14,0.20,0.24)(0.00,0.00,0.06)(0.15,0.21,0.24)
A5(0.11,0.18,0.23)(0.13,0.19,0.24)(0.13,0.19,0.23)(0.14,0.20,0.24)(0.00,0.00,0.06)
Table 7. The total relation matrix T.
A1A2A3A4A5
A13.4333.5033.555 *3.534 *3.551 *
A23.512 *3.0823.528 *3.4893.542 *
A33.568 *3.542 *3.4423.518 *3.554 *
A43.556 *3.521 *3.568 *3.4333.578 *
A53.541 *3.544 *3.556 *3.552 *3.447
* > 3.51 (threshold).
Table 8. The degree of centrality and causality.
Constructdrd + r
(Centrality)
dr
(Causality)
QuadrantCausal Relationship
A117.57617.60935.185−0.0334thEffect construct
A217.15317.19234.345−0.0393rdIndependence construct
A317.62317.64735.270−0.0244thEffect construct
A417.65617.52635.1820.1301stCause construct
A517.63917.67235.311−0.0334thEffect construct
Average17.52917.52935.0590
Table 9. The degree of centrality and causality among indicators under various constructs.
ConstructIndicatordrd + r
(Centrality)
dr
(Causality)
QuadrantCausal Relationship
Operating costB19.5288.04417.5721.4842ndOther indicator
B28.4749.60318.077−1.1294thEffect indicator
B38.2148.94217.156−0.7283rdIndependence indicator
B48.9558.58317.5380.3722ndOther indicator
Quality and brandC15.8337.54513.378−1.7123rdIndependence indicator
C27.1156.41113.5260.7042ndOther indicator
C37.4546.44713.9011.0071stCause indicator
Technology developmentD16.0097.01513.024−1.0063rdIndependence indicator
D28.0217.56115.5820.4601stCause indicator
D36.9117.36614.277−0.4553rdIndependence indicator
D47.1846.78813.9720.3962ndOther indicator
D58.0517.44515.4960.6061stCause indicator
Product integrityE18.9798.96117.9400.0181stCause indicator
E28.3028.37016.672−0.0683rdIndependence indicator
E38.3669.02617.392−0.6603rdIndependence indicator
E49.5648.85318.4170.7111stCause indicator
Customer SatisfactionF115.58518.56634.151−2.9813rdIndependence indicator
F217.78118.43436.215−0.6534thEffect indicator
F319.06515.59034.6553.4752ndOther indicator
F418.48018.32136.8010.1591stCause indicator
The average value of centrality of operating cost (A1) was 17.586, the average value of centrality of quality and brand (A2) was 13.602, the average value of centrality of technology development (A3) was 14.470, the average value of centrality of product integrity (A4) was 17.605, the average value of centrality of customer satisfaction (A5) was 35.456.

