A Two-Phase Model for Personnel Selection Based on Multi-Type Fuzzy Information

Abstract
:1. Introduction
2. Literature Review
3. The 2-Tuple Linguistic Variables
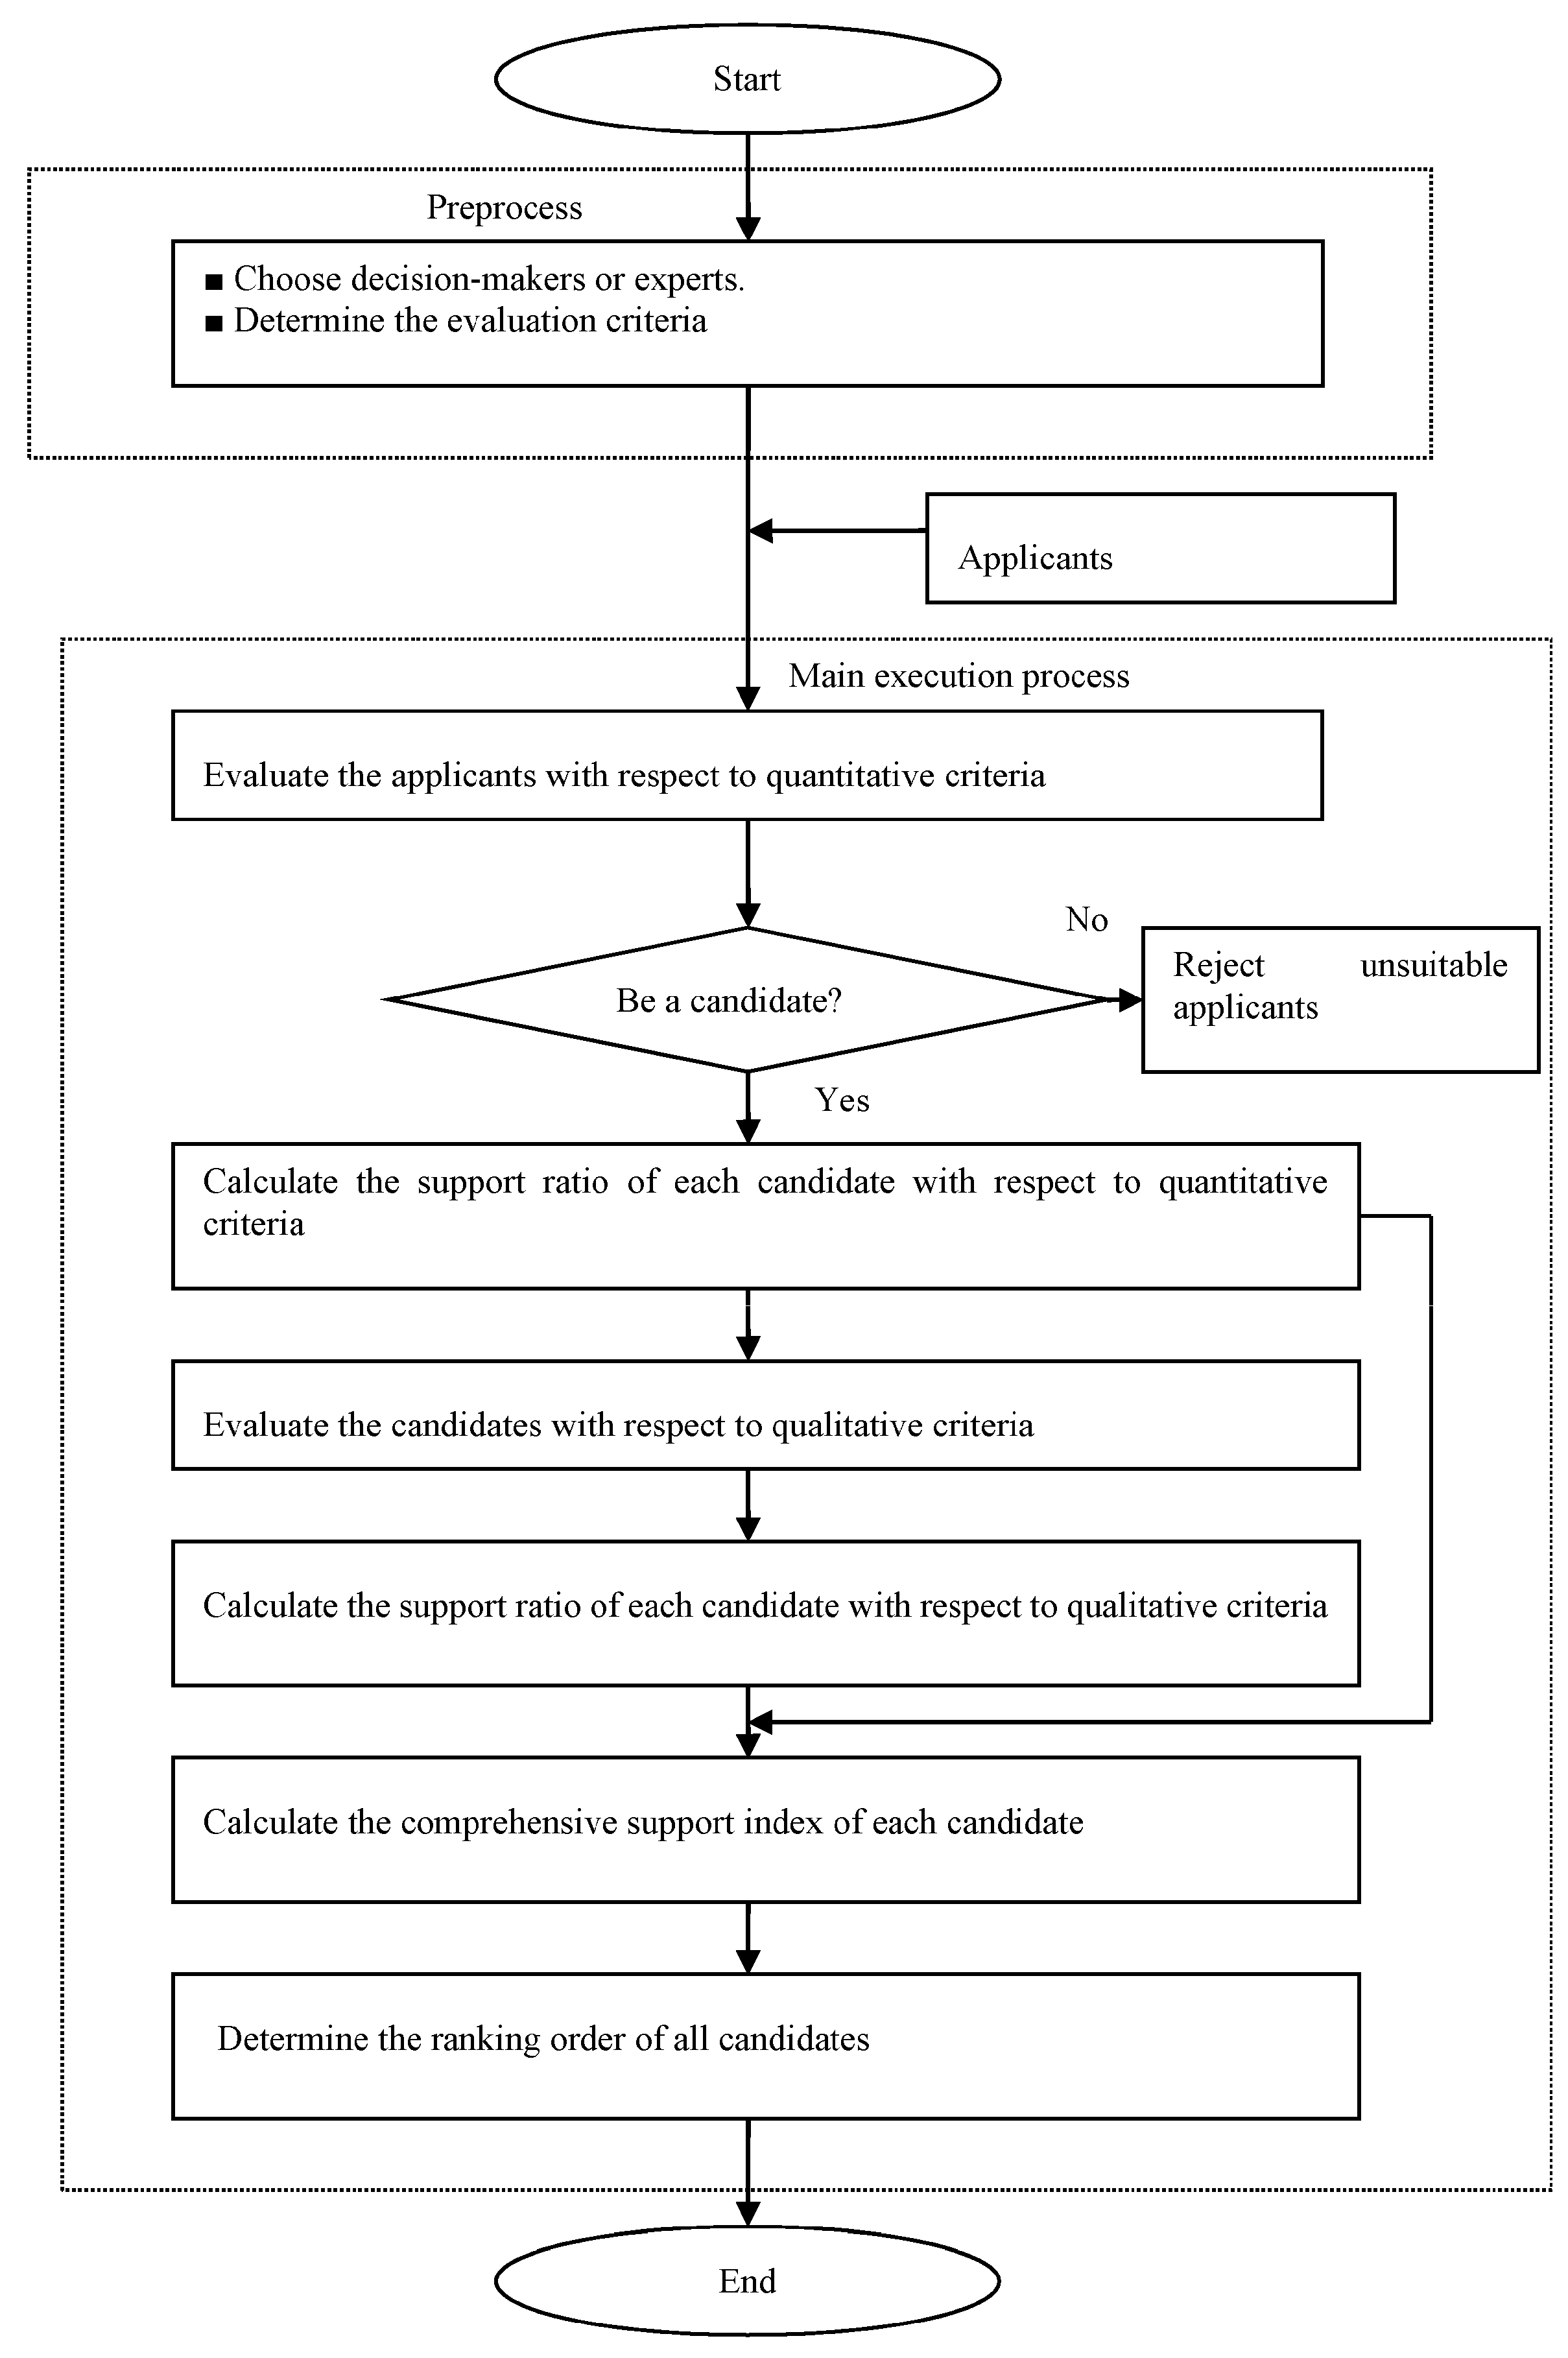
4. The TPMCDM Method
4.1. The First Phase
4.2. The Second Phase
5. Numerical Example
5.1. The Computational Steps Based on Quantitative Criteria
5.2. The Computational Steps of the Final Ranking Order
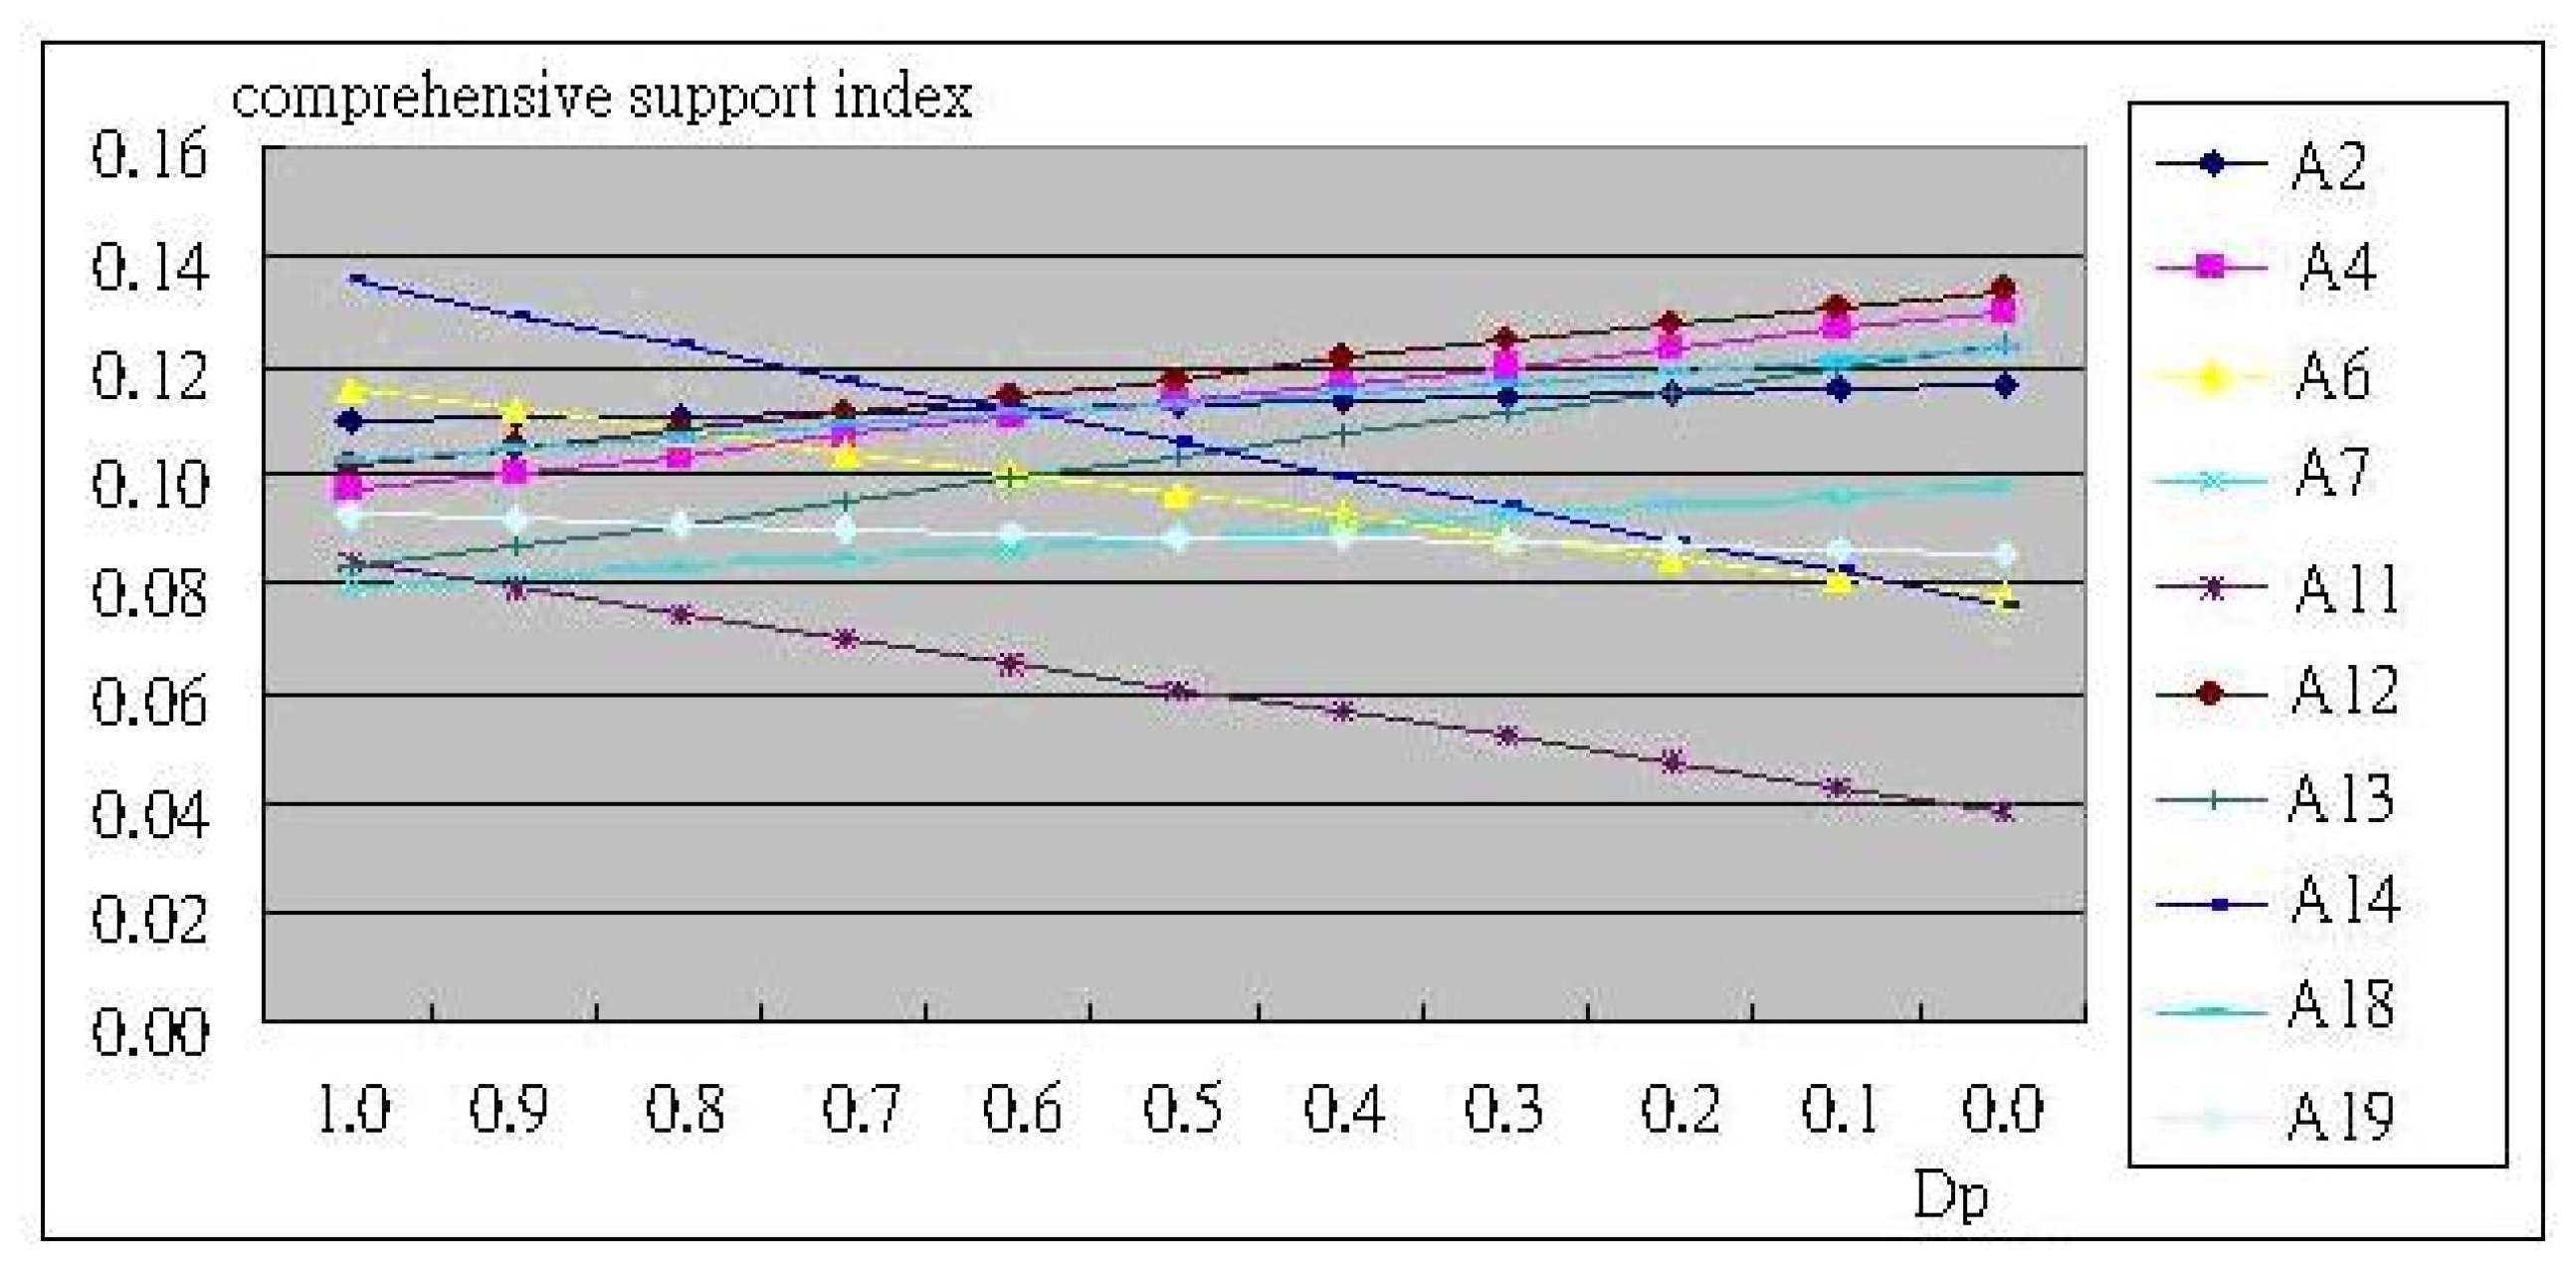
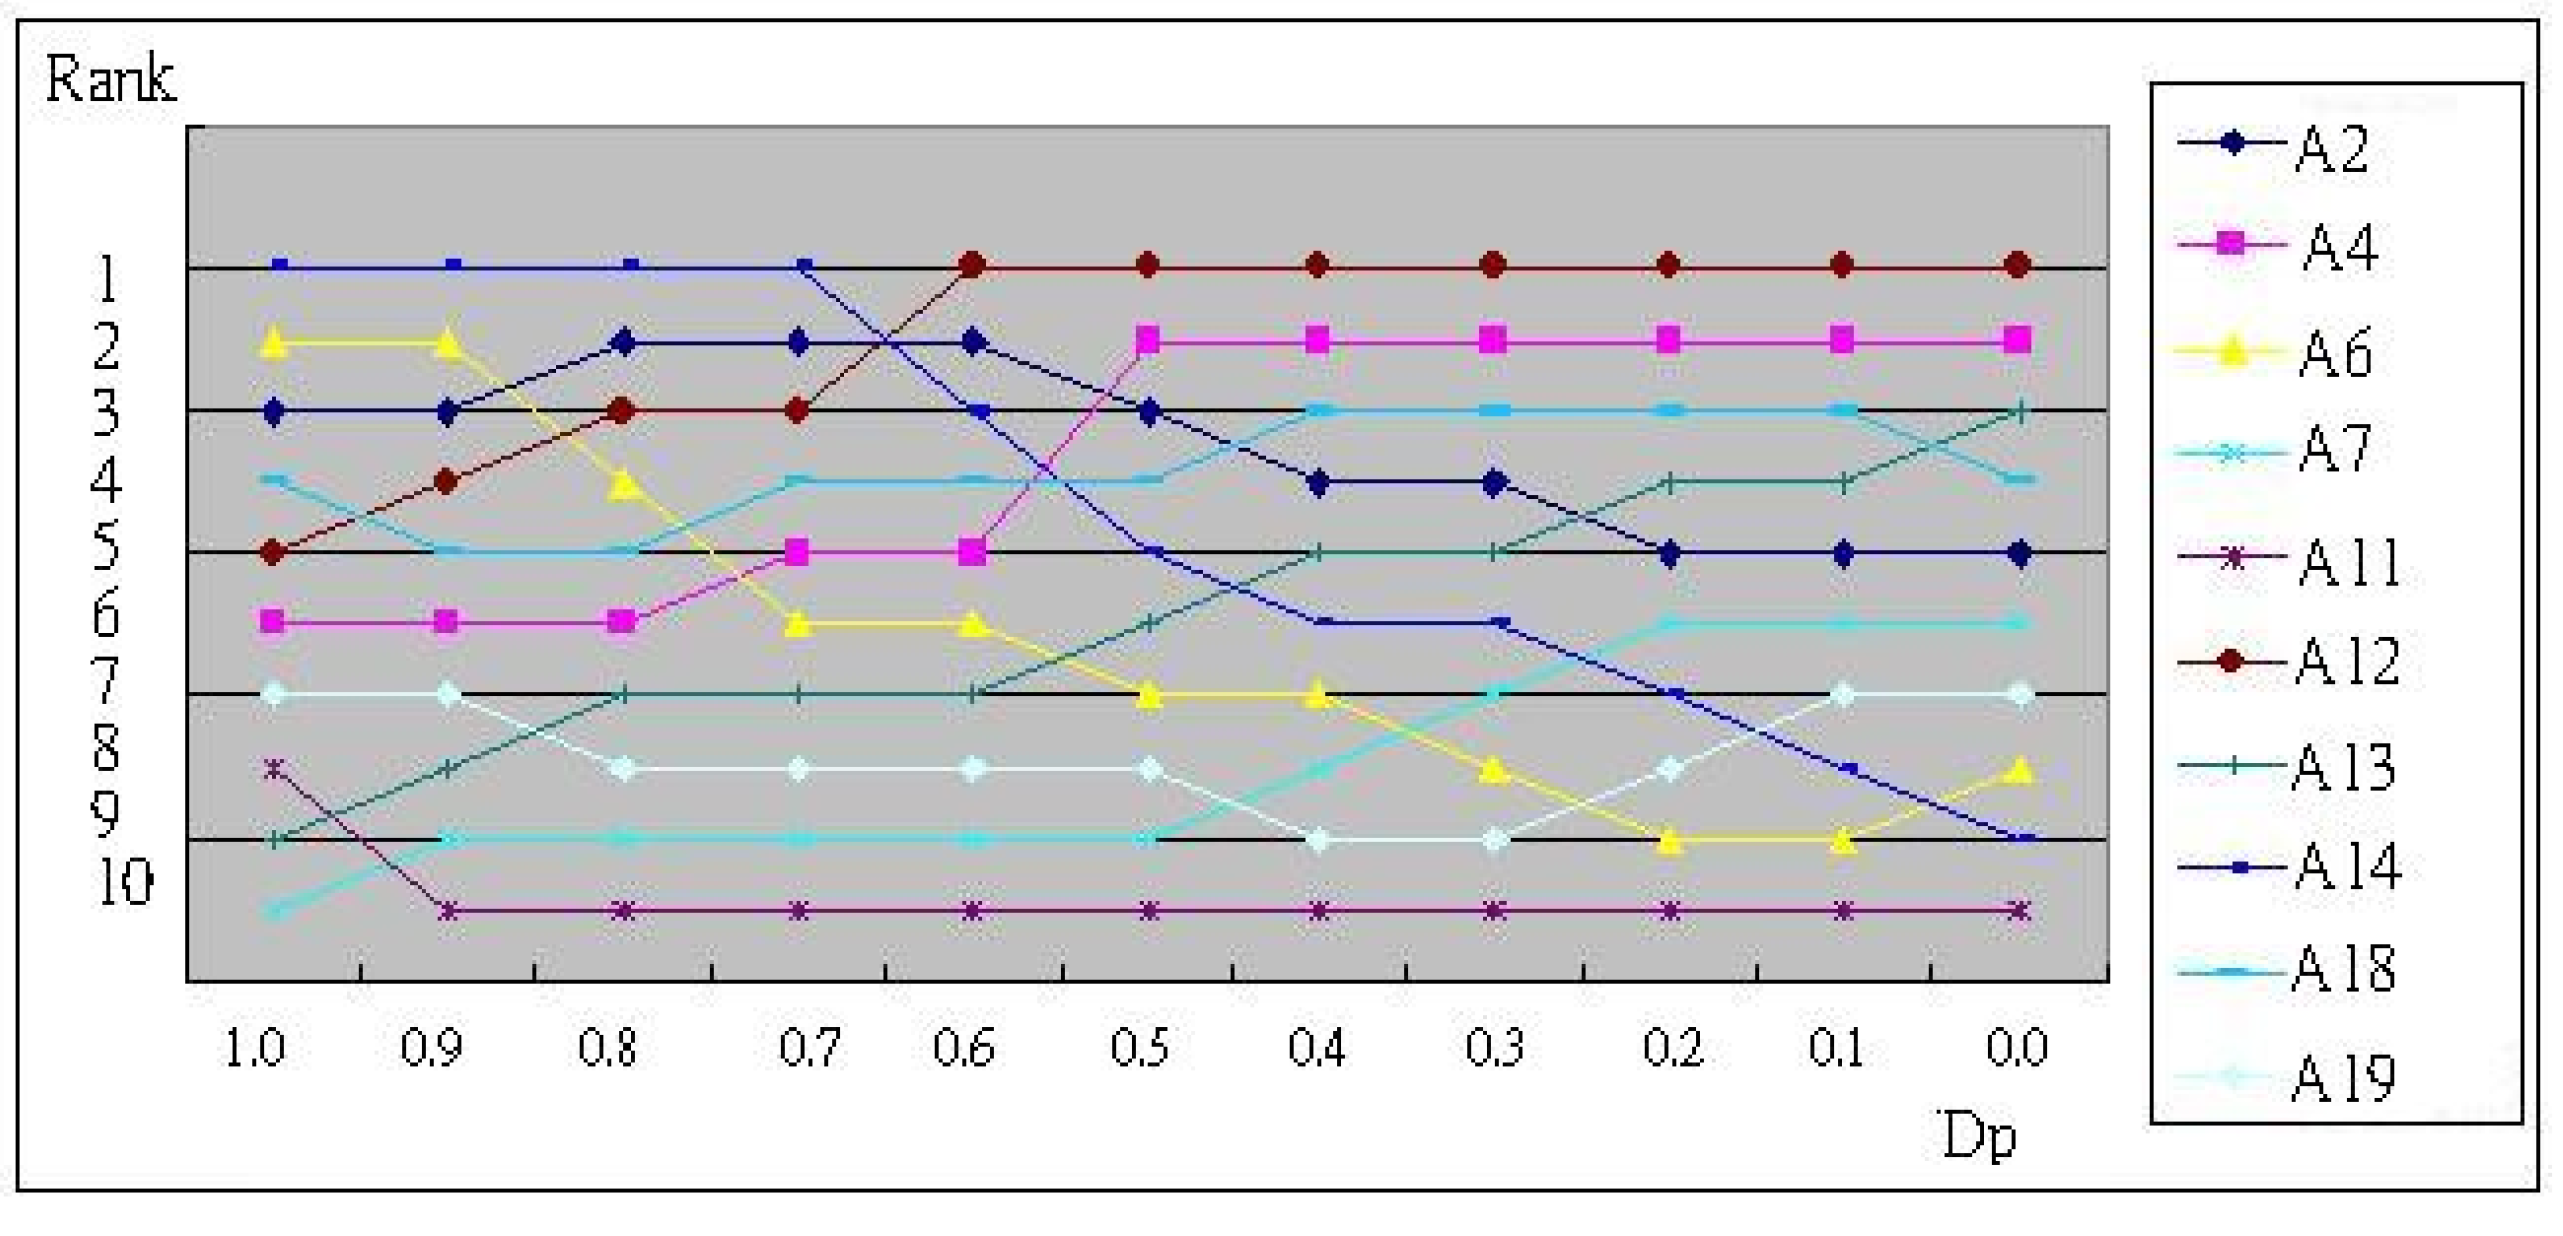
6. Simulation and Effectiveness Explanation
7. Conclusions
Author Contributions
Funding
Acknowledgments
Conflicts of Interest
References
- Chien, C.F.; Chen, L.F. Data mining to improve personnel selection and enhance human capital: A case study in high-technology industry. Expert Syst. Appl. 2008, 34, 280–290. [Google Scholar] [CrossRef]
- Caligiuri, P.; Tarique, I.; Jacobs, R. Selection for international assignments. Hum. Resour. Manag. Rev. 2009, 19, 251–262. [Google Scholar] [CrossRef]
- Figueira, J.; Greco, S.; Ehrgott, M. Multiple Criteria Decision Analysis: State of the Art Surveys; Springer: Berlin/Heidelberg, Germany, 2005. [Google Scholar]
- Liu, H.C.; Chen, X.Q.; Duan, C.Y.; Wang, Y.M. Failure mode and effect analysis using multi-criteria decision making methods: A systematic literature review. Comput. Ind. Eng. 2019, 135, 881–897. [Google Scholar] [CrossRef]
- Wanga, X.; Triantaphylloub, E. Ranking irregularities when evaluating alternatives by using some ELECTRE methods. Omega 2008, 36, 45–63. [Google Scholar] [CrossRef]
- Hwang, C.; Yoon, K. Multiple Attribute Decision Making: Methods and Application; Springer: Berlin/Heidelberg, Germany, 1981. [Google Scholar]
- Kelemenis, A.; Askounis, D. A new TOPSIS-based multi-criteria approach to personnel selection. Expert Syst. Appl. 2010, 37, 4999–5008. [Google Scholar] [CrossRef]
- Korkmaz, O. Personnel Selection Method Based on TOPSIS Multi-Criteria Decision-Making Method. Int. J. Econ. Adm. Stud. 2019, in press. [Google Scholar] [CrossRef]
- Amiri, M.P. Project selection for oil-fields development by using the AHP and fuzzy TOPSIS methods. Expert Syst. Appl. 2010, 37, 6218–6224. [Google Scholar] [CrossRef]
- Dağdeviren, M.; Yavuz, S.; Kılınç, N. Weapon selection using the AHP and TOPSIS methods under fuzzy environment. Expert Syst. Appl. 2009, 36, 8143–8151. [Google Scholar] [CrossRef]
- Wang, Y.M.; Taha, M.S.E. Fuzzy TOPSIS method based on alpha level sets with an application to bridge risk assessment. Expert Syst. Appl. 2006, 31, 309–319. [Google Scholar] [CrossRef]
- Saremi, M.; Mousavi, F.; Sanayei, A. TQM consultant selection in SMEs with TOPSIS under fuzzy environment. Expert Syst. Appl. 2009, 36, 2742–2749. [Google Scholar] [CrossRef]
- Chen, C.T.; Hung, W.Z. A new decision-making method for stock portfolio selection based on computing with linguistic assessment. Adv. Decis. Sci. 2009, 2009, 897024. [Google Scholar] [CrossRef] [Green Version]
- Brans, J.P.; Vincke, P.; Mareschal, B. How to select and how to rank projects: The PROMETHEE method. Eur. J. Oper. Res. 1986, 24, 228–238. [Google Scholar] [CrossRef]
- Goumas, M.; Lygerou, V. An extension of the PROMETHEE method for decision making in fuzzy environment: Ranking of alternative energy exploitation projects. Eur. J. Oper. Res. 2000, 123, 606–613. [Google Scholar] [CrossRef]
- Halouani, N.; Chabchoub, H.; Martel, J.M. PROMETHEE-MD-2T method for project selection. Eur. J. Oper. Res. 2009, 195, 841–849. [Google Scholar] [CrossRef]
- Albadvi, A.; Chaharsooghi, K.; Esfahanipour, A. Decision making in stock trading: An application of PROMETHEE. Eur. J. Oper. Res. 2007, 177, 673–683. [Google Scholar] [CrossRef]
- Mousavi, M.M.; Lin, J. The application of PROMETHEE Multi-criteria Decision Aid in Financial Decision Making: Case of Distress Prediction Models Evaluation. Expert Syst. Appl. 2020, 159, 113438, in press. [Google Scholar] [CrossRef]
- Pavi, I.; Babi, Z. The use of the PROMETHEE method in the location choice of a production system. Int. J. Prod. Econ. 1991, 23, 165–174. [Google Scholar] [CrossRef]
- Shannon, C.E. The mathematical theory of communications. Bell Syst. Tech. J. 1947, 27, 379–423. [Google Scholar] [CrossRef] [Green Version]
- Tian, Q.H.; Du, Y.X. Study of performance evaluation for mechanical products based on entropy fuzzy comprehensive review. J. China Man Inform. 2004, 33, 97–99. [Google Scholar]
- Zou, Z.H.; Yun, Y.; Sun, J.N. Entropy method for determination of weight of evaluating indicators in fuzzy synthetic evaluation for water quality assessment. J. Environ. Sci. 2006, 18, 1020–1023. [Google Scholar] [CrossRef]
- Guo, C.Z. Study on the evaluating method of entropy coefficient for stock investment value. J. Nankai Econ. Stud. 2001, 5, 65–67. [Google Scholar]
- Marchettini, N.; Pulselli, R.M.; Rossi, F.; Tiezzi, E. Entropy. In Encyclopedia of Ecology; Elsevier Science: Amsterdam, The Netherlands, 2008; pp. 1297–1305. [Google Scholar]
- Herrera, F.; Martinez, L. A 2-tuple fuzzy linguistic representation model for computing with words. IEEE Trans. Fuzzy Syst. 2000, 8, 746–752. [Google Scholar]
- Xu, Z.S. Deviation measures of linguistic preference relations in group decision making. Omega 2005, 33, 249–254. [Google Scholar] [CrossRef]
- Herrera-Viedma, E.; Cordón, O.; Luque, M.; Lopez, A.G.; Muñoz, A.M. A model of fuzzy linguistic IRS based on multigranular linguistic information. Int. J. Approx. Reason. 2003, 34, 221–239. [Google Scholar] [CrossRef] [Green Version]
- Ertugrul Karsak, E. A fuzzy multiple objective programming approach for personnel selection. In Proceedings of the 2000 IEEE International Conference on Systems, Man and Cybernetics, Nashville, TN, USA, 8–11 October 2000; Volume 3, pp. 2007–2012. [Google Scholar]
- Korvin, A.D.; Shipley, M.F.; Kleyle, R. Utilizing fuzzy compatibility of skill sets for team selection in multi-phase projects. J. Eng. Technol. Manag. 2002, 19, 307–319. [Google Scholar] [CrossRef]
- Chien, C.F.; Chen, L.F. Using rough set theory to recruit and retain high-potential talents for semiconductor. IEEE Trans. Semicond. Manuf. 2007, 20, 528–541. [Google Scholar] [CrossRef]
- Gungor, Z.; Serhadloglu, G.; Kesen, S.E. A fuzzy AHP approach to personnel selection problem. Appl. Soft Comput. 2009, 9, 641–646. [Google Scholar] [CrossRef]
- Celik, M.; Kandakoglu, A.; Deha Er, I. Structuring fuzzy integrated multi-stages evaluation model on academic personnel recruitment in MET institutions. Expert Syst. Appl. 2009, 36, 6918–6927. [Google Scholar] [CrossRef]
- Fan, Z.P.; Feng, B.; Jiang, Z.Z.; Fu, N. A method for member selection of R&D teams using the individual and collaborative information. Expert Syst. Appl. 2009, 36, 8313–8323. [Google Scholar]
- Feng, B.; Jiang, Z.Z.; Fan, Z.P.; Fu, N. A method for member selection of cross-functional teams using the individual and collaborative performances. Eur. J. Oper. Res. 2010, 203, 652–661. [Google Scholar] [CrossRef] [Green Version]
- Zhang, S.F.; Liu, S.Y. A GRA-based intuitionistic fuzzy multi-criteria group decision making method for personnel selection. Expert Syst. Appl. 2011, 38, 11401–11405. [Google Scholar] [CrossRef]
- Chen, C.T.; Pai, P.F.; Hung, W.Z. Applying Linguistic VIKOR and Knowledge Map in Personnel Selection. Asia Pac. Manag. Rev. 2011, 16, 491–502. [Google Scholar]
- Bangerter, A.; Roulin, N.; König, C.J. Personnel selection as a signaling game. J. Appl. Psychol. 2012, 97, 719–738. [Google Scholar] [CrossRef] [Green Version]
- Afshari, A.R.; Yusuff, R.M.; Derayatifar, A.R. Linguistic extension of fuzzy integral for group personnel selection problem. Arab. J. Sci. Eng. 2013, 38, 2901–2910. [Google Scholar] [CrossRef]
- Sang, X.; Liu, X.; Qin, J. An analytical solution to fuzzy TOPSIS and its application in personnel selection for knowledge-intensive enterprise. Appl. Soft Comput. 2015, 30, 190–204. [Google Scholar] [CrossRef]
- Ji, P.; Zhang, H.Y.; Wang, J.Q. A projection-based TODIM method under multi-valued neutrosophic environments and its application in personnel selection. Neural Comput. Appl. 2018, 29, 221–234. [Google Scholar] [CrossRef] [Green Version]
- Heidary Dahooie, J.; Beheshti Jazan Abadi, E.; Vanaki, A.S.; Firoozfar, H.R. Competency-based IT personnel selection using a hybrid SWARA and ARAS-G methodology. Hum. Factors Ergon. Manuf. Serv. Ind. 2018, 28, 5–16. [Google Scholar] [CrossRef]
- Yalçın, N.; Yapıcı Pehlivan, N. Application of the fuzzy CODAS method based on fuzzy envelopes for hesitant fuzzy linguistic term sets: A case study on a personnel selection problem. Symmetry 2019, 11, 493. [Google Scholar] [CrossRef] [Green Version]
- Chuang, Y.C.; Hu, S.K.; Liou, J.J.; Tzeng, G.H. A data-driven MADM model for personnel selection and improvement. Technol. Econ. Dev. Econ. 2020, 26, 751–784. [Google Scholar] [CrossRef]
- Kilic, H.S.; Demirci, A.E.; Delen, D. An integrated decision analysis methodology based on IF-DEMATEL and IF-ELECTRE for personnel selection. Decis. Support Syst. 2020, 137, 113360, in press. [Google Scholar] [CrossRef]
- Krishankumar, R.; Premaladha, J.; Ravichandran, K.S.; Sekar, K.R.; Manikandan, R.; Gao, X.Z. A novel extension to VIKOR method under intuitionistic fuzzy context for solving personnel selection problem. Soft Comput. 2020, 24, 1063–1081. [Google Scholar] [CrossRef]
- Ozdemir, Y.; Nalbant, K.G. Personnel selection for promotion using an integrated consistent fuzzy preference relation—Fuzzy analytic hierarchy process methodology: A real case study. Asian. J. Interdiscip. Res. 2020, 3, 219–236. [Google Scholar] [CrossRef] [Green Version]
- Herrera, F.; Martinez, L. A model based on linguistic 2-tuples for dealing with multigranular hierarchical linguistic contexts in multi-expert decision-making. IEEE Trans. Syst. Man Cybern. Part B 2001, 31, 227–234. [Google Scholar] [CrossRef] [PubMed] [Green Version]
- Tai, W.S.; Chen, C.T. A new evaluation model for intellectual capital based on computing with linguistic variable. Expert Syst. Appl. 2009, 36, 3483–3488. [Google Scholar] [CrossRef]
- Herrera-Viedma, E.; Herrera, F.L.; Martínez, L.; Herrera, J.C.; López, A.G. Incorporating filtering techniques in a fuzzy linguistic multi-agent model for information gathering on the web. Fuzzy Sets Syst. 2004, 148, 61–83. [Google Scholar] [CrossRef] [Green Version]
- Herrera, F.; Martinez, L.; Sanchez, P.J. Managing non-homogeneous information in group decision making. Eur. J. Oper. Res. 2005, 166, 115–132. [Google Scholar] [CrossRef]
- Chen, C.T.; Pai, P.F.; Hung, W.Z. An integrated methodology using linguistic PROMETHEE and maximum deviation method for third-party logistics supplier selection. Int. J. Comput. Intell. Sys. 2010, 3, 438–451. [Google Scholar] [CrossRef]


| Type | Linguistic Variable | Figure | |
|---|---|---|---|
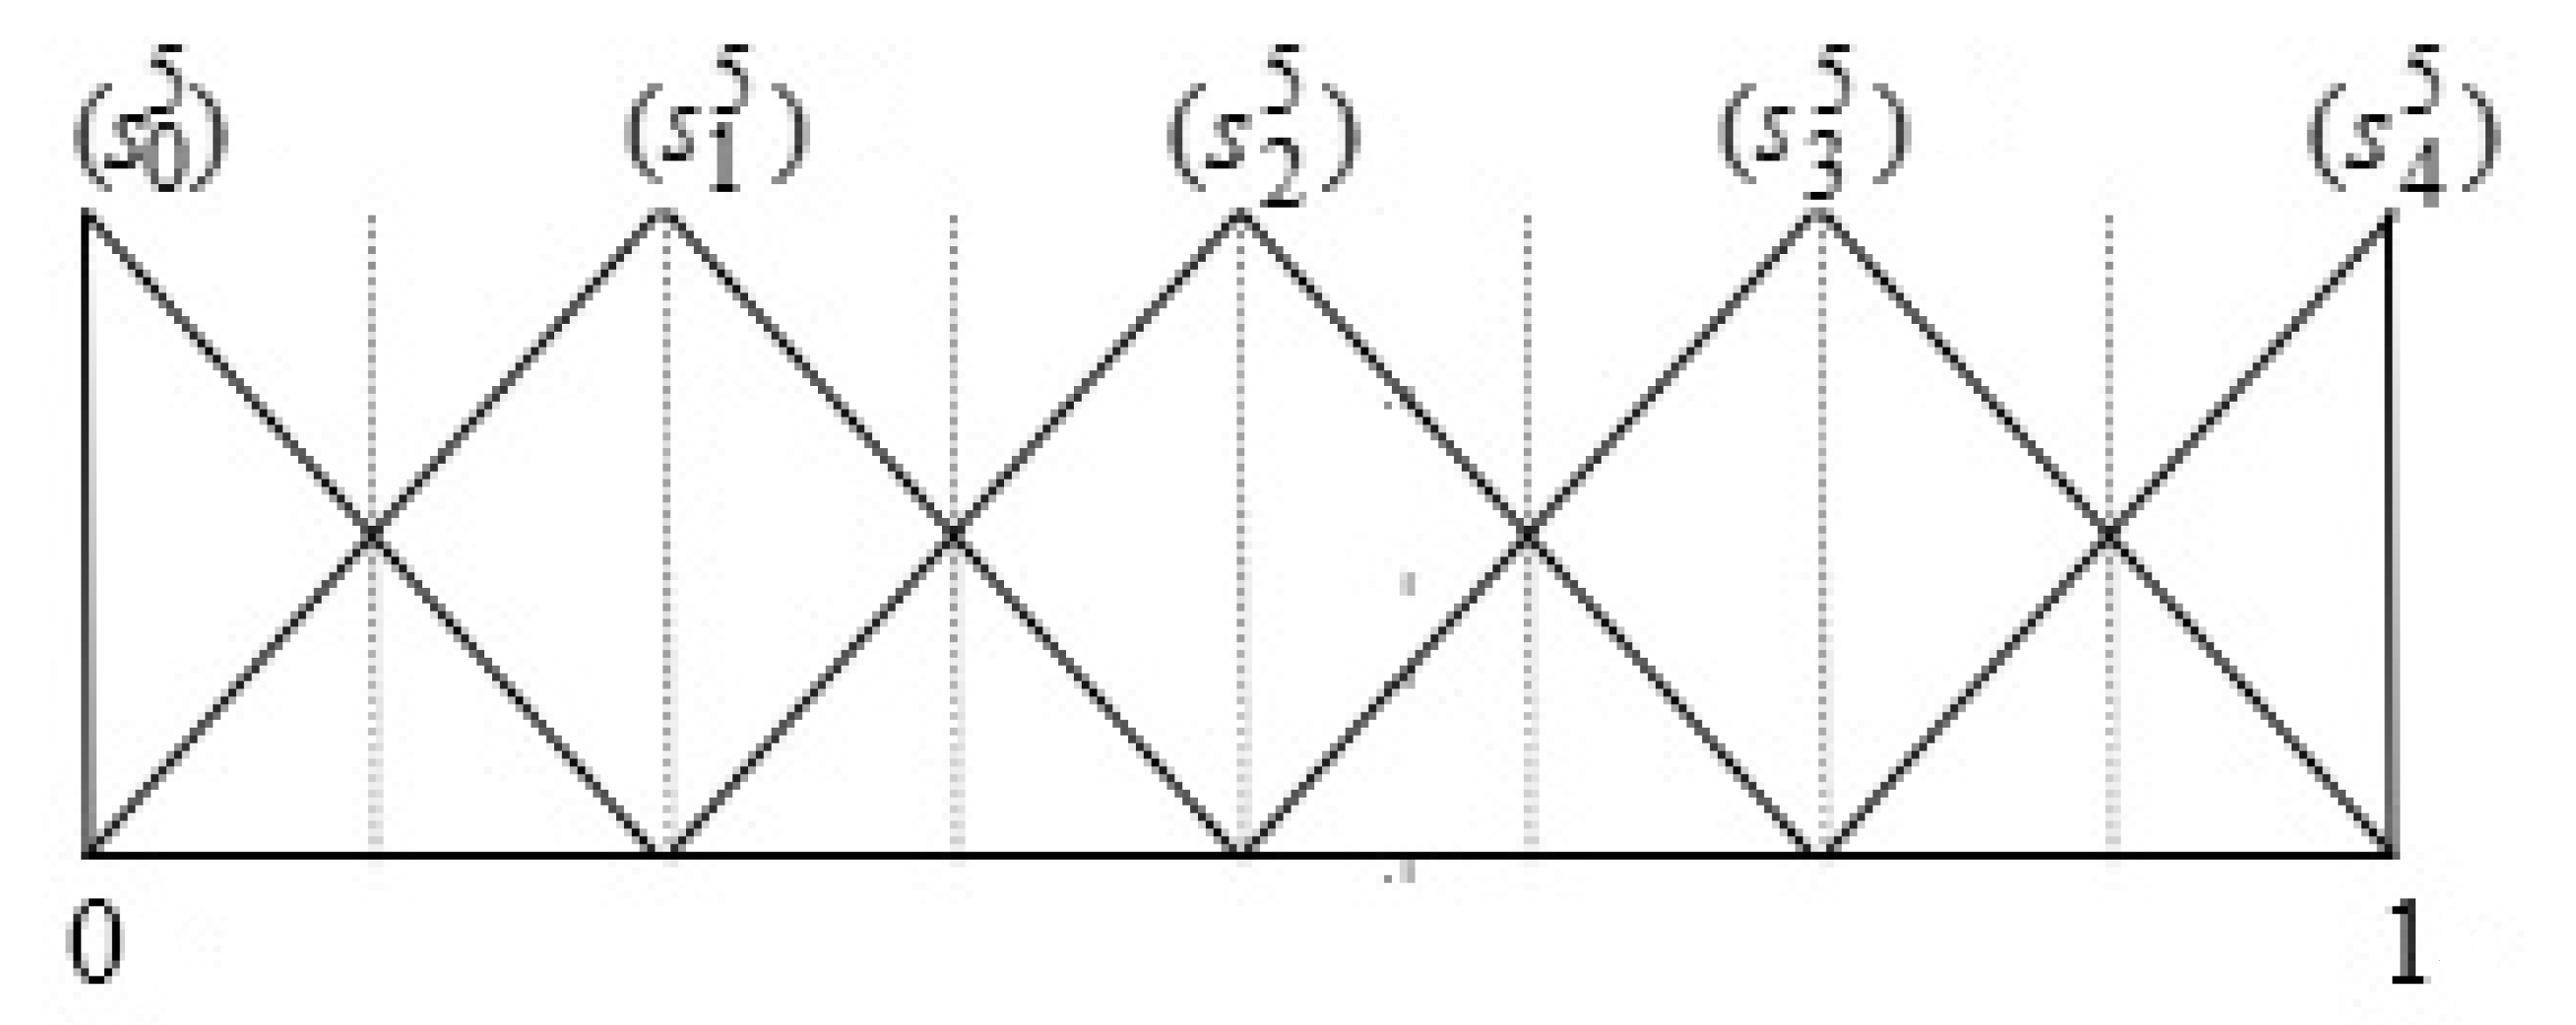
| 1 | Performance | Extremely Poor , Poor , Fair , Good , Extremely Good | Figure 1 |
| Weight | Extremely Low , Low , Fair , High , Extremely High | ||
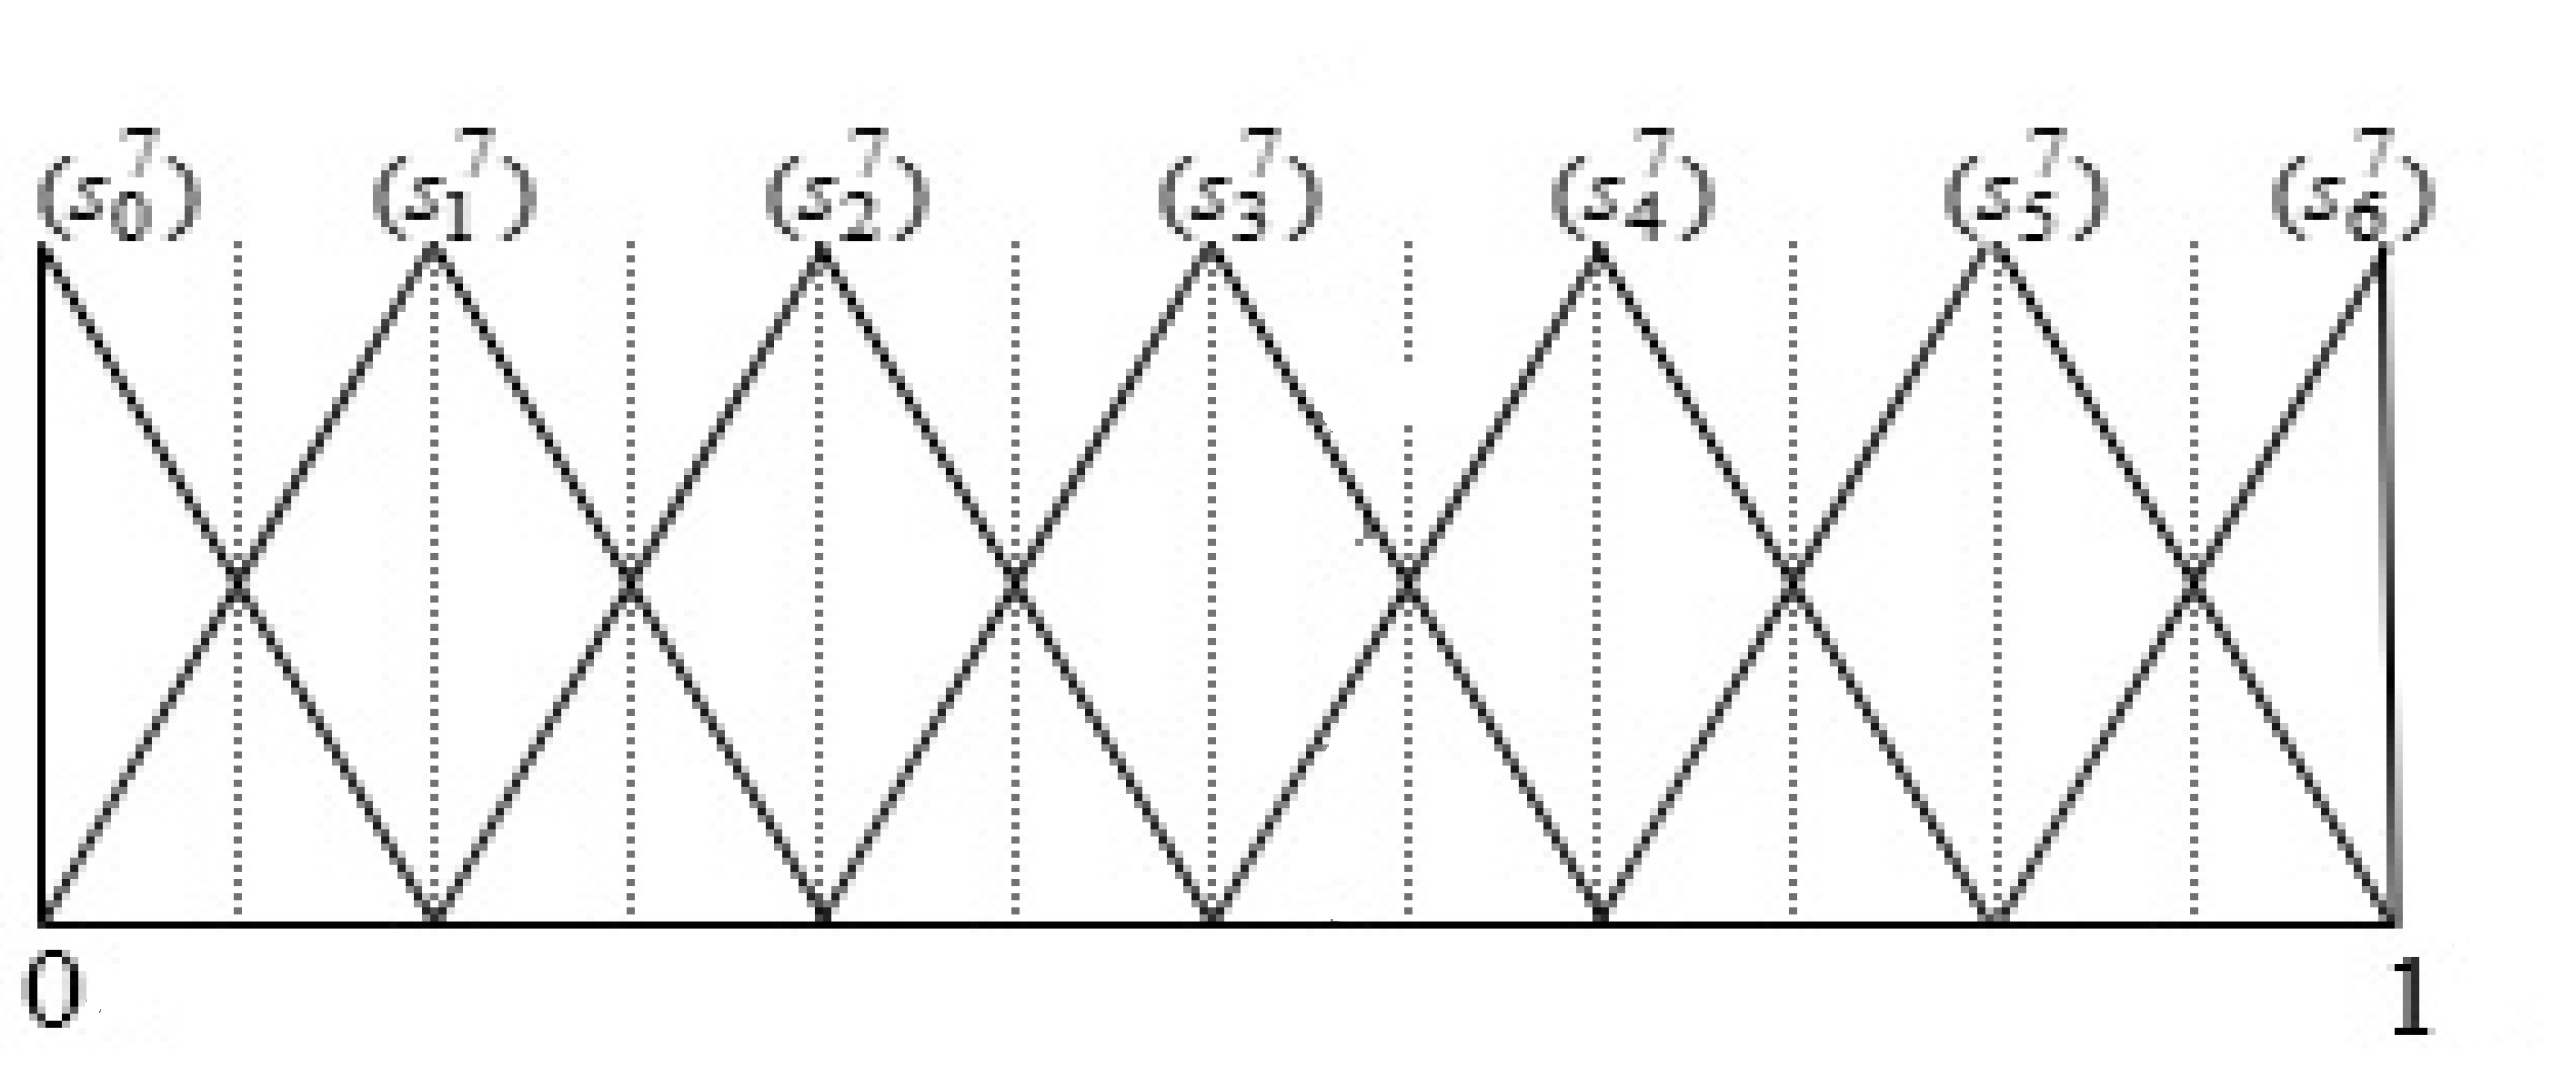
| 2 | Performance | Extremely Poor , Poor , Medium Poor , Fair , Medium Good , Good , Extremely Good | Figure 2 |
| Weight | Extremely Low , Low , Medium Low , Fair , Medium High , High , Extremely High | ||
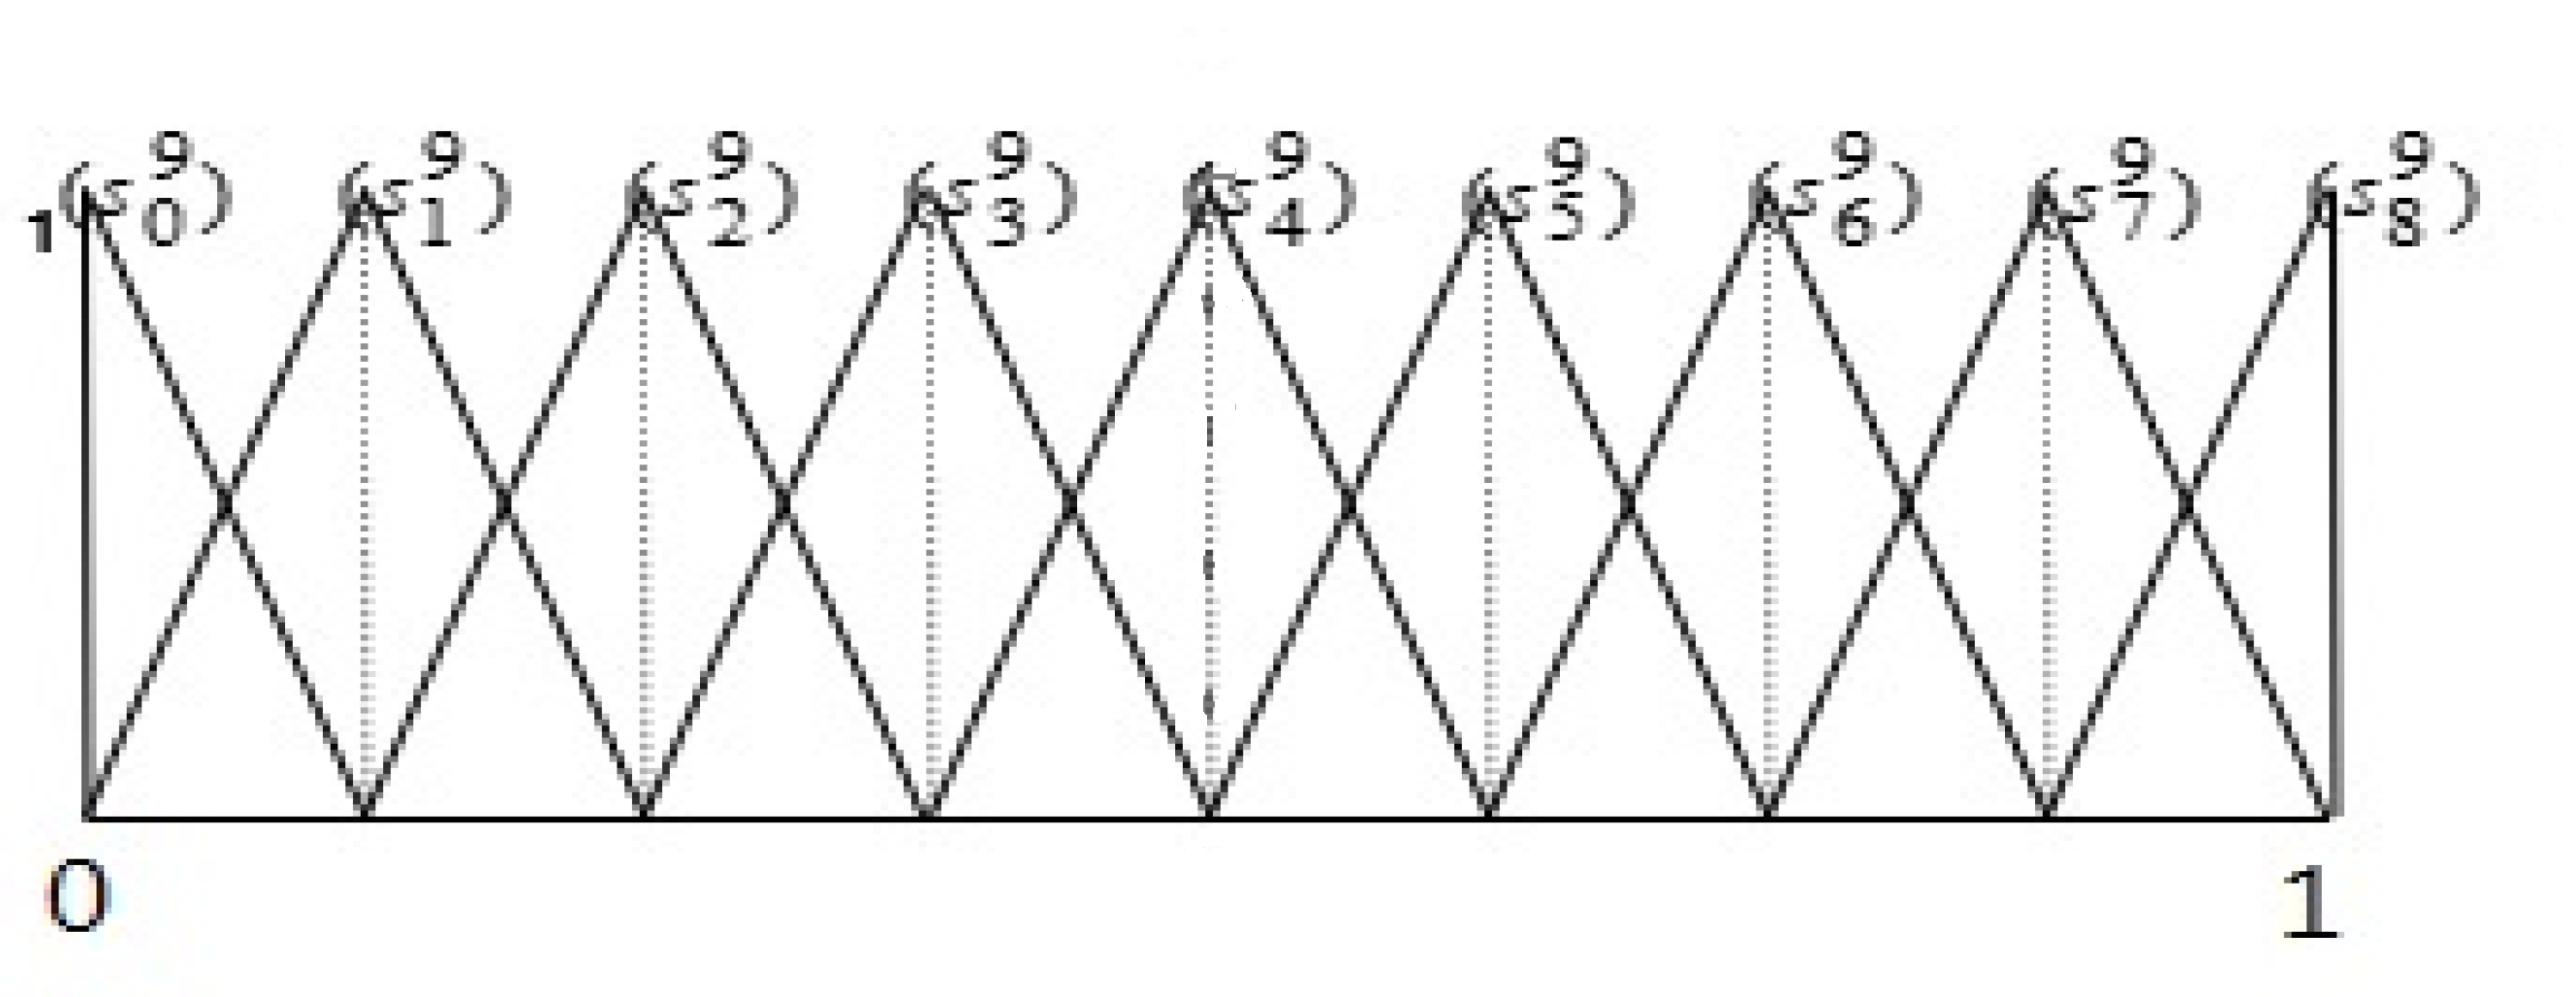
| 3 | Performance | Extremely Poor , Very Poor , Poor , Medium Poor , Fair , Medium Good , Good , Very Good , Extremely Good | Figure 3 |
| Weight | Extremely Low , Very Low , Low , Medium Low , Fair , Medium High , High , Very High , Extremely High | ||
| Criterion | Data Type | Preference Function |
|---|---|---|
| Language ability (TOEIC) | Quantitative | Criterion with linear preference and indifference area |
| Educational background | Quantitative | Level criterion with linear preference |
| Work experience (Year) | Quantitative | Level criterion with linear preference |
| License | Quantitative | Criterion with linear preference and indifference area |
| Communication skill | Qualitative | Criterion with linear preference and indifference area |
| Innovation ability | Qualitative | Level criterion with linear preference |
| Advertise design ability | Qualitative | Criterion with linear preference and indifference area |
| Emotional steadiness | Qualitative | Level criterion with linear preference |
| 815 | 280 | 220 | 550 | 290 | 870 | 450 | 840 | 150 | 330 | |
| 1 | 8 | 1 | 6 | 2 | 5 | 6 | 4 | 3 | 7 | |
| 3 | 4 | 3 | 4 | 1 | 4 | 3 | 2 | 3 | 1 | |
| 2 | 7 | 3 | 4 | 5 | 6 | 3 | 2 | 7 | 4 | |
| 660 | 330 | 450 | 480 | 640 | 220 | 280 | 600 | 720 | 440 | |
| 1 | 5 | 7 | 10 | 3 | 4 | 5 | 6 | 7 | 2 | |
| 2 | 4 | 2 | 3 | 2 | 1 | 4 | 2 | 3 | 2 | |
| 8 | 8 | 4 | 10 | 4 | 5 | 1 | 7 | 2 | 1 |
| 0.243 | 0.243 | 0.260 | 0.243 |
| 0.1259 | 0.0736 | 0.1383 | 0.0819 | 0.1309 | 0.0660 | 0.0968 | 0.1109 | 0.1122 | 0.1093 | |
| 0.0832 | 0.1140 | 0.0465 | 0.0962 | 0.0451 | 0.1190 | 0.0762 | 0.0837 | 0.0770 | 0.0718 | |
| 0.3979 | 0.6077 | 0.2518 | 0.5401 | 0.2562 | 0.6433 | 0.4404 | 0.4300 | 0.4070 | 0.3963 | |
| - | 0.1092 | - | 0.0971 | - | 0.1156 | 0.0791 | - | - | - | |
| 0.1059 | 0.0804 | 0.0922 | 0.0467 | 0.1064 | 0.1231 | 0.1237 | 0.0720 | 0.0918 | 0.1386 | |
| 0.0930 | 0.1052 | 0.0790 | 0.1419 | 0.0677 | 0.0521 | 0.0754 | 0.0961 | 0.0968 | 0.0388 | |
| 0.4676 | 0.5668 | 0.4613 | 0.7522 | 0.3890 | 0.2972 | 0.3786 | 0.5719 | 0.5132 | 0.2185 | |
| 0.0840 | 0.1019 | 0.0829 | 0.1352 | - | - | - | 0.1028 | 0.0922 | - |
| Criterion | Candidate | E1 | E2 | E3 | Criterion | Candidate | E1 | E2 | E3 |
|---|---|---|---|---|---|---|---|---|---|
| A2 | A2 | ||||||||
| A4 | A4 | ||||||||
| A6 | A6 | ||||||||
| A7 | A7 | ||||||||
| A11 | A11 | ||||||||
| A12 | A12 | ||||||||
| A13 | A13 | ||||||||
| A14 | A14 | ||||||||
| A18 | A18 | ||||||||
| A19 | A19 | ||||||||
| A2 | A2 | ||||||||
| A4 | A4 | ||||||||
| A6 | A6 | ||||||||
| A7 | A7 | ||||||||
| A11 | A11 | ||||||||
| A12 | A12 | ||||||||
| A13 | A13 | ||||||||
| A14 | A14 | ||||||||
| A18 | A18 | ||||||||
| A19 | A19 |
| Weight | 0.2190 | 0.2674 | 0.2486 | 0.2650 |
| Threshold values | p = 200 q = 100 | p = 2 q = 1 | p = 3 q = 1 | p = 3 q = 1 | p = 1/6 q = 1/12 | p = 1/6 q = 1/12 | p = 1/6 q = 1/12 | p = 1/6 q = 1/12 |
| A2 | 3.5602 | 2.0710 | 1.4893 | 0.5827 |
| A4 | 4.2924 | 1.6354 | 2.6570 | 0.6476 |
| A6 | 1.9195 | 3.9636 | −2.0440 | 0.3864 |
| A7 | 3.0959 | 3.3062 | −0.2102 | 0.4883 |
| A11 | 0.8021 | 6.3876 | −5.5855 | 0.1897 |
| A12 | 4.3260 | 1.3237 | 3.0023 | 0.6668 |
| A13 | 4.1420 | 2.0393 | 2.1027 | 0.6168 |
| A14 | 2.0424 | 4.1897 | −2.1473 | 0.3807 |
| A18 | 3.6810 | 1.6495 | 2.0314 | 0.6129 |
| A19 | 2.6544 | 3.9501 | −1.2957 | 0.4280 |
| A2 | 0.1092 | 0.1165 | 0.1129 |
| A4 | 0.0971 | 0.1295 | 0.1133 |
| A6 | 0.1156 | 0.0773 | 0.0965 |
| A7 | 0.0791 | 0.0977 | 0.0884 |
| A11 | 0.0840 | 0.0379 | 0.0610 |
| A12 | 0.1019 | 0.1334 | 0.1176 |
| A13 | 0.0829 | 0.1234 | 0.1031 |
| A14 | 0.1352 | 0.0761 | 0.1057 |
| A18 | 0.1028 | 0.1226 | 0.1127 |
| A19 | 0.0922 | 0.0856 | 0.0889 |
| Criterion | Description | Data Type | Range |
|---|---|---|---|
| English ability | Quantitative Data | 10~990 | |
| Work experience | Quantitative Data | 1~10 | |
| Educational Background | Quantitative Data | 1,2,3,4 | |
| License | Quantitative Data | 1~10 | |
| Communication skill | Qualitative Data | Expert ~ Expert ~ Expert ~ | |
| Innovation ability | Qualitative Data | ||
| Advertise design ability | Qualitative Data | ||
| Emotional steadiness | Qualitative Data |
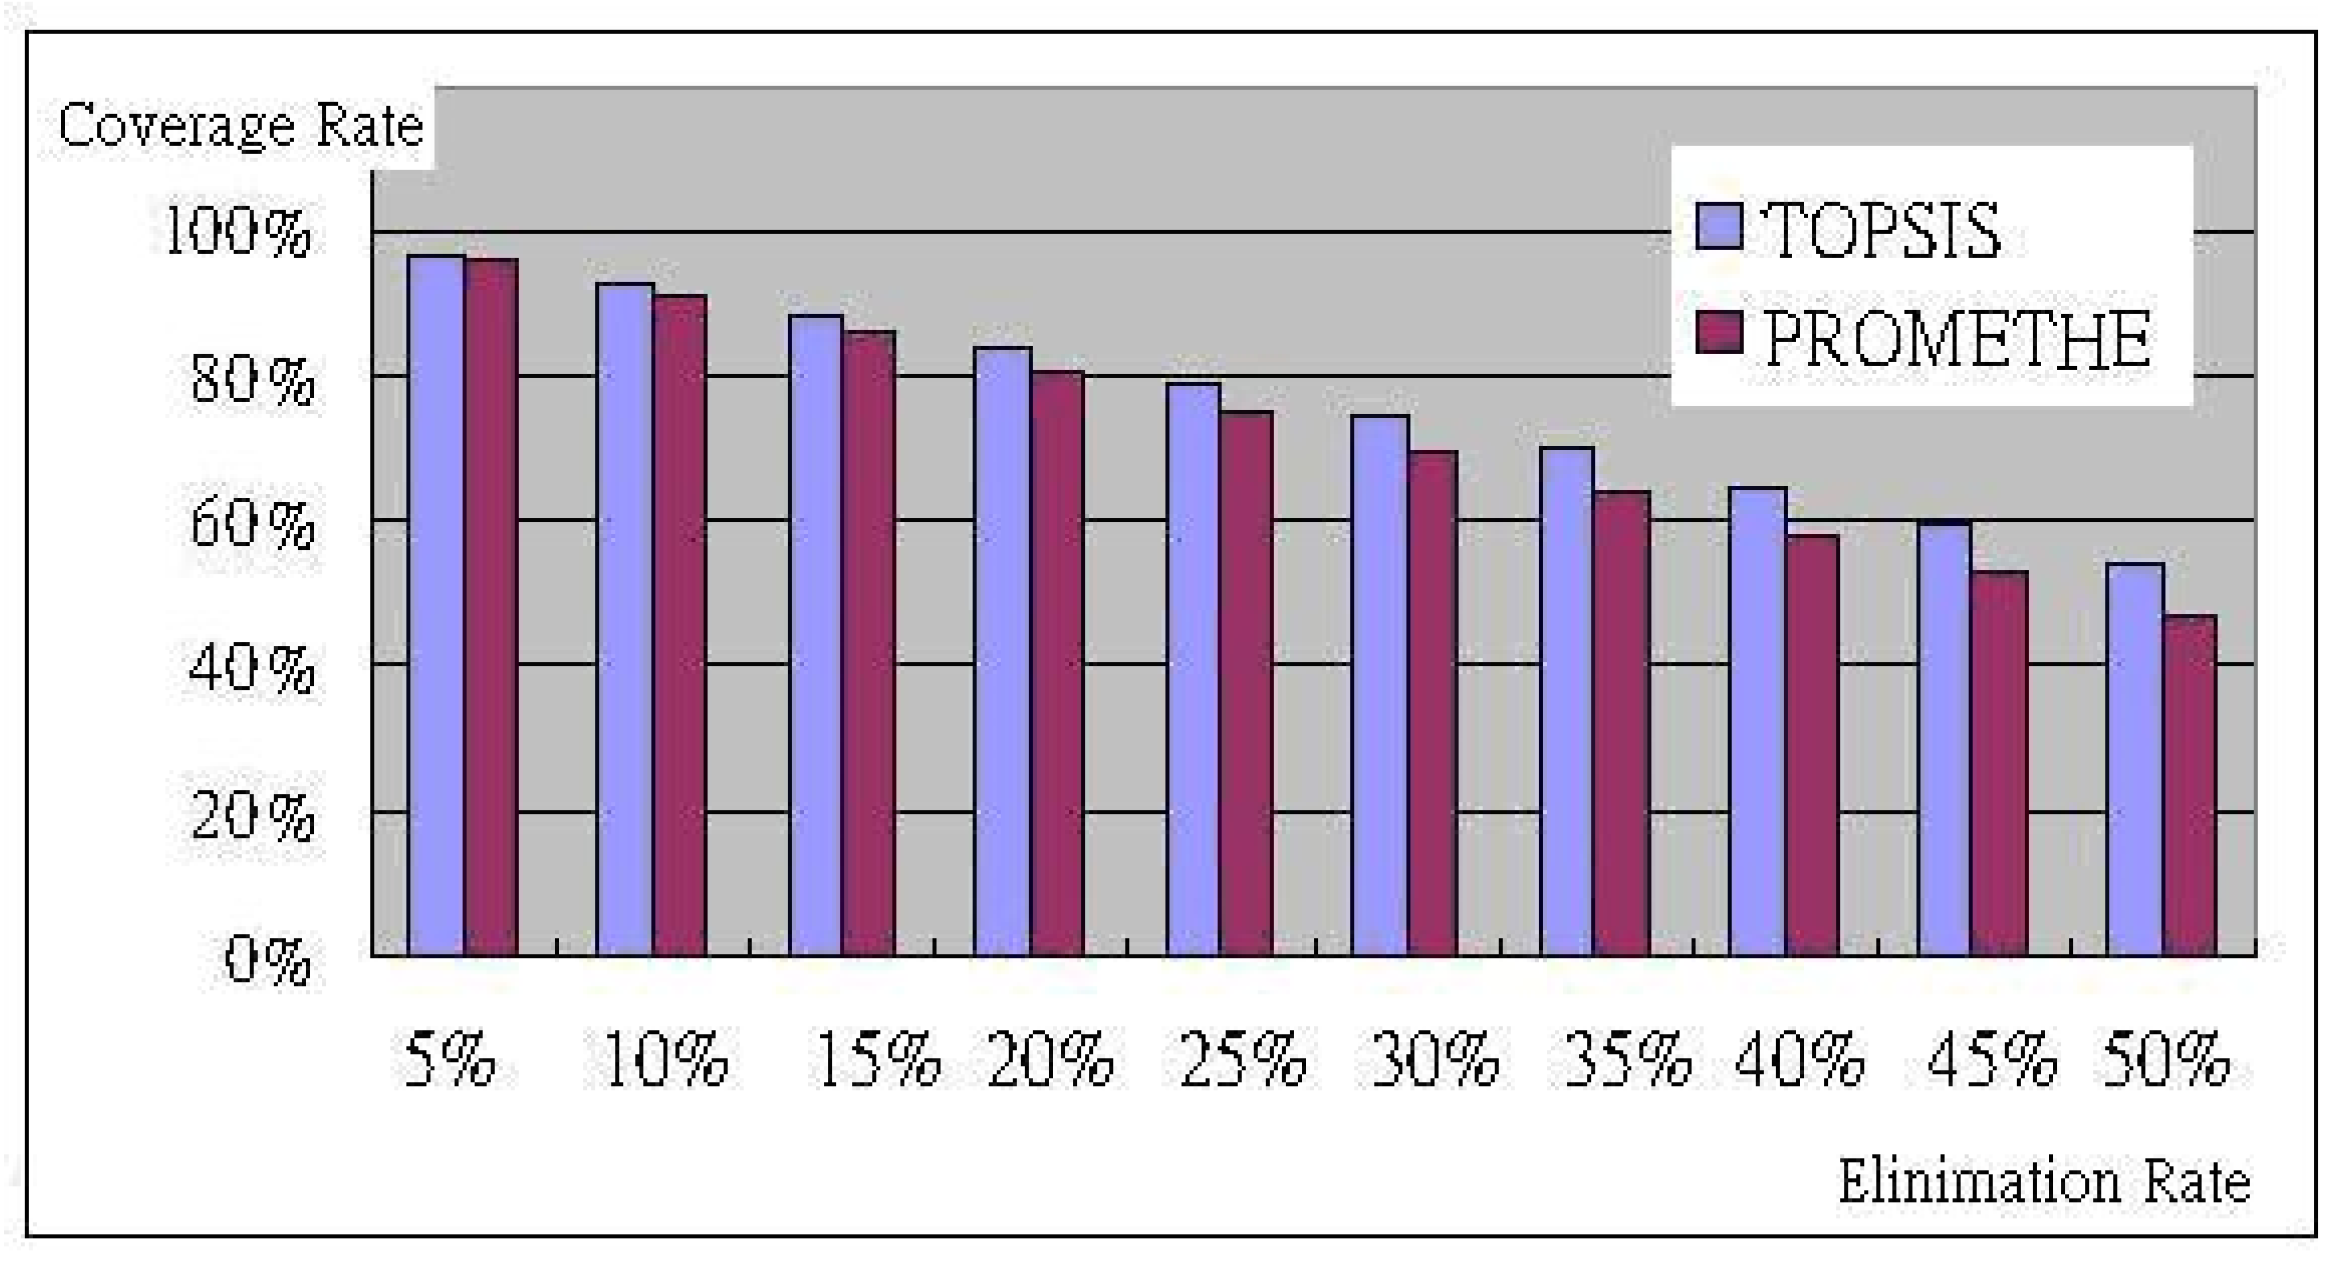
| Coverage Rate | Elimination Rate | ||||
| 5% | 10% | 15% | 20% | 25% | |
| 96.64% | 92.81% | 88.64% | 84.17% | 79.48% | |
| 95.92% | 91.16% | 86.02% | 80.64% | 75.15% | |
| Coverage Rate | Elimination Rate | ||||
| 30% | 35% | 40% | 45% | 50% | |
| 74.64% | 69.66% | 64.55% | 59.35% | 54.04% | |
| 69.57% | 64.00% | 58.42% | 52.87% | 47.37% | |
© 2020 by the authors. Licensee MDPI, Basel, Switzerland. This article is an open access article distributed under the terms and conditions of the Creative Commons Attribution (CC BY) license (http://creativecommons.org/licenses/by/4.0/).
Share and Cite
Chen, C.-T.; Hung, W.-Z. A Two-Phase Model for Personnel Selection Based on Multi-Type Fuzzy Information. Mathematics 2020, 8, 1703. https://doi.org/10.3390/math8101703
Chen C-T, Hung W-Z. A Two-Phase Model for Personnel Selection Based on Multi-Type Fuzzy Information. Mathematics. 2020; 8(10):1703. https://doi.org/10.3390/math8101703
Chicago/Turabian StyleChen, Chen-Tung, and Wei-Zhan Hung. 2020. "A Two-Phase Model for Personnel Selection Based on Multi-Type Fuzzy Information" Mathematics 8, no. 10: 1703. https://doi.org/10.3390/math8101703