Article

Stochastic Comparisons and Dynamic Information of Random Lifetimes in a Replacement Model

by
Antonio Di Crescenzo
and
Patrizia Di Gironimo
*
Dipartimento di Matematica, Università degli Studi di Salerno, Via Giovanni Paolo II n. 132, 84084 Fisciano (SA), Italy
*
Author to whom correspondence should be addressed.
Mathematics 2018, 6(10), 204; https://doi.org/10.3390/math6100204
Submission received: 27 September 2018 / Revised: 9 October 2018 / Accepted: 14 October 2018 / Published: 16 October 2018
(This article belongs to the Special Issue Stochastic Processes with Applications)

Abstract

:
We consider a suitable replacement model for random lifetimes, in which at a fixed time an item is replaced by another one having the same age but different lifetime distribution. We focus first on stochastic comparisons between the involved random lifetimes, in order to assess conditions leading to an improvement of the system. Attention is also given to the relative ratio of improvement, which is proposed as a suitable index finalized to measure the goodness of the replacement procedure. Finally, we provide various results on the dynamic differential entropy of the lifetime of the improved system.

1. Introduction

In reliability theory, various stochastic models have been proposed in the past in order to describe replacement policies of system components. A classical model in this area is the relevation transform, which describes the overall lifetime of a component which is replaced at its (random) failure time by another component of the same age, whose lifetime distribution is possibly different. See the paper by Krakowski [1] that introduced this topic, and the further contributions by Baxter [2], Belzunce et al. [3], Chukova et al. [4], Shanthikumar and Baxter [5], Sordo and Psarrakos [6], for instance. A similar model, named reversed relevation transform, has been considered in Di Crescenzo and Toomaj [7] in order to describe the total lifetime of an item given that it is less than an independent random inspection time. Such transforms deserve a large interest since they can be employed in restoration models of failed units, or in the determination of optimal redundancy policy in coherent systems.
In both cases, the above models involve a random replacement (or inspection) time. In this paper, we aim to consider a different stochastic model dealing with replacement occurring at deterministic arbitrary instants. Specifically, we assume that an item having random lifetime X is planned to be replaced at time t by another item having the same age but possibly different random lifetime Y. The main aim is to investigate the effect of the replacement, with emphasis on criteria leading to attain better performance for the overall system.
The tools adopted in our investigation are based on stochastic orders and other typical notions of reliability theory. Specifically, we study the consequence of suitable assumptions by which the initial lifetime X is smaller than the lifetime Y of the replacing item according to some stochastic criteria. We also propose a suitable index finalized to assess the effective improvement gained by the system due to the replacement. In addition, we aim to propose the residual differential entropy as a dynamic measure of the information content of the replacement model.
This is the plan of the paper: in Section 2, we introduce the stochastic model and the main quantities of interest. Section 3 is devoted to establish some stochastic comparisons concerning the proposed model. We also deal with the case when the relevant random variables belong to the same scale family of distributions. In Section 4, we introduce the relative ratio of improvement for the considered model, and investigate its behavior in some examples. Section 5 is centered on results on two dynamic versions of the differential entropy for the proposed model, with reference to the residual and past entropy. Finally, some concluding remarks are given in Section 6.
Throughout the paper, as usual, we denote by [ X | B ] a random variable having the same distribution of X conditional on B. The expectation of X is denoted by E [ X ] . Moreover, 1 A is the indicator function of A, i.e., 1 A = 1 if A is true, and 1 A = 0 , otherwise. Furthermore, a = sgn b means that a and b have the same sign, and = d means equality in distribution.

2. The Stochastic Model

Let X be an absolutely continuous nonnegative random variable with cumulative distribution function (CDF) F ( t ) = P ( X t ) , probability density function (PDF) f ( t ) , and survival function F ¯ ( t ) = 1 F ( t ) . Bearing in mind possible applications to reliability theory and survival analysis, we assume that X describes the random lifetime of an item or a living organism. Let us now recall two functions of interest; as usual, we denote by
λ X ( t ) = d d t log F ¯ ( t ) = f ( t ) F ¯ ( t ) , t R + , F ¯ ( t ) > 0
the hazard rate (or failure rate) of X, and by
τ X ( t ) = d d t log F ( t ) = f ( t ) F ( t ) , t R + , F ( t ) > 0
the reversed hazard rate function of X. See Barlow and Proschan [8] and Block et al. [9] for some illustrative results on these notions. Denote by Y another absolutely continuous nonnegative random variable with CDF G ( t ) , PDF g ( t ) , survival function G ¯ ( t ) , hazard rate λ Y ( t ) and reversed hazard rate τ Y ( t ) .
We assume that X and Y are independent lifetimes of systems or items, both starting to work at time 0. A replacement of the first item by the second one (having the same age) is planned to occur at time t, provided that the first item is not failed before. Let us now define I t = 1 { 0 X t } , so that I t is a Bernoulli random variable with parameter P ( I t = 1 ) = F ( t ) . Hence, denoting by X t Y the random duration of the (eventually replaced) system, it can be expressed as follows:
X t Y = [ X | X t ] I t + [ Y | Y > t ] ( 1 I t ) = [ X | X t ] if 0 X t [ Y | Y > t ] if X > t ( t R + ) .
In classical minimal repair models, an item, upon failure, is replaced by another item having the same failure distribution, and the same age of the previous item at the failure time. The present model also presumes that the item is replaced by another one having the same age at the failure time. The difference is that the replacement occurs at a preassigned deterministic time t, and that the new item possesses a possibly different failure distribution.
By (3), for any Borel set B, the following mixture holds:
P ( X t Y B ) = P ( X B | X t ) F ( t ) + P ( Y B | Y > t ) F ¯ ( t ) , t R + .
Then, the CDF and the PDF of X t Y are respectively
F t Y ( x ) = P ( X t Y x ) = F ( x ) , if 0 x t , F ( t ) + F ¯ ( t ) G ¯ ( t ) [ G ( x ) G ( t ) ] , if x > t ,
and
f t Y ( x ) = d d x F t Y ( x ) = f ( x ) , if 0 x t F ¯ ( t ) G ¯ ( t ) g ( x ) , if x > t ,
so that the survival function of X t Y can be expressed as
F ¯ t Y ( x ) = F ¯ ( x ) , if 0 x t , F ¯ ( t ) + F ¯ ( t ) G ¯ ( t ) [ G ¯ ( x ) G ¯ ( t ) ] , if x > t .
For instance, the special case when Y is uniformly distributed on [ 0 , 1 ] is treated in Example 4.18 of Santacroce et al. [10] concerning the analysis of some exponential models.
It should be pointed out that the replacement model given in (3) can be easily extended to integer-valued random variables. In this case, the model when Y is uniformly distributed on a set of integers is of interest in information theory (see, for instance, the operator considered in Equation (3) of Cicalese et al. [11]).
A relevant issue about model (3) is the following: to assess if the replacement planned at time t is beneficial to the system. This can be attained in several ways. As a first step, hereafter, we face the problem of establishing if the duration of the replaced system is larger than that of the originating lifetime (or smaller than that of the replaced lifetime) in some stochastic sense. To this aim, in the following section, we provide various useful comparisons based on stochastic orders.

3. Stochastic Comparisons

3.1. Definitions and Main Comparisons

In order to compare X and Y with X t Y , let us now recall some well-known definitions of partial stochastic orders, which involve the notions treated in Section 2. As a reference, see Shaked and Shanthikumar [12] or Belzunce et al. [13].
Definition 1.
Let X be an absolutely continuous random variable with support ( l X , u X ) , CDF F, and PDF f. Similarly, let Y be an absolutely continuous random variable with support ( l Y , u Y ) , CDF G, and PDF g. We say that X is smaller than Y in the
(a) 
usual stochastic order ( X st Y ) if F ¯ ( t ) G ¯ ( t ) t R or, equivalently, if F ( t ) G ( t ) t R ;
(b) 
hazard rate order ( X hr Y ) if G ¯ ( t ) / F ¯ ( t ) increases in t ( , max ( u X , u Y ) ) or, equivalently, if λ X ( t ) λ Y ( t ) for all t R , where λ X ( t ) = f ( t ) / F ¯ ( t ) and λ Y ( t ) = g ( t ) / G ¯ ( t ) are respectively the hazard rates of X and Y, or equivalently if f ( x ) G ¯ ( y ) g ( x ) F ¯ ( y ) x y ;
(c) 
likelihood ratio order ( X lr Y ) if f ( x ) g ( y ) f ( y ) g ( x ) for all x y , with x , y ( l X , u X ) ( l Y , u Y ) or, equivalently, g ( t ) / f ( t ) increases in t over the union of supports of X and Y;
(d) 
reversed hazard rate order ( X rh Y ) if G ( t ) / F ( t ) increases in t ( min ( l X , l Y ) , + ) or, equivalently, if τ X ( t ) τ Y ( t ) for all t R , where τ X ( t ) = f ( t ) / F ( t ) and τ Y ( t ) = g ( t ) / G ( t ) are respectively the reversed hazard rates of X and Y.
We recall the following relations among the above-mentioned stochastic orders:
X lr Y X hr Y X st Y , X lr Y X rh Y X st Y .
With reference to (3), we now investigate the effect of the replacement when the lifetime of the first item is stochastically smaller than the second in the sense of the criteria given in Definition 1.
Theorem 1.
Let X and Y be absolutely continuous nonnegative random variables. Then,
(i) 
X hr Y X hr X t Y hr Y t > 0 ;
(ii) 
X lr Y X t Y lr Y t > 0 ;
(iii) 
X rh Y X t Y rh Y t > 0 ;
(iv) 
X st Y X t Y st Y t > 0 .
Proof. 
From (6) and (7), the hazard rate of X t Y is given by
λ t Y ( x ) = f t Y ( x ) F ¯ t Y ( x ) = λ X ( x ) , if 0 x t , λ Y ( x ) , if x > t .
We observe that, if X hr Y , from (9), we immediately deduce λ X ( x ) λ t Y ( x ) λ Y ( x ) for all x 0 , and so we obtain X hr X t Y hr Y t > 0 .
Now, by taking into account Equation (6), we get
g ( x ) f t Y ( x ) = g ( x ) f ( x ) , if 0 x t , G ¯ ( t ) F ¯ ( t ) , if x > t .
Hence, since assumption X lr Y implies that g ( x ) / f ( x ) is increasing in x > 0 , and that g ( t ) f ( t ) G ¯ ( t ) F ¯ ( t ) for all t > 0 by the first of (8), we finally obtain X t Y lr Y , this completing the proof of (ii).
Note that
F t Y ( x ) G ( x ) = F ( x ) G ( x ) , if 0 x t , F ( t ) G ( x ) + F ¯ ( t ) G ¯ ( t ) [ G ( x ) G ( t ) ] G ( x ) , if x > t .
Hence, for 0 x t , we have that F t Y ( x ) / G ( x ) is decreasing in x if and only if X rh Y . Moreover F t Y ( x ) / G ( x ) is continuous in x = t . Finally, it is not hard to see that the derivative of F t Y ( x ) / G ( x ) is nonpositive if G ( t ) F ( t ) for all t 0 , i.e., X st Y , this being ensured by assumption X rh Y . The proof of (iii) is thus completed.
The proof of (iv) can be easily checked from (5), by seeing that F t Y ( x ) G ( x ) for all x 0 and t 0 , if and only if assumption X st Y holds. ☐
Differently from case (i) of Theorem 1, condition X lr Y does not imply that X lr X t Y t > 0 . This can be easily checked, for instance, when X and Y are exponentially distributed with rates λ X and λ Y , with λ X > λ Y . In this case, one has X lr Y , whereas, recalling (6), the ratio f t Y ( x ) / f ( x ) is not increasing for all x > 0 , and thus X lr X t Y is not true. A similar conclusion holds for the cases (ii) and (iii). Indeed, in the following counterexample, we see that
X st Y ¬ X st X t Y t > 0 ,
X rh Y ¬ X rh X t Y t > 0 .
Counterexample 1.
Let X be exponentially distributed with parameter 1, and let Y = max { X , Z } , where Z is Erlang distributed with parameters ( 2 , 2 ) and is independent from X. Hence, since F ( x ) = 1 e x , x 0 , and G ( x ) = F ( x ) H ( x ) , with H ( x ) = 1 ( 1 + 2 x ) e 2 x , x 0 , we immediately have that X rh Y , and thus X st Y . However, recalling (5), it is not hard to see that F t Y ( x ) / F ( x ) is not monotonic and is not smaller than one for suitable choices of t, as shown in Figure 1. Hence, both the conditions X s t X t Y t > 0 and X rh X t Y t > 0 are not true.
Let us now prove another result concerning stochastic orderings similar to those of Theorem 1.
Theorem 2.
Let X, Y be random lifetimes. If X st X t Y t > 0 , then X hr Y .
Proof. 
From assumption X st X t Y t > 0 , we have
F ( x ) F ( t ) + F ¯ ( t ) G ¯ ( t ) [ G ( x ) G ( t ) ] , x > t > 0 ,
so that
F ( x ) F ( t ) x t 1 F ¯ ( t ) G ( x ) G ( t ) x t 1 G ¯ ( t ) .
In the limit as x t , we have f ( t ) F ¯ ( t ) g ( t ) G ¯ ( t ) for all t > 0 , thus X hr Y . ☐

3.2. Scale Family of Distributions

Engineers in the manufacturing industries have used accelerated test experiments for many decades (see Arnold et al. [14], Escobar and Meeker [15], for instance). Various models for accelerated test involve time-transformations of suitable functions. The simplest case is based on linear transformations and on distribution functions. Then, let us now adapt the model (3) to the instance in which the distributions of X and Y belong to the same scale family.
Given the random lifetimes X and Y, having distribution functions F ( x ) and G ( x ) respectively, we assume that X and Y belong to the same scale family of distributions, i.e.,
G ( x ) = F ( α x ) x R , 0 < α < 1 .
Hence, for 0 < α < 1 , one has X st Y . We recall that the quantile function of X is given by
Q X ( u ) = inf { x R | F ( x ) u } , 0 < u < 1 .
Assumption (10) means that X and Y satisfy the proportional quantile functions model (see Section 4.1 of Di Crescenzo et al. [16]) expressed by Q X ( u ) = α Q Y ( u ) u ( 0 , 1 ) , where Q Y ( u ) is similarly defined as Q X ( u ) . From (5), under the assumption (10) the distribution function of X t Y is
F t Y ( x ) = F ( x ) , if 0 x t , F ( t ) + F ¯ ( t ) F ¯ ( α t ) [ F ( α x ) F ( α t ) ] , if x > t .
Among the quantities of interest in reliability theory, wide attention is devoted to the residual lifetime of a given random lifetime X, defined as
X t : = [ X t | X > t ] , t 0 .
The residual lifetime defined in (11) is involved in the following well-known notion of positive ageing.
Definition 2.
We say that X is IFR (increasing failure rate) if X t st X s for all t s 0 , that is, if F ¯ ( x ) is logconcave, or equivalently the failure rate λ X ( t ) is increasing in t 0 .
Remark 1.
If X and Y satisfy condition (10) and if X is IFR, then, for 0 < α < 1 ,
λ Y ( t ) = α λ X ( α t ) < λ X ( α t ) λ X ( t ) , t 0 ,
so that X hr Y , and hence X hr X t Y hr Y due to point (i) of Theorem 1.

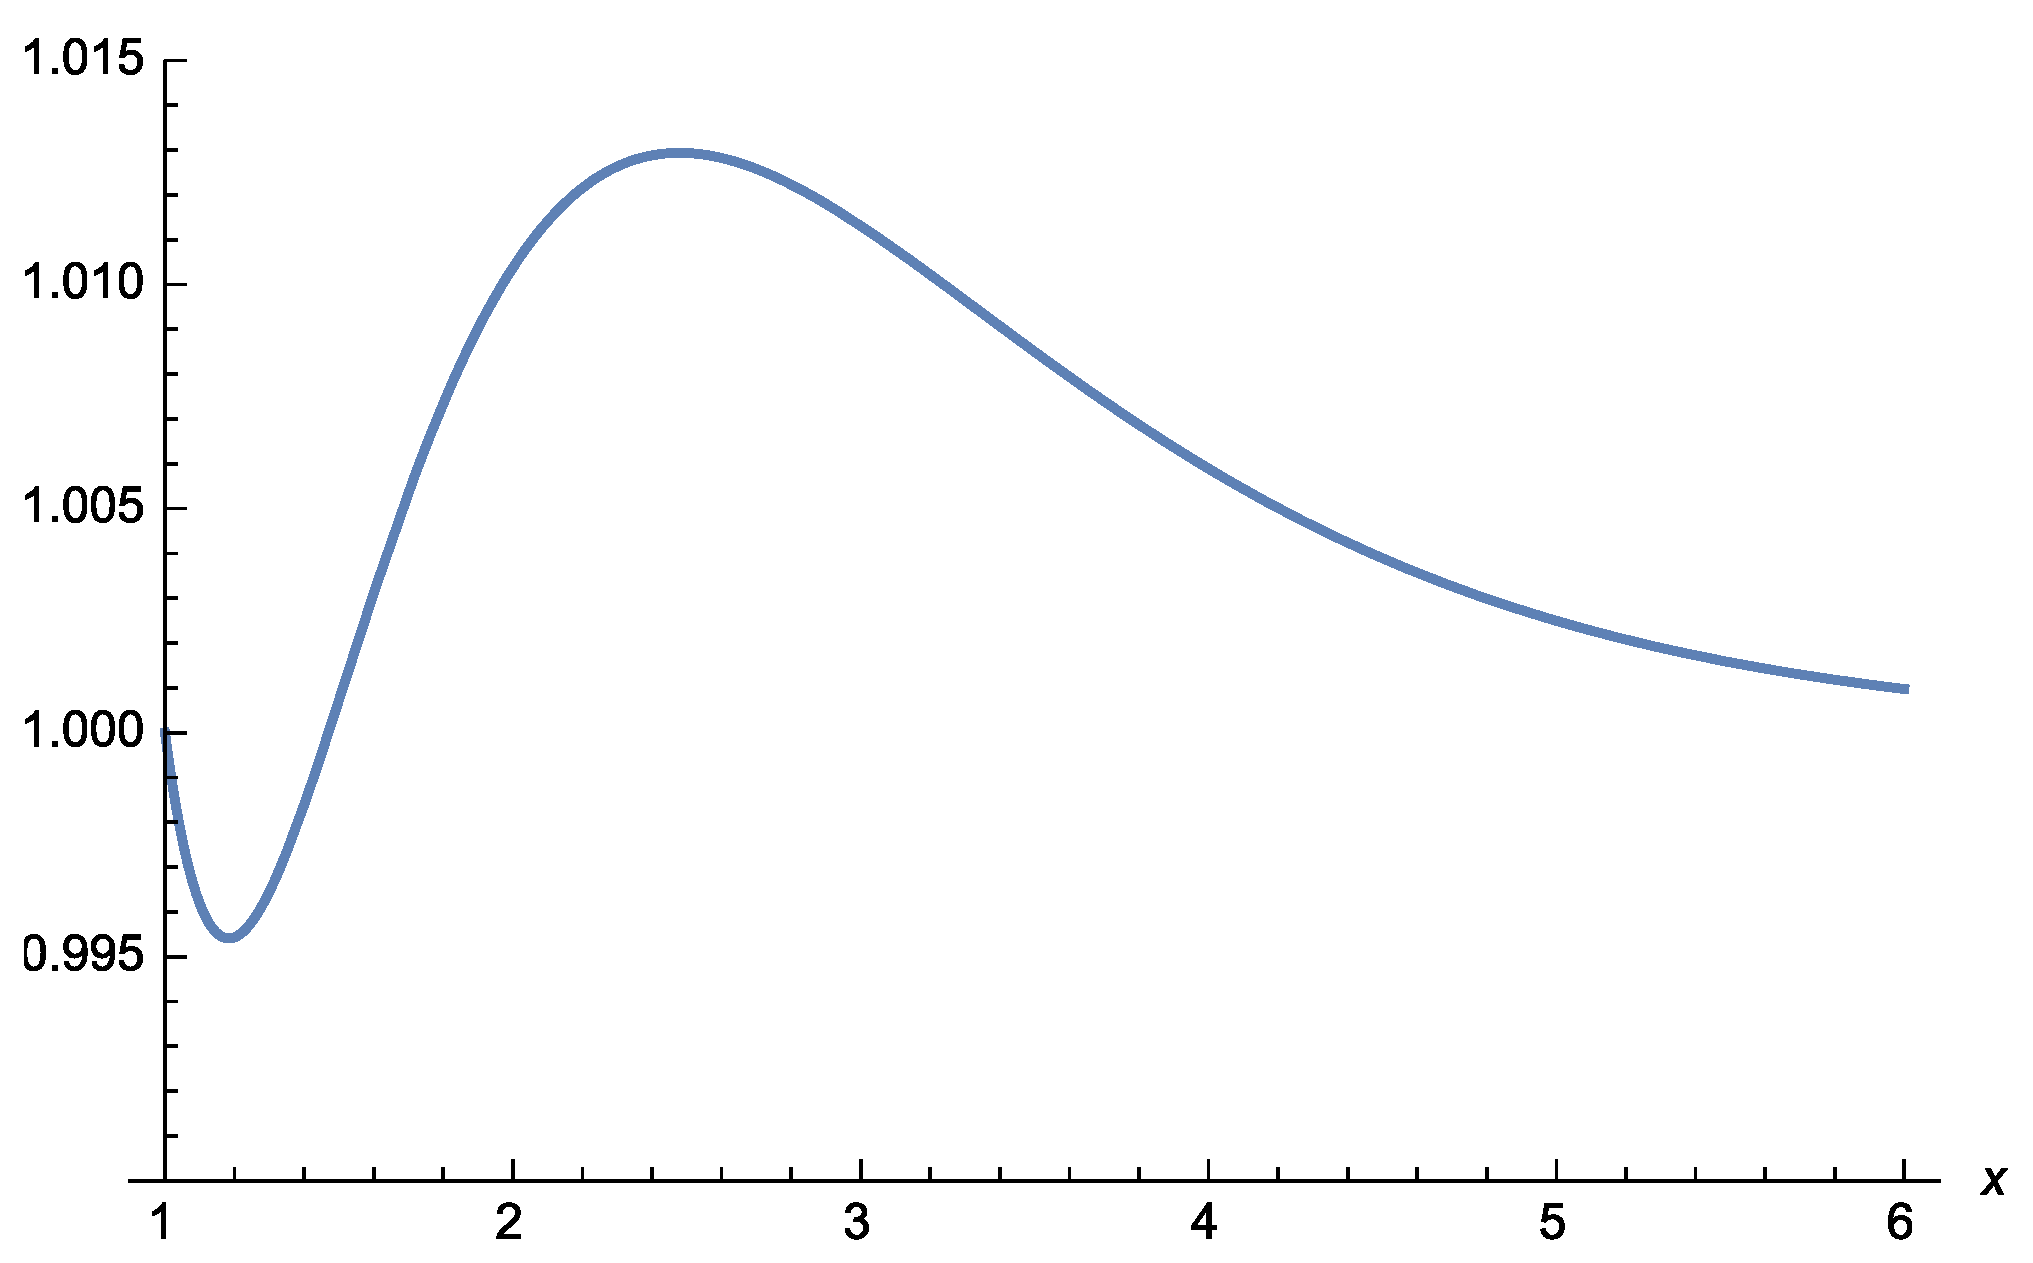
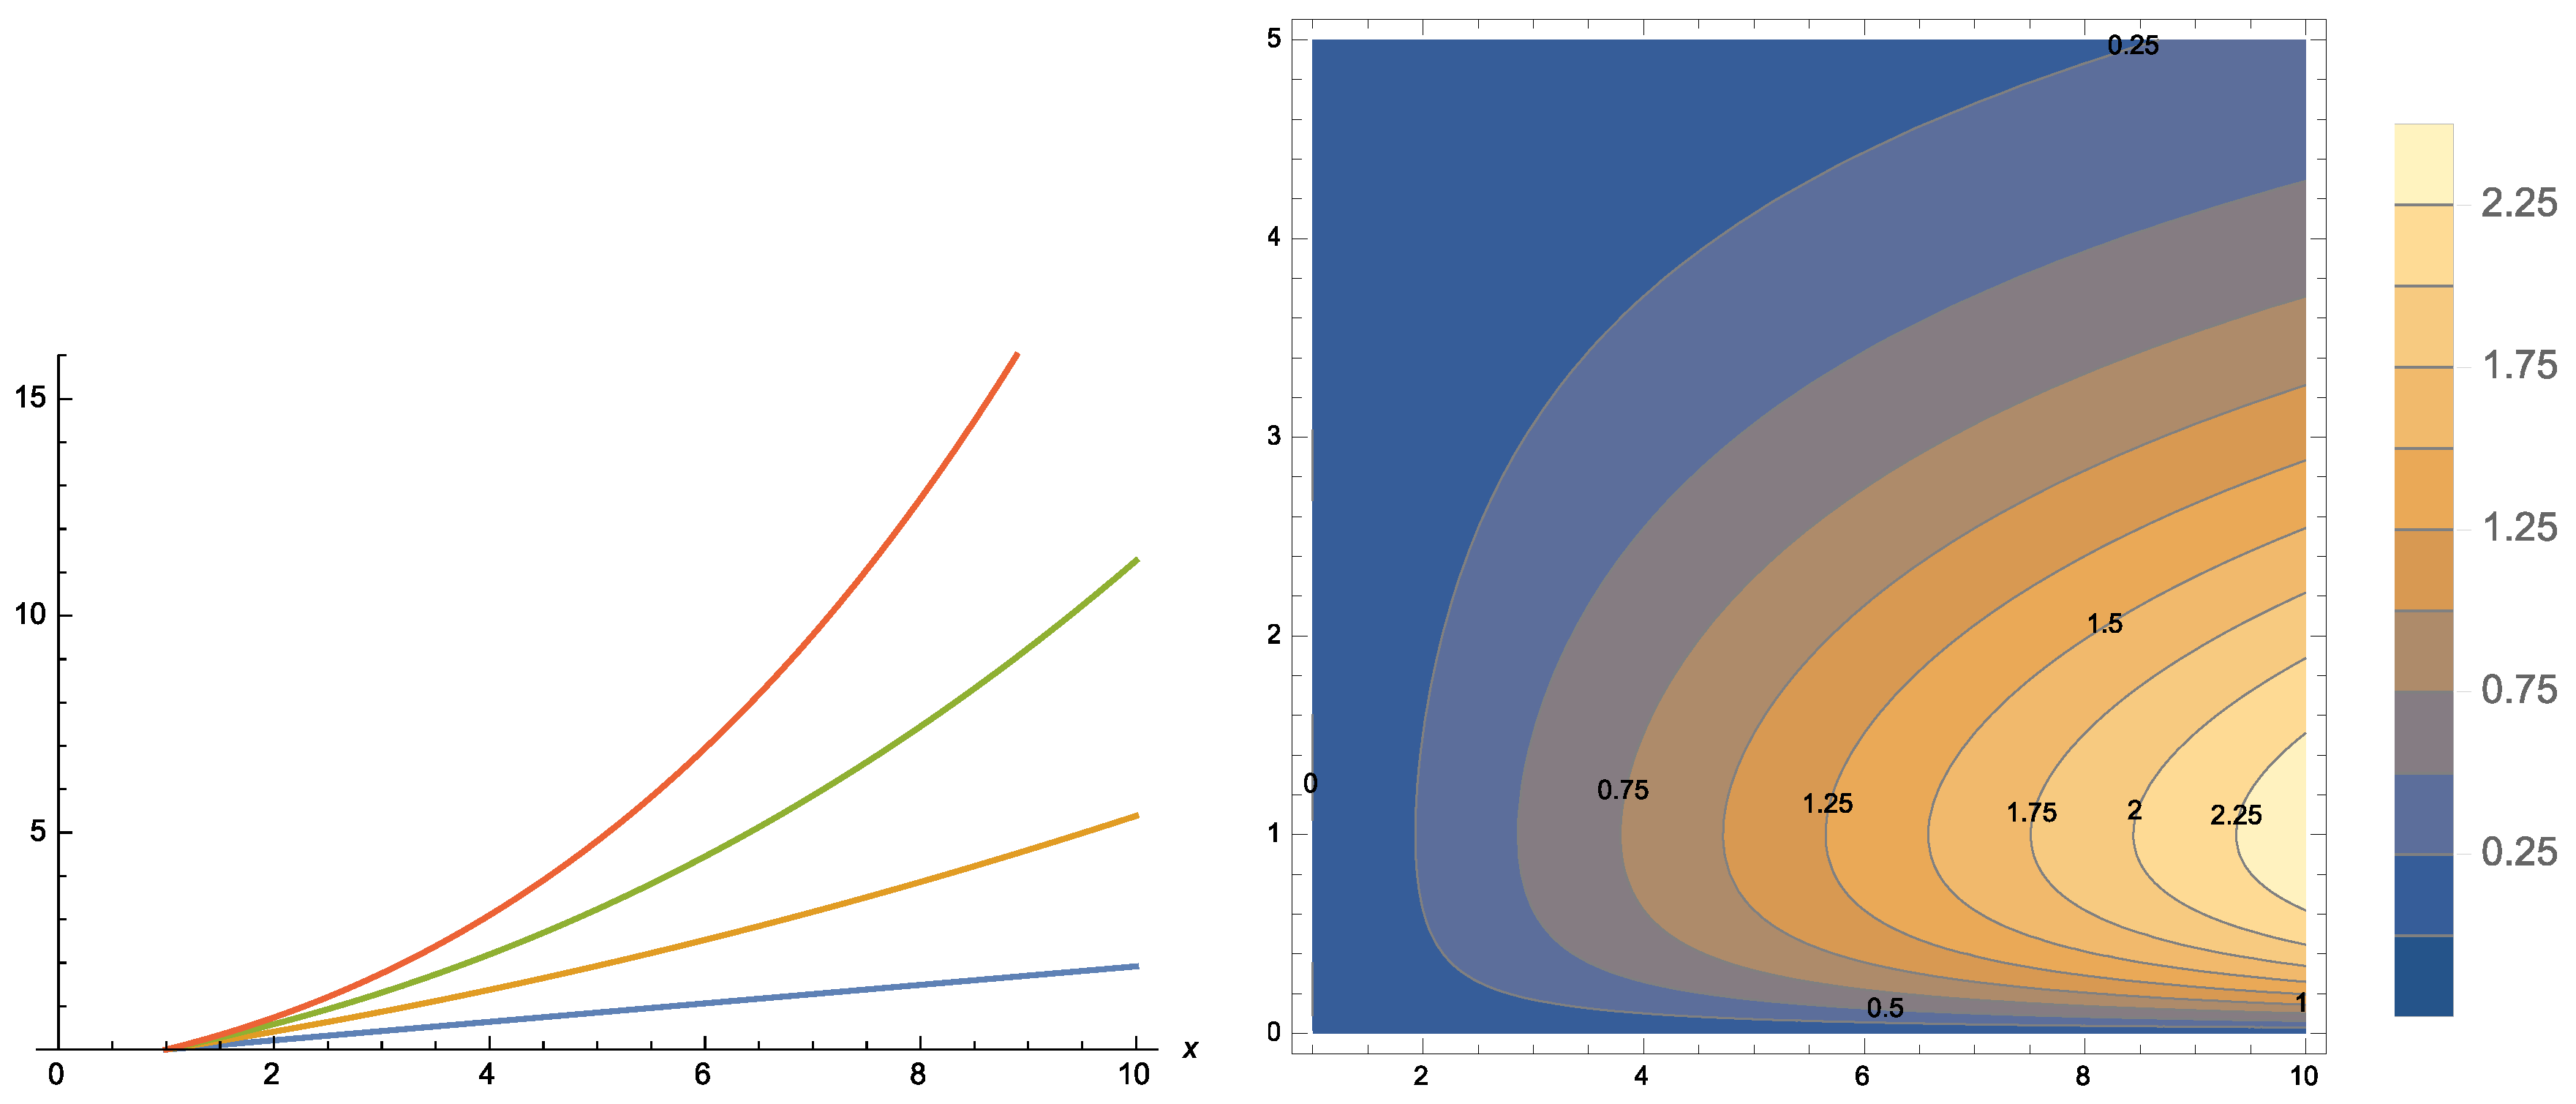
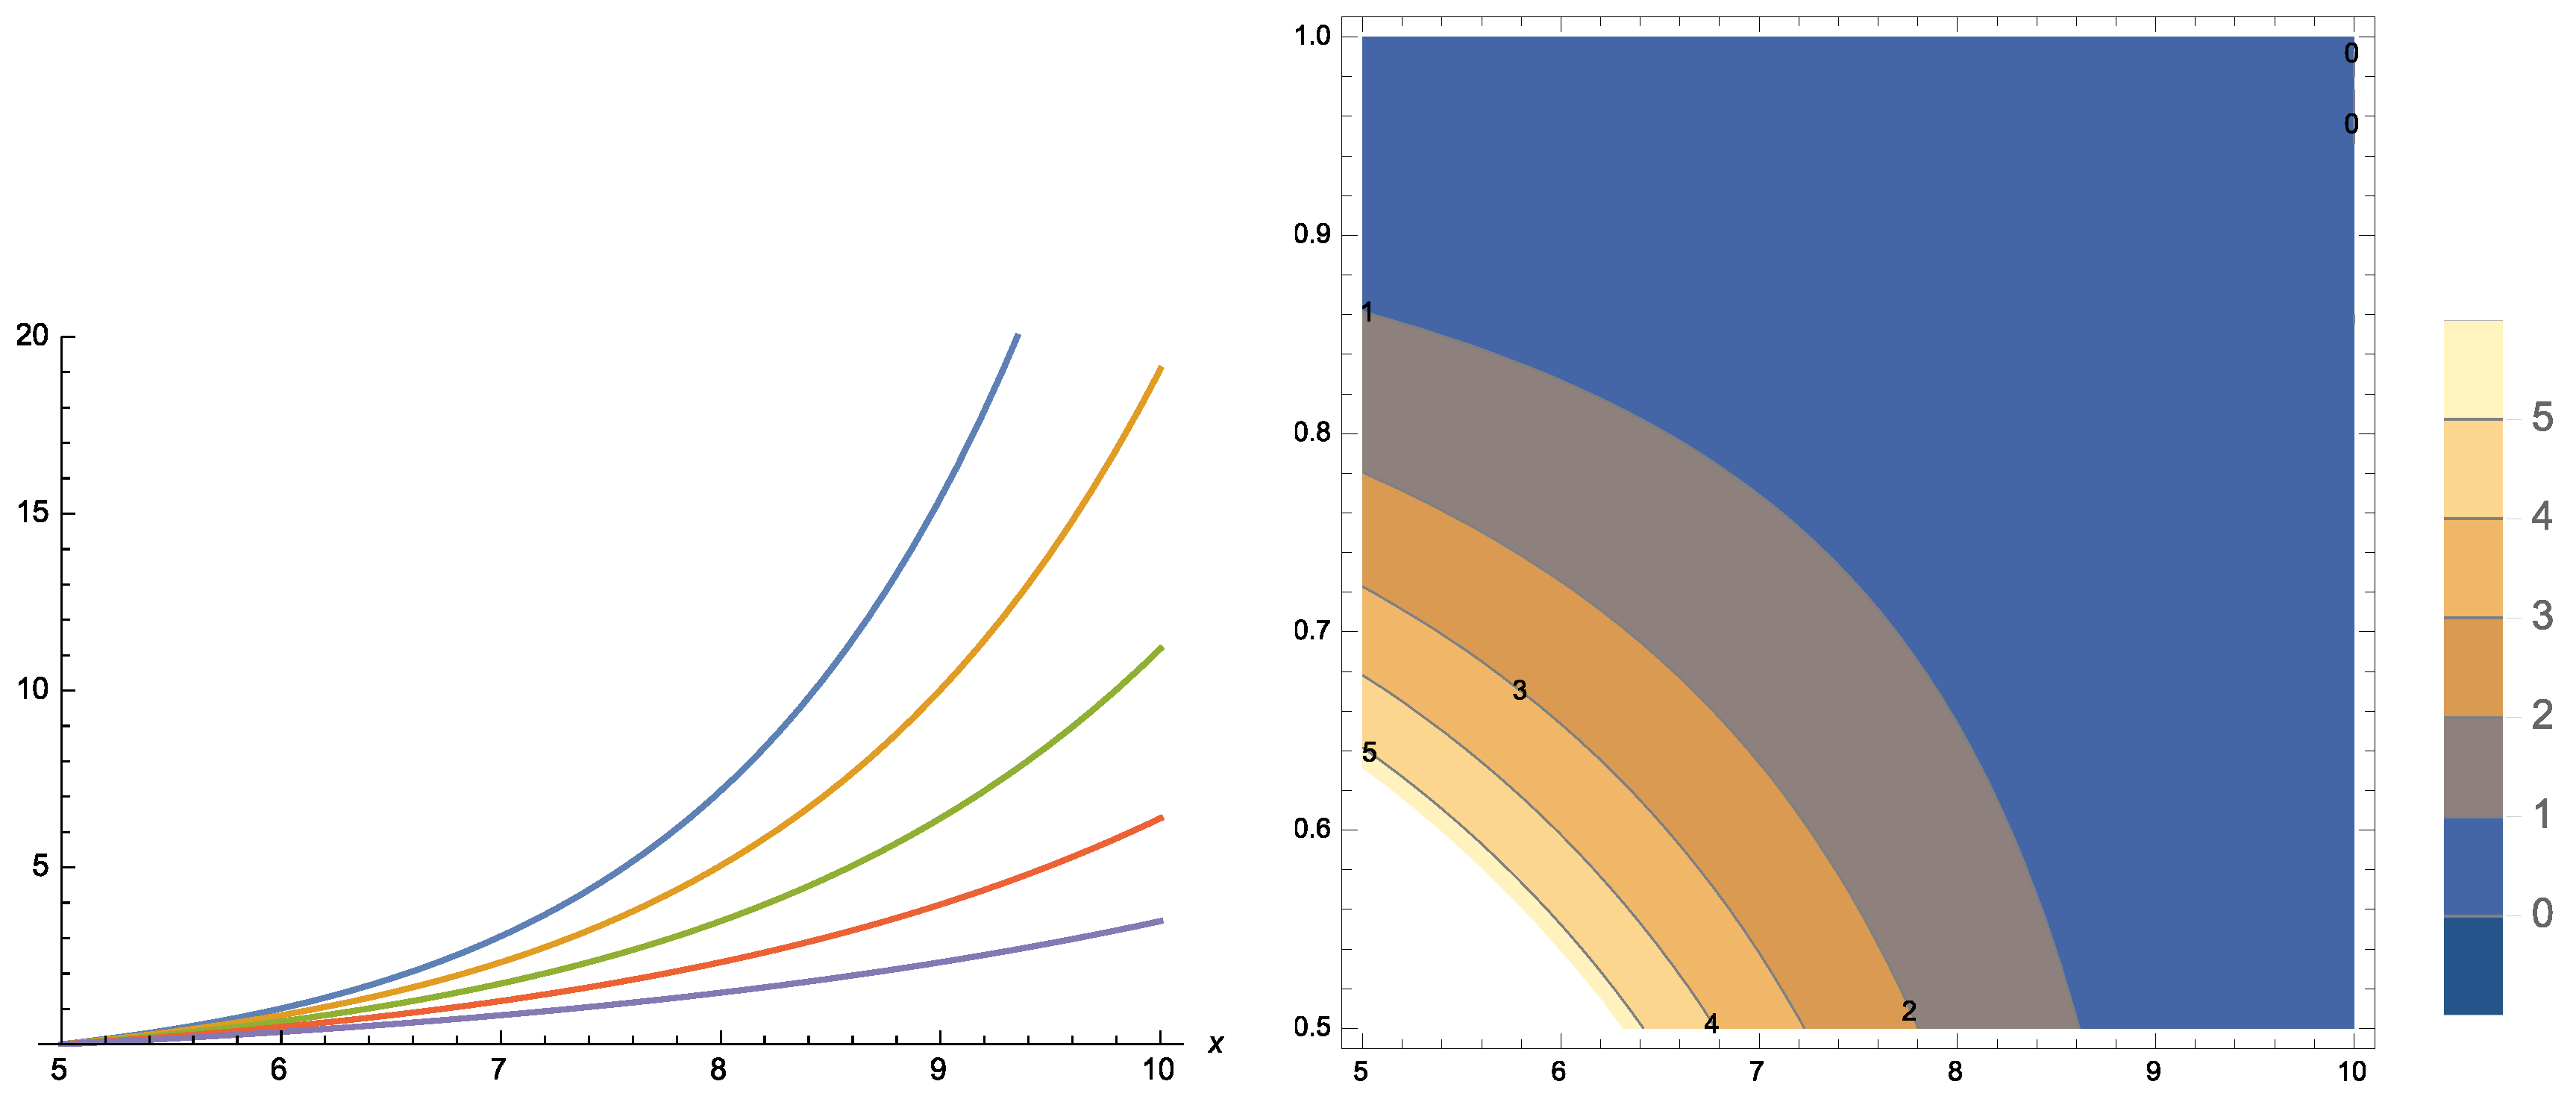
3.3. Further Results

From (7), the expected value of X t Y can be expressed as
E [ X t Y ] = 0 t F ¯ ( x ) d x + t F ¯ ( t ) + F ¯ ( t ) G ¯ ( t ) [ G ¯ ( x ) G ¯ ( t ) ] d x = E [ X ] + 1 G ¯ ( t ) t [ F ¯ ( t ) G ¯ ( x ) F ¯ ( x ) G ¯ ( t ) ] d x .
Hence, recalling that the mean residual life of the random lifetime X is
m X ( t ) = E [ X t | X > t ] = 1 F ¯ ( t ) t F ¯ ( x ) d x , t R + , F ¯ ( t ) > 0 ,
with m Y ( t ) similarly defined, we have
E [ X t Y ] = E [ X ] + F ¯ ( t ) [ m Y ( t ) m X ( t ) ] .
Let us now recall the mean residual life order (see Section 2.A of Shaked and Shanthikumar [12]).
Definition 3.
Let X and Y be absolutely continuous random variables with CDFs F ( t ) and G ( t ) , and with finite mean residual lives m X ( t ) and m Y ( t ) , respectively. We say that X is smaller than Y in the mean residual life order ( X mrl Y ) if m X ( t ) m Y ( t ) for all t or, equivalently, if
t G ¯ ( x ) d x t F ¯ ( x ) d x is decreasing over { t : t F ¯ ( x ) d x > 0 } .
Consequently, recalling (12), we immediately have the forthcoming result.
Proposition 1.
The relation E [ X ] E [ X t Y ] holds for all t if and only if X mrl Y .
We can now come to a probabilistic analogue of the mean value theorem.
Theorem 3.
Let X and Y be non-negative random variables satisfying X h r Y and E [ X ] < E [ X t Y ] < and let Z t = Ψ ( X , Y ) . Let g be a measurable and differentiable function such that E [ g ( X ) ] and E [ g ( Y ) ] are finite, and let its derivative g be measurable and Riemann-integrable on the interval [ x , y ] for all y x 0 . Then, E [ g ( Z ) ] is finite and
E [ g ( X t Y ) ] E [ g ( X ) ] = E [ g ( Z t ) ] { E [ X t Y ] E [ X ] } ,
where Z t is the absolutely continuous random variable having PDF
f Z t ( x ) = F ¯ t Y ( x ) F ¯ ( x ) E [ X t Y ] E [ X ] = 1 m Y ( t ) m X ( t ) G ¯ ( x ) G ¯ ( t ) F ¯ ( x ) F ¯ ( t ) , x t .
Proof. 
The proof follows from the Theorem 4.1 of Di Crescenzo [17]. ☐
It is interesting to point out that the relation (13) can be used in various applied contexts. For instance, if g is an utility function, then E [ g ( X ) ] can be viewed as the expected utility granted by an item having lifetime X. Accordingly, Equation (13) expresses the variation of the expected utility when such an item is subject to the replacement procedure described in Section 2. Clearly, it can be used to construct useful measures able to evaluate the goodness of the procedure. This specific task is not undertaken here, whereas in the following section we propose a different approach to assess the effectiveness of the replacement.

4. Relative Ratio of Improvement

Consider a system having random lifetime X, which is replaced by Y at time t. If X is smaller than Y according to some stochastic order, we expect that the reliability of the system at time x > t > 0 is improved. In order to measure the usefulness of replacing the lifetime X with Y at time t, let us now introduce the relative ratio of improvement evaluated at x > t > 0 . It is defined in terms of (7) as
R t ( x ) : = F ¯ t Y ( x ) F ¯ ( x ) F ¯ ( x ) = F ¯ ( t ) F ¯ ( x ) 1 + F ¯ ( t ) G ¯ ( t ) G ¯ ( x ) F ¯ ( x ) G ¯ ( t ) F ¯ ( x ) .
Clearly, if X hr Y , then, from point (i) of Theorem 1, it follows that X hr X t Y and, in turn, X st X t Y so that R t ( x ) 0 for all x > t > 0 .
Example 1.
Let { Z ( t ) , t 0 } be an iterated Poisson process with parameters ( μ , λ ) . In other terms, such process can be expressed as Z ( t ) = M [ N ( t ) ] , where M ( t ) and N ( t ) are independent Poisson processes with parameters μ , λ R + , respectively (see Section 6 of Di Crescenzo et al. [18]). Denoting by
T k = inf { t > 0 : Z ( t ) k }
the first crossing time (from below) of Z ( t ) through the constant level k N , the corresponding survival function is (cf. Section 7 of [18])
P [ T k > t ] = exp { λ ( 1 e μ ) t } j = 0 k 1 μ j j ! B j ( λ e μ t ) , t 0 ,
where B j ( · ) is the j-th Bell polynomial. We consider a system subject to replacement policy as described in (3), where the relevant random lifetimes are given by the first-crossing times defined in (15), with X = d T 1 and Y = d T k . The relative ratio of improvement of this system is then evaluated by means of (14). Figure 2 provides some plots of R t ( x ) , showing that the relative ratio of improvement is increasing in x and k.
In the remaining part of this section, we restrict our attention to the special case in which X and Y satisfy the proportional hazard rates model (see Cox [19] or, for instance, the more recent contributions by Nanda and Das [20], and Ng et al. [21]). Hence, assuming that G ¯ ( t ) = [ F ¯ ( t ) ] θ , t 0 , for θ > 0 , θ 1 , the relative ratio defined in (14) becomes
R t ( x ) = F ¯ ( t ) F ¯ ( x ) 1 + [ F ¯ ( t ) ] 1 θ [ F ¯ ( x ) ] θ 1 [ F ¯ ( t ) ] θ F ¯ ( x ) , x > t > 0 .
Here, the most interesting case is for 0 < θ < 1 , since this assumption ensures that X hr Y .
Example 2.
Let X and Y be exponentially distributed with parameters 1 and θ , respectively, with 0 < θ < 1 . Since F ¯ ( t ) = e t , G ¯ ( t ) = e θ t , t 0 , from (17), we have
R t ( x ) = e ( t x ) ( 1 θ ) 1 , x > t > 0 .
Some plots of R t ( x ) are given in Figure 3, confirming that the relative ratio of improvement is increasing in x t > 0 , and is decreasing in θ ( 0 , 1 ) .

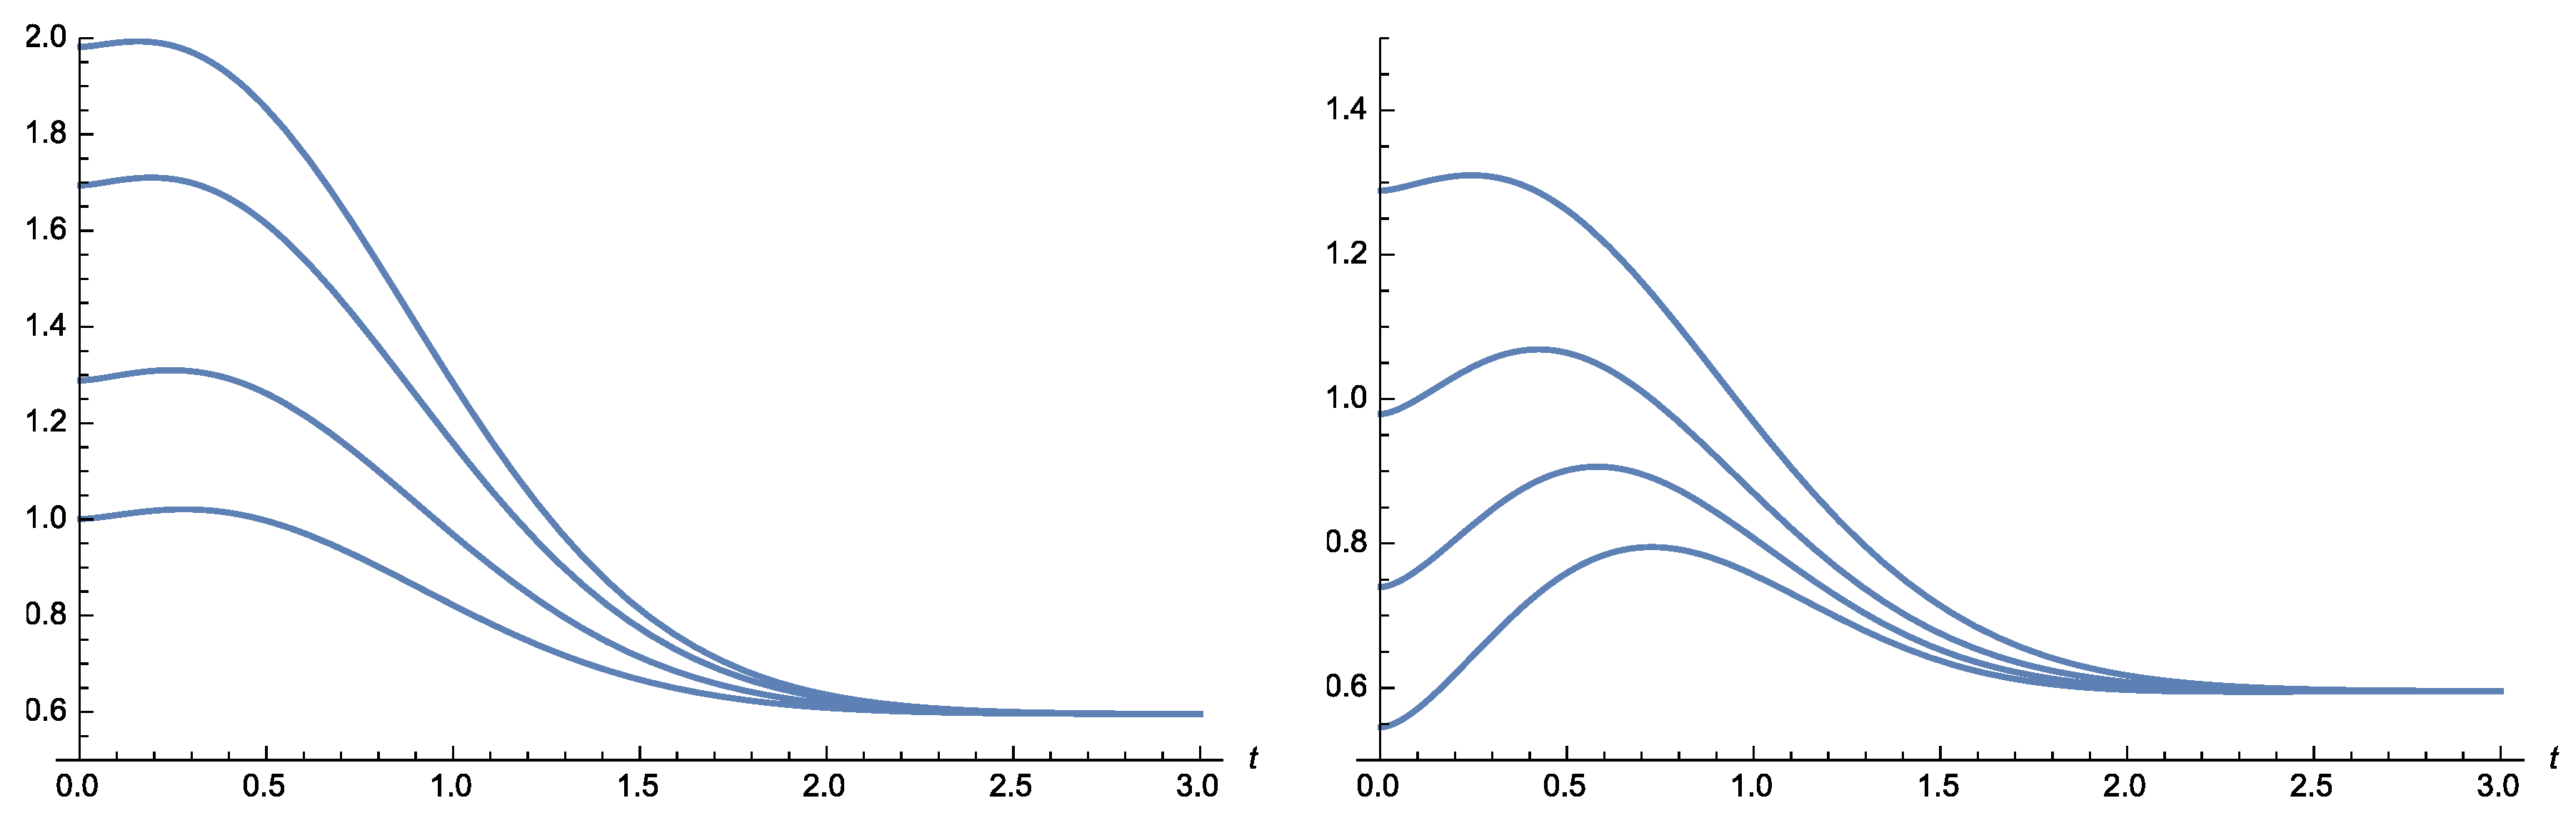
5. Results on Dynamic Differential Entropies

In this section, we investigate some informational properties of the replacement model considered in Section 2.
A classical measure of uncertainty for an absolutely continuous random variable X is the differential entropy, defined as
H X = R f ( x ) log f ( x ) d x ,
with 0 log 0 = 0 by convention. This measure has some analogies with the entropy of discrete random variables, even though the differential entropy lacks a number of properties that the Shannon discrete entropy possesses (see, for instance, Cover and Thomas [22] for details).
In the context of lifetimes truncated over intervals of the form [ 0 , t ] or ( t , ) , specific forms of the differential entropy have been investigated in the recent decades (see the initial contributions by Muliere et al. [23]). Specifically, the following dynamic measure (named residual entropy of the lifetime X) has been extensively investigated:
H X ( t ) = t f ( x ) F ¯ ( t ) log f ( x ) F ¯ ( t ) d x , t R + , F ¯ ( t ) > 0 .
This quantity is suitable for measuring the uncertainty in residual lifetimes defined as in (11). The residual entropy of X has been studied by Ebrahimi [24], Ebrahimi and Pellerey [25]; see also Asadi and Ebrahimi [26], Ebrahimi et al. [27] on this topic. A similar reasoning leads to the past entropy of X, defined as the differential entropy of the past lifetime [ X | X t ] , t > 0 , i.e.,
H ¯ X ( t ) = 0 t f ( x ) F ( t ) log f ( x ) F ( t ) d x , t R + , F ( t ) > 0 .
This measure is also named ‘past entropy’ of X; it has been investigated in Di Crescenzo and Longobardi [28], Nanda and Paul [29], Kundu et al. [30]. Other results and applications of these dynamic information measures can be found in Sachlas and Papaioannou [31], Kundu and Nanda [32], and Ahmadi et al. [33].
Hereafter, we denote by
H ( t ) = F ( t ) log F ( t ) F ¯ ( t ) log F ¯ ( t ) , t > 0
the partition entropy of X at time t (see Bowden [34]), which measures the information (in the sense of Shannon entropy) about the value of the random lifetime X derived from knowing whether X t or X > t .
Under the conditions specified in Section 2, let us now provide a decomposition result for the differential entropy of (3).
Proposition 2.
For all t > 0 , we have
H X t Y = H ( t ) + F ( t ) H ¯ X ( t ) + F ¯ ( t ) H Y ( t ) .
Proof. 
From (6) and (18), we have that, for t > 0 ,
H X t Y = 0 f t Y ( x ) log f t Y ( x ) d x = 0 t f ( x ) log f ( x ) d x t F ¯ ( t ) G ¯ ( t ) g ( x ) log F ¯ ( t ) G ¯ ( t ) g ( x ) d x .
Recalling the alternative expression of the residual entropy (19) given in (2.2) of [24], and the alternative expression of the past entropy (20) shown in (2.1) of [28], we have
0 t f ( x ) log f ( x ) d x = F ( t ) [ H ¯ X ( t ) log F ( t ) ] ,
and
t g ( x ) log g ( x ) d x = G ¯ ( t ) [ H Y ( t ) log G ¯ ( t ) ] .
Hence, we obtain
H X t Y = F ( t ) [ H ¯ X ( t ) log F ( t ) ] + F ¯ ( t ) G ¯ ( t ) [ G ¯ ( t ) [ H Y ( t ) log G ¯ ( t ) ] G ¯ ( t ) log F ¯ ( t ) G ¯ ( t ) ] = F ( t ) log F ( t ) F ¯ ( t ) log F ¯ ( t ) + F ( t ) H ¯ X ( t ) + F ¯ ( t ) H Y ( t ) .
This completes the proof of (22), due to (21). ☐
We note that Equation (22) can be interpreted as follows. The uncertainty about the failure time of an item having lifetime X t Y can be decomposed into three parts: (i) the uncertainty on whether the item has failed before or after time t, (ii) the uncertainty about the failure time in ( 0 , t ) given that the item has failed before t, and (iii) the uncertainty about the failure time in ( t , + ) given that the item has failed after t, and thus the failure time is distributed as Y since the replacement occurred at time t.
Clearly, if X and Y are identically distributed, then Equation (22) becomes the identity given in Proposition 2.1 of [28], i.e.,
H X = H ( t ) + F ( t ) H ¯ X ( t ) + F ¯ ( t ) H X ( t ) , t > 0 .
The given results allow us to perform some comparisons involving the above entropies. To this aim, we recall a suitable stochastic order (see Definition 2.1 of Ebrahimi and Pellerey [25]):
Definition 4.
Let X and Y be random lifetimes; X is said to have less uncertainty than Y, and write X LU Y , if
H X ( t ) H Y ( t ) for all t 0 .
From Proposition 2, we can now infer the following result.
Corollary 1.
If X and Y are random lifetimes such that X LU Y , then
H X H X t Y t > 0 .
Proof. 
By comparing Equations (22) and (23), we obtain
H X t Y H X = F ¯ ( t ) [ H Y ( t ) H X ( t ) ] , t > 0 .
Thus, from Definition 4, we obtain the proof immediately. ☐
Let us now investigate some sufficient conditions leading to the monotonicity of the differential entropy of (3). To this aim, we recall the following notion, which was first considered in [24].
Definition 5.
Assume that the residual entropy of the random lifetime X is finite. If H X ( t ) is decreasing (increasing) in t 0 , we say that X has decreasing (increasing) uncertainty of residual life, i.e., X is D U R L (IURL).
Proposition 3.
(i) 
Let X LU Y . If X is IURL and Y is DURL, then X t Y is DURL.
(ii) 
Let Y LU X . If X is DURL and Y is IURL, then X t Y is IURL.
(iii) 
If λ X ( t ) e λ Y ( t ) for all t 0 , and H Y ( t ) 0 for all t 0 , then X t Y is IURL.
Proof. 
(i)
Under the given assumptions, we have that the right-hand-side of (24) is nonnegative and decreasing, so that H X t Y is decreasing.
(ii)
Differentiating both sides of (24), we obtain:
d d t H X t Y = F ¯ ( t ) λ Y ( t ) [ H Y ( t ) 1 + log λ Y ( t ) ] λ X ( t ) [ H Y ( t ) 1 + log λ X ( t ) ] .
From Theorem 3.2 of Ebrahimi [24], we deduce that, if Y is IURL, then H Y ( t ) 1 + log λ Y ( t ) 0 . Moreover, since Y LU X and X is DURL, we have H Y ( t ) 1 + log λ X ( t ) 0 . Hence, from (25), it follows that H X t Y is increasing.
(iii)
By expressing the derivative of H X t Y in an alternative form, we obtain
d d t H X t Y = F ¯ ( t ) [ λ Y ( t ) λ X ( t ) ] H Y ( t ) + λ Y ( t ) [ 1 + log λ Y ( t ) ] λ X ( t ) [ 1 + log λ X ( t ) ] .
Hence, thanks to the given hypothesis, the right-hand-side of the above identity is nonnegative.
 ☐
We remark that the assumption λ X ( t ) e λ Y ( t ) for all t 0 , considered in point (iii) of Proposition 3, implies that Y is larger than X in the ‘up hazard rate order’, i.e., Y hr X (see Theorem 6.21 of Lillo et al. [35]). This condition, in turn, implies that Y hr X .
Classical studies in reliability theory show that the random lifetimes of items or systems follow suitable Weibull distributions. As an illustrative instance, in the forthcoming example, we investigate the effect of replacement for Weibull distributed lifetimes in terms of dynamic differential entropy.
Example 3.
Assume that X and Y have Weibull distribution, with F ( t ) = 1 e ( t / λ ) k , t 0 , and G ( t ) = 1 e ( t / μ ) h , t 0 , with λ , k , μ , h > 0 . The differential entropy of the lifetime (3) can be obtained by means of (22). However, we omit its expression since it is quite cumbersome. Some plots of the dynamic differential entropy H X t Y are given in Figure 4, in order to show the effect of the replacement at time t. Specifically, for the considered parameters, we have that H X t Y grows when μ increases and h decreases. Moreover, H X t Y has a reversed bathtub shape, with a single maximum attained for positive values of t. Clearly, such maximum provides useful information in order to chose optimal values (in the differential entropy sense) of the replacement instant.

6. Conclusions

Certain typical replacement models in reliability theory involve minimal repair instances, in which—upon failure—an item is replaced by another one having the same reliability of the failed item at the failure instant. The model considered in this paper deals with a different scenario, in which the replacement is planned in advance, the replaced item possessing a different failure distribution and having the same age of the replaced item.
The investigation has been centered first on the stochastic comparison of the resulting random lifetimes. We have proposed measuring the goodness of the replacement criteria by means of the relative ratio of improvement. The information amount provided by the dynamic version of the system lifetime differential entropy has also been considered as a relevant tool in this respect.
Possible future developments of the given results can be finalized to the extension of the model to more specific instances in which the replacement instant is constrained by operational guidelines, which can be implemented through suitable weight functions.

Author Contributions

All of the authors contributed equally to this work.

Funding

This research received no external funding.

Acknowledgments

A.D.C. and P.D.G. are members of the groups GNCS and GNAMPA of INdAM (Istituto Nazionale di Alta Matematica), respectively.

Conflicts of Interest

The authors declare no conflict of interest.

References

  1. Krakowski, M. The relevation transform and a generalization of the gamma distribution function. Rev. Fr. Autom. Inform. Rech. Opér. 1973, 7, 107–120. [Google Scholar] [CrossRef] [Green Version]
  2. Baxter, L.A. Reliability applications of the relevation transform. J. Appl. Probab. 1982, 29, 323–329. [Google Scholar] [CrossRef]
  3. Belzunce, F.; Martínez-Riquelme, C.; Ruiz, J.M. Allocation of a relevation in redundancy problems. Appl. Stoch. Model Bus. Ind. 2081. online first. [Google Scholar] [CrossRef]
  4. Chukova, S.; Dimitrov, B.; Dion, J.P. On relevation transforms that characterize probability distributions. J. Appl. Math. Stoch. Anal. 1993, 6, 345–357. [Google Scholar] [CrossRef]
  5. Shanthikumar, J.G.; Baxter, L.A. Closure properties of the relevation transform. Nav. Res. Logist. Q. 1985, 32, 185–189. [Google Scholar] [CrossRef]
  6. Sordo, M.A.; Psarrakos, G. Stochastic comparisons of interfailure times under a relevation replacement policy. J. Appl. Probab. 2017, 54, 134–145. [Google Scholar] [CrossRef]
  7. Di Crescenzo, A.; Toomaj, A. Extension of the past lifetime and its connection to the cumulative entropy. J. Appl. Probab. 2015, 52, 1156–1174. [Google Scholar] [CrossRef] [Green Version]
  8. Barlow, R.; Proschan, F. Mathematical Theory of Reliability; Classics in Applied Mathematics (Book 17); With Contributions by Larry C. Hunter; SIAM: Philadelphia, PA, USA, 1996. [Google Scholar]
  9. Block, H.W.; Savits, T.H.; Singh, H. The reversed hazard rate function. Probab. Eng. Inf. Sci. 1998, 12, 69–90. [Google Scholar] [CrossRef]
  10. Santacroce, M.; Siri, P.; Trivellato, B. New results on mixture and exponential models by Orlicz spaces. Bernoulli 2016, 22, 1431–1447. [Google Scholar] [CrossRef] [Green Version]
  11. Cicalese, F.; Gargano, L.; Vaccaro, U. Bounds on the entropy of a function of a random variable and their applications. IEEE Trans. Inf. Theory 2018, 64, 2220–2230. [Google Scholar] [CrossRef]
  12. Shaked, M.; Shanthikumar, J.G. Stochastic Orders; Springer Series in Statistics; Springer: New York, NY, USA, 2007. [Google Scholar]
  13. Belzunce, F.; Martínez-Riquelme, C.; Mulero, J. An Introduction to Stochastic Orders; Elsevier/Academic Press: Amsterdam, The Netherlands, 2016. [Google Scholar]
  14. Arnold, B.C.; Castillo, E.; Sarabia, J.M. Conditional Specification of Statistical Models; Springer: New York, NY, USA, 1999. [Google Scholar]
  15. Escobar, L.A.; Meeker, W.Q. A review of accelerated test models. Stat. Sci. 2006, 21, 552–577. [Google Scholar] [CrossRef]
  16. Di Crescenzo, A.; Martinucci, B.; Mulero, J. A quantile-based probabilistic mean value theorem. Probab. Eng. Inf. Sci. 2016, 30, 261–280. [Google Scholar] [CrossRef]
  17. Di Crescenzo, A. A probabilistic analogue of the mean value theorem and its applications to reliability theory. J. Appl. Probab. 1999, 39, 706–719. [Google Scholar] [CrossRef]
  18. Di Crescenzo, A.; Martinucci, B.; Zacks, S. Compound Poisson process with a Poisson subordinator. J. Appl. Probab. 2015, 52, 360–374. [Google Scholar] [CrossRef]
  19. Cox, D.R. Regression models and life tables (with Discussion). J. R. Stat. Soc. Ser. B 1972, 34, 187–220. [Google Scholar]
  20. Nanda, A.K.; Das, S. Dynamic proportional hazard rate and reversed hazard rate models. J. Stat. Plan. Inference 2011, 141, 2108–2119. [Google Scholar] [CrossRef]
  21. Ng, H.K.T.; Navarro, J.; Balakrishnan, N. Parametric inference from system lifetime data under a proportional hazard rate model. Metrika 2012, 75, 367–388. [Google Scholar] [CrossRef]
  22. Cover, T.M.; Thomas, J.A. Elements of Information Theory, 2nd ed.; Wiley-Interscience: Hoboken, NJ, USA, 2006. [Google Scholar]
  23. Muliere, P.; Parmigiani, G.; Polson, N.G. A note on the residual entropy function. Probab. Eng. Inf. Sci. 1993, 7, 413–420. [Google Scholar] [CrossRef]
  24. Ebrahimi, N. How to measure uncertainty in the residual life time distribution. Sankhyā Ser. A 1996, 58, 48–56. [Google Scholar]
  25. Ebrahimi, N.; Pellerey, F. New partial ordering of survival functions based on the notion of uncertainty. J. Appl. Probab. 1995, 32, 202–211. [Google Scholar] [CrossRef]
  26. Asadi, M.; Ebrahimi, N. Residual entropy and its characterizations in terms of hazard function and mean residual life function. Stat. Probab. Lett. 2000, 49, 263–269. [Google Scholar] [CrossRef]
  27. Ebrahimi, N.; Kirmani, S.N.U.A.; Soofi, E.S. Multivariate dynamic information. J. Multivar. Anal. 2007, 98, 328–349. [Google Scholar] [CrossRef] [Green Version]
  28. Di Crescenzo, A.; Longobardi, M. Entropy-based measure of uncertainty in past lifetime distributions. J. Appl. Probab. 2002, 39, 434–440. [Google Scholar] [CrossRef]
  29. Nanda, A.K.; Paul, P. Some properties of past entropy and their applications. Metrika 2006, 64, 47–61. [Google Scholar] [CrossRef]
  30. Kundu, C.; Nanda, A.K.; Maiti, S.S. Some distributional results through past entropy. J. Stat. Plan. Inference 2010, 140, 1280–1291. [Google Scholar] [CrossRef]
  31. Sachlas, A.; Papaioannou, T. Residual and past entropy in actuarial science and survival models. Methodol. Comput. Appl. Probab. 2014, 16, 79–99. [Google Scholar] [CrossRef]
  32. Kundu, A.; Nanda, A.K. On study of dynamic survival and cumulative past entropies. Commun. Stat. Theory Methods 2016, 45, 104–122. [Google Scholar] [CrossRef]
  33. Ahmadi, J.; Di Crescenzo, A.; Longobardi, M. On dynamic mutual information for bivariate lifetimes. Adv. Appl. Probab. 2015, 47, 1157–1174. [Google Scholar] [CrossRef] [Green Version]
  34. Bowden, R.J. Information, measure shifts and distribution metrics. Statistics 2012, 46, 249–262. [Google Scholar] [CrossRef]
  35. Lillo, R.E.; Nanda, A.K.; Shaked, M. Some shifted stochastic orders. In Recent Advances in Reliability Theory; Statistics for Industry and Technology; Birkhäuser: Boston, MA, USA, 2000; pp. 85–103. [Google Scholar]
Figure 1. Plot of F t Y ( x ) / F ( x ) for t = 1 , with reference to Counterexample 1.
Mathematics 06 00204 g001
Figure 2. With reference to Example 1, left: plot of R t ( x ) for 1 < x < 10 , with t = 1 and k = 2 , 3, 4, 5 (from bottom to top); right: contour plot of R t ( x ) for 1 < x < 10 and 0 < μ < 5 , with k = 2 , t = 1 and λ = 1 .
Mathematics 06 00204 g002
Figure 3. With reference to Example 2, left: plot of R t ( x ) for 5 < x < 10 , with t = 5 and θ = 0.3 , 0.4 , 0.5 , 0.6 , 0.7 (from top to bottom); right: contour plot of R t ( x ) for 0.5 < θ < 1 and 5 < t < 10 , with x = 10 .
Mathematics 06 00204 g003
Figure 4. With reference to Example 3, plot of H X t Y for λ = 1 and k = 2 . Left: h = 2 and μ = 1.5 , 2, 3, 4 (from bottom to top). Right: μ = 2 and h = 2 , 3, 4, 5 (from top to bottom).
Mathematics 06 00204 g004

