Article

Mathematical Modeling of Multi-Phenomena Anisotropic Systems: Ejection of Primary Aerosols during the Fast Pyrolysis of Biomass

by
Mario A. Sánchez
1,*,
Juan C. Maya
2,
Farid Chejne
2,
Brennan Pecha
3 and
Adriana M. Quinchía-Figueroa
1
1
Escuela de Ingeniería y Ciencias Básicas, Universidad EIA, Envigado 055428, Colombia
2
Departamento de Procesos y Energía, Facultad de Minas, Universidad Nacional de Colombia Sede Medellín, Medellín 050034, Colombia
3
Renewable Resources and Enabling Sciences Center, National Renewable Energy Laboratory (NREL), Golden, CO 15013, USA
*
Author to whom correspondence should be addressed.
Mathematics 2024, 12(6), 925; https://doi.org/10.3390/math12060925
Submission received: 26 December 2023 / Revised: 13 February 2024 / Accepted: 28 February 2024 / Published: 21 March 2024
(This article belongs to the Special Issue Computational Mathematics and Mathematical Modelling)

Abstract

:
This study introduces a novel particle model for biomass fast pyrolysis, incorporating an anisotropic cylindrical particle to address mass and energy transport coupled with aerosol ejection, which previous models have overlooked. The main contribution lies in developing a model that considers aerosol generation in anisotropic cylindrical particles for the first time, addressing bubbling dynamics and bursting within the liquid phase. The population balance equation describes bubble dynamics and aerosol formation, capturing phenomena like nucleation, growth, coalescence, and bursting. The model employs the method of moments with bubble volume as an internal variable, substantially reducing computational costs by eliminating dependence on this variable. Results highlight the significant impact of anisotropy and particle size on aerosol ejection: smaller, less elongated particles experience faster heating, quicker conversion, and the increased accumulation of the liquid intermediate phase. Specifically, 1 mm diameter particles yield higher concentrations of metaplast and bio-oil aerosols, exceeding 15%, compared to concentrations below 11% for 3 mm particles. This model provides insights into aerosol structure (volume, surface area), aiding in understanding aerosol reactivity at the reactor scale.

1. Introduction

The formation of an intermediate liquid phase during biomass fast pyrolysis known as metaplast or active cellulose has been demonstrated by previous works [1,2,3], and this metaplast phase affects transport phenomena and the resident time of intermediate products [4,5,6]. In this liquid phase, there is an occurrence of bubble formation, and the consequent collapse of interfacial gas bubbles generates a liquid jet that breaks into ejected aerosol particles capable of carrying non-volatile substances [3,7,8,9].
The oil fraction that comes from primary and secondary aerosols can represent between 20 to 40% wt. of the total oil yield, whereas the fraction that comes from primary aerosols that are ejected directly from the biomass particle has been reported in previous works to be around 10% [10]. Compared to the overall collected oil, this portion is characterized by higher concentrations of components derived from lignin and anhydrosugars, and it exhibits lower levels of oxygenates derived from low molecular weight cellulose, such as hydroxyketones [11]. While aerosols have been recognized as a significant element in transporting non-volatile materials and inorganics to pyrolysis oil [7], understanding their concentrations and sizes is essential for evaluating their influence on subsequent processes. However, there is a scarcity of studies on the production and characterization of aerosols during fast biomass pyrolysis [11].
Although several particle models for biomass pyrolysis consider mass and energy transport phenomena within the particle [12,13,14,15], few of these models include the appearance of an intermediate liquid phase [5,6,16,17,18,19], and except for the models of Montoya and Teixeira, these works do not model bubbling dynamics and bursting phenomena for aerosol generation [8,20]. The present work considers an anisotropic cylindrical particle with bubbling dynamics and bursting within the liquid intermediate phase, and the subsequent transport of the aerosols within the solid matrix and its secondary reactions. To achieve this, the model proposed by Sánchez et al. [21] was adapted, integrating detailed kinetic schemes, secondary reactions within particles, reaction heat, and advection to predict particle conversion during biomass pyrolysis. The bubble dynamics and aerosol production phenomena were modeled using a population balance equation, which is solved using the method of moments to eliminate the dependence on the internal variable and thus reduce computational cost. To our knowledge, none of the previously developed models study aerosol generation for an anisotropic cylindrical particle with bubbling dynamics and bursting within the liquid phase.

2. Development of the Mathematical Model

2.1. Model Characteristics

To model the dynamics of the liquid intermediate bubbling and the aerosol ejection phenomena within the biomass particle, the population balance is coupled with a pyrolysis model at the particle scale. The characteristics of the model are the following:
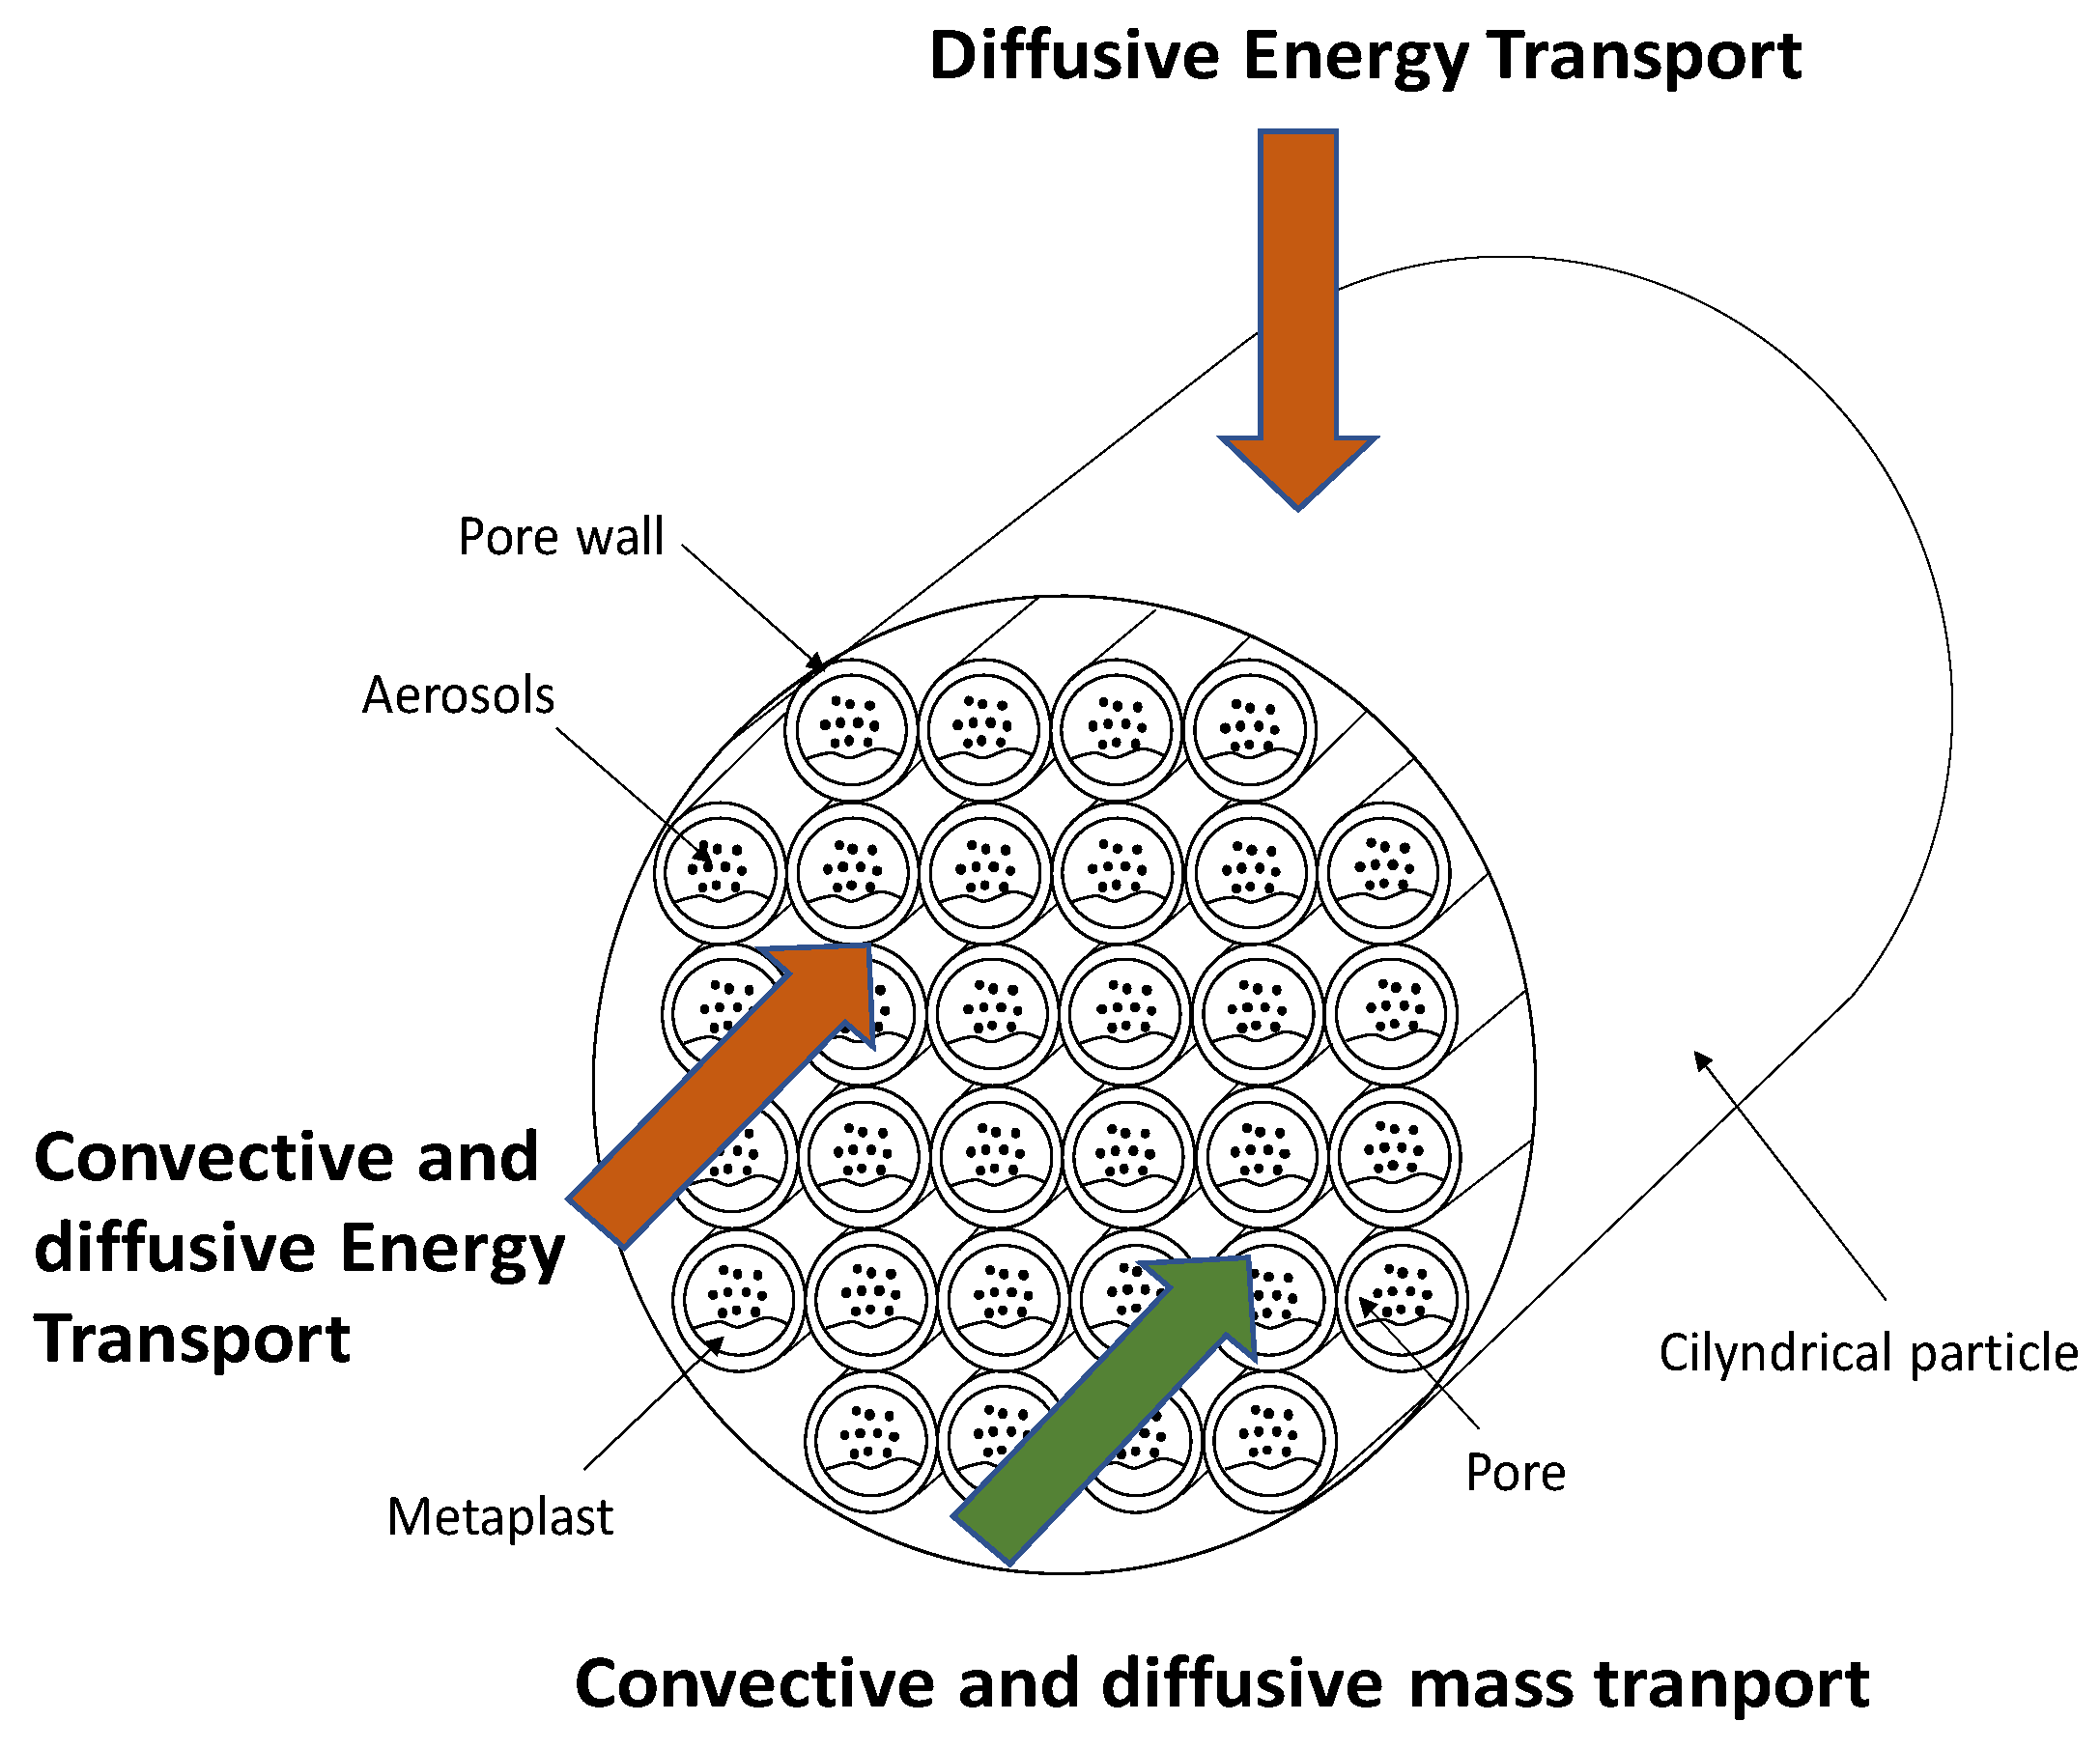
  • The particle exhibits porosity and has a cylindrical shape, displaying anisotropic characteristics to imitate the favored alignment of the biomass pores (refer Figure 1). Longitudinal and radial shrinking is considered.
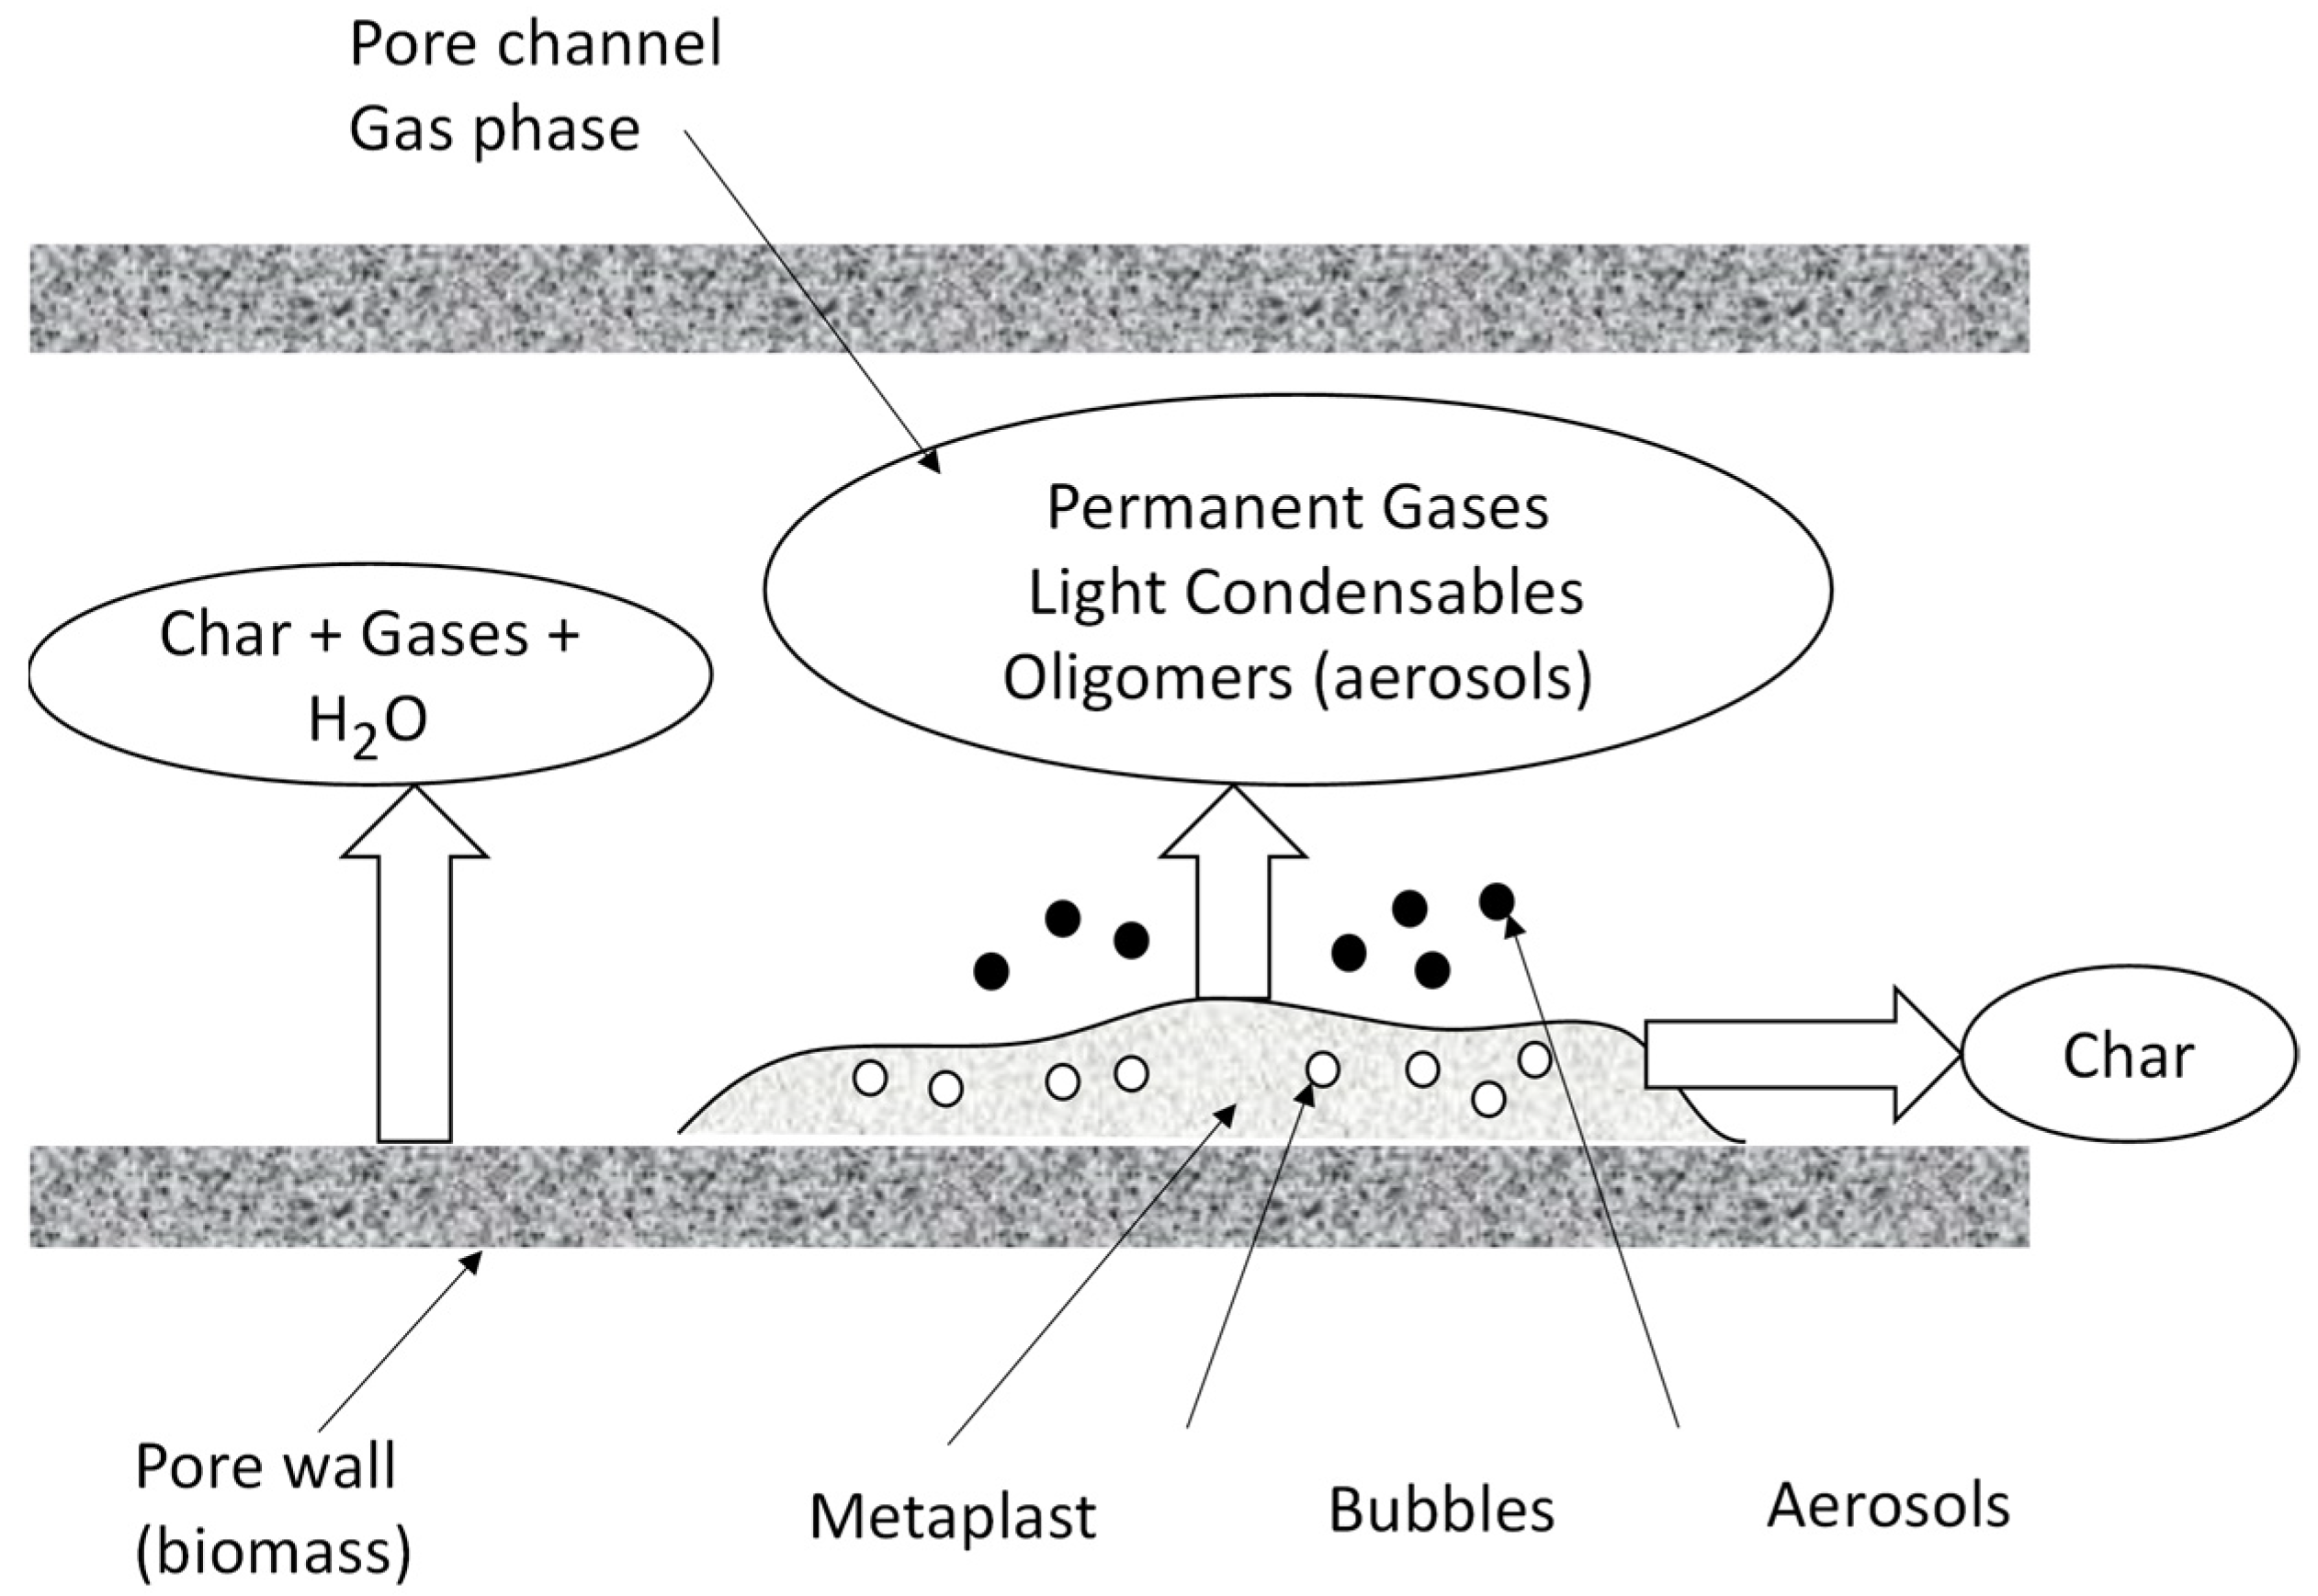
  • In the radial orientation, mass transfer is deemed insignificant, while in the axial orientation, both diffusive and convective transports of mass and energy are taken into account. The liquid phase (metaplast) is assumed to be static.
  • The reaction mechanism takes into account the pseudo-components of biomass and the reactions of the metaplast phase. It involves secondary cracking and charring reactions, both homogeneous and heterogeneous, for the volatile components.
  • Particle properties change in response to temperature and local composition. The ratio of anisotropy in thermal conductivity and the permeability of particles are determined as functions of conversion.
  • Bubble production within the metaplast phase is considered as well as the ejection of aerosols from this phase as a consequence of bubble bursting. The bubble dynamics are modeled with population balances (see Figure 2). No movement of the bubbles in the axial direction is considered.
  • Aerosol ejection is calculated as a function of the bubble bursting rate. The movement of aerosols throughout the particle pore is considered.

2.2. Population Balance for Bubbles within the Metaplast Phase

Population balance equations are employed to depict the progression of a group of entities (particles, pores, bubbles, aerosols, etc.). This encompasses various applications such as crystallization, metallurgical leaching, liquid–liquid extraction, gas–liquid dispersions like water electrolysis, liquid–liquid reactions, comminution, aerosol engineering, and biology, where entities are often cells classified by size or intracellular proteins, polymerization, etc. These equations are considered an extension of the Smoluchowski coagulation equation, which specifically addresses particle coalescence [22]. In a broader sense, population balance equations articulate how populations of distinct entities evolve in specific properties over time. They are a collection of integral partial differential equations that delineate the mean-field behavior of a population of particles based on the analysis of a single particle’s behavior in local conditions.
Consider a distribution function f for an internal (intrinsic) variable to the system itself, such as the mass, density, volume, pore or grain radius, etc., to become a distribution function of a population with a dynamic that includes terms of appearance (B) and disappearance (D) of populations. In this case, the terms death and birth refer to bubble phenomena such as nucleation and disappearance (bubble bursting), and also to interactions between the bubbles, such as coalescence. If the internal variable corresponds to the entity volume then the function f represents the number of bubbles with volume v in a node of the system control volume at the time t per volume of the particle f = #   e n t i t i e s m 3 m 3   o f   e n t i t i e s . The rate of change of the distribution function f can be calculated by a general balance considering the terms associated with inlet, outlet, generation, growth, disappearance, and accumulation; as shown in Equation (1). This equation corresponds to the typical formulation of the population balance equation [23] but specifically applies to the bubbling process in the liquid phase generated during biomass pyrolysis. In the present work, the internal variable v is considered the volume of the entities [m3], in this case, the volume of bubbles that are produce within the liquid phase.
f v t = I n l e t O u t l e t c o n v e c t i o n + I n l e t O u t l e t g r o w t h + B D c o a l e s c e c e ,       n u c l e a t i o n ,       b u s t i n g
Inlet and outlet terms are associated with the convection and growth phenomena of the bubbles, convection while the generation term is related to phenomena such as nucleation and disappearance/bursting and also to all interactions between bubbles, such as coalescence, as shown in Equation (1). In the present work, the bursting of the bubbles when they reached the metaplast surface is considered a phenomenon which produces the ejection of aerosols that carry heavy compounds and minerals and can be found in the heavy fraction of the collected bio-oil. An explanation of the derivation of the terms related to convection, growth, nucleation, coalescence, breakage, and disappearance/bursting is presented in the next sections.
The birth, death, and growth of bubbles within the metaplast are estimated using the population balance presented in Equation (2), where the phenomena of nucleation, growth, coalescence, and bursting are considered. In the present model, the internal variable for the distribution function corresponds to the volume of the bubbles f v v . This function represents the number of bubbles with volume v in a node of the particle at the time t per volume of the particle. No movement of the bubbles in the axial direction is considered; thus, the convective term is not considered for the population balance.
f v t = S ˙ g r o w t h + S ˙ c o a l e s c e n c e b i r t h S ˙ c o a l e s c e n c e d e a t h + S ˙ n u c l e a t i o n _ b i r t h S ˙ b u r s t i n g _ d e a t h
The population for the function f v can be written according to the population balance most common notation, as shown in Equation (3).
f v t = v v t f v g r o w t h r a t e + B D c o a l e s c e n c e ,       n u c l e a t i o n ,       b u r s t i n g

2.2.1. Nucleation

The nucleation rate of bubbles within the metaplast phase is expressed as a function of both the production rate of metaplast from each biomass pseudo-component and the concentration of this metaplast phase ρ M T i , j , as shown in Equation (4):
S ˙ n u c l e a t i o n = B n u c l e a t i o n = j = 1 N r k N i , j ε M T i   δ v = j = 1 N r k N 0 ( i , j ) e E a ,   M T i , j R T ρ B M i   ρ M T ε M T i   δ v
In Equation (4), j = 1 N r k N 0 ( i , j ) e E a , M T i , j R T ρ B M i ρ M T corresponds to the volumetric production rate ( m M T 3 m p a r t i c l e 3 · s ) of the metaplast pseudo-components ( M T i , j = CELLA HCE1, HCE2, LIG, LIGOH, LIGCC) in the Nr reactions of the CRECK mechanism, where k N 0 is the nucleation rate constant, ρ B M i , j corresponds to the mass concentration per particle volume of each pseudo-component ( B M i , j = CELL, HCE, LIG-C, LIG-H, LIG-O), ρ B M corresponds to the biomass true density, ε M T i represents the volumetric fraction of the metaplast pseudo-components, and δ v corresponds to the Dirac delta function. It is important to note that Equations (1)–(4) correspond to the typical formulation of the population balance equation but specifically applied to the bubbling process in the liquid phase generated during biomass pyrolysis [23].

2.2.2. Bubble Growth Rate

The change in the distribution function f v due to bubble growth can be estimated using Equation (5). The growth rate for bubble volume v t is estimated as a function of the production of the gas and volatile production, as shown in Equation (6). In this way, the volume of the bubbles is coherent with the mass of gases and volatiles being produced. Where k G 0 corresponds to growth rate constant and j = 1 N r r ˙ G j corresponds to the reaction rate of total gases ( m G a s e s 3 m p a r t i c l e 3 · s ) from the liquid intermediates in the N r reactions of the CRECK mechanism.
S ˙ g r o w t h = v v t f v
d v d t = k G 0 j = 1 N r r ˙ G j

2.2.3. Bursting

As mentioned previously, in the present work, the phenomenon of bubble production and bursting within the metaplast phase is responsible for the ejection of aerosols that carry heavy compounds and minerals and can be found in the heavy fraction of the collected bio-oil. The death rate by bubble bursting can be expressed as shown in Equation (7)
S ˙ b u r s t i n g = D b u r s t i n g = f v τ b t = f v τ b 0 ρ L ρ p a r t i c l e , 0
where τ b t represents the mean time that takes a bubble to burst from its appearance, accounting for the time to grow, reach the surface, and burst. τ b t is estimated as a function of the intermediate liquid phase concentration: τ b t = τ b 0 ρ L ρ p a r t i c l e , 0 .

2.2.4. Coalescence

Birth and death rates by the coalescence of bubbles of different sizes are estimated according to Equations (8) and (9), where the parameter a is the aggregation frequency.
S ˙ c o a l e s c e n c e _ b i r t h = B c o a l e s c e n c e = 1 2 0 a f v v f v d v
S ˙ c o a l e s c e n c e _ d e a t h = D c o a l e s c e n c e = f ( v ) 0 a f v d v
Using the expressions for nucleation, growth, coalescence, and bursting, the population balance can be expressed as follows:
f v t = v k G 0 j = 1 N r r ˙ G i , j f v G r o w t h + 1 2 0 a f v v v f v v d v B c o a l e s c e n c e f v ( v ) 0 a f v d v D c o a l e s c e n c e + k N 0 i = 1 N r e E a ,   M T i R T ρ M T i δ v B n u c l e a t i o n f v τ b t ρ L D b u r s t i n g

2.3. The Method of Moments

2.3.1. Balance Equation for Bubble Moment

The population balance equation used to describe bubble dynamics is an integral-differential equation that can be solved through various methods, such as the widely employed method of classes [23], where the distribution function f v ( v ) is discretized for each particle node. However, this approach would entail a very high computational time to solve the particle model, which also includes the local balance equations for species and energy. Therefore, this work employs the so-called method of moments, in which Equation (10) is transformed into a set of ordinary differential equations that can be solved simultaneously with mass and energy balance equations. In this method, the population balance can be rewritten by multiplying each term by v n and using the definition of moment M n = 0 v n f v v d v ; the moment-transformed population balance is presented in Equation (11).
M n t = v n r t f v n r t f 0 + n 0 v n 1 v t f d v G r o w t h + 0 v n ( B D d v c o a l e s c e n c e ,   n u c l e a t i o n ,   b u r s t i n g = 0
By replacing the terms for bubble growth, coalescence, nucleation, and bursting, Equations (12) and (13) can be obtained.
d M n d t = n d v d t M n 1 G r o w t h + 1 2 a i = 1 n n i M n M n i B c o a l e s c e n c e a M o M n D c o a l e s c e n c e + k N 0 i = 1 N r e E a ,   M T i R T ρ M T i 0 v n δ v v B n u c l e a t i o n 0 v n f v τ b 0 ρ L v D b u r s t i n g
d M n d t = n k G 0 j = 1 N r r ˙ G i , j M n 1 G r o w t h + 1 2 a i = 1 n n i M n M n i B c o a l e s c e n c e a M o M n D c o a l e s c e n c e + k N 0 i = 1 N r e E a ,   M T i R T ρ M T i 0 v n δ v v B n u c l e a t i o n M n τ b 0 ρ L D b u r s t i n g
where δ v corresponds to the Dirac delta function; considering that 0 f ( x ) δ x     a d x   =   a , the nucleation term can be obtained as shown in Equations (14) and (15).
B n u c l e a t i o n ( for   moment   0 ) = k N 0 i = 1 N r e E a ,   M T i R T ρ M T i
B n u c l e a t i o n ( for   moment   N   different   to   0 ) = k N 0 i = 1 N r e E a ,   M T i R T ρ M T i 0 n = 0
The term M n (with n = 0, 1) in Equation (13) represents the moments zero and one. The other terms of Equation (13) correspond to the nucleation rate moment, the growing rate moment, the birth and death rate moments by coalescence of the bubbles, and the bursting rate moment, respectively. These moments can be associated with the physical parameters of the population balance; when the volume of the particles (bubbles) is used as the intrinsic property for the population balance, where M 0 represents the total number of bubbles per particle volume, the first moment M 1 represents the volumetric fraction of aerosols, M 1 can be estimated with the M 0 value and the average volume of the aerosols at each node, and the relationship M 1 M 0 represents the average volume of the particles. Equation (16) can be solved to obtain M 0 and M 1 as shown below:
d M 0 d t = a M 0 2 + k N 0 i = 1 N r e E a ,   M T i R T ρ M T i M 0 τ b 0 ρ L ρ 0
d M 1 d t = k G 0 j = 1 N r r ˙ G i , j M 0 M 1 τ b 0 ρ L ρ 0

2.3.2. Aerosol Estimation Using the Method of Moments

The number and volume of aerosols can be expressed as a function of M 0 and M 1 of bubbles. Using the moments method, the number of aerosols can be found using the expression shown in Equation (18). Where the first term represents the zero moment for aerosols and, as was mentioned for bubbles, it can be related to the number of total ejected aerosols per particle volume; the second term corresponds to the aerosol generation rate due to the bubble bursting; and the third term represents the convective transport of aerosols through the pores. The term N a N b corresponds to numbers of aerosols being ejected from each mother bubble, and this parameter was previously measured by Texeira et al. and Dauenhauer et al. [8,24] for cellulose pyrolysis and also by Montoya et al. [3]. The parameter φ corresponds to the aerosol matrix retention factor.
M 0 a t = φ N a N b M 0 b τ b 0 ρ L ρ 0 v a M 0 a x
Similarly, the volume of aerosols being ejected from the liquid intermediate phase can be found using the expression shown in Equation (19). Where the first term represents the first moment for aerosols and, as was mentioned for bubbles, it can be related to the volume of total ejected aerosols per particle volume; the second term corresponds to the aerosol volume generation rate due to the bubble bursting; and the third term represents the convective transport of aerosols through the pores. D a D b corresponds to the ratio between the radius of ejected aerosol and the mother bubble radius.
M 1 a t = φ N a N b D ¯ a D ¯ b 3 M 1 b τ b 0 ρ L v a M 1 a x
To solve the system of partial differential equations of the model, partial derivatives in space were discretized using an upwind scheme for convective terms and centered finite differences for diffusive terms in the local mass and energy balances. Time derivatives were solved using MATLAB R2023a software employing a fifth-order Runge-Kutta (RK5) algorithm with variable step size (ode15s). This method is known for its precision and stability capabilities in solving ordinary differential equations (ODEs). With a higher number of stages compared to lower-order methods, RK5 enhances precision by providing more accurate solutions. Its adaptability to variable step sizes contributes significantly to stability, ensuring accuracy is maintained during integration, especially when dealing with rapid changes in the solution. This adaptability is particularly advantageous in scenarios where fast reaction rates lead to highly stiff numerical problems, making RK5 a preferred choice. Additionally, RK5’s higher order of accuracy facilitates quicker convergence to the true solution, thereby reducing errors in the approximation.
Finally, as mentioned above, it should be emphasized that the herein proposed model is coupled to the species and energy balance equations presented in the work of Sánchez et al. [21].

3. Model Verification and Sensitivity Analysis

The population balance implementation in the pyrolysis model allows for estimating the bubbling dynamics ( M 0 , M 1 ), aerosol ejection dynamics ( M n , a , M 1 , a ), bubble and aerosol size M 1 M 0 ,   M 1 , a M 0 , a , and the aerosol yield. Hence, the model gives information about the number of aerosols and their surface area, which is important for modeling the extra-particle reactions of aerosols, which are important for estimating the final yields of volatiles, gases, and char at the reactor scale; also, the model gives information about the number of heavy products within the bio-oil, which is important for subsequent upgrading processes. To validate the model results, some parameters of the population balance were obtained from previous experiments, such as the ratio between aerosol and bubble diameters D a D b , the number of ejected aerosols per bubble N a N b , and the aerosol matrix retention factor. Experiments by Montoya et al. [3] found that the relationship for the diameters varies from 0.0923 for cellulose to 0.2628 for lignin, similarly, and Montoya et al. found that the parameter N a N b is approximately equal to 15 for biomass. Other parameters such as the nucleation rate constant, the aggregation rate constant, the bubble growth rate constant, and the bubble bursting time, were fitted to obtain proper values for aerosol size, yield and M 0 , a . The parameters used in the present model are shown in Table 1.

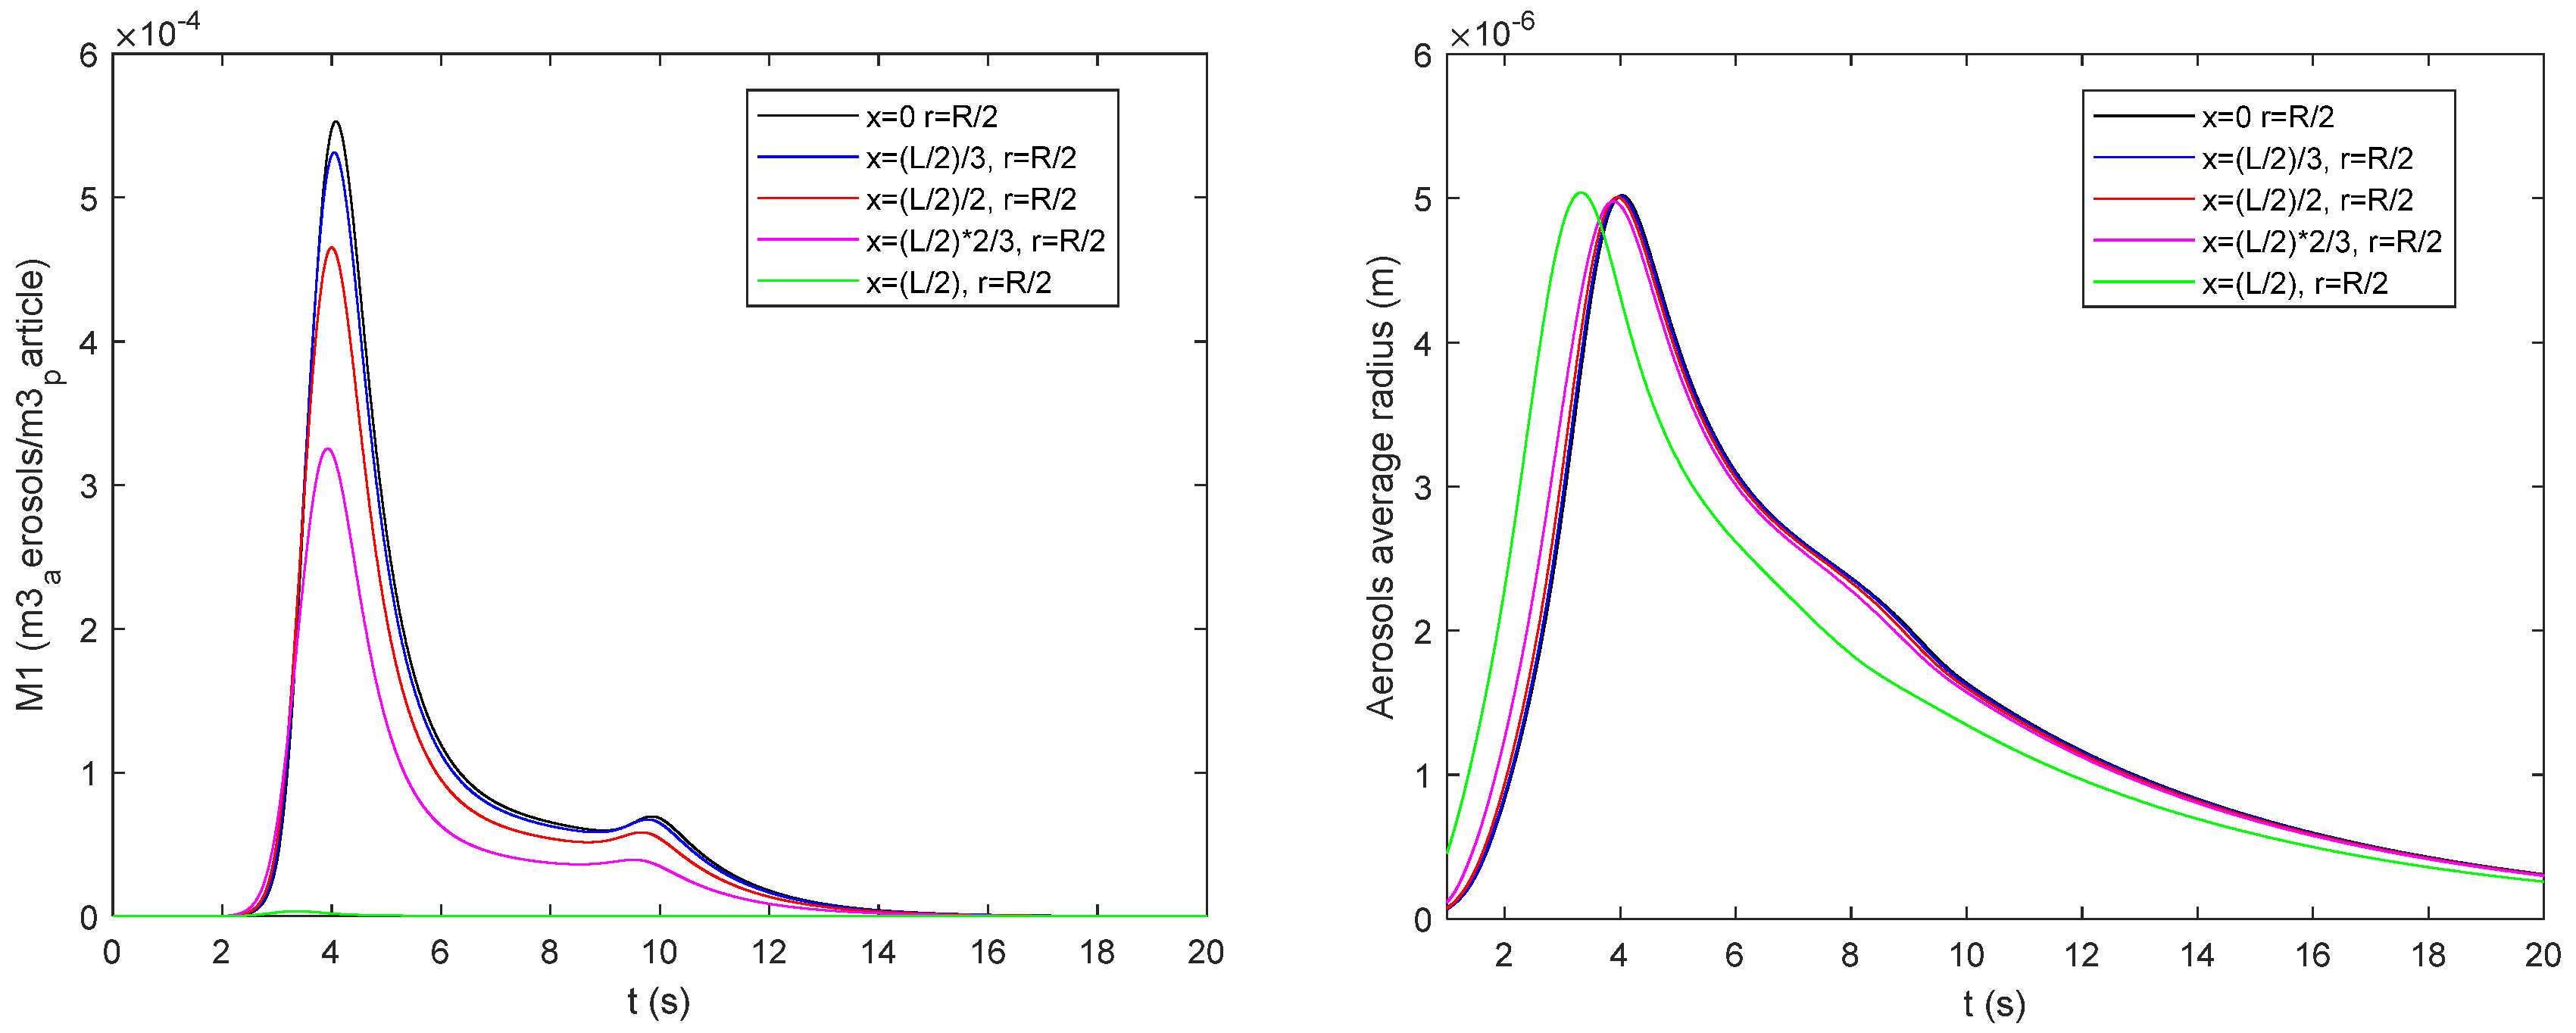
3.1. Bubbling and Aerosol Ejection Dynamics Results

The present model allows predicting the number and volume of bubbles and aerosols being produced, as well as their average size at different locations within the particle, as seen in Figure 3.
Figure 4 shows the local volume of bubbles being produced ( M 1 ) as well as the average size of the bubbles, while Figure 5 shows the volume and average size of ejected aerosols. It can be seen that the bubble and aerosol dynamics are mainly influenced by the concentration of metaplast within the particle; however, it also can be seen that a second small peak in aerosol production is presented due to the dynamics of permanent gases inside the particle. Different scenarios were modeled, where the importance of the total gas production on the bubble nucleation and growth rates were changed, and it was found that when too much importance was given to the produced gases in comparison with the concentration of the metaplast phase the model could not reproduce the tendencies regarding the effect of heating rate in lignocellulosic composition on aerosol ejection. For a particle of 1 mm diameter and 4 mm long with a convective heat transfer coefficient of 200 W/m2·K, an average aerosol diameter is around 10 µm, which is consistent with the observations by Montoya et al. [3], as can be seen in Figure 5.

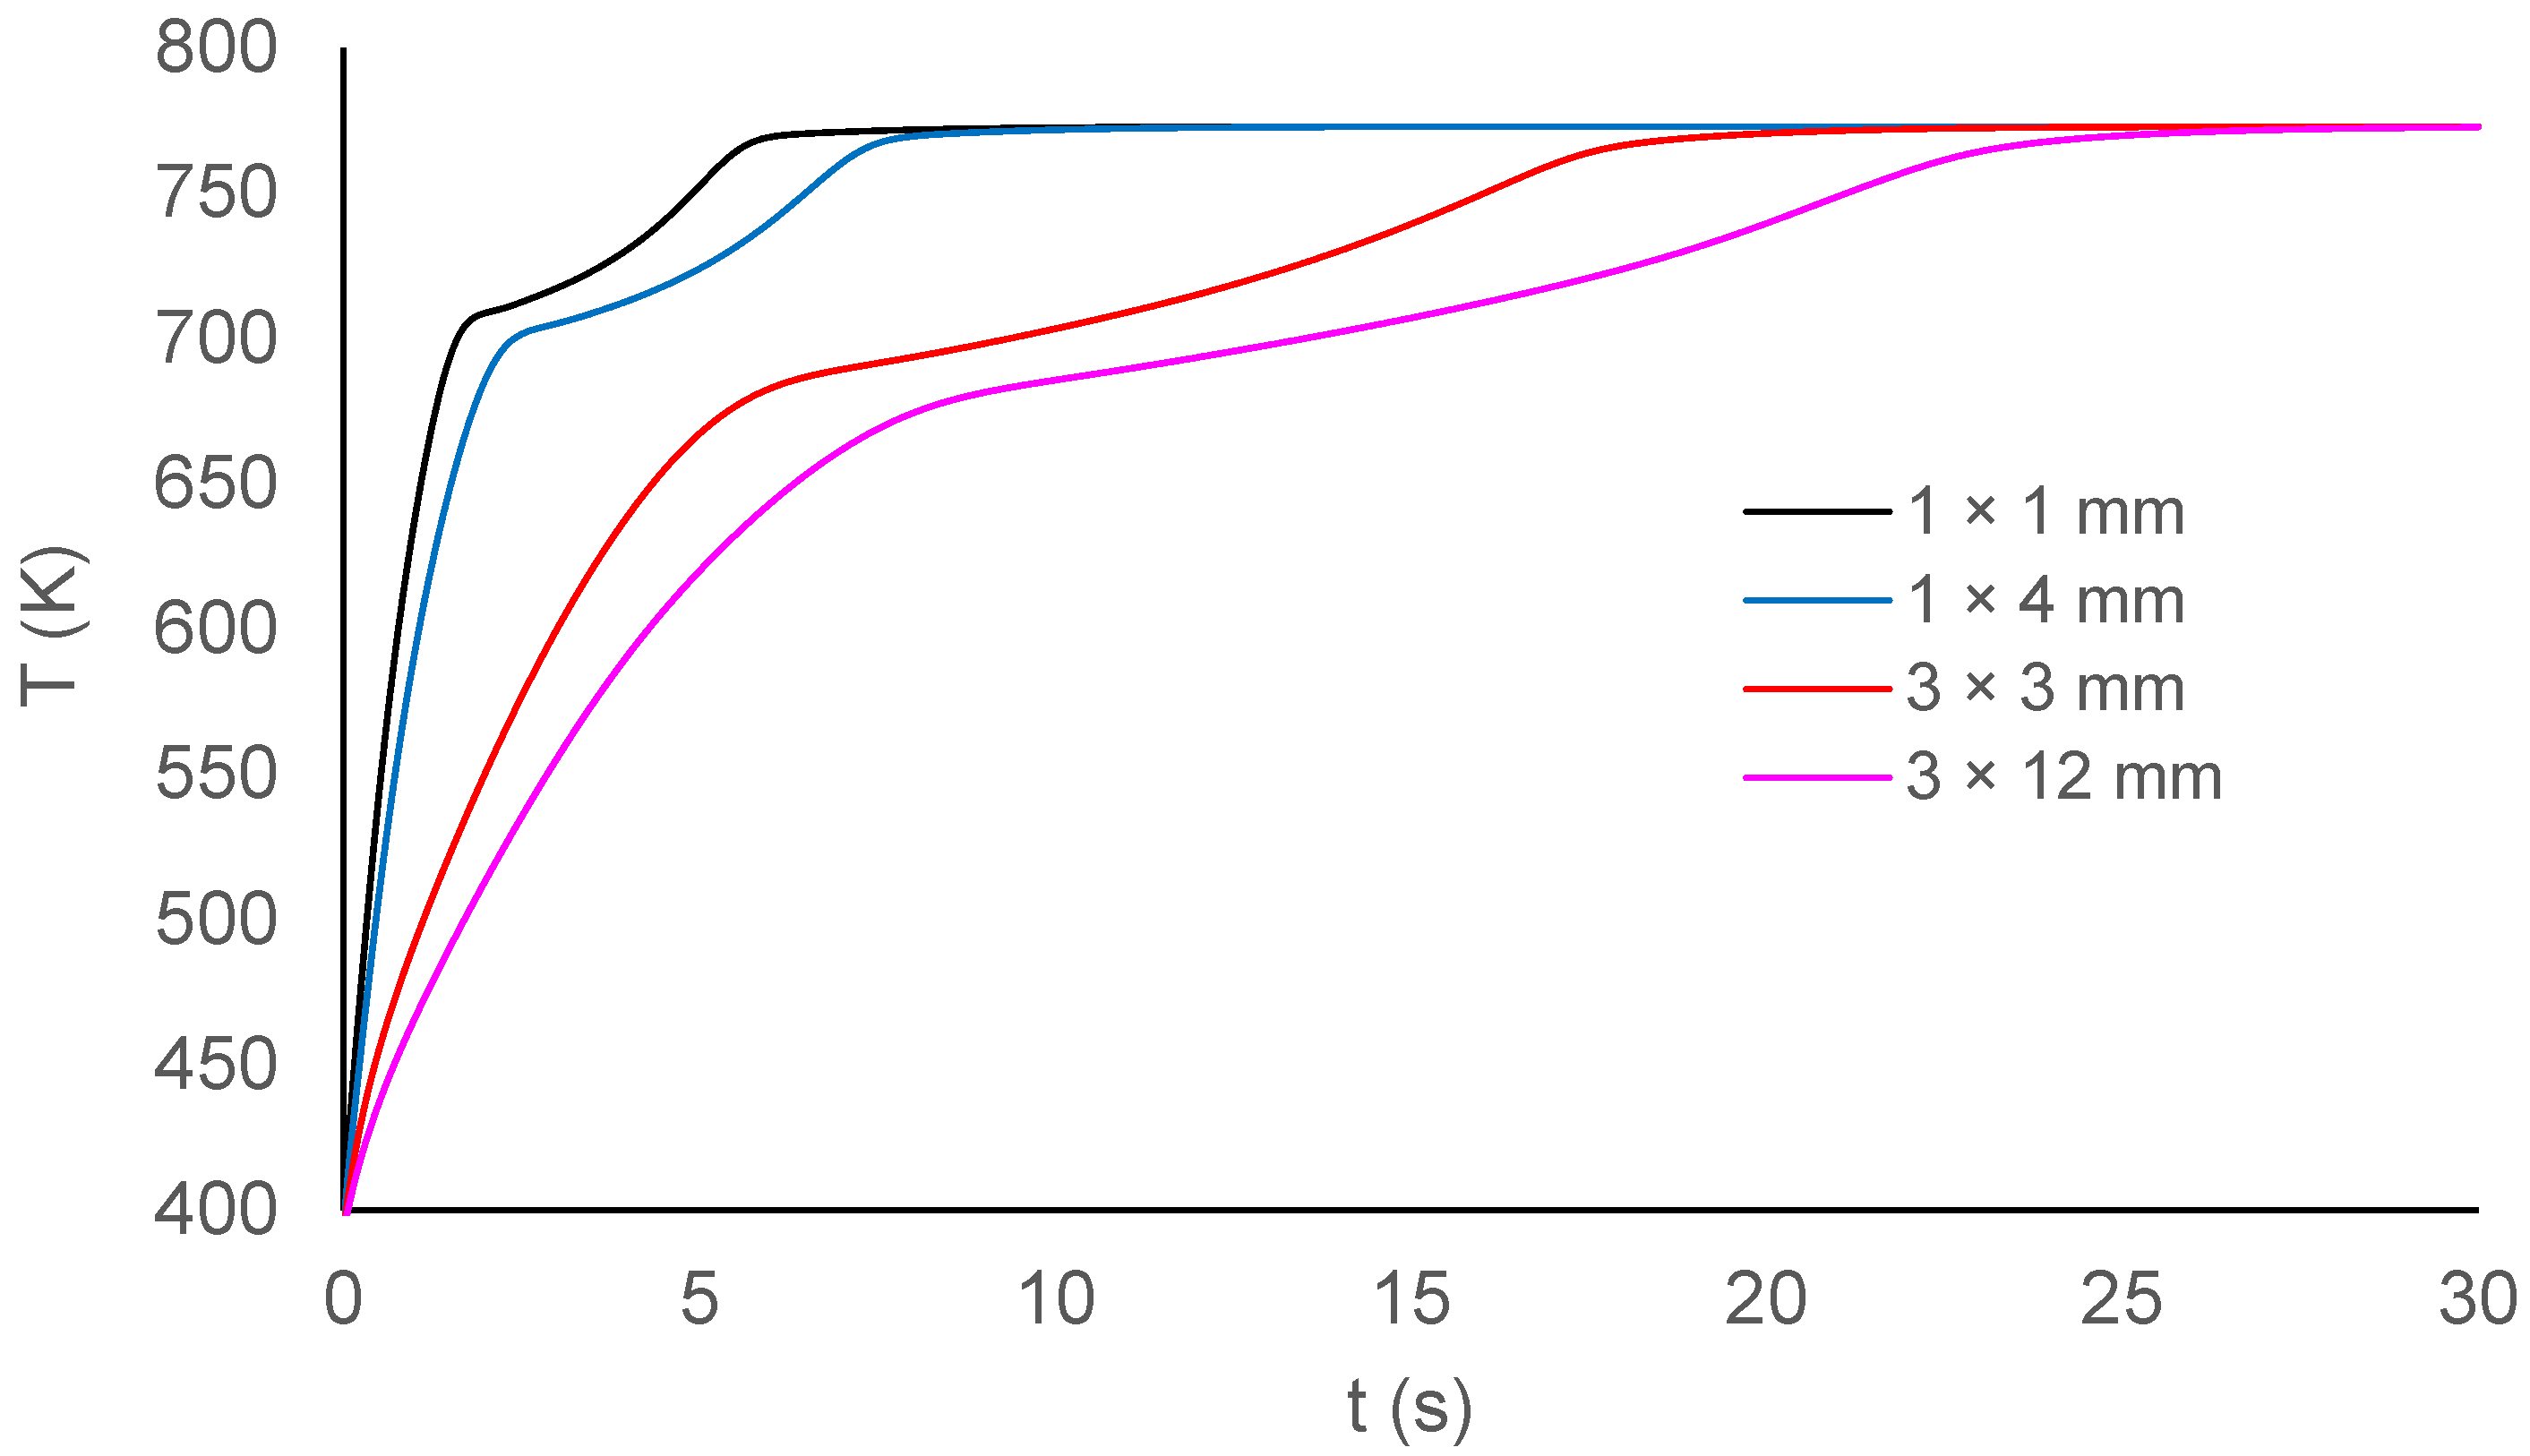
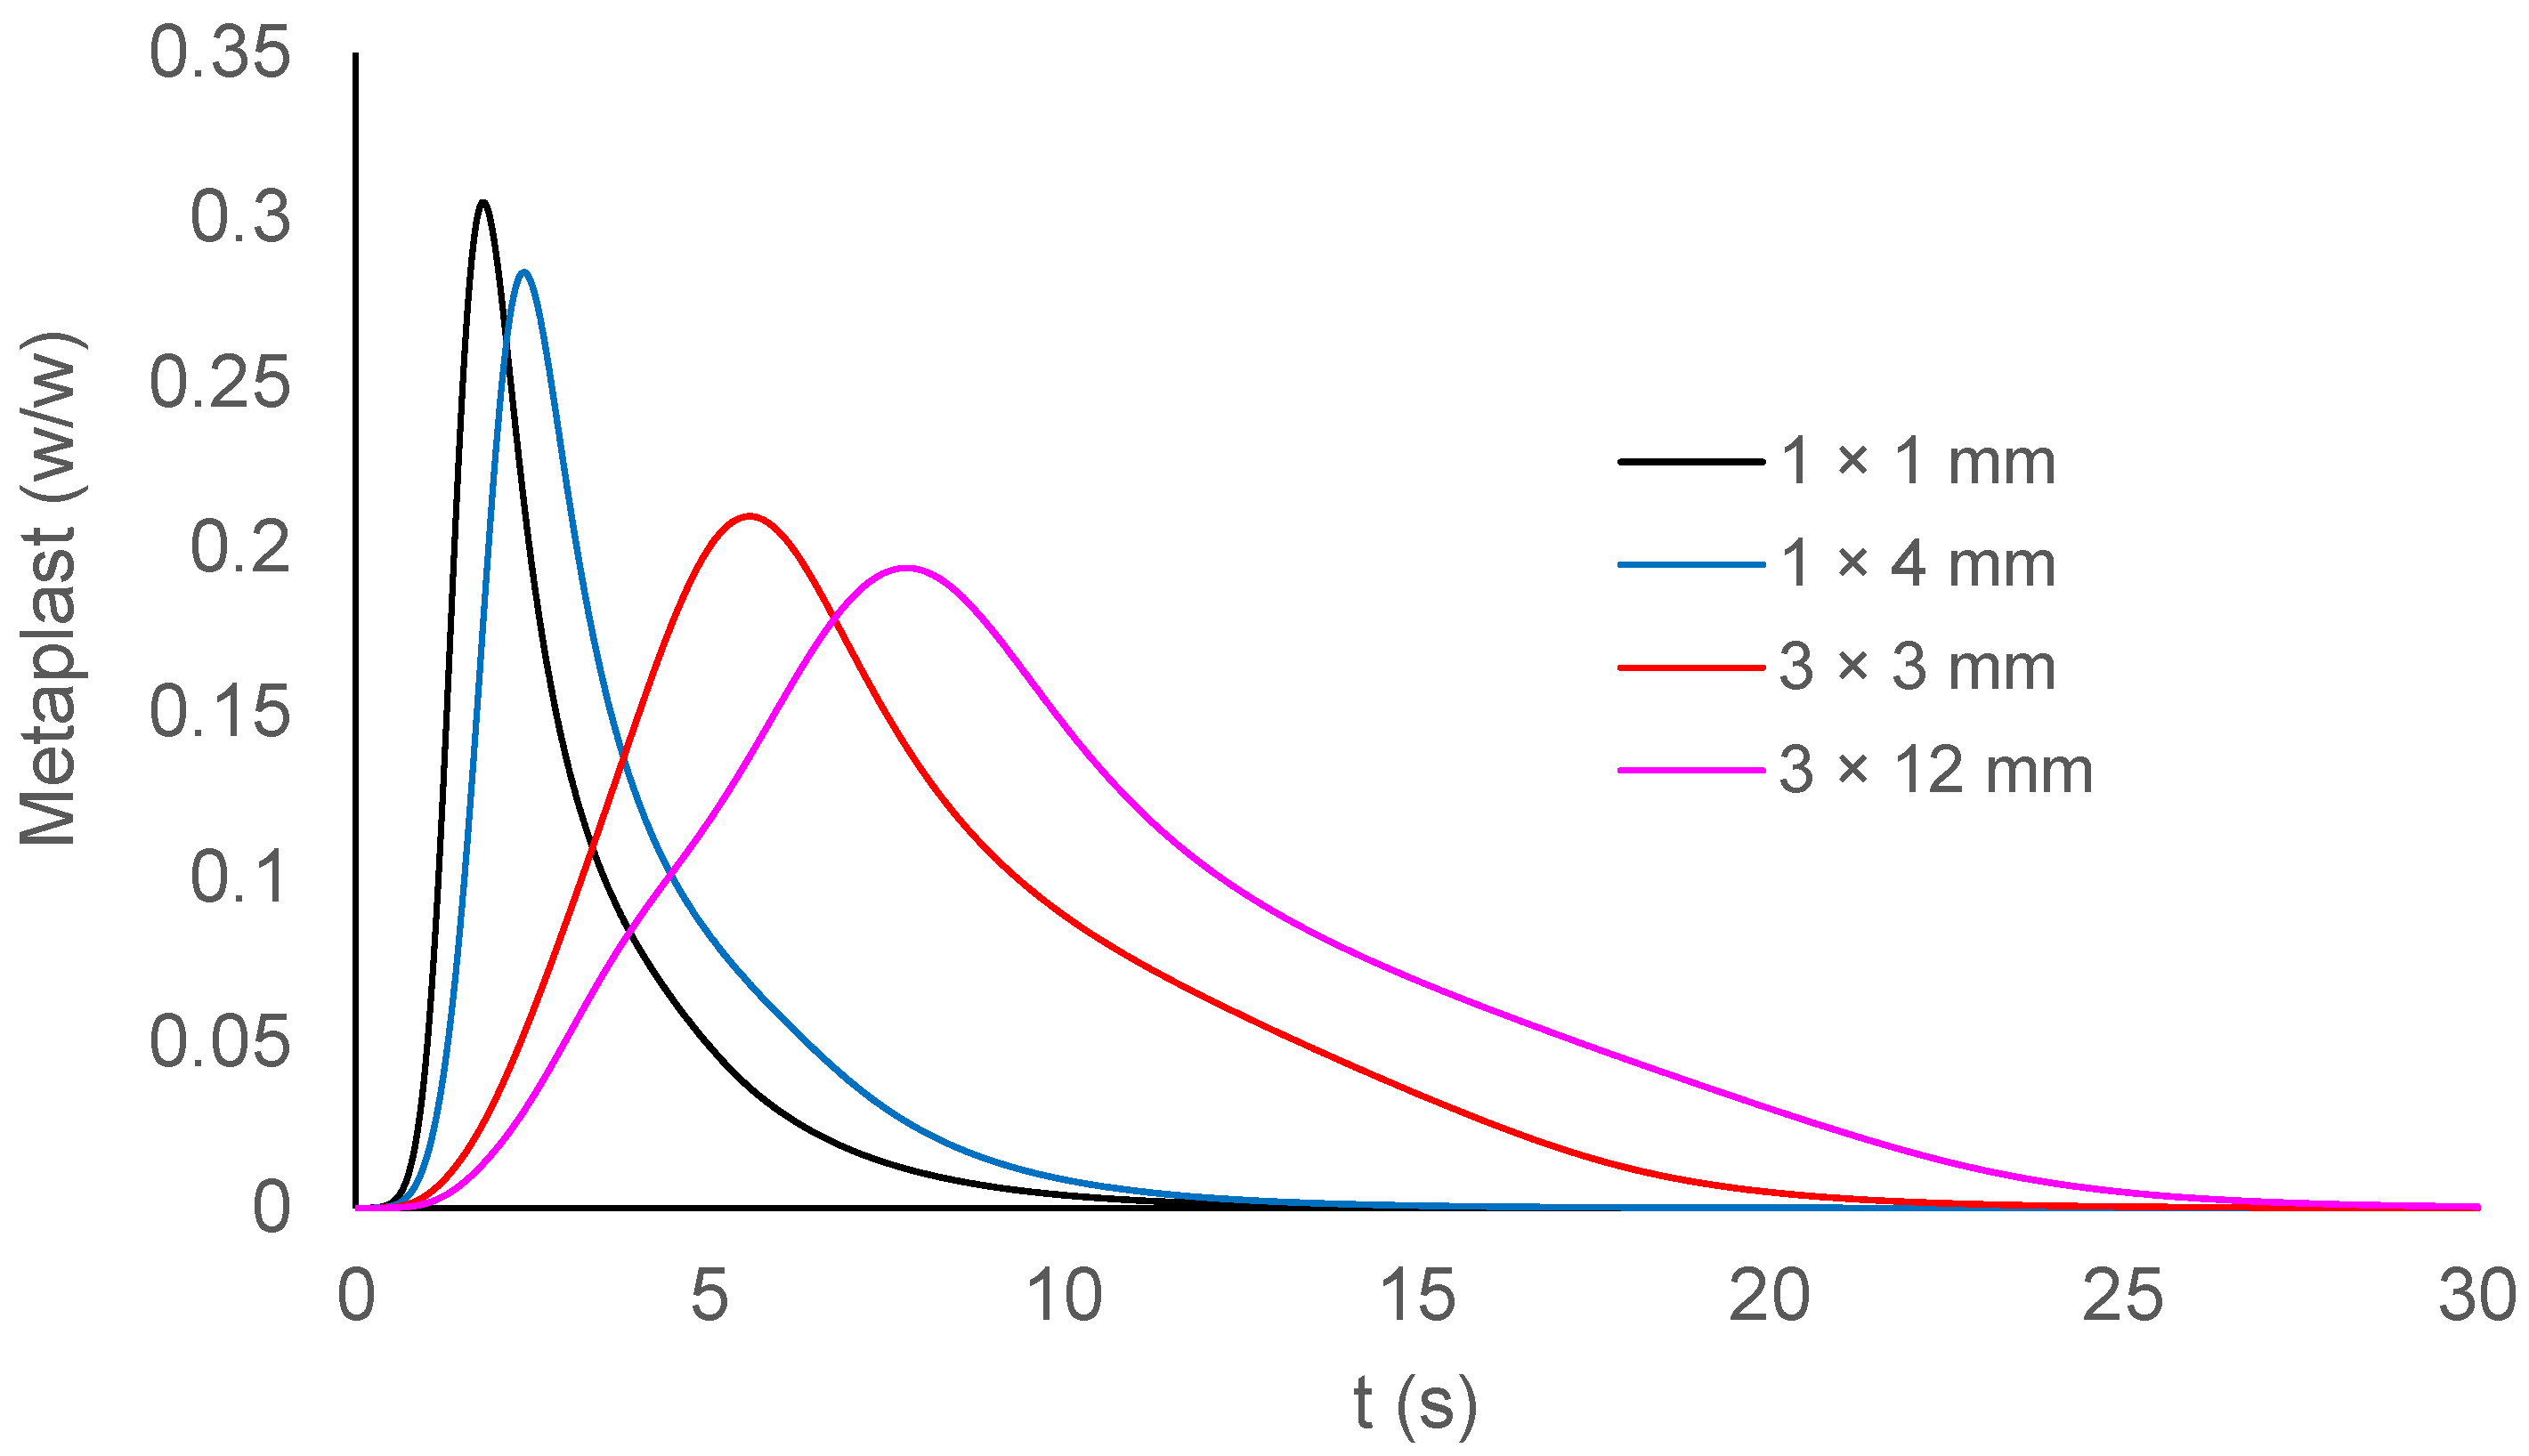
3.2. Effect of Particle Size and Aspect Ratio on Aerosol Production

To study the effect of particle size and aspect ratio, oak particles of 1 mm and 3 mm diameter were studied, with aspect ratios of 1:1 and 1:4. A reactor temperature of 500 °C and a convective coefficient of 350 W/m2·K were used in the simulations. As can be seen in Figure 6, smaller and shorter particles reached higher heating rates, which results in faster conversion times and a higher accumulation of the liquid intermediated phase since the reaction route for the conversion of biomass into metaplast is favored by higher heating rates. This can be observed in Figure 7, where higher concentrations of metaplast are found for the smaller particles.
As mentioned before, the dynamics of bubble production and aerosol ejection are mainly driven by the concentration of metaplast within the particle; thereby, as can be seen in Figure 8, the smaller and shorter particles also present higher yields of bio-oil coming from aerosols. In this case, the particles of 1 mm diameter exhibit aerosol yields of above 15%, while the particles of 3 mm exhibit an aerosol yield of below 11%.

4. Conclusions

A novel model was developed to estimate the ejection of aerosols from anisotropic biomass particles during fast pyrolysis. The model uses population balances and is coupled to transport phenomena and a CRECK kinetic mechanism. To solve the population balance equation, a novel methodology based on the method of moments was employed, using bubble volume as the internal coordinate. This enabled the reduction in the integral-differential equation of bubble volume population balance to a system of two ordinary differential equations (ODEs). The estimation of the nucleation rate and growth rate were derived from the phenomenological variables of the pyrolysis process, such as the concentration and production rate of metaplast and total gases. The selection of the volume of the bubbles as the intrinsic variable in the population balances allowed us to identify a simplified way to estimate aerosol ejection volume and diameters with only two moment equations ( M 0 , M 1 ).
The results from the model agreed with the results by previous authors, where the heating rate has a significant impact on aerosol yield with smaller particles with lower aspect ratios showing significantly higher aerosol yield due to the higher heating rates and the 1 mm diameter particles exhibiting a 47% higher yield than the 3 mm particles.
It was found that the dynamics of production of both the bubbles and aerosols are governed by the local intraparticle dynamics of metaplast concentration and gas generation, were the local concentration of metaplast mainly drives the ejection of aerosols; this was demonstrated by proving different scenarios were the relative importance of total gases on bubble nucleation and growth rates were changed.
The model allows us to obtain information about the volume and size of the aerosols being ejected from the liquid intermediated phase; as previously shown by other authors [2,20], this mechanism represents an significant fraction of the final bio-oil with values that can vary from ~10% to ~20%. This information allowed us to study the extra particle reactions of the ejected aerosols as they traveled through the reactor; however, future efforts must be made to correlate other parameters such as the bubble bursting and coalescence rate to the process phenomena.

Author Contributions

Conceptualization, M.A.S., J.C.M., F.C., B.P. and A.M.Q.-F.; Methodology, M.A.S.; Formal analysis, M.A.S., J.C.M., F.C., B.P. and A.M.Q.-F.; Writing—original draft, M.A.S. and J.C.M.; Writing—review & editing, M.A.S., J.C.M., F.C. and B.P. All authors have read and agreed to the published version of the manuscript.

Funding

This research was funded by the Universidad EIA project number INV-CO-014-2022 and the ACP was funded by Universidad EIA.

Data Availability Statement

The data that support the findings of this study are available on request from the corresponding author.

Conflicts of Interest

The authors declare no conflict of interest.

Nomenclature

SymbolDescriptionUnits
a Aggregation frequencym3·s−1
β Fragmentation frequencym3·s−1
B Birth rate (nucleation, fragmentation, coalescence) #   o f   b u b b l e s m 3     m 3   o f   b u b b l e s     s
D Death rate (coalescence, fragmentation, disappearance/bursting) #   o f   b u b b l e s m 3     m 3   o f   b u b b l e s     s
D ¯ a Average aerosol diameterm
D ¯ b Average bubble diameterm
E a N 0 Activation energy for nucleationkJ·kmol−1
GGas phase (permanent gases, volatiles, water vapor)-
f v Volume density distribution function #   o f   b u b b l e s m 3     m 3   o f   b u b b l e s
iSpecies or the reaction mechanism-
jReactions of the reaction mechanism-
k 0 , j Pre-exponential factor for reaction js−1
k j Kinetic rate for reaction js−1
k N Nucleation birth rate constant #   b u b b l e s m 3 · s
k G 0 Bubble growth rate constant m 6 k g
M n Moments 0, 1, 2, 3-
N r Total number of reactions-
r a Average aerosol radiusm
r b Average bubble radiusm
r ˙ G j Reaction rate for total gases (volatiles and permanent gases) in reaction j
R u Universal constant of ideal gasesJ·mol−1K−1
tTimes
TTemperatureK
uVelocitym s−1
v Volume of the entitiesm3
Greek symbols
δ Dirac delta function-
ε M T i Phase fraction of the pseudo-component i (i = CELLA, HCE1, HCE2, LIG-OH, LIG-CC, LIG)m3·m−3
ρ B M i     Mass concentration of the biomass pseudo-components (i = CELL, HCE, LIG)kg·m−3
ρ B M Biomass true densitykg·m−3
ρ G Gas densitykg·m−3
ρ L Mass concentration of the total liquid intermediateskg·m−3
ρ M T i , j Mass concentration of liquid intermediates i per particle volume for the reaction j (i = CELLA, HCE1, HCE2, LIG-OH, LIG-CC, LIG)kg·m−3
ρ M T Metaplast true densitykg·m−3
ρ p a r t i c l e , 0 Biomass particle apparent densitykg·m−3
τ Bursting times
τ b 0 Bubble bursting characteristic times
φ Aerosol matrix retention factor #   a e r o s o l s #   a e r o s o l s
v a Aerosol velocitym·s−1

References

  1. Fisher, T.; Hajaligol, M.; Waymack, B.; Kellogg, D. Pyrolysis behavior and kinetics of biomass derived materials. J. Anal. Appl. Pyrolysis 2002, 62, 331–349. [Google Scholar] [CrossRef]
  2. Boutin, O.; Ferrer, M.; Lédé, J. Flash pyrolysis of cellulose pellets submitted to a concentrated radiation: Experiments and modelling. Chem. Eng. Sci. 2002, 57, 15–25. [Google Scholar] [CrossRef]
  3. Montoya, J.; Pecha, B.; Janna, F.C.; Garcia-Perez, M. Methodology for estimation of thermal ejection droplet size distribution and intensity during the pyrolysis of sugarcane bagasse and model compounds. J. Anal. Appl. Pyrolysis 2017, 125, 69–82. [Google Scholar] [CrossRef]
  4. Dufour, A.; Ouartassi, B.; Bounaceur, R.; Zoulalian, A. Modelling intra-particle phenomena of biomass pyrolysis. Chem. Eng. Res. Des. 2011, 89, 2136–2146. [Google Scholar] [CrossRef]
  5. Anca-Couce, A. Reaction mechanisms and multi-scale modelling of lignocellulosic biomass pyrolysis. Prog. Energy Combust. Sci. 2016, 53, 41–79. [Google Scholar] [CrossRef]
  6. Debiagi, P.; Gentile, G.; Cuoci, A.; Frassoldati, A.; Ranzi, E.; Faravelli, T. A predictive model of biochar formation and characterization. J. Anal. Appl. Pyrolysis 2018, 134, 326–335. [Google Scholar] [CrossRef]
  7. Jendoubi, N.; Broust, F.; Commandre, J.M.; Mauviel, G.; Sardin, M.; Lédé, J. Inorganics distribution in bio oils and char produced by biomass fast pyrolysis: The key role of aerosols. J. Anal. Appl. Pyrolysis 2011, 92, 59–67. [Google Scholar] [CrossRef]
  8. Teixeira, A.R.; Mooney, K.G.; Kruger, J.S.; Williams, C.L.; Suszynski, W.J.; Schmidt, L.D.; Schmidt, D.P.; Dauenhauer, P.J. Aerosol generation by reactive boiling ejection of molten cellulose. Energy Environ. Sci. 2011, 4, 4306–4321. [Google Scholar] [CrossRef]
  9. Trubetskaya, A.; Surup, G.; Shapiro, A.; Bates, R.B. Modeling the influence of potassium content and heating rate on biomass pyrolysis. Appl. Energy 2017, 194, 199–211. [Google Scholar] [CrossRef]
  10. Garcia-Perez, M.; Wang, S.; Shen, J.; Rhodes, M.; Lee, W.J.; Li, C.-Z. Effects of Temperature on the Formation of Lignin-Derived Oligomers during the Fast Pyrolysis of Mallee Woody Biomass. Energy Fuels 2008, 22, 2022–2032. [Google Scholar] [CrossRef]
  11. Iisa, K.; Johansson, A.C.; Pettersson, E.; French, R.J.; Orton, K.A.; Wiinikka, H. Chemical and physical characterization of aerosols from fast pyrolysis of biomass. J. Anal. Appl. Pyrolysis 2019, 142, 104606. [Google Scholar] [CrossRef]
  12. Haseli, Y.; Van Oijen, J.A.; De Goey, L.P.H. Predicting the pyrolysis of single biomass particles based on a time and space integral method. J. Anal. Appl. Pyrolysis 2012, 96, 126–138. [Google Scholar] [CrossRef]
  13. Lu, H.; Ip, E.; Scott, J.; Foster, P.; Vickers, M.; Baxter, L.L. Effects of particle shape and size on devolatilization of biomass particle. Fuel 2010, 89, 1156–1168. [Google Scholar] [CrossRef]
  14. Babu, B.V.; Chaurasia, A.S. Pyrolysis of biomass: Improved models for simultaneous kinetics and transport of heat. mass and momentum. Energy Convers. Manag. 2004, 45, 1297–1327. [Google Scholar] [CrossRef]
  15. Sharma, A.; Pareek, V.; Zhang, D. Multi-Scale Modelling of Biomass Pyrolysis Processes. In Computer Aided Chemical Engineering; Bogle, I.D.L., Fairweather, M.B.T.-C.A.C.E., Eds.; Elsevier: Amsterdam, The Netherlands, 2012; pp. 1133–1137. [Google Scholar]
  16. Di Blasi, C. Modeling Intra- and Extra-Particle Processes of Wood Fast Pyrolysis. AIChE J. 2002, 48, 2386–2397. [Google Scholar] [CrossRef]
  17. Blondeau, J.; Jeanmart, H. Biomass pyrolysis at high temperatures: Prediction of gaseous species yields from an anisotropic particle. Biomass Bioenergy 2012, 41, 107–121. [Google Scholar] [CrossRef]
  18. Anca-Couce, A.; Scharler, R. Modelling heat of reaction in biomass pyrolysis with detailed reaction schemes. Fuel 2017, 206, 572–579. [Google Scholar] [CrossRef]
  19. Shi, X.; Ronsse, F.; Pieters, J.G. Finite element modeling of intraparticle heterogeneous tar conversion during pyrolysis of woody biomass particles. Fuel Process. Technol. 2016, 148, 302–316. [Google Scholar] [CrossRef]
  20. Montoya, J.; Pecha, B.; Chejne, F.; Garcia-Perez, M. Single particle model for biomass pyrolysis with bubble formation dynamics inside the liquid intermediate and its contribution to aerosol formation by thermal ejection. J. Anal. Appl. Pyrolysis 2017, 124, 204–218. [Google Scholar] [CrossRef]
  21. Sánchez, M.A.; Maya, J.C.; Pecha, B.; Chejne, F.; Quinchía, A. Effect of particle characteristics, kinetics and transport phenomena on the prediction of particle mass loss and products yields during biomass fast pyrolysis. J. Anal. Appl. Pyrolysis 2022, 168, 105786. [Google Scholar] [CrossRef]
  22. Smoluchowski, M.V. Drei Vortrage uber Diffusion, Brownsche Bewegung und Koagulation von Kolloidteilchen. Z. Fur Phys. 1916, 17, 557–585. [Google Scholar]
  23. Ramkrishna, D. Population Balances: Theory and Applications to Particulate Systems in Engineering, 1st ed.; Elsevier: Amsterdam, The Netherlands, 2000. [Google Scholar]
  24. Dauenhauer, P.J.; Colby, J.L.; Balonek, C.M.; Suszynski, W.J.; Schmidt, L.D. Reactive boiling of cellulose for integrated catalysis through an intermediate liquid. Green Chem. 2009, 11, 1555–1561. [Google Scholar] [CrossRef]
Figure 1. Schematic representation of the particle model [author’s own work].
Mathematics 12 00925 g001
Figure 2. Schematic representation of the model [author’s own work].
Mathematics 12 00925 g002
Figure 3. Location of nodes within the particle for the presentation of axial profiles.
Mathematics 12 00925 g003
Figure 4. Bubble concentration and bubble size dynamics (for a particle of 1 mm diameter and 4 mm long; h = 200 W/m2·K).
Mathematics 12 00925 g004
Figure 5. Aerosol ejection and aerosol size dynamics (for a particle of 1 mm diameter and 4 mm long; h = 200 W/m2·K).
Mathematics 12 00925 g005
Figure 6. Effect particle size and aspect ratio on particle average temperature evolution.
Mathematics 12 00925 g006
Figure 7. Effect particle size and aspect ratio on metaplast concentration.
Mathematics 12 00925 g007
Figure 8. Effect of particle size and aspect ratio on aerosol yield.
Mathematics 12 00925 g008
Table 1. Population balance parameters.
ParameterNomenclatureValueUnits
Number of aerosols per bubble N a N b 15 #     a e r o s o l s b u b b l e
Aerosol to bubble diameter ratio r a r b 0.20 μ m μ m
Aerosol matrix retention factor φ 0.4 #   r e t a i n e d   a e r o s o l s #   e j e c t e d   a e r o s o l s
Pre-exponential factor of nucleation rate constant k N 0 8 × 10²⁰ #   b u b b l e s m 3 · s
Bubble growth rate constant k G 0 8 × 10⁻¹⁷ m 6 k g
Bubble aggregation frequency a 1 × 10⁻¹⁴ m 3 s
Bubble bursting characteristic time τ b 0 6 × 10⁻⁴ s
Disclaimer/Publisher’s Note: The statements, opinions and data contained in all publications are solely those of the individual author(s) and contributor(s) and not of MDPI and/or the editor(s). MDPI and/or the editor(s) disclaim responsibility for any injury to people or property resulting from any ideas, methods, instructions or products referred to in the content.

