
Multi Objective and Multi-Product Perishable Supply Chain with Vendor-Managed Inventory and IoT-Related Technologies

 , and
, and
Abstract
:1. Introduction
- Introducing a novel nonlinear integer mathematical model for supply chain design, taking into account IoT-related technologies (RFID and WSN);
- Selecting the suitable technology between RFID and WSN for each level of the supply chain;
- Modeling the inventory management process in the supply chain using these technologies and implementing a vendor-managed inventory management policy;
- Considering simultaneous time and cost optimization in a real case of intelligent supply chain.
Motivation and Contribution
2. Literature Review
3. Model Assumptions and Notations
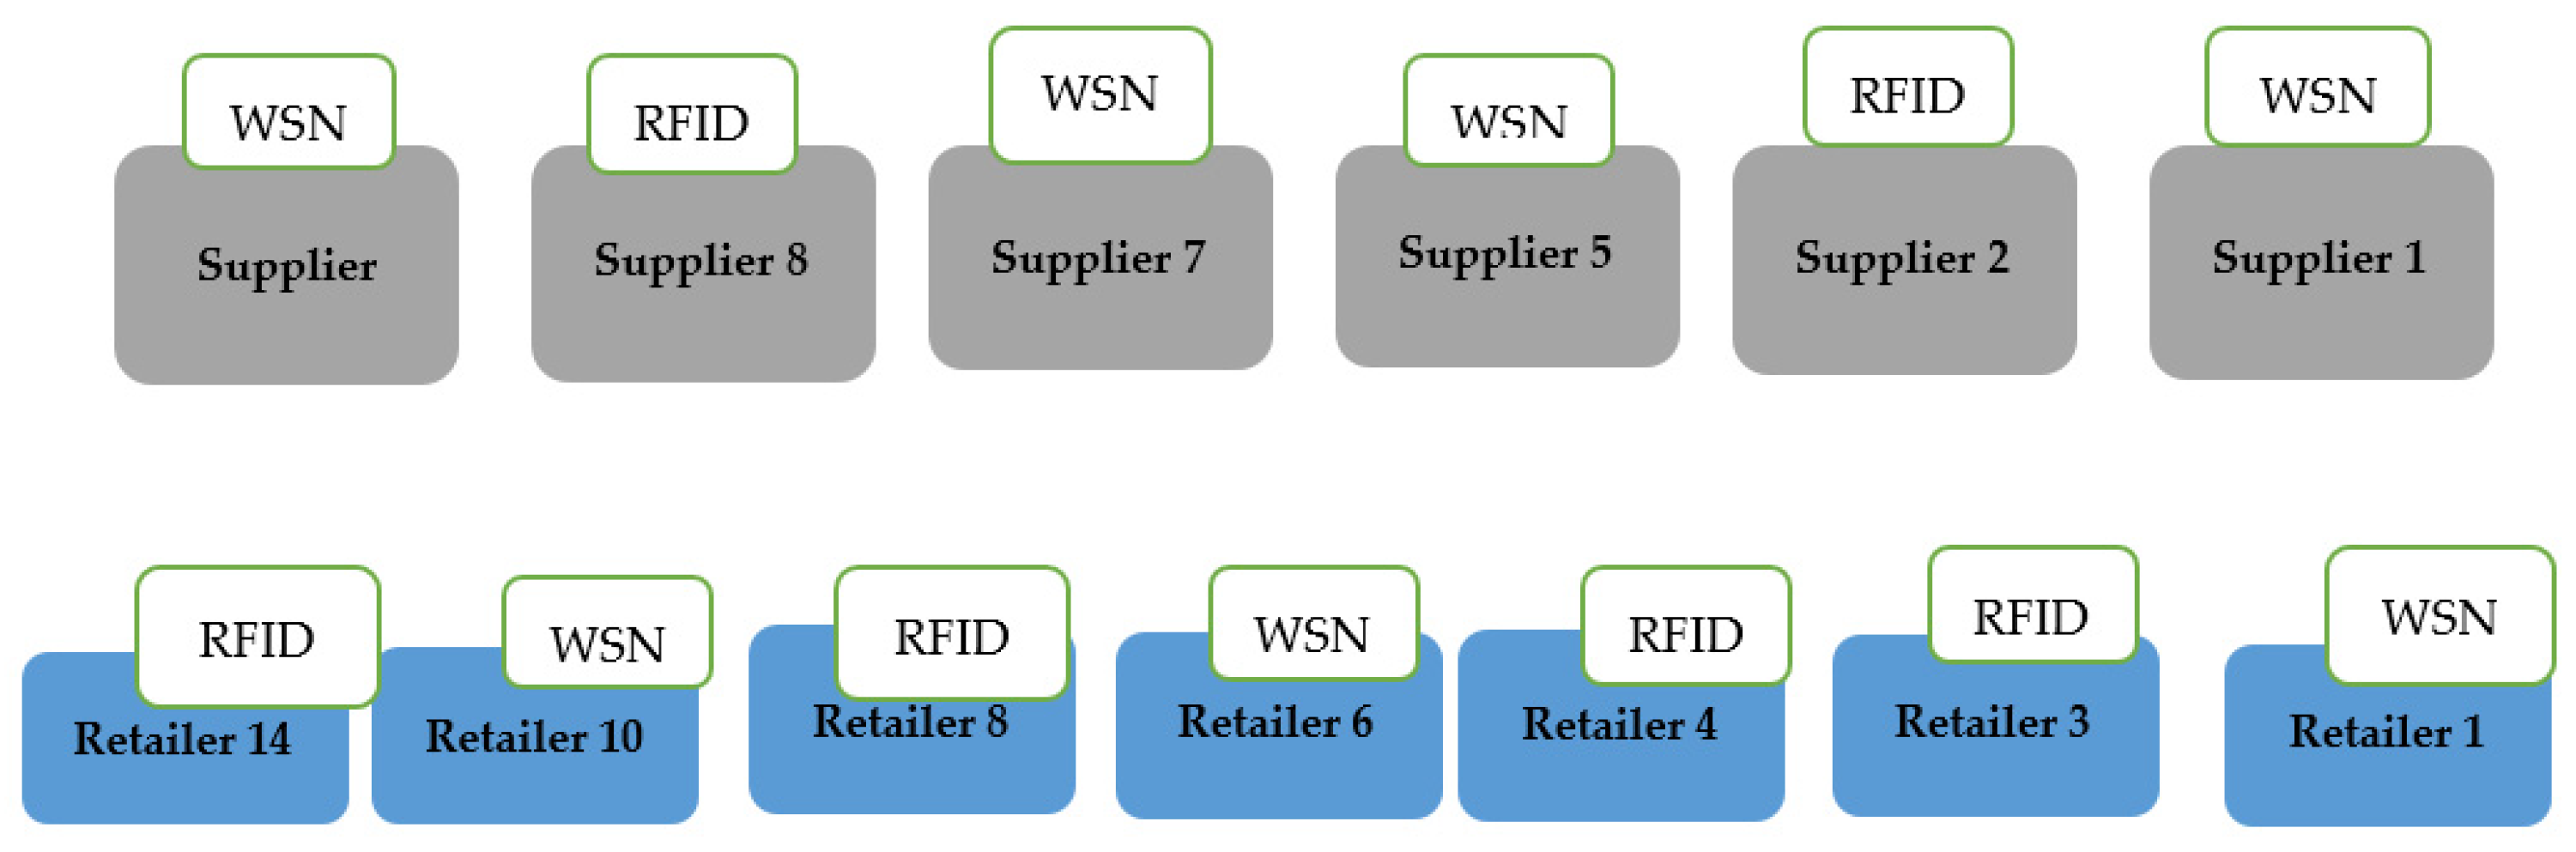
- IoT involves two technologies, RFID and WSN, but only one of these technologies is used at each node.
- There are multiple types of products and materials.
- The supply time of raw materials is influenced by the use of RFID or WSN technologies.
- The total cost includes the cost of establishing each node in the supply chain, blockchain implementation, RFID implementation, WSN implementation, and transportation among nodes.
- Delivery time is considered as the model’s secondary objective.
- The products are perishable.
- The conversion factor of raw materials to final products is assumed to equal 1.
- The model parameters are deterministic.
| Indices | |||||
| n | m | l | k | j | i |
| Raw materials | Product | Customer | Retailer | Manufacturer | Supplier |
4. Mathematical Model and Analysis
Objective Functions
5. Approach to Model Solution
5.1. Model Validation
| Types of raw materials | Types of products | No. of customers | No. of retailers | No. of manufacturers | No. of suppliers |
| 2 | 3 | 12 | 7 | 3 | 4 |
5.2. Sensitivity Analysis in Small Size
5.3. Parameter Tuning
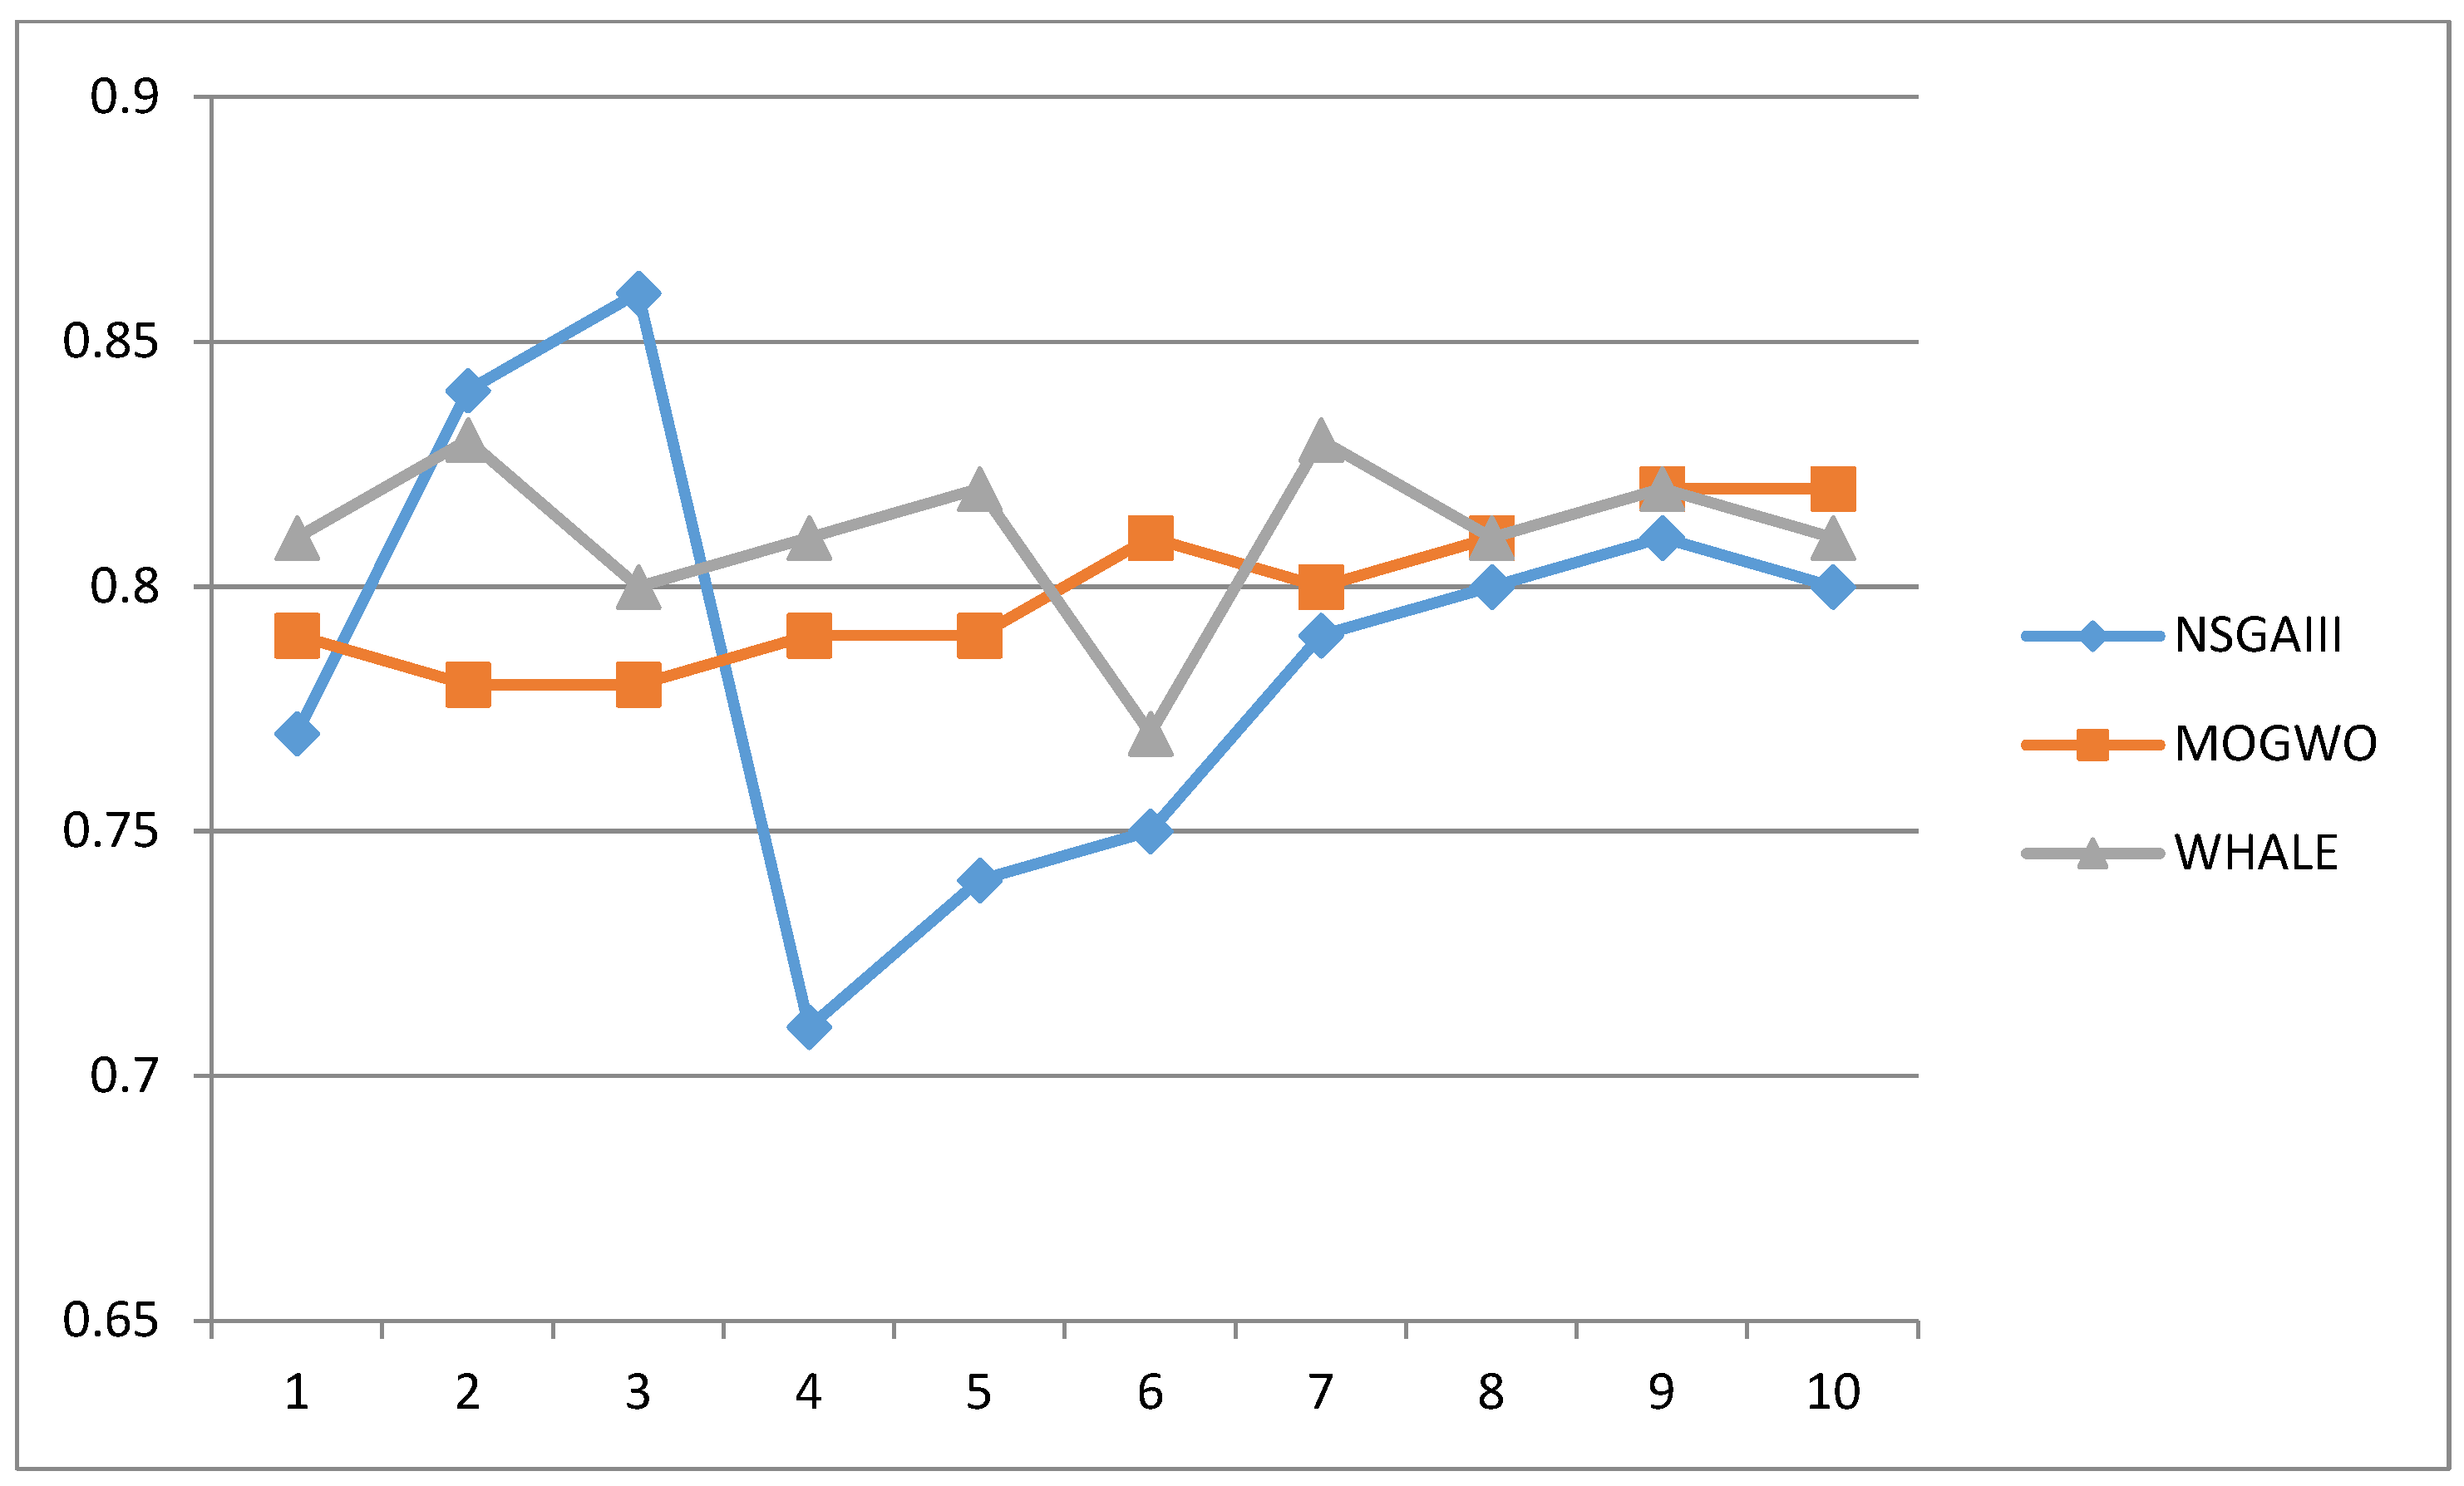
- Evidently, MOGWO generated the highest number of Pareto points, with NSGA-III closely following. The higher the number of Pareto points, the more efficient the algorithm is considered.
- In terms of distance to the ideal point, NSGA-III yielded the smallest distance to the ideal point, while the other two algorithms show relatively similar performance in this criterion.
- As for crowding distance, where smaller values indicate better efficiency, MOGWO achieved the smallest crowding distance. However, MOWOA yielded the shortest smalling distance in the third example.
- Computation time is another important criterion where lower values suggest that the algorithm is more suitable. MOGWO achieved the shortest computation time, followed closely by NSGA-III. MOWOA produced the highest computation time.
5.4. Results of Solving One of the Problems
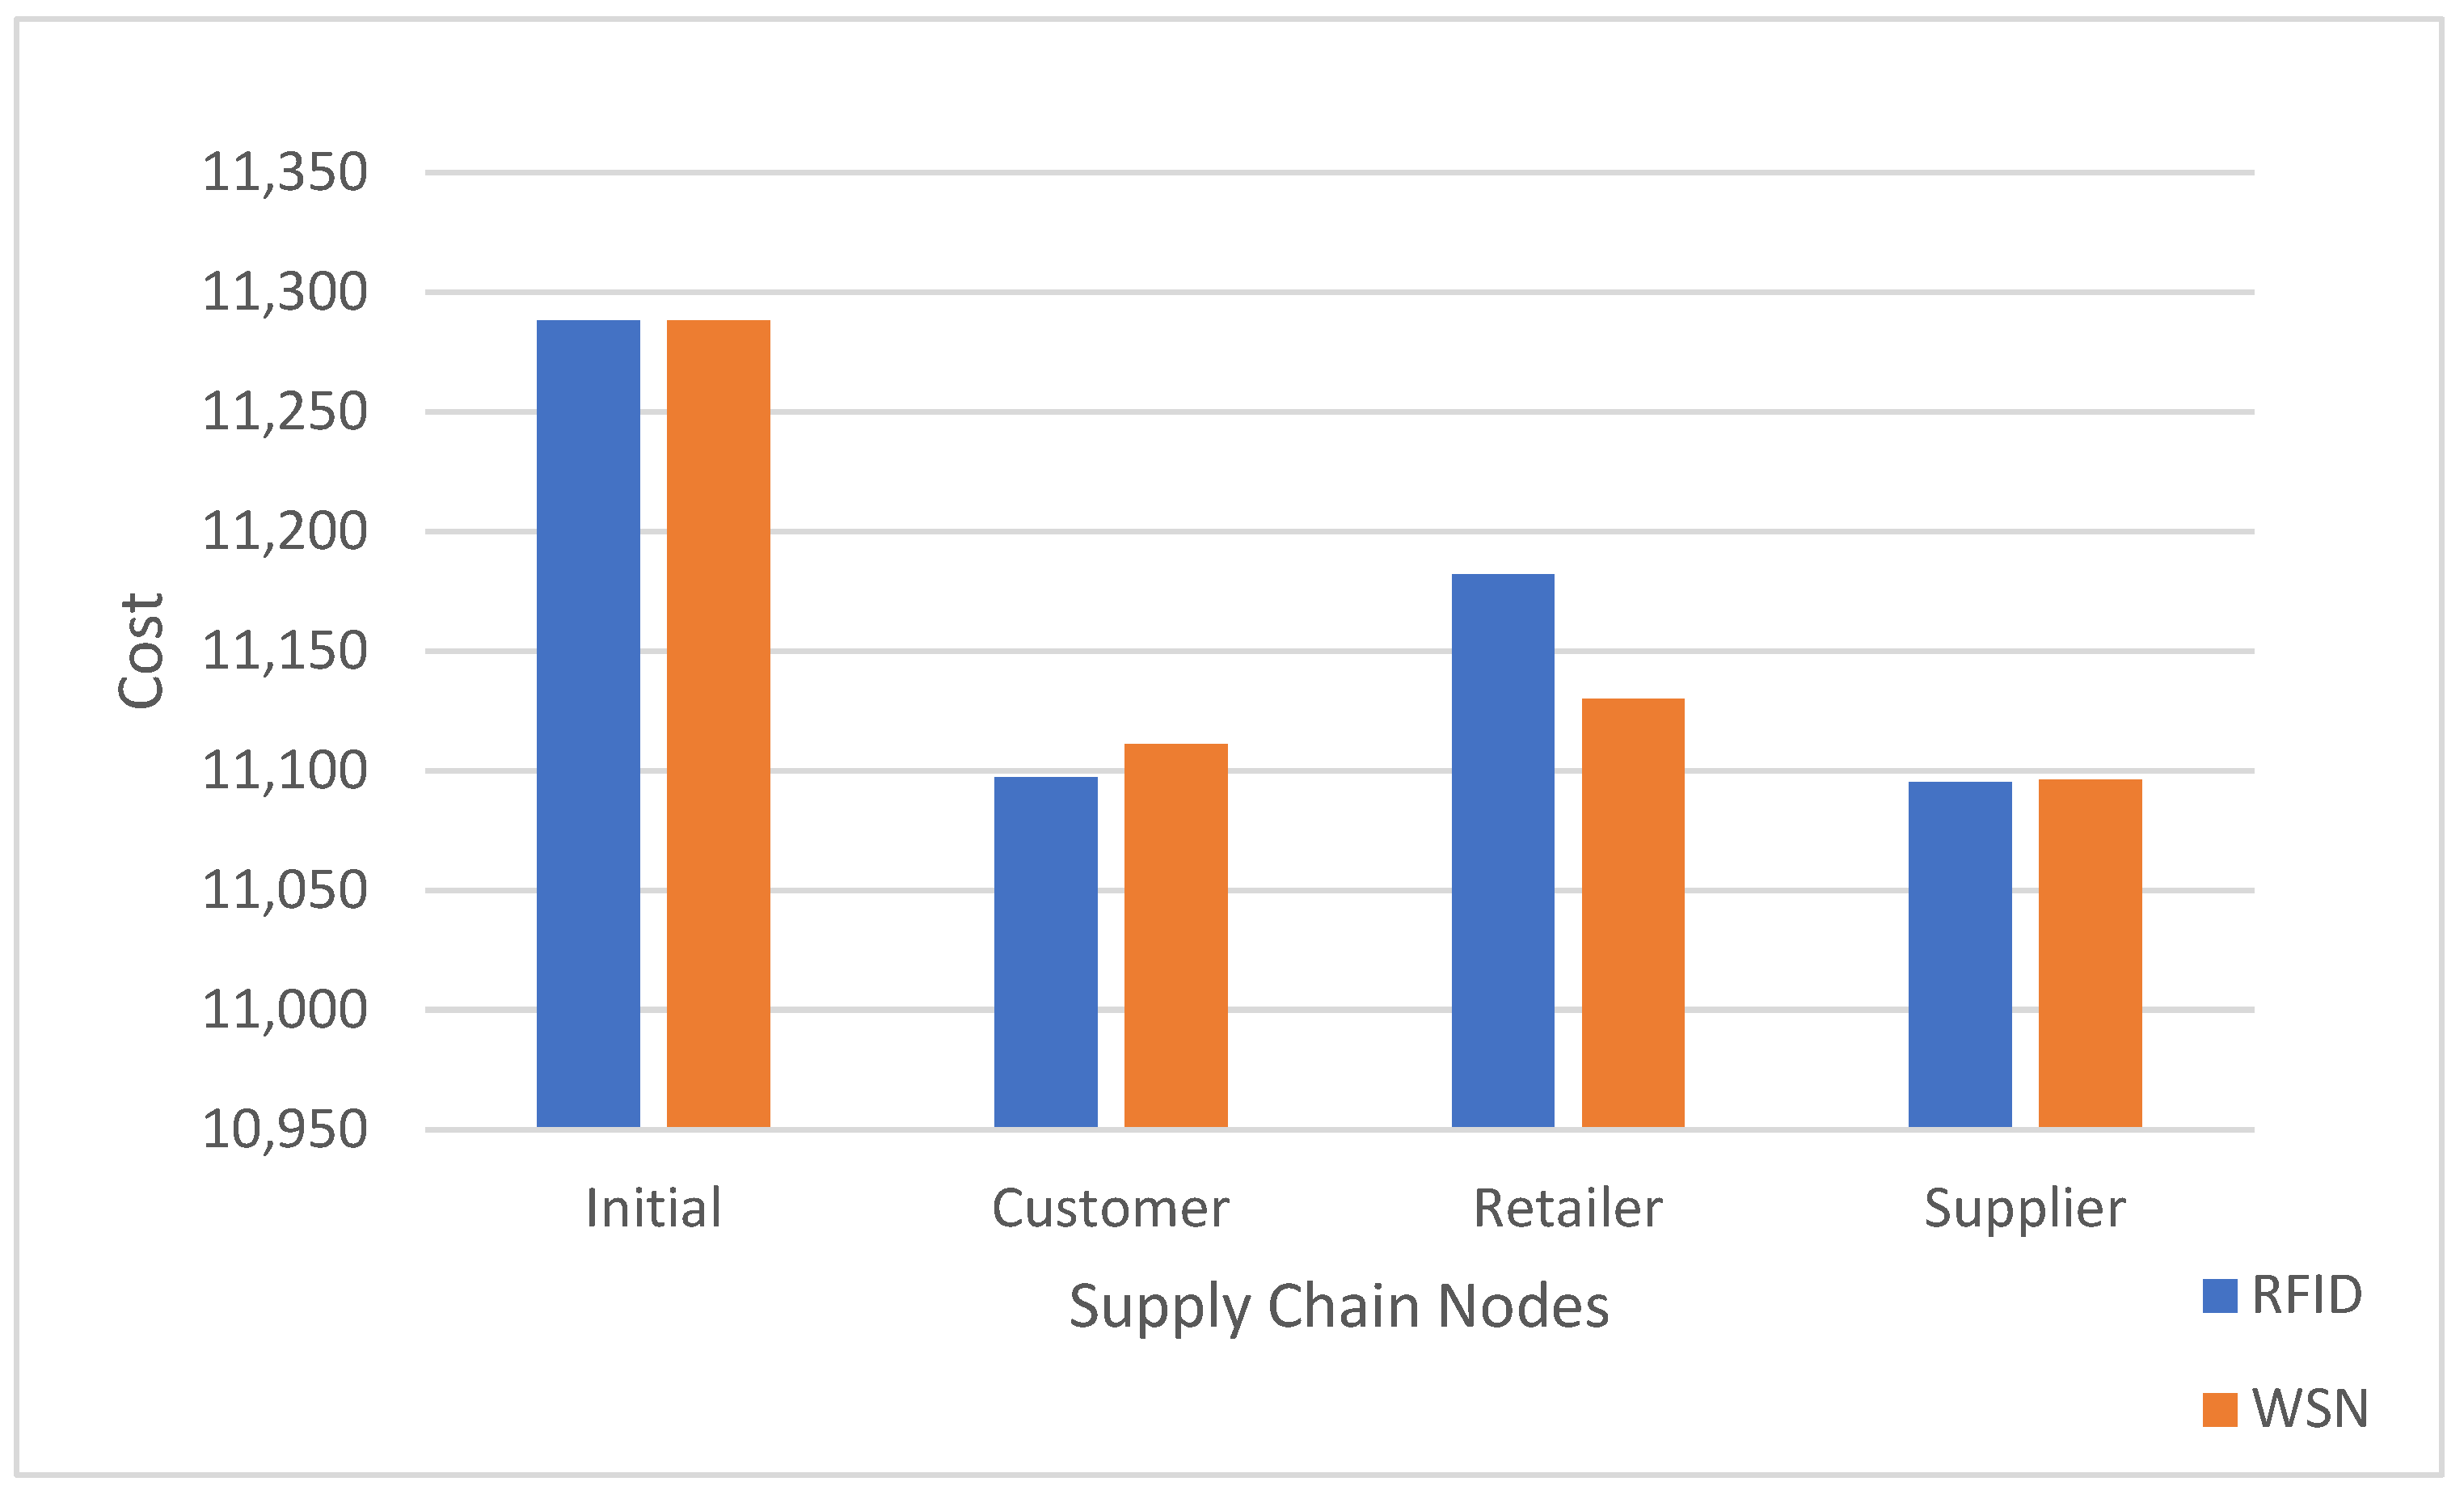
5.5. Analysis of the Impact of WSN and RFID
5.6. Analysis of the Impact of Blockchain
5.7. Analysis of the Impact of Online Sales
5.8. Comparison of the Results
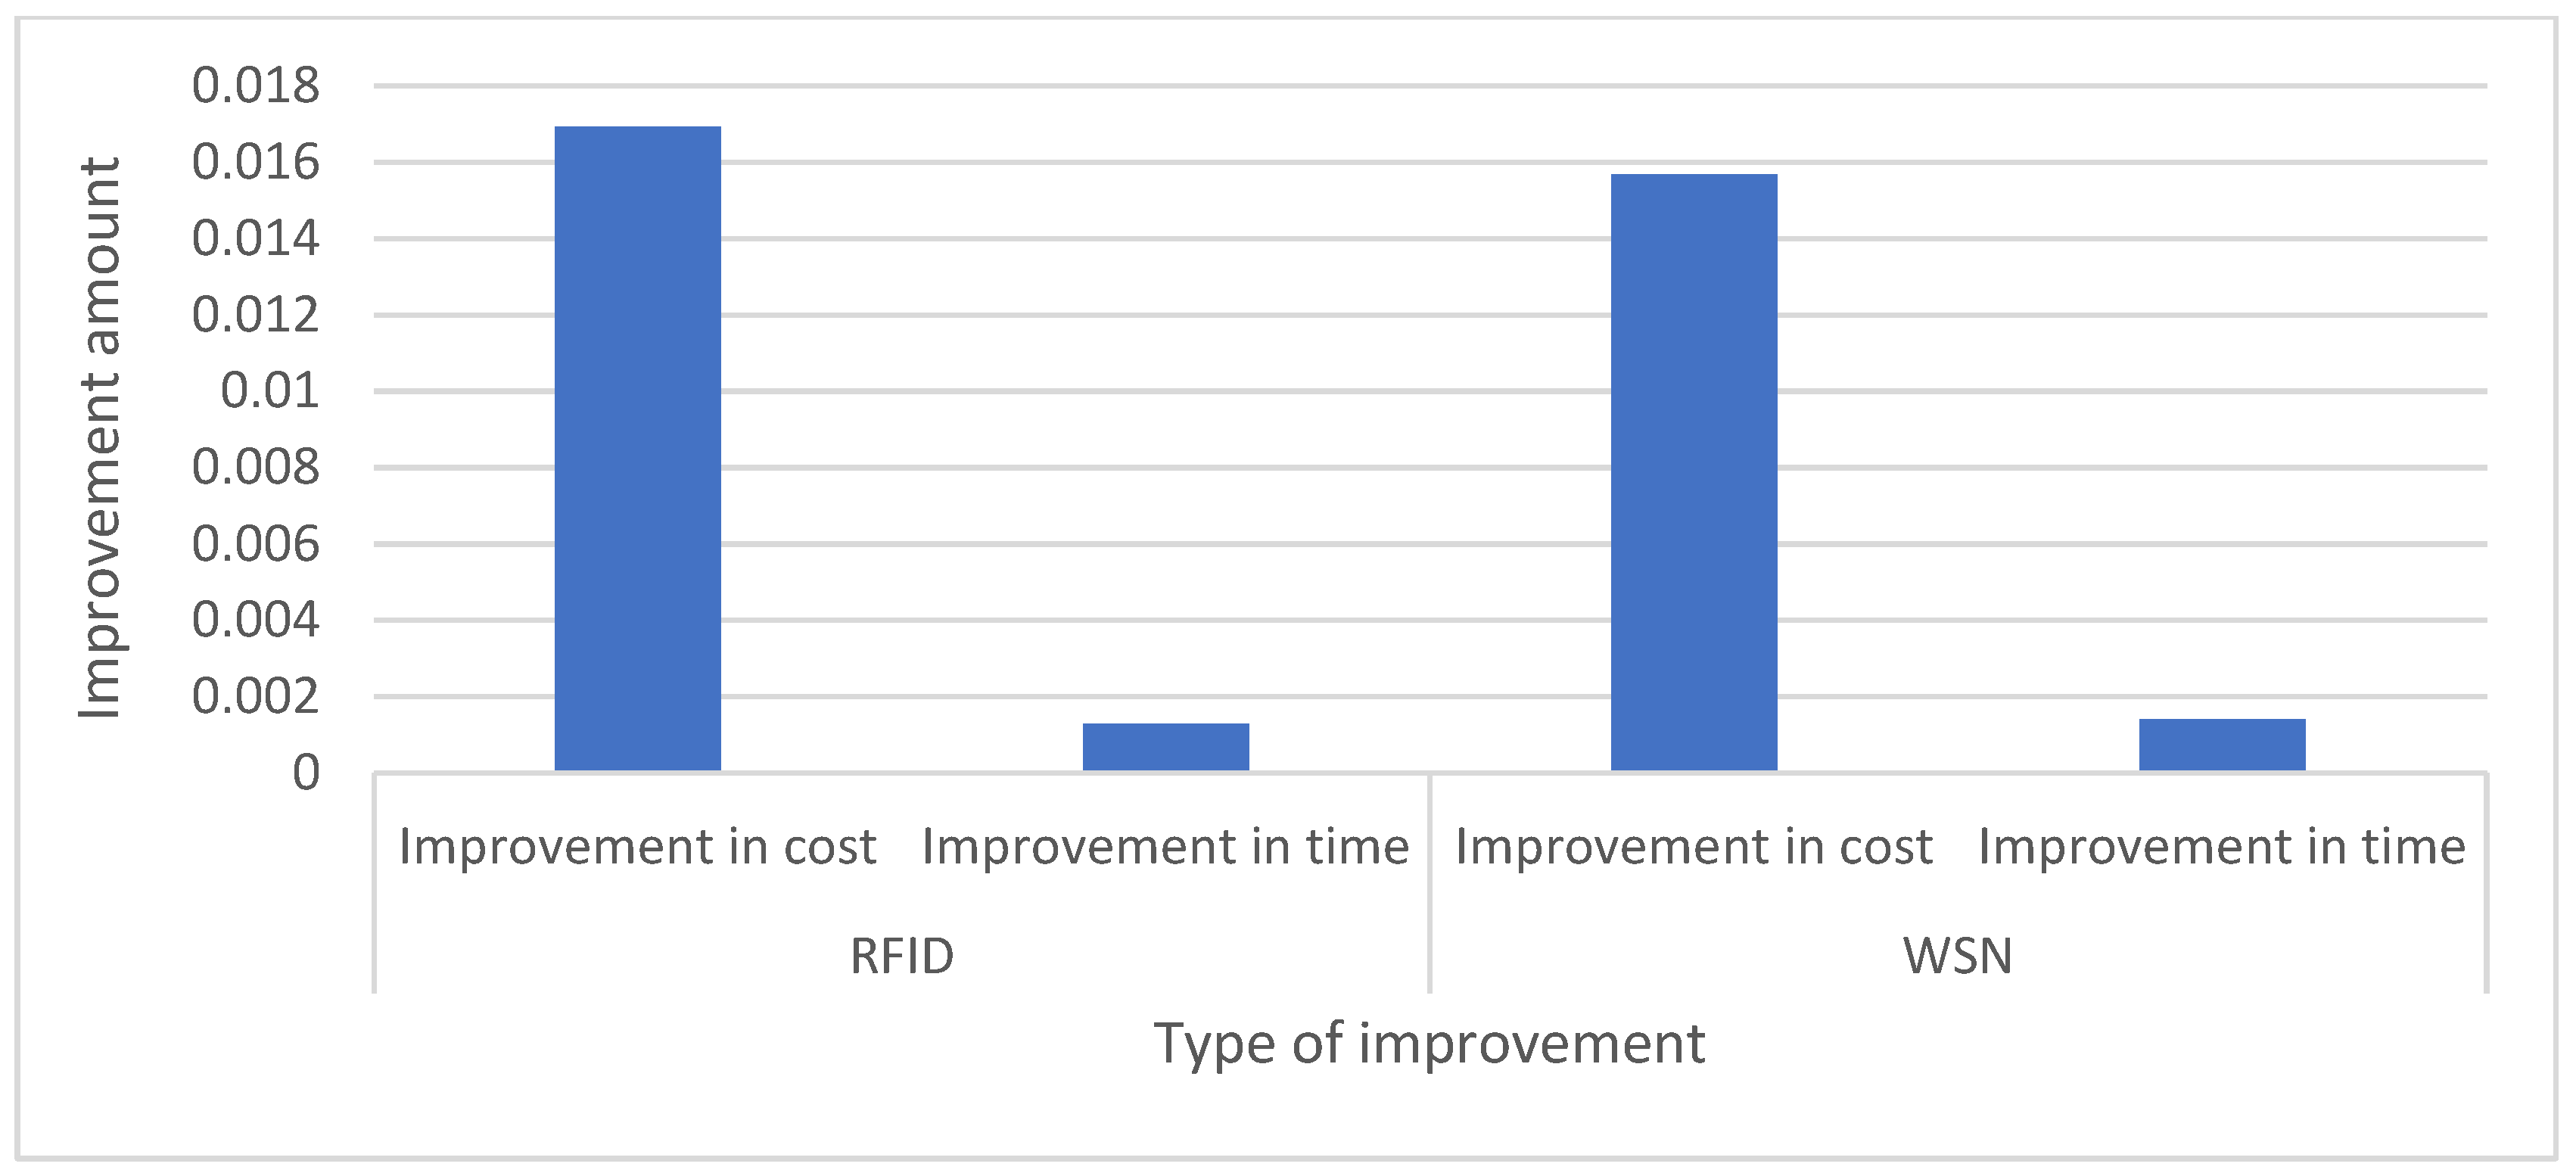
- The use of RFID at the customer and supplier levels resulted in a greater reduction in costs compared to WSN.
- For retailers, WSN was more effective in reducing the cost.
- The use of RFID at the retail and supplier levels led to a significant reduction in time.
- Overall, WSN had a more significant impact overall compared to RFID for customers; however, RFID had a more positive impact on time.
- Blockchain contributed to a significant reduction in costs for suppliers, manufacturers, and retailers.
- Blockchain significantly reduced the delivery times of retailers, manufacturers, and suppliers.
- Overall, blockchain had the greatest impact on manufacturers.
6. Conclusions
Author Contributions
Funding
Data Availability Statement
Acknowledgments
Conflicts of Interest
Abbreviations
| Customer demand for product m from retailer k | |
| Fixed cost of establishing supplier i | |
| Fixed cost of establishing factory j | |
| Fixed cost of establishing retailer k | |
| Cost of installing RFID technology at customer node l | |
| Cost of installing WSN technology at customer node l | |
| Cost of installing RFID technology at retailer node k | |
| Cost of installing WSN technology at retailer node k | |
| Capacity of supplier i for procuring material n | |
| Capacity of factory j for manufacturing product m | |
| Capacity of retailer k for product m | |
| Cost of purchasing factory j’s raw material n from supplier i | |
| Cost of purchasing factory j’s product m from retailer k | |
| Cost of purchasing product m from retailer k for customer l | |
| Delivery time of raw material n from supplier i to factory j | |
| Delivery time of product m from factory j to retailer k | |
| Delivery time of product m from retailer k to customer l | |
| Cost of transporting raw material n from supplier i to factory j | |
| Cost of transporting product m from factory j to retailer k | |
| Cost of transporting product m from retailer k to customer l | |
| Average procurement time of raw material n by supplier i for factory j without RFID | |
| Average procurement time of raw material n by supplier i for factory j with RFID | |
| Average procurement time of raw material n by supplier i for manufacturer j without WSN | |
| Average procurement time of raw material n by supplier i for manufacturer j with WSN | |
| Cost of implementing blockchain for supplier i | |
| Cost of implementing blockchain for factory j | |
| Cost of implementing blockchain for retailer k | |
| Cost of implementing online sales for retailer k | |
| Maximum inventory level of product m for retailer k | |
| Minimum inventory level of product m for retailer k |
Decision Variables
| A binary variable that equals 1 if supplier i is active; otherwise, 0 | |
| A binary variable that equals 1 if factory j is active; otherwise, 0 | |
| A binary variable that equals 1 if retailer k is active; otherwise, 0 | |
| A binary variable that equals 1 if supplier i delivers raw material n to factory j; otherwise, 0 | |
| A binary variable that equals 1 if factory j delivers product m to retailer k; otherwise, 0 | |
| A binary variable that equals 1 if retailer k delivers product m to customer l; otherwise, 0 | |
| A binary variable that equals 1 if RFID technology is installed at customer node l; otherwise, 0 | |
| A binary variable that equals 1 if WSN technology is used at customer node l; otherwise, 0 | |
| A binary variable that equals 1 if RFID technology is installed at retailer node k; otherwise, 0 | |
| A binary variable that equals 1 if WSN technology is used at retailer node k; otherwise, 0 | |
| A binary variable that equals 1 if RFID technology is installed at supplier node i; otherwise, 0 | |
| A binary variable that equals 1 if WSN technology is used at supplier node i; otherwise, 0 | |
| Quantity of raw material n transported from supplier i to factory j with blockchain | |
| Quantity of raw material n transported from supplier i to factory j without blockchain | |
| Quantity of product m transported from factory j to retailer k with blockchain | |
| Quantity of product m transported from factory j to retailer k without blockchain | |
| Quantity of product m transported from retailer k to customer l with blockchain | |
| Quantity of product m transported from retailer k to customer l without blockchain | |
| A binary variable that equals 1 if blockchain is used for supplier i; otherwise, 0 | |
| A binary variable that equals 1 if blockchain is used for factory j; otherwise, 0 | |
| A binary variable that equals 1 if blockchain is used for retailer k; otherwise, 0 | |
| A binary variable that equals 1 if online sales are used for retailer k; otherwise, 0 | |
| The sales quantity of product m through online sales for retailer k | |
| Inventory level of product m for retailer k | |
| Initial inventory level of product m for retailer k | |
| Optimal replenishment level of product m under VMI policy for retailer k |
References
- Abdel-Basset, M.; Manogaran, G.; Mohamed, M. Internet of Things (IoT) and its impact on supply chain: A framework for building smart, secure and efficient systems. Future Gener. Comput. Syst. 2018, 86, 614–628. [Google Scholar] [CrossRef]
- Yu, J.; Subramanian, N.; Ning, K.; Edwards, D. Product delivery service provider selection and customer satisfaction in the era of internet of things: A Chinese e-retailers’ perspective. Int. J. Prod. Econ. 2015, 159, 104–116. [Google Scholar] [CrossRef]
- Wang, T.; Zhang, Y.F.; Zang, D.X. Real-Time Visibility and Traceability Framework for Discrete Manufacturing Shopfloor. In Proceedings of the 22nd International Conference on Industrial Engineering and Engineering Management 2015; Qi, E., Shen, J., Dou, R., Eds.; Atlantis Press: Paris, France, 2016; pp. 763–772. [Google Scholar]
- Fang, C.; Liu, X.; Pardalos, P.M.; Pei, J. Optimization for a three-stage production system in the Internet of Things: Procurement, production and product recovery, and acquisition. Int. J. Adv. Manuf. Technol. 2016, 83, 689–710. [Google Scholar] [CrossRef]
- Leung, J.; Cheung, W.; Chu, S.-C. Aligning RFID applications with supply chain strategies. Inf. Manag. 2014, 51, 260–269. [Google Scholar] [CrossRef]
- Rejeb, A.; Simske, S.; Rejeb, K.; Treiblmaier, H.; Zailani, S. Internet of Things Re-search in Supply Chain Management and Logistics: A Bibliometric Analysis. Internet Things 2020, 12, 100318. [Google Scholar] [CrossRef]
- Ng, I.C.L.; Wakenshaw, S.Y.L. The Internet-of-Things: Review and research directions. Int. J. Res. Mark. 2017, 34, 3–21. [Google Scholar] [CrossRef]
- Feng, H.; Wang, X.; Duan, Y.; Zhang, J.; Zhang, X. Applying blockchain technology to improve agri-food traceability: A review of development methods, benefits and challenges. J. Clean. Prod. 2020, 260, 121031. [Google Scholar] [CrossRef]
- Aung, M.M.; Chang, Y.S. Traceability in a food supply chain: Safety and quality perspectives. Food Control. 2014, 39, 172–184. [Google Scholar] [CrossRef]
- Bandyopadhyay, D.; Sen, J. Internet of Things: Applications and Challenges in Technology and Standardization. Wirel. Pers. Commun. 2011, 58, 49–69. [Google Scholar] [CrossRef]
- Macaulay, T. Understanding and Managing Risks and the Internet of Things, RIoT Control; Morgan Kaufmann: San Francisco, CA, USA, 2016. [Google Scholar]
- Christopher, M. The Agile Supply Chain. Ind. Mark. Manag. 2000, 29, 37–44. [Google Scholar] [CrossRef]
- Greengard, S. Putting the Internet of Things to Work. In The Internet of Things; MIT Press: Cambridge, MA, USA, 2015; pp. 111–134. Available online: https://ieeexplore.ieee.org/document/7087520 (accessed on 1 January 2015).
- Lee, I.; Lee, K. The Internet of Things (IoT): Applications, Investments, and Challenges for Enterprises. Bus. Horiz. 2015, 58, 431–440. Available online: https://linkinghub.elsevier.com/retrieve/pii/S0007681315000373 (accessed on 1 July 2015). [CrossRef]
- Fleisch, E. What Is the Internet of Things An Economic Perspective. Econ. Manag. Financ. Mark. 2010, 5, 125–157. [Google Scholar]
- Tavan, F.; Sajadi, S.M. Determination of optimum of production rate of Network failure-prone manufacturing systems with perishable items using discrete event simulation and Taguchi design of experiment. Asian J. Res. Bus. Econ. Manag. 2015, 5, 126–139. [Google Scholar] [CrossRef]
- Yerpude, S.; Singhal, T.K. Augmentation of effectiveness of vendor managed inventory (VMI) operations with IoT Data—A research perspective. Int. J. Appl. Bus. Econ. Res. 2017, 15, 469–482. [Google Scholar]
- Chen, Q.; Adey, B.T.; Haas, C.; Hall, D.M. Using look-ahead plans to improve material flow processes on construction projects when using BIM and RFID technologies. Constr. Innov. 2020, 20, 471–508. [Google Scholar] [CrossRef]
- Rayes, A.; Salam, S. The Things in IoT: Sensors and Actuators. In Internet of Things from Hype to Reality: The Road to Digitization; Springer International Publishing: Cham, Switzerland, 2022; pp. 63–82. [Google Scholar] [CrossRef]
- Chen, Y.; Chen, G. Optimization of the Intelligent Asset Management System Based on WSN and RFID Technology. J. Sens. 2022, 2022, 3436530. [Google Scholar] [CrossRef]
- Saberi, S.; Kouhizadeh, M.; Sarkis, J. Blockchains and the Supply Chain: Findings from a Broad Study of Practitioners. IEEE Eng. Manag. Rev. 2019, 47, 95–103. [Google Scholar] [CrossRef]
- Harrison, M. The ‘Internet of Things’ and Commerce. XRDS 2011, 17, 19–22. [Google Scholar] [CrossRef]
- Shen, G.; Liu, B. Research on Application of Internet of Things in Electronic Commerce. In Proceedings of the Third International Symposium on Electronic Commerce and Security, Guangzhou, China, 29–31 July 2010; pp. 13–16. [Google Scholar]
- Hatami-Marbini, A.; Sajadi, S.M.; Malekpour, H. Optimal control and simulation for production planning of network failure-prone manufacturing systems with perishable goods. Comput. Ind. Eng. 2020, 146, 106614. [Google Scholar] [CrossRef]
- Malekpour, H.; Sajadi, S.M.; Vahdani, H. Using discrete-event simulation and the Taguchi method for optimising the production rate of network failure-prone manufacturing systems with perishable goods. Int. J. Serv. Oper. Manag. 2016, 23, 387–406. [Google Scholar] [CrossRef]
- Garrido-Hidalgo, C.; Olivares, T.; Ramirez, F.J.; Roda-Sanchez, L. An End-to-End Internet of Things Solution for Reverse Supply Chain Management in Industry 4.0. Comput. Ind. 2019, 112, 103127. [Google Scholar] [CrossRef]
- Xu, L.D.; He, W.; Li, S. Internet of Things in Industries: A Survey. IEEE Trans. Ind. Inform. 2014, 10, 2233–2243. [Google Scholar] [CrossRef]
- Lee, C.; Lv, Y.; Ng, K.; Ho, W.; Choy, K. Design and application of Internet of things-based warehouse management system for smart logistics. Int. J. Prod. Res. 2018, 56, 2753–2768. [Google Scholar] [CrossRef]
- Tsang, Y.P.; Wu, C.H.; Lam, H.Y.; Choy, K.L.; Ho, G.T.S. Integrating Internet of Things and multi-temperature delivery planning for perishable food E-commerce logistics: A model and application. Int. J. Prod. Res. 2021, 59, 1534–1556. [Google Scholar] [CrossRef]
- Zhu, Q.; Kouhizadeh, M. Blockchain Technology, Supply Chain Information, and Strategic Product Deletion Management. IEEE Eng. Manag. Rev. 2019, 47, 36. [Google Scholar] [CrossRef]
- Cai, S.; Wang, X.; Zhao, Y. Revenue Model of Supply Chain by Internet of Things Technology. IEEE Access 2019, 7, 4091–4100. [Google Scholar]
- Tian, F. An Agri-Food Supply Chain Traceability System for China Based on RFID Amp; Blockchain Technology. In Proceedings of the 2016 13th International Conference on Service Systems and Service Management (ICSSSM), Kunming, China, 24–26 June 2016; pp. 1–6. [Google Scholar]
- Tan, W.C.; Sidhu, M.S. Review of RFID and IoT Integration in Supply Chain Management. Oper. Res. Perspect. 2022, 9, 100229. Available online: https://www.sciencedirect.com/science/article/pii/S2214716022000070 (accessed on 1 January 2022). [CrossRef]
- Francisco, K.; Swanson, D. The Supply Chain Has No Clothes: Technology Adoption of Blockchain for Supply Chain Transparency. Logistics 2018, 2, 2. [Google Scholar] [CrossRef]
- Mohammadi, T.; Sajadi, S.M.; Najafi, S.E.; Taghizadeh Yazdi, M. Optimizing Smart Supply Chain with Vendor Managed Inventory through the Internet of Things. Ind. Manag. J. 2022, 14, 458–483. [Google Scholar]
- Singh, S.; Kumar, M.; Verma, O.P.; Kumar, R.; Gill, S.S. An IIoT based secure and sustainable smart supply chain system using sensor networks. Trans. Emerg. Telecommun. Technol. 2023, 34, e4681. [Google Scholar] [CrossRef]
- Singh, A.K.; Raza, Z. A framework for IoT and blockchain based smart food chain management system. Concurr. Comput. Pract. Exp. 2023, 35, e7526. [Google Scholar] [CrossRef]
- Alabi, M.O.; Ngwenyama, O. Food security and disruptions of the global food supply chains during COVID-19: Building smarter food supply chains for post COVID-19 era. Br. Food J. 2023, 125, 167–185. [Google Scholar] [CrossRef]
- Nanda, S.K.; Panda, S.K.; Dash, M. Medical supply chain integrated with blockchain and IoT to track the logistics of medical products. Multimed. Tools Appl. 2023, 82, 32917–32939. [Google Scholar] [CrossRef]
- Khan, Y.; Su’ud, M.B.M.; Alam, M.M.; Ahmad, S.F.; Ahmad, A.Y.A.B.; Khan, N. Application of Internet of Things (IoT) in Sustainable Supply Chain Management. Sustainability 2023, 15, 694. [Google Scholar] [CrossRef]
- Hu, H.; Xu, J.; Liu, M.; Lim, M.K. Vaccine supply chain management: An intelligent system utilizing blockchain, IoT and machine learning. J. Bus. Res. 2023, 156, 113480. [Google Scholar] [CrossRef]
- Jayashri, N.; Rampur, V.; Gangodkar, D.; Abirami, M.; Balarengadurai, C.; Kumar, A. Improved block chain system for high secured IoT integrated supply chain. Meas. Sens. 2023, 25, 100633. [Google Scholar] [CrossRef]
- Mantravadi, S.; Srai, J.S. How Important are Digital Technologies for Urban Food Security? A Framework for Supply Chain Integration using IoT. Procedia Comput. Sci. 2023, 217, 1678–1687. [Google Scholar] [CrossRef]
- Nagarajan, S.M.; Deverajan, G.G.; Chatterjee, P.; Alnumay, W.; Muthukumaran, V. Integration of IoT based routing process for food supply chain management in sustainable smart cities. Sustain. Cities Soc. 2022, 76, 103448. [Google Scholar] [CrossRef]
- Bhat, S.A.; Huang, N.-F.; Sofi, I.B.; Sultan, M. Agriculture-Food Supply Chain Management Based on Blockchain and IoT: A Narrative on Enterprise Blockchain Interoperability. Agriculture 2022, 12, 40. [Google Scholar] [CrossRef]
- Santhi, A.R.; Muthuswamy, P. Influence of Blockchain Technology in Manufacturing Supply Chain and Logistics. Logistics 2022, 6, 15. [Google Scholar] [CrossRef]
- Kaur, A.; Singh, G.; Kukreja, V.; Sharma, S.; Singh, S.; Yoon, B. Adaptation of IoT with Blockchain in Food Supply Chain Management: An Analysis-Based Review in Development, Benefits and Potential Applications. Sensors 2022, 22, 8174. [Google Scholar] [CrossRef]
- Kumar, S.; Raut, R.D.; Agrawal, N.; Cheikhrouhou, N.; Sharma, M.; Daim, T. Integrated blockchain and internet of things in the food supply chain: Adoption barriers. Technovation 2022, 118, 102589. [Google Scholar] [CrossRef]
- Kavisankar, L.; Sivakumar, V.; Balachander, T.; Mukesh Krishnan, M.B.; Deeban Chakravarthy, V.; Selvin Paul Peter, J.; Balasubramani, S. An Efficient Trust-Based Supply Chain Management Framework Utilizing the Internet of Things and Blockchain Technology. In Implementing and Leveraging Blockchain Programming; Rawal, B.S., Manogaran, G., Poongodi, M., Eds.; Springer Nature: Singapore, 2022; pp. 149–160. [Google Scholar] [CrossRef]
- Srivastava, A.; Dashora, K. Application of blockchain technology for agrifood supply chain management: A systematic literature review on benefits and challenges. Benchmarking Int. J. 2022, 29, 3426–3442. [Google Scholar] [CrossRef]
- Ali, S.B. Industrial Revolution 4.0 and Supply Chain Digitization. South Asian J. Soc. Rev. 2022, 1, 21–41. [Google Scholar] [CrossRef]
- Zhu, X.N.; Peko, G.; Sundaram, D.; Piramuthu, S. Blockchain-Based Agile Supply Chain Framework with IoT. Inf. Syst. Front. 2021, 24, 563–578. [Google Scholar] [CrossRef]
- Xu, W.; Zhang, Z.; Wang, H.; Yi, Y.; Zhang, Y. Optimization of monitoring network system for Eco safety on Internet of Things platform and environmental food supply chain. Comput. Commun. 2020, 151, 320–330. [Google Scholar] [CrossRef]
- Bai, C.; Sarkis, J. A Supply Chain Transparency and Sustainability Technology Appraisal Model for Blockchain Technology. Int. J. Prod. Res. 2020, 58, 2142–2162. [Google Scholar] [CrossRef]
- Jiang, W. An Intelligent Supply Chain Information Collaboration Model Based on Internet of Things and Big Data. IEEE Access 2019, 7, 58324–58335. [Google Scholar] [CrossRef]
- Rejeb, A.; Keogh, J.G.; Treiblmaier, H. Leveraging the Internet of Things and Blockchain Technology in Supply Chain Management. Futur. Internet 2019, 11, 161. [Google Scholar] [CrossRef]
- Pundir, A.K.; Jagannath, J.D.; Chakraborty, M.; Ganpathy, L. Technology Integration for Improved Performance: A Case Study in Digitization of Supply Chain with Integration of Internet of Things and Blockchain Technology. In Proceedings of the 2019 IEEE 9th Annual Computing and Communication Workshop and Conference (CCWC), Las Vegas, NV, USA, 7–9 January 2019; pp. 170–176. [Google Scholar] [CrossRef]
- Mohan, T. Improve Food Supply Chain Traceability Using Blockchain. Master’s Thesis, College of Engineering, The Graduate School, The Pennsylvania State University, State College, PA, USA, 2018. [Google Scholar]
- Mirjalili, S.; Saremi, S.; Mirjalili, S.M.; Coelho, L.D.S. Multi-objective grey wolf optimizer: A novel algorithm for multi-criterion optimization. Expert Syst. Appl. 2016, 47, 106–119. [Google Scholar] [CrossRef]
- Bhesdadiya, R.H.; Trivedi, I.N.; Jangir, P.; Jangir, N.; Kumar, A. An NSGA-III algorithm for solving multi-objective economic/environmental dispatch problem. Cogent Eng. 2016, 3, 1269383. [Google Scholar] [CrossRef]
- Kumawat, I.R.; Nanda, S.J.; Maddila, R.K. Multi-objective whale optimization. In Proceedings of the TENCON 2017—2017 IEEE Region 10 Conference, Penang, Malaysia, 5–8 November 2017; pp. 2747–2752. [Google Scholar]
- Mirjalili, S.; Mirjalili, S.M.; Lewis, A. Grey Wolf Optimizer. Adv. Eng. Softw. 2014, 69, 46–61. [Google Scholar] [CrossRef]


| Reference Number | Features | ||||||||
|---|---|---|---|---|---|---|---|---|---|
| Multi-Objective | Perishability | IoT | Blockchain | Online Sales | Mathematical Modeling | ||||
| Cost | Time | ||||||||
| 1 | [36] | * | * | * | * | ||||
| 2 | [37] | * | * | * | * | ||||
| 3 | [38] | * | * | * | |||||
| 4 | [39] | * | * | * | * | * | |||
| 5 | [40] | * | * | * | |||||
| 6 | [41] | * | * | * | |||||
| 7 | [42] | * | * | ||||||
| 8 | [43] | * | * | * | |||||
| 9 | [44] | * | * | * | |||||
| 10 | [33] | * | * | ||||||
| 11 | [45] | * | * | * | * | ||||
| 12 | [46] | * | * | ||||||
| 13 | [47] | * | * | ||||||
| 14 | [48] | * | * | * | |||||
| 15 | [49] | * | * | ||||||
| 16 | [50] | * | * | * | * | * | |||
| 17 | [51] | * | * | * | |||||
| 18 | [52] | * | * | ||||||
| 19 | [53] | * | * | * | |||||
| 20 | [54] | * | * | * | |||||
| 21 | [55] | * | * | ||||||
| 22 | [56] | * | * | * | * | ||||
| 23 | [57] | * | * | ||||||
| 24 | [58] | * | * | * | * | ||||
| 25 | Present article | * | * | * | * | * | * | * | * |
| Z1 | Z2 |
|---|---|
| 14,383 | 19,618 |
| 13,989 | 14,387 |
| 13,106 | 19,835 |
| 14,118 | 19,630 |
| 13,923 | 19,678 |
| 13,615 | 19,725 |
| 13,626 | 19,737 |
| 13,425 | 19,741 |
| 13,234 | 19,802 |
| 14,006 | 19,648 |
| 13,354 | 19,775 |
| 13,335 | 19,790 |
| 13,153 | 19,832 |
| 13,695 | 19,698 |
| 14,383 | 19,618 |
| 13,989 | 14,387 |
| 13,110 | 19,835 |
| Problem | Supplier | Manufacturer | Retailer | Customer | Product | Raw Material |
|---|---|---|---|---|---|---|
| 1 | 3 | 2 | 5 | 10 | 2 | 2 |
| 2 | 3 | 2 | 6 | 11 | 2 | 2 |
| 3 | 3 | 2 | 6 | 11 | 3 | 2 |
| 4 | 3 | 2 | 6 | 12 | 3 | 2 |
| 5 | 4 | 2 | 6 | 12 | 3 | 2 |
| 6 | 4 | 2 | 7 | 12 | 3 | 2 |
| 7 | 4 | 3 | 7 | 12 | 3 | 2 |
| 8 | 4 | 3 | 7 | 13 | 3 | 2 |
| 9 | 4 | 3 | 7 | 13 | 4 | 2 |
| 10 | 5 | 3 | 7 | 13 | 4 | 2 |
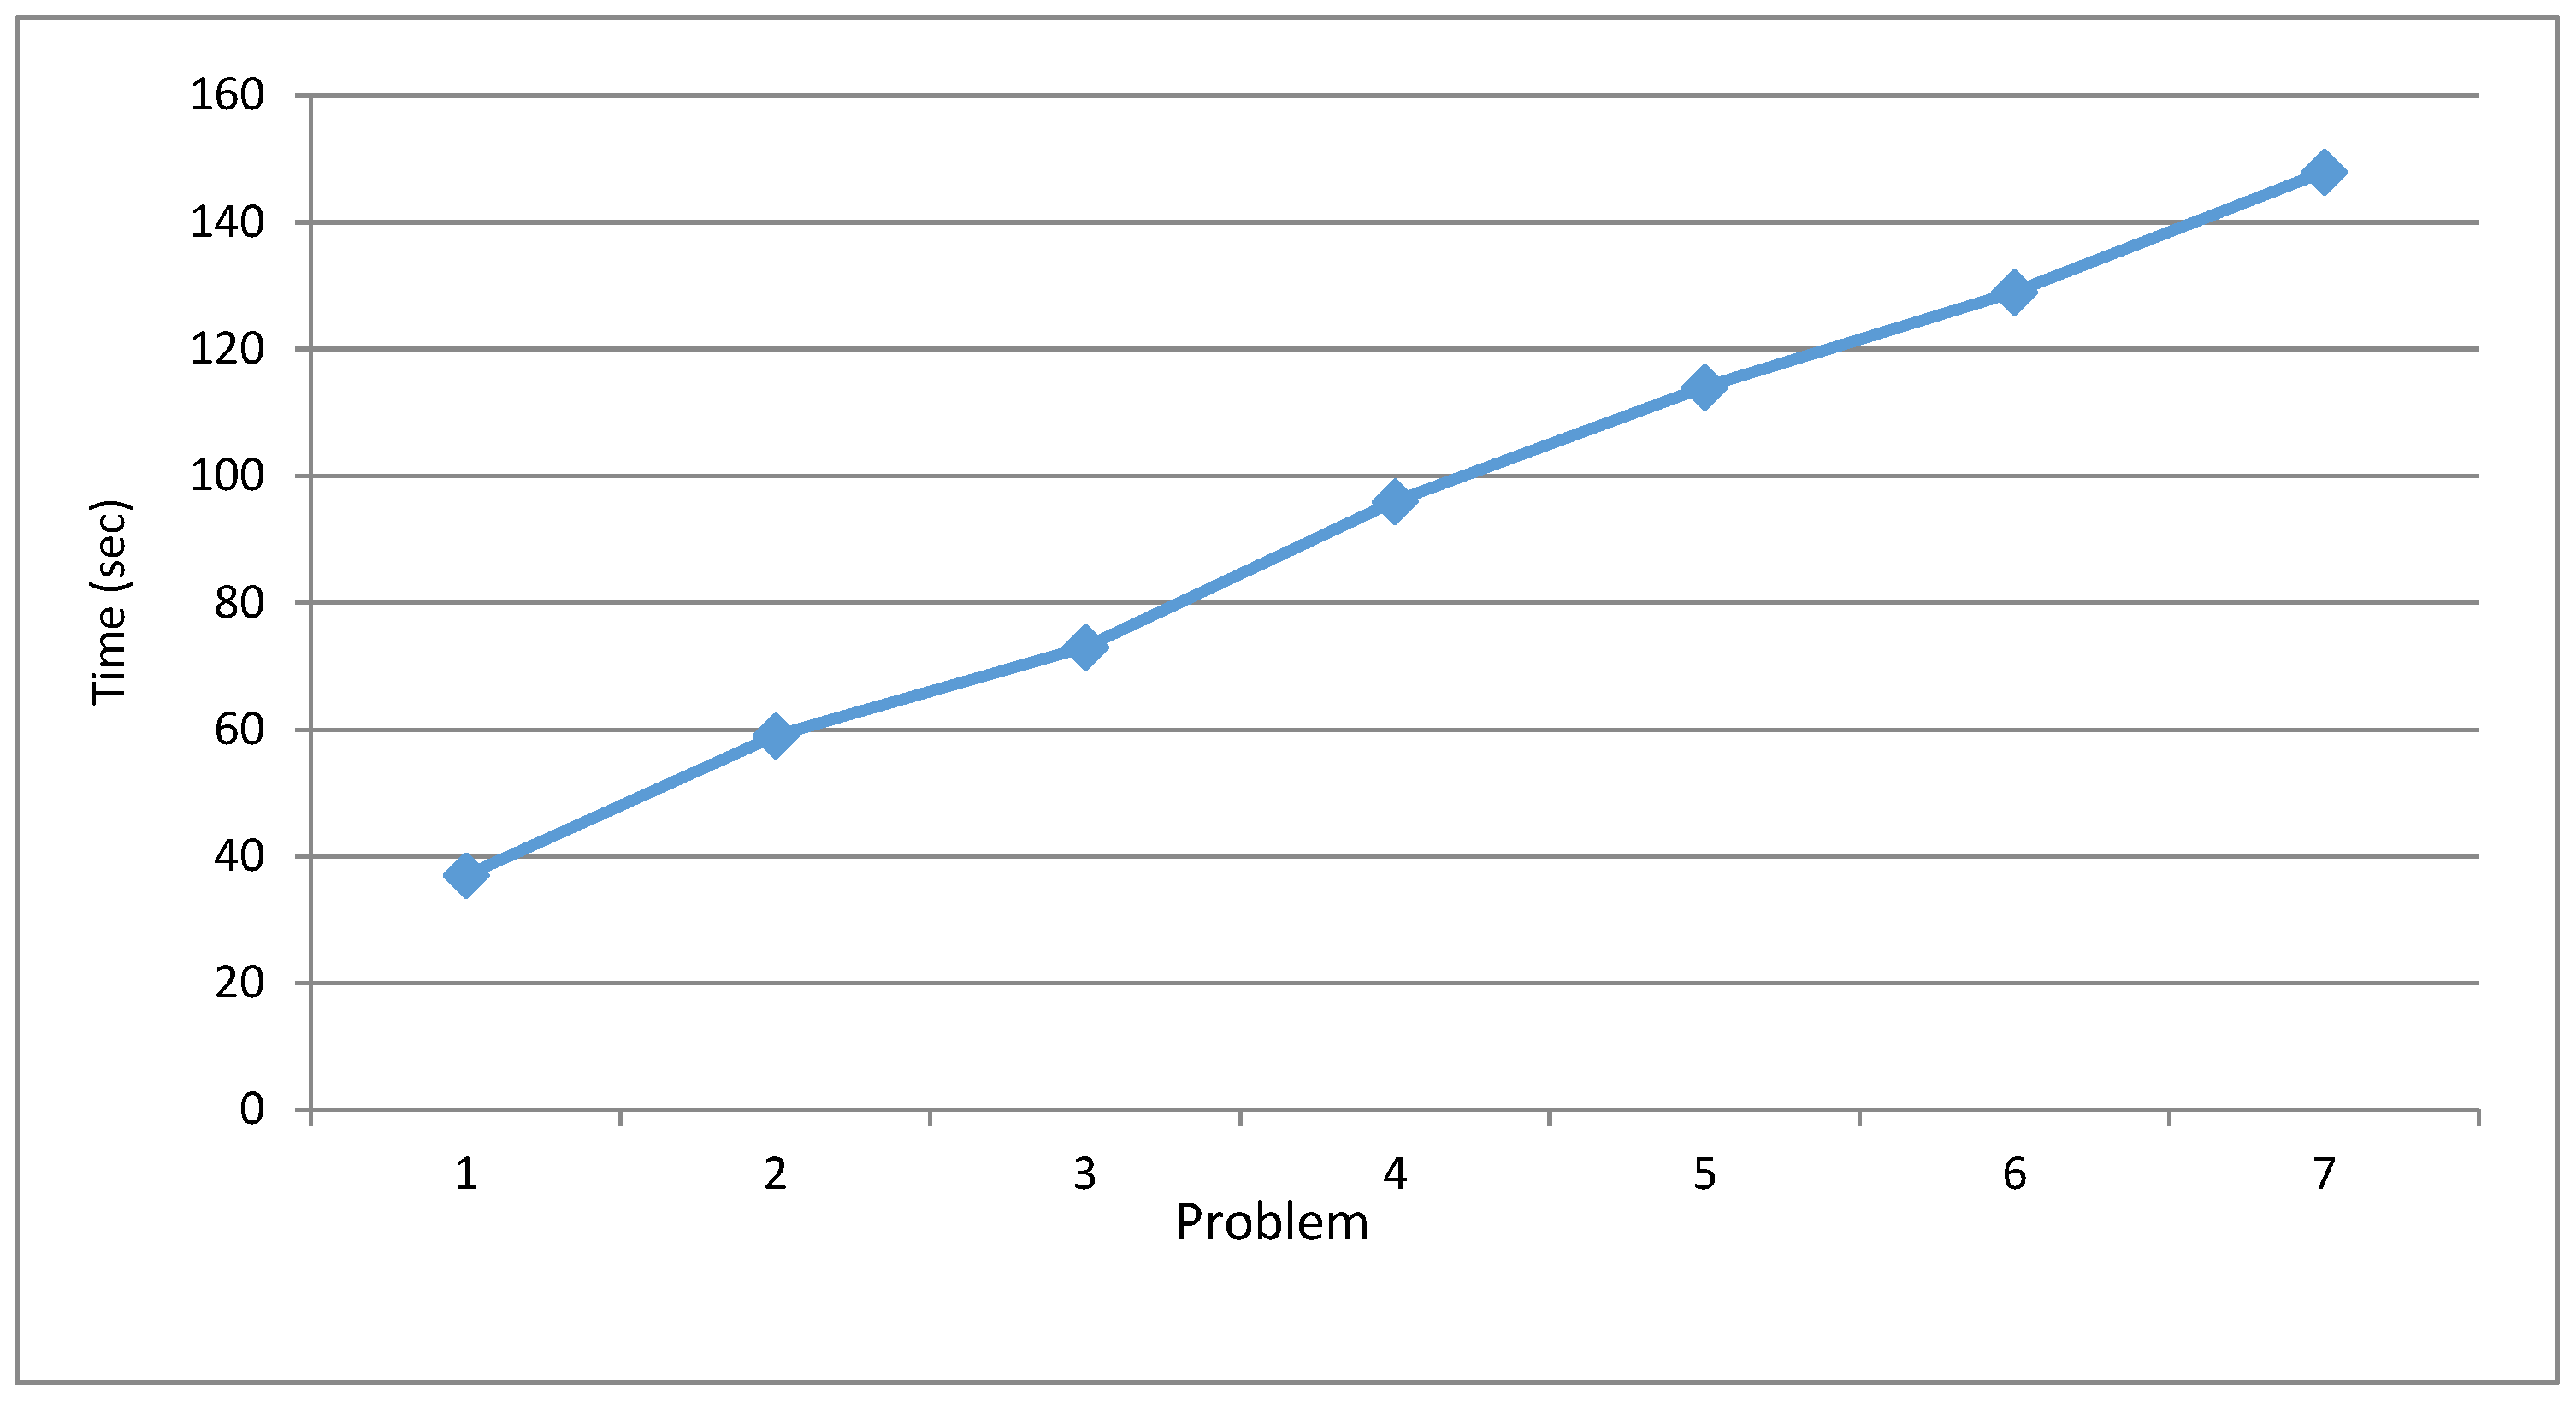
| Problem | Computation Time (s) | Primary Objective Function (Cost) | Secondary Objective Function (Time) |
|---|---|---|---|
| 1 | 37 | 7936 | 11,094 |
| 2 | 59 | 8780 | 13,907 |
| 3 | 73 | 8424 | 14,266 |
| 4 | 96 | 8645 | 15,161 |
| 5 | 114 | 9397 | 15,923 |
| 6 | 129 | 10,375 | 18,033 |
| 7 | 148 | 13,106 | 19,847 |
| 8 | Low memory | Low memory | Low memory |
| 9 | Low memory | Low memory | Low memory |
| 10 | Low memory | Low memory | Low memory |
| Demand | Cost | Time | Change in Cost | Change in Time |
|---|---|---|---|---|
| 0% | 11,097 | 7790 | — | — |
| 10% | 12,942 | 7986 | 0.166261 | 0.02516 |
| 20% | 16,528 | 8379 | 0.277082 | 0.049211 |
| 30% | 21,653 | 8950 | 0.31008 | 0.068147 |
| 40% | 28,515 | 9718 | 0.316908 | 0.08581 |
| 50% | 37,030 | 10,638 | 0.298615 | 0.09467 |
| Installation Cost | Cost | Time | Change in Cost | Change in Time |
|---|---|---|---|---|
| 0% | 11,097 | 7790 | — | — |
| 10% | 12,682 | 7903 | 0.142831 | 0.014506 |
| 20% | 15,482 | 8180 | 0.220785 | 0.03505 |
| 30% | 19,828 | 8585 | 0.280713 | 0.049511 |
| 40% | 26,038 | 9153 | 0.313193 | 0.066162 |
| 50% | 33,867 | 9883 | 0.300676 | 0.079755 |
| Procurement Cost | Cost | Time | Change in Cost | Change in Time |
|---|---|---|---|---|
| 0% | 11,097 | 7790 | — | — |
| 10% | 12,211 | 7902 | 0.100387 | 0.014377 |
| 20% | 14,897 | 8145 | 0.219966 | 0.030752 |
| 30% | 19,473 | 8507 | 0.307176 | 0.044444 |
| 40% | 25,247 | 9045 | 0.296513 | 0.063242 |
| 50% | 32,538 | 9768 | 0.288787 | 0.079934 |
| Adjustable Parameters | Values | |||||||
|---|---|---|---|---|---|---|---|---|
| Population size | n | 3n | 3n | 4n | 4n | 4n | 4n | 4n |
| Maximum main loop iterations | 2 | 3 | 4 | 25 | 30 | 35 | 40 | 45 |
| Number of random start time selections | 1 | 1 | 1 | 4 | 4 | 6 | 6 | 8 |
| Crossover rate | 0.1 | 0.1 | 0.2 | 0.2 | 0.6 | 0.6 | 0.6 | 0.6 |
| Mutation rate | 0.1 | 0.1 | 0.2 | 0.2 | 0.2 | 0.25 | 0.3 | 0.3 |
| Probability of single-point crossover selection | 0.5 | 0.5 | 0.5 | 0.5 | 0.5 | 0.5 | 0.5 | 0.5 |
| Probability of arithmetic crossover selection | 0.5 | 0.5 | 0.5 | 0.5 | 0.5 | 0.5 | 0.5 | 0.5 |
| Probability of exchange mutation selection | 0.5 | 0.5 | 0.5 | 0.5 | 0.5 | 0.5 | 0.5 | 0.5 |
| Probability of direction selection for probability distribution | 0.5 | 0.5 | 0.5 | 0.5 | 0.5 | 0.5 | 0.5 | 0.5 |
| Value of α | 0.01 | 0.01 | 0.01 | 0.01 | 0.01 | 0.01 | 0.02 | 0.2 |
| Value of π | 0.01 | 0.01 | 0.02 | 0.03 | 0.04 | 0.04 | 0.05 | 0.05 |
| Average number of non-dominated solutions per 10 algorithm runs | 4 | 4 | 5 | 5 | 7 | 8 | 10 | 11 |
| Adjustable Parameters | Values | |||||||
|---|---|---|---|---|---|---|---|---|
| Population size | n | 3n | 3n | 4n | 4n | 4n | 4n | 4n |
| Maximum main loop iterations | 2 | 3 | 4 | 25 | 30 | 30 | 30 | 30 |
| Number of random start time selections | 1 | 1 | 1 | 4 | 5 | 5 | 10 | 10 |
| Crossover rate | 0.1 | 0.1 | 0.2 | 0.2 | 0.6 | 0.6 | 0.6 | 0.6 |
| Mutation rate | 0.1 | 0.1 | 0.2 | 0.2 | 0.2 | 0.25 | 0.3 | 0.3 |
| Probability of single-point crossover selection | 0.5 | 0.5 | 0.5 | 0.5 | 0.5 | 0.5 | 0.5 | 0.5 |
| Probability of arithmetic crossover selection | 0.5 | 0.5 | 0.5 | 0.5 | 0.5 | 0.5 | 0.5 | 0.5 |
| Probability of exchange mutation selection | 0.5 | 0.5 | 0.5 | 0.5 | 0.5 | 0.5 | 0.5 | 0.5 |
| Probability of direction selection for probability distribution | 0.5 | 0.5 | 0.5 | 0.5 | 0.5 | 0.5 | 0.5 | 0.5 |
| Value of α | 0.01 | 0.01 | 0.01 | 0.01 | 0.01 | 0.01 | 0.02 | 0.2 |
| Value of π | 0.01 | 0.01 | 0.02 | 0.03 | 0.04 | 0.04 | 0.05 | 0.05 |
| Average number of non-dominated solutions per 10 algorithm runs | 4.8 | 5.1 | 6.6 | 6.8 | 7 | 7.5 | 8.5 | 8.8 |
| Adjustable Parameters | Values | |||||||
|---|---|---|---|---|---|---|---|---|
| Population size | n | 3n | 3n | 4n | 4n | 4n | 4n | 4n |
| Maximum main loop iterations | 2 | 3 | 3 | 20 | 20 | 30 | 30 | 30 |
| Number of random start time selections | 1 | 1 | 1 | 4 | 5 | 5 | 5 | 5 |
| Crossover rate | 0.1 | 0.1 | 0.2 | 0.2 | 0.3 | 0.3 | 0.5 | 0.5 |
| Mutation rate | 0.1 | 0.1 | 0.2 | 0.2 | 0.2 | 0.2 | 0.2 | 0.2 |
| Probability of single-point crossover selection | 0.5 | 0.5 | 0.5 | 0.5 | 0.5 | 0.5 | 0.5 | 0.5 |
| Probability of arithmetic crossover selection | 0.5 | 0.5 | 0.5 | 0.5 | 0.5 | 0.5 | 0.5 | 0.5 |
| Probability of exchange mutation selection | 0.5 | 0.5 | 0.5 | 0.5 | 0.5 | 0.5 | 0.5 | 0.5 |
| Probability of direction selection for probability distribution | 0.5 | 0.5 | 0.5 | 0.5 | 0.5 | 0.5 | 0.5 | 0.5 |
| Value of α | 0.01 | 0.01 | 0.01 | 0.01 | 0.01 | 0.01 | 0.02 | 0.2 |
| Value of π | 0.01 | 0.01 | 0.02 | 0.03 | 0.04 | 0.04 | 0.05 | 0.05 |
| Average number of non-dominated solutions per 10 algorithm runs | 4.2 | 4.6 | 5.5 | 5.7 | 6 | 6.2 | 7.2 | 7.8 |
| Problem | Supplier | Manufacturer | Retailer | Customer | Product | Raw Material |
|---|---|---|---|---|---|---|
| 1 | 10 | 3 | 15 | 30 | 5 | 3 |
| 2 | 11 | 3 | 15 | 32 | 5 | 3 |
| 3 | 11 | 3 | 16 | 32 | 5 | 3 |
| 4 | 12 | 3 | 16 | 33 | 5 | 3 |
| 5 | 12 | 3 | 17 | 35 | 5 | 3 |
| 6 | 13 | 4 | 17 | 35 | 5 | 3 |
| 7 | 13 | 4 | 18 | 35 | 5 | 3 |
| 8 | 14 | 4 | 18 | 36 | 5 | 4 |
| 9 | 14 | 4 | 18 | 38 | 5 | 4 |
| 10 | 15 | 5 | 19 | 39 | 5 | 4 |
| Problem | NSGA-III | MOGWO | MOWOA | |||||||||
|---|---|---|---|---|---|---|---|---|---|---|---|---|
| No. of Pareto Points | Distance to Ideal Point | Crowding Distance | Solution Time | No. of Pareto Points | Distance to Ideal Point | Crowding Distance | Solution Time | No. of Pareto Points | Distance to Ideal Point | Crowding Distance | Computation Time | |
| 1 | 11 | 0.77 | 75 | 67 | 8 | 0.79 | 93 | 71 | 14 | 0.81 | 85 | 76 |
| 2 | 15 | 0.84 | 63 | 78 | 16 | 0.78 | 94 | 84 | 16 | 0.83 | 66 | 90 |
| 3 | 15 | 0.86 | 97 | 97 | 12 | 0.78 | 86 | 99 | 11 | 0.8 | 50 | 100 |
| 4 | 11 | 0.71 | 95 | 111 | 13 | 0.79 | 79 | 119 | 13 | 0.81 | 86 | 110 |
| 5 | 13 | 0.74 | 71 | 126 | 11 | 0.79 | 83 | 136 | 12 | 0.82 | 93 | 121 |
| 6 | 6 | 0.75 | 82 | 138 | 11 | 0.81 | 97 | 155 | 11 | 0.77 | 97 | 134 |
| 7 | 7 | 0.79 | 83 | 150 | 9 | 0.8 | 94 | 173 | 16 | 0.83 | 95 | 148 |
| 8 | 11 | 0.8 | 77 | 170 | 10 | 0.81 | 52 | 186 | 8 | 0.81 | 87 | 160 |
| 9 | 10 | 0.81 | 100 | 181 | 15 | 0.82 | 74 | 197 | 7 | 0.82 | 64 | 178 |
| 10 | 6 | 0.8 | 57 | 194 | 6 | 0.82 | 58 | 212 | 16 | 0.81 | 73 | 191 |
| Customer | Customer | ||||||
|---|---|---|---|---|---|---|---|
| RFID | WSN | RFID | WSN | ||||
| Cost | Time | Cost | Time | Improvement in cost | Improvement in time | Improvement in cost | Improvement in time |
| 11,097 | 7790 | 11,111 | 7789 | 0.016921 | 0.001282 | 0.01568 | 0.00141 |
| Retailer | Retailer | ||||||
|---|---|---|---|---|---|---|---|
| RFID | WSN | RFID | WSN | ||||
| Cost | Time | Cost | Time | Improvement in cost | Improvement in time | Improvement in cost | Improvement in time |
| 11,182 | 7780 | 11,130 | 7787 | 0.009391 | 0.002564 | 0.013997 | 0.001667 |
| Supplier | Supplier | ||||||
|---|---|---|---|---|---|---|---|
| RFID | WSN | RFID | WSN | ||||
| Cost | Time | Cost | Time | Improvement in cost | Improvement in time | Improvement in cost | Improvement in time |
| 11,095 | 7780 | 11,096 | 7782 | 0.017098 | 0.002564 | 0.017009 | 0.002308 |
| Supplier | Supplier | ||
|---|---|---|---|
| Cost | Time | Improvement in Cost | Improvement in Time |
| 11,156 | 7785 | 0.011694 | 0.001923 |
| Manufacturer | Manufacturer | ||
|---|---|---|---|
| Cost | Time | Improvement in Cost | Improvement in Time |
| 11,116 | 7785 | 0.015237 | 0.001923 |
| Retailer | Retailer | ||
|---|---|---|---|
| Cost | Time | Improvement in Cost | Improvement in Time |
| 11,156 | 7785 | 0.011694 | 0.001923 |
| Retailer | Retailer | ||
|---|---|---|---|
| Cost | Time | Improvement in Cost | Improvement in Time |
| 11,170 | 7782 | 0.010454 | 0.002308 |
| Cost | RFID | WSN | Time | RFID | WSN |
|---|---|---|---|---|---|
| Initial | 11,288 | 11,288 | Initial | 7800 | 7800 |
| Customer | 11,097 | 11,111 | Customer | 7790 | 7789 |
| Retailer | 11,182 | 11,130 | Retailer | 7780 | 7787 |
| Supplier | 11,095 | 11,096 | Supplier | 7780 | 7782 |
| Cost | Time | |
|---|---|---|
| Initial | 11,288 | 7800 |
| Suppliers | 11,156 | 7785 |
| Manufacturers | 11,116 | 7785 |
| Retailers | 11,170 | 7785 |
Disclaimer/Publisher’s Note: The statements, opinions and data contained in all publications are solely those of the individual author(s) and contributor(s) and not of MDPI and/or the editor(s). MDPI and/or the editor(s) disclaim responsibility for any injury to people or property resulting from any ideas, methods, instructions or products referred to in the content. |
© 2024 by the authors. Licensee MDPI, Basel, Switzerland. This article is an open access article distributed under the terms and conditions of the Creative Commons Attribution (CC BY) license (https://creativecommons.org/licenses/by/4.0/).
Share and Cite
Mohammadi, T.; Sajadi, S.M.; Najafi, S.E.; Taghizadeh-Yazdi, M. Multi Objective and Multi-Product Perishable Supply Chain with Vendor-Managed Inventory and IoT-Related Technologies. Mathematics 2024, 12, 679. https://doi.org/10.3390/math12050679
Mohammadi T, Sajadi SM, Najafi SE, Taghizadeh-Yazdi M. Multi Objective and Multi-Product Perishable Supply Chain with Vendor-Managed Inventory and IoT-Related Technologies. Mathematics. 2024; 12(5):679. https://doi.org/10.3390/math12050679
Chicago/Turabian StyleMohammadi, Tahereh, Seyed Mojtaba Sajadi, Seyed Esmaeil Najafi, and Mohammadreza Taghizadeh-Yazdi. 2024. "Multi Objective and Multi-Product Perishable Supply Chain with Vendor-Managed Inventory and IoT-Related Technologies" Mathematics 12, no. 5: 679. https://doi.org/10.3390/math12050679