Article

Genesis Analysis of Special Deformation Characteristics for Super-High Arch Dams in the Alpine and Gorge Regions of Southwest China

1
College of Civil and Transportation Engineering, Hohai University, Nanjing 210098, China
2
State Key Laboratory of Hydrology-Water Resources and Hydraulic Engineering, Hohai University, Nanjing 210098, China
3
College of Water Conservancy and Hydropower Engineering, Hohai University, Nanjing 210098, China
4
National Engineering Research Center of Water Resources Efficient Utilization and Engineering Safety, Hohai University, Nanjing 210098, China
5
Cooperative Innovation Center for Water Safety & Hydro Science, Hohai University, Nanjing 210098, China
6
Shandong Electric Power Engineering Consulting Institute Corp., Ltd., Jinan 250013, China
*
Author to whom correspondence should be addressed.
Mathematics 2023, 11(7), 1753; https://doi.org/10.3390/math11071753
Submission received: 9 March 2023 / Revised: 30 March 2023 / Accepted: 3 April 2023 / Published: 6 April 2023
(This article belongs to the Special Issue Mathematical Modeling and Numerical Analysis for Applied Sciences)

Abstract

:
During the operational period, unexpected upstream deformation has been observed in several super-high arch dams located in the alpine and gorge regions. In addition, the phenomenon of the downstream dam deformation monitoring values being apparently smaller than the numerical simulation results appears in some super-high arch dams. This paper focuses on the genetic mechanism of a super-high arch dam’s special deformation characteristics. The finite element method (FEM) was used to analyze the effects of solar radiation, valley contraction, and overhanging on super-high arch dam’s deformation behavior. First, the influences of solar radiation on the temperature field and deformation characteristics of the super-high arch dam under the shading effects of the mountain and the dam body were investigated. Second, the impacts of valley contraction on the deformation characteristics of the super-high arch dam during the storage period were studied. Subsequently, the impact of the overhanging effect on the super-high arch dam’s deformation was explored. Finally, a case study was conducted on the basis of the Jinping I super-high arch dam to evaluate the effectiveness of the proposed analytical method. It is indicated that the dam’s special deformation can be explained reasonably. Above all, in order to accurately analyze and predict the deformation characteristics of super high-arch dams in the alpine and gorge regions of Southwest China, solar radiation, valley contraction, and the dam-overhanging effect need to be considered as influencing factors of dam deformation.

1. Introduction

Approximately 70% of China’s water resources are primarily concentrated in Southwest China. Due to the advantageous conditions for arch dam construction in the alpine and gorge regions of Southwest China, numerous super-high arch dams have been built [1,2]. Large-scale hydropower projects offer numerous benefits, including enhancing the regulation of water resources and accelerating the development of green energy. However, their operational behavior is closely tied to national economic development and the safety of people’s lives and property [3,4,5]. Certain super-high arch dams have displayed special deformation characteristics, such as upstream deformation tendencies that persisted during the initial storage period of the Xiluodu super-high arch dam [6,7]. The arch dam appeared the special phenomenon of overall upstream deformation ultimately. Similarly, during the early storage period, the Xiaowan super-high arch dam experienced tilting towards the upstream direction. In addition, the Jinping I super-high arch dam exhibited substantial differences between the monitoring upstream deformation and numerical simulation results [8]. Due to the enormous scale of super-high arch dams and their complex and challenging service environments compared to conventional dams, factors that have a minimal impact on conventional dams may significantly affect the deformation characteristics of super-high arch dams. Additionally, some traditional dam deformation genesis analysis methods may be useless [9,10]. The presence of special deformation behavior in the super-high arch dams may lead to issues such as misalignment of structural parameter inversion and errors in monitoring indicators, which can seriously undermine the reliability and scientific rigor of dam-deformation-characteristic analysis. Therefore, it is significant to analyze the genetic mechanism of super-high arch dam special deformation characteristics. In order to ensure the long-term safe operation of super-high arch dams, research is needed urgently.
In summary, the factors that lead to the special deformation characteristics of super-high arch dams are complex. Due to the strong solar radiation typically received in the alpine and gorge regions of Southwest China, the surface temperature of the dam body is often elevated, which can cause deformation in the upstream direction. Jin et al. [11] proposed a novel procedure for studying the non-uniform temperatures of arch dams, and they considered the shading effect of the mountain and the dam itself on solar radiation. Mirzabozorg et al. [12] simulated the thermal distribution of arch dams influenced by solar radiation. Santillán et al. [13] took into account the shading, the curvature of the dam’s surface, orientation, and slope when calculating the arch dam’s temperature field. Castilho et al. [14] adopted the chemo-thermal model to simulate the thermal behavior of the Alqueva arch dam under the influences of solar radiation and the variation in the heat of hydration. Zhu et al. [15] simulated an arch dam’s temperature field by considering the solar radiation received on the dam’s surface under various masking degrees. Žvanut et al. [16] simulated the arch dam’s thermal fields by taking into account the effects of the water level of the reservoir, spillover, insolation, and shading effects. Pan et al. [17] proposed an arch dam temperature field reconstruction method, which considers solar radiation, mountain shading effects, ambient temperature, and weather conditions. Based on the reconstruction results, the thermomechanical stress of the arch dam is analyzed. However, although the above-mentioned research considers the effect of solar radiation on the temperature field of the arch dam, it mainly focuses on analyzing the stress changes in the arch dam under the influence of solar radiation, and little research has been conducted on the influence of solar radiation on the deformation characteristics of the arch dam.
Furthermore, some scholars concluded that the valley’s contraction may also affect the deformation characteristics of super-high arch dams. Barla et al. [18] pointed out that the change in effective stress caused by water storage leads to valley contraction. Cheng et al. [19] and Li et al. [20] studied the influence of valley contraction on a super-high arch dam’s deformation and built detailed mathematical models. Hu et al. [21] considered the influence of valley contraction on dam deformation when establishing the dam-deformation prediction model. Over the past few years, many efforts have analyzed the genetic mechanism and deformation characteristic of valley contraction [22,23,24,25]. Currently, there is still a lack of studies focusing on the influence of valley contraction on super-high arch dams’ deformation characteristics.
To sum up, it can be considered that the influencing factors affecting the special deformation characteristics of a super-high arch dam mainly include solar radiation and valley contraction. In addition, according to the dam monitoring data, the overhanging effect can also be considered as a factor affecting the special deformation characteristics of a super-high arch dam, but there is still no relevant research.
To accurately analyze the genetic mechanism of a super-high arch dam’s special deformation in the alpine and gorge regions of Southwest China, in this paper, the deformation characteristics under the influence of solar radiation, valley contraction, or the dam-overhanging effect are analyzed, respectively. On the basis of the ASHRAE (American Society of Heating, Refrigerating and Air-Conditioning Engineers), a clear sky model, and a ray tracing algorithm, the solar radiation received by the super-high arch dam and the reservoir water is calculated. Then, the arch dam’s temperature field and deformation characteristics considering the effects of solar radiation are analyzed. After studying the valley-contraction mechanism caused by the changes in hydrological conditions of the reservoir shores after impoundment, the super-high arch dam deformation characteristics are calculated under the influence of valley contraction. Subsequently, the “live/dead element” method is introduced to simulate and analyze super-high arch dams’ deformation characteristics considering the effect of valley contraction. Finally, the genetic mechanism of the special deformation characteristic of the Jinping I super-high arch dam is analyzed as an example.
The remainder of this paper is organized as follows. The influence mechanisms of solar radiation, valley contraction, and dam overhanging on a super-high arch dam’s deformation are studied in Section 2. Additionally, the Jinping I super-high arch dam was selected as the engineering application case, and the analysis results are discussed in Section 3. Finally, some conclusions are drawn in Section 4.

2. Effect Mechanisms of Solar Radiation, Valley Contraction, and Dam Overhanging on a Super-High Arch Dam’s Deformation

2.1. Numerical Analysis of a Super-High Arch Dam’s Deformation Considering the Effects of Solar Radiation

2.1.1. Numerical Analysis of a Super-High Arch Dam Temperature Field Considering the Effects of Solar Radiation

On the basis of the ASHRAE clear sky model and ray tracing algorithm, the solar radiation received by the super-high arch dam and reservoir water can be calculated accurately by considering the self-shading effect of the dam body and the mountains on both banks [26,27,28]. When calculating the temperature field of the dam body, because of the effects of the solar radiation and shading effect, which change with sunrise, sunset, seasons, and variations in air and reservoir water temperature in daylight hours, the transient temperature field should be used to describe the temperature variation of the super-high arch dam. The finite element format of the transient temperature field is described as follows [29]:
C ϕ ˙ + K ϕ = P
where C is the heat capacity matrix, K is the thermal conductivity matrix, P is the temperature load matrix, ϕ is the nodal temperature array, and ϕ ˙ is the nodal temperature derivative array with respect to time; ϕ ˙ = d ϕ / d t .
In the rectangular coordinate system, assuming that the concrete is a homogeneous and isotropic solid, and neglecting the adiabatic temperature rise of concrete, the heat-conduction equation can be expressed as:
a 2 T x 2 + 2 T y 2 + 2 T z 2 = T t
where a represents the thermal diffusivity, a = λ / c ρ , λ represents the thermal conductivity, c represents the specific heat, ρ represents the density, t represents time, T represents temperature, and x , y , z represent the rectangular coordinates.
At the initial time, when t = 0, the following equation can be established.
T x , y , z , 0 = T 0 x , y , z
There are three types of boundary conditions:
(1)
The first type of boundary condition:
T t = f t
(2)
The second type of boundary condition:
The heat flux on the concrete surface is a known function of time, which is represented as follows.
λ T n = q
where n is the outward normal direction of the surface and q is the given heat-flux density.
(3)
The third type of boundary condition:
The convective heat transfer condition on the boundary is described as follows.
λ T n = β T T a
where β is the surface heat transfer coefficient and T a is the air temperature.
Based on the above analysis, the boundary conditions for the temperature-field numerical simulation of the super-high arch dam in the alpine and gorge regions of Southwest China can be classified into four types (S1–S4), as shown in Figure 1.
(1)
Below the water surface of dam face S1:
The interface between the reservoir water and the dam body is a convective heat exchange between fluid and solid, which belongs to the third type of boundary condition. However, due to the relatively large convective heat transfer coefficient between the reservoir water and the dam’s surface, it can also be regarded as the first type of boundary condition:
T = T W
where T W is the temperature of the reservoir water.
(2)
The dam face in contact with air S2:
The dam body surface above the water surface undergoes convective heat exchange with the air and is influenced by solar radiation and radiative heat exchange with the surrounding environment:
λ T n = β a T T a + C S q
where λ is the thermal conductivity; n is the surface normal direction; β a is the combined heat transfer surface coefficient of concrete in air, referred to as the surface heat transfer coefficient later; T a is the air temperature; q is the solar radiation intensity; and C S is the solar radiation reduction coefficient, which is determined according to the weather conditions.
(3)
The foundation base surface S3:
The temperature of the deep ground in the foundation generally varies slightly and is approximately constant, so the base surface can be regarded as the first type of boundary:
T t = T 0
(4)
The foundation sidewall surface S4:
It can be taken as an adiabatic boundary:
λ T n = 0
In addition, assuming good contact between the arch dam and the foundation, temperature and heat flux are continuous at the interface. Therefore, it is necessary to specify different material parameters in the numerical calculation.

2.1.2. Method for Numerical Analysis of a Super-High Arch Dam’s Temperature Deformation Considering the Influence of Solar Radiation

According to the above analysis’s results, the variations in a super-high arch dam’s deformation characteristics are influenced by solar radiation, mountain shading, reservoir water temperature, air temperature, and other factors. The dam body can be modeled based on the linear elastic constitutive model. On the basis of the theory of elasticity, the temperature deformation of each node is equivalent to the deformation generated by the following volume force and surface force:
The volume force is
X = α E 1 2 μ T x Y = α E 1 2 μ T y Z = α E 1 2 μ T z
The surface force is
X ¯ = α E T 1 2 μ l Y ¯ = α E T 1 2 μ m Z ¯ = α E T 1 2 μ n
The equilibrium equation for calculating the dam temperature deformation by using finite elements is
K δ T = R T
When the equivalent loads are expressed in Equations (11) and (12), the equivalent load array for the variable temperature nodes can be expressed as follows:
R T = α E 1 2 μ i = 1 n N i T i 1 1 1 0 0 0 T
where K represents the material stiffness matrix, δ T represents the temperature deformation column matrix, E represents the elastic modulus of the dam body, α represents the linear expansion coefficient, μ represents the Poisson’s ratio, and N represents the element shape function.
Consequently, after obtaining the temperature field of the super-high arch dam, the temperature deformation at each node can be obtained according to Equation (13).

2.2. Numerical Analysis of a Super-High Arch Dam’s Deformation Characteristics in the Alpine and Gorge Regions of Southwest China

2.2.1. Analysis of the Causes of Valley Contraction in the Alpine and Gorge Regions of Southwest China for Super-High Arch Dams

Existing monitoring data indicate that the valley-contraction phenomenon appeared during the construction of the super-high arch dam, which is mainly caused by the unloading and relaxation of the excavated rock mass. The changing of hydrological conditions near the dam after storage can also cause valley contraction. This phenomenon is the result of the transition of the bank rock mass from unsaturated seepage to saturated seepage. This paper mainly studies the valley contraction caused by the change in hydrological conditions of the bank after storage [30].
(1) Deformation process of fractured rock mass due to water storage
The stratigraphy in the alpine and gorge regions of Southwest China is well developed. There are outcrops from the Late Palaeolithic to the Cenozoic Quaternary. The stratigraphic lithology and petrographic phases are highly variable, and all types of rocks are present (magmatic rocks, metamorphic rocks, etc.). In central and western Yunnan, the Sichuan Basin, and Gansu, there are many red-bedded soft rocks and Neotertiary semi-formed rock formations, and unstable rock and soil bodies are widely distributed. The main geological formations in the dam site area are the interlayer and intraformational staggered zone. The general shape of the interlayer staggered zone is consistent with that of the rock-flow layer. There are slightly steeper dips in the upstream and downstream chamber areas. The majority of the materials in staggered zones are basalt breccia and fragments, some of which are fractured. There is a small amount of rock debris and very little mud. The intraformational staggered zones are developed within the lithosphere, mainly transferred by the layer joints and partial layer structure. They are widespread, numerous, and of a more dispersed production. Therefore, the deformation and fracture-evolution history of steep rock slopes in the alpine and gorge regions of Southwest China are complex, and there are many flow channels, such as fractures and pores inside in the natural state.
Rock mechanics regard the rock mass as a dual medium composed of a fracture network and a pore medium, in which the permeability of fractures is much greater than that of pores and is the main water-conducting channel for rock seepage. The permeability of pores is relatively small and generally occupies a larger volume in the rock mass than fractures, which can be regarded as the space for water storage. The development degree of rock fractures weakens with the depth, and the degree of fracture system development of the surface rock mass is higher due to unloading and weathering effects, which can be generally regarded as a through network. The proportion of non-through fractures inside the mountain increases with depth. Due to the good permeability of fractures, the flow of reservoir water in the fracture system is relatively fast, and the groundwater level of the bank mountain rises rapidly, which can reach the same level as the reservoir’s water level in a short time. The entry of reservoir water into fractures changes the equilibrium state of the surrounding rock blocks of the fractures, as shown in Figure 2. The water pressure in the fractures generates two forces, the downward water thrust force V and the uplifting force U, and the limit equilibrium condition of the rock block can be expressed as follows.
f = c A + f W cos φ U W sin φ V = 0
where W represents the weight of the rock mass; A denotes the area of the sliding surface; c and f represent the cohesive force and friction coefficient of the sliding surface, respectively; φ is the inclination angle of the sliding surface.
In Figure 2, it can be observed that both V and U are detrimental to the stability of the rock mass and can cause the rigid sliding block to lose balance. For a continuous medium with the elastic-plastic constitutive law, pore water pressure may cause plastic yielding of the rock material.
The movement velocity of reservoir water in fractures is much greater than that in rock pores. After infiltrating the mountain, it can quickly fill larger fractures, but at this time, the rock mass is still unsaturated, and microcracks and pores still need time to reach saturation. During the process of transition from unsaturation to saturation, pore pressure changes from negative to positive, effective stress decreases, and pore stability decreases.
(2) Analysis of the mechanism of influence of reservoir water pressure on reservoir bank rock masses
Reservoir water pressure has an important impact on the mountain: one is the surface force acting on the mountain surface, which compresses the rock mass (surface force effect); the other is the penetration water pressure generated after entering the mountain, which acts on various structural surfaces, causing shear displacement of structural surfaces and rock expansion deformation (permeation pressure effect). Based on true triaxial tests on fractured rock samples, Wu et al. [31] discovered the following deformation laws:
(1) Under the uniaxial stress state, after applying the axial load to the fractured rock sample, the fracture will open to a certain extent. At this time, the permeation pressure effect is greater than the surface force effect, and the sample expands and deforms.
(2) Under the triaxial stress state, when the axial pressure is low, the surface force effect is greater than the permeation pressure effect. The sample volume decreases with the increase in water pressure. When the axial pressure is high, the sample itself has already developed a lot of fractures due to the initial stress state, so during the process of increasing water pressure, the permeation pressure effect is greater than the surface force effect, and the sample exhibits expansion deformation.
Figure 3 shows a schematic diagram of the cross-section of a typical high arch dam valley. The stress in high mountain and canyon areas is generally high. Based on the tests conducted by Wu et al., the shallow rock masses of the reservoir bank slope (Zone A in Figure 3) can be approximately regarded as being under the uniaxial stress state. After water storage, the water pressure mainly exerts tension on structural surfaces such as fractures, causing the rock mass to expand and deform towards the valley, resulting in the valley contraction. Most of the rock masses inside the mountain (Zone B in Figure 3) can be approximately regarded as being under the triaxial stress state. The long-term deformation and fracturing-evolution history lead to the development of jointed fractures in the rock mass. After water storage, the fracture water pressure increases, the effective stress decreases, and tension deformation and shear deformation are prone to occur, which also leads to valley contraction on the reservoir bank.
(3) Unsaturated seepage–stress coupling mechanism in fractured rock masses
After the initial water storage, the rock mass of the reservoir bank will undergo a transition from unsaturated seepage to saturated seepage, causing deformation of the rock mass. After the fractal system with different sizes and random distributions is homogenized, the fractured rock mass can be regarded as an equivalent continuous porous medium. Under unsaturated and non-steady flow conditions, the seepage–stress coupling mechanism of the rock mass is described as follows.
The solid skeleton is defined as having positive tensile stress and pore pressure in the saturated zone. The effective stress σ is defined as follows [30]:
σ = σ + α p ¯ I
where σ represents the total stress; α is the Biot coefficient and α = 1 K b / K m , where K b is the macroscopic bulk modulus of the solid skeleton, K m is the bulk modulus of the solid particles (matrix); I is the unit tensor; p ¯ is the weighted average pressure, p ¯ = χ u w + 1 χ u a ; u w is the pore water pressure; u a is the pore air pressure; χ s is the Bishop factor, which is related to saturation, and its value is between 0 and 1. When data are lacking, χ can be assumed to be equal to the medium saturation s . It is assumed that the liquid flows in a connected porous medium and the gas is connected to the atmosphere. The gas pressure in the pore is assumed to be the same as the atmospheric pressure, with atmospheric pressure as a reference value of zero.
The constitutive equation of the porous medium can be described as follows [32].
σ = 2 G ε + λ t r ε I α p ¯ I
where G is the shear modulus, λ is the Lamé coefficient, λ = 2 v G / 1 2 v , v is the Poisson’s ratios, and t r ε is the trace of the total strain tensor.
The equilibrium equation σ + f = 0 , where only the gravity g is considered as the body force, and the x-axis upward is defined as positive. The density of the solid–liquid mixture is
ρ m = ϕ s ρ w + 1 ϕ ρ s
f = ρ m g = ϕ s ρ w + 1 ϕ ρ s g
where ρ w is the density of water, ρ s is the density of the solid matrix, s is the saturation, ϕ is the porosity, and g is the gravitational acceleration that assumed to be constant.
Substitute Equations (17) and (19) into the equilibrium equation and taking partial derivative with respect to time t.
2 G ε t + λ t t r ε I α p ¯ t I t ϕ s ρ w + 1 ϕ ρ s g = 0
Based on ε = 1 2 u + u , Equation (20) can be expressed in index notation as:
G t 2 u i + G + λ t ε v , t α t p ¯ , j δ i j t ϕ s ρ w + 1 ϕ ρ s g δ i 3 = 0
where ϕ , ρ w , and ρ s are expressed using state equations, containing five variables: p ¯ (or u w ), s, and u i (or ε i ).
The seepage differential equation is obtained by simultaneously solving the continuity equation, Darcy’s law, and the state equation.
The velocity of the liquid phase relative to the solid phase is given as follows.
v r w = v w v s
The continuity equation can be written as follows.
ϕ t s ρ w + s ρ w ϕ t + ϕ s ρ w v r w + ϕ s ρ w v s = 0
1 ϕ ρ s t ρ s ϕ t + 1 ϕ ρ s v s = 0
As the product of the solid velocity v s and the scalar gradients of other variables, ϕ and s ρ w is a higher-order small quantity that can be neglected. By eliminating ϕ t , the continuity equation for water in the fluid–structure interaction can be obtained.
ϕ t s ρ w + 1 ϕ ρ w s ρ s ρ s t + ϕ s ρ w v r w + s ρ w v s = 0
In the continuity equation, the relative velocity of water v r w and the velocity gradient of solid phase v s exist. In order to obtain a seepage differential equation involving only five variables— p ¯ (or u w ), s , and u i (or ε i )—the velocity needs to be processed separately, and the volumetric strain is expressed as ε v = ε x + ε y + ε z = u i , i . Therefore,
v s = t u s = t ε i j ε i j = ε v t = t u i , i
Darcy’s law under unsaturated conditions can be described as follows [32]:
ϕ s v r w = K K r w μ w u w + ρ w g z
where μ w represents the viscosity or dynamic viscosity of water and is a measure of fluid viscosity, P a s ; K represents the absolute permeability (also known as intrinsic permeability or specific permeability), which is only applicable to Newtonian fluids; K r w represents the relative permeability of liquid water under unsaturated conditions, which is a function of saturation s.
Different material densities appearing in the continuity equation are represented by s, ρ , and some other parameters [33].
ρ w = ρ w 0 1 + u w K w
ρ s = ρ s 0 1 + p ¯ K m t r σ 3 1 ϕ K m = ρ s 0 1 + s u w K m t r σ 3 1 ϕ K m
where ρ w 0 represents the reference density of the liquid, ρ s 0 represents the reference density of the solid, K m represents the bulk modulus of the fluid, K m represents the bulk modulus of the solid particles (matrix), s u w K m represents the density change induced by liquid pressure, and t r σ 3 1 ϕ K m represents the density change induced by effective stress.
The relevant derivatives in the continuity equation are given in terms of the time t derivative with respect to p ¯ (or u w ), s , and u i (or ε i ).
t s ρ w = t S ρ w 0 1 + u w K w = ρ w 0 1 + u w K w s t + s ρ w 0 K w u w t
1 ϕ ρ s ρ s t = ρ s 0 ρ s 1 K m 1 ϕ K b K m p ¯ t K b K m ε v t
The seepage differential equation is established based on Equations (25), (27), (30), and (31):
ϕ ρ w 0 1 + u w K w s t + s ϕ ρ w 0 K w u w t + ρ w s ρ w 0 ρ s K m 1 ϕ K b K m p ¯ t + ρ w s ρ s ρ s 0 ρ s K b K m ε v t + ρ w K K r w μ w u w + ρ w g z = 0
where
p ¯ = s u w
where the saturation s can be expressed by pore water pressure u w .
Therefore, it is necessary to solve four variables, namely, p ¯ (or u w ) and u i (or ε i ), by using four equations, including the constitutive equation of the porous medium and the seepage differential equation, given the initial and boundary conditions.

2.2.2. Numerical Analysis of a Super-High Arch Dam’s Deformation Characteristics Considering the Effect of Valley Contraction

Valley deformation can occur in two ways, expansion and contraction. When the valley expands, the chord length of the arch dam increases, reflecting the effect of water pressure on the dam shoulder. When the valley contracts, the chord length of the arch dam decreases, reflecting the compression of the mountain on the arch dam. This causes the dam body to deform in the upstream direction, opposite to the direction of deformation caused by the reservoir water, resulting in radial deformation monitoring values of the arch dam in the downstream direction being less than the theoretical calculation values. In some engineering cases, the arch dam may even experience cumulative deformation in the upstream direction.
In theory, the deformation caused by valley contraction acts on the contact surface between the arch end and the dam shoulder as a surface force, resulting in changes in the arch dam deformation and stress distribution. When using the FEM to analyze the influence of valley contraction deformation on arch dam deformation, the continuous spatial structure of the dam and rock foundation is discretized into a finite number of unit structures, connected by nodes to form the entire system, and the stiffness matrices of each unit K e j are determined. If the calculation domain is Ω 1 , the overall stiffness matrix K is given as follows.
K = e j Ω 1 C e j T K e j C e j
where C e j is the stiffness transformation matrix of the unit e j .
The equilibrium equation between node displacement δ and node load R is established as follows.
K δ = R
The finite element equilibrium equation, Equation (35), can be decomposed into two parts based on known and unknown nodal displacement as follows.
K u u K u s K s u K s s δ u δ s = R a R r
Then,
δ u = K u u 1 R a + K u s δ s R r = K s u δ u + K s s δ s
where δ u is the vector of unknown nodal displacements, δ s is the vector of known nodal displacements, R a is the vector of external nodal loads, and R r is the vector of nodal reactions.
When calculating the deformation of the super-high arch dam, the displacement of each boundary node in the near-dam area model is set to the displacement caused by valley contraction deformation u , v , w . Equation (37) is then used to obtain the super-high arch dam’s deformation under the influence of valley contraction.

2.3. Numerical Analysis of a Super-High Arch Dam’s Deformation Considering the Effects of the Dam-Overhanging Effect

2.3.1. Analysis of the Overhanging Effects of Super-High Arch Dams

For a hyperbolic arch dam, the upstream face of the dam cannot remain vertical due to the variations in the radii and central angles or the curve parameters of the upper and lower arch rings. If the upper dam face protrudes beyond the lower dam face, an overhanging of the arch dam is formed. The ratio of the horizontal distance between the upper and lower levels and their height difference is called the degree of overhanging. Figure 4a shows a schematic diagram of the arch crown beam profile of a hyperbolic arch dam, where point A is the convex point of the upstream face curve and point B is the intersection of the upstream face curve and the foundation surface—assuming that the coordinates of points A and B in the Cartesian coordinate system are x A , y A and x B , y B , respectively. The degree of inversion can be expressed as follows.
S = x A x B y A y B
The dam-overhanging effect is closely related to the height of dam concrete pouring and the elevation of grouting for sealing the arch. In the upper part of the dam, the inverted arch effect causes downstream deformation (Figure 4b), and in the lower part, it causes upstream deformation (Figure 4c). The overhanging effect can improve the stress state at the dam’s heel to some extent, but the degree of overhanging should not be too large, generally not exceeding 0.3.
The dam-overhanging effect mainly occurs during the construction period. For hyperbolic arch dams of medium and low heights, deformation monitoring instruments are installed after grouting, by which time the overhanging effect has been basically released. Therefore, there is a lack of monitoring data to analyze the effect of the overhanging effect on the deformation state of the arch dam. However, in the alpine and gorge regions of Southwest China, super-high arch dams are built in stages, and deformation monitoring instruments are installed earlier. For example, the plumb-line monitoring instruments for the Xiluodu super-high arch dam were installed during the dam construction period, with the typical time nodes shown in Figure 5. In addition, the Xiaowan arch dam was completed in March 2010, and the plumb line began to be monitored on 14 December 2008.
Due to the huge size of the super-high arch dams, the values of the dam-overhanging effects of super-high arch dams are larger than the values of medium and low-height arch dams. Therefore, the dam-overhanging effects are more significant in super-high arch dams than in medium- and low-height arch dams. The plumb-line monitoring instruments were installed earlier, which can monitor the residual overhanging effect of the dam body and provide conditions for analyzing the influence of the dam-overhanging effect on super-high arch dams’ deformation characteristics.

2.3.2. Numerical Analysis of a Super-High Arch Dam’s Deformation Characteristics by Considering the Effects of Dam Overhanging

Due to the enormous volume of concrete required for the construction of super-high arch dams, the dam body is typically divided into thousands of pouring compartments and dozens of grouting zones. The horizontal arches and transverse joints divide each section into independent cantilever beam structures, which are then reformed into a complete structure after grouting. Therefore, the pouring height, grouting height, and transverse joint status all have an impact on the deformation behavior of the dam body. In order to accurately analyze the influence of the dam-overhanging effect on the super-high arch dam’s deformation, it is necessary to simulate the construction process and conduct finite element analysis.
When using finite element software to analyze the influence of dam-overhanging effects on the deformation behavior of super-high arch dams, the birth and death element method is commonly used [34,35]. First, an overall finite element model is established based on the actual pouring blocks and transverse joints, with thin layer elements used for the transverse joints. Before starting the calculation, all the elements are “killed”; i.e., the stiffness or other analysis characteristic matrices are multiplied by a very small factor, and the loads, mass, damping, and other similar parameters are set to zero. Then, following the actual pouring and grouting process, new elements of the dam body are activated one by one. The element parameters are restored to their original values, and the previously poured elements remain active and participate in the calculation. Repeat the above steps until the dam body is completely poured and obtain the calculation results of the super-high arch dam under the influence of the dam-overhanging effect.

3. Case Study

The Jinping I project consists of a reinforced concrete hyperbolic arch dam, a downstream water cushion reservoir, a spillway tunnel on the right bank, and an underground powerhouse in the middle of the right bank. The height of the hyperbolic arch dam is 3050 m, and the normal water level of the reservoir is 1880 m. The dead water level is 1800 m. The storage capacity below the normal water level is 7.76 billion cubic meters, and the regulation capacity is 4.91 billion cubic meters, which is classified as an annual regulated reservoir.
To monitor the real-time deformation of the arch dam during its construction, deformation monitoring instruments were installed on the dam. Using plumb lines, the horizontal deformation of the dam body was monitored, and a total of 43 vertical deformation monitoring points were installed at the top of the dam at elevations of 1829, 1778, 1730, 1664, and 1601 m on sections 1#, 5#, 9#, 11#, 13#, 16#, 19#, and 23# of the dam. The plumb lines PL1-1 to PL23-3 were used to monitor the horizontal deformation of the dam body, and the inverted plumb lines IP5-1 to IP19-1 were used to monitor the horizontal deformation of the dam foundation. These plumb-line monitoring points were all connected to automation systems, and during normal operation, abnormal monitoring values were infrequent. However, during the construction and initial storage period, the proportion of sudden jump data was relatively high due to various construction factors. Figure 6 shows the three-dimensional schematic of the arch dam project. The dam deformation under the influences of solar radiation, valley contraction, and the overhanging effect was numerically simulated and analyzed by using the aforementioned theories and the FEM.

3.1. Analysis of the Influences of Solar Radiation on the Arch Dam Deformation Characteristics

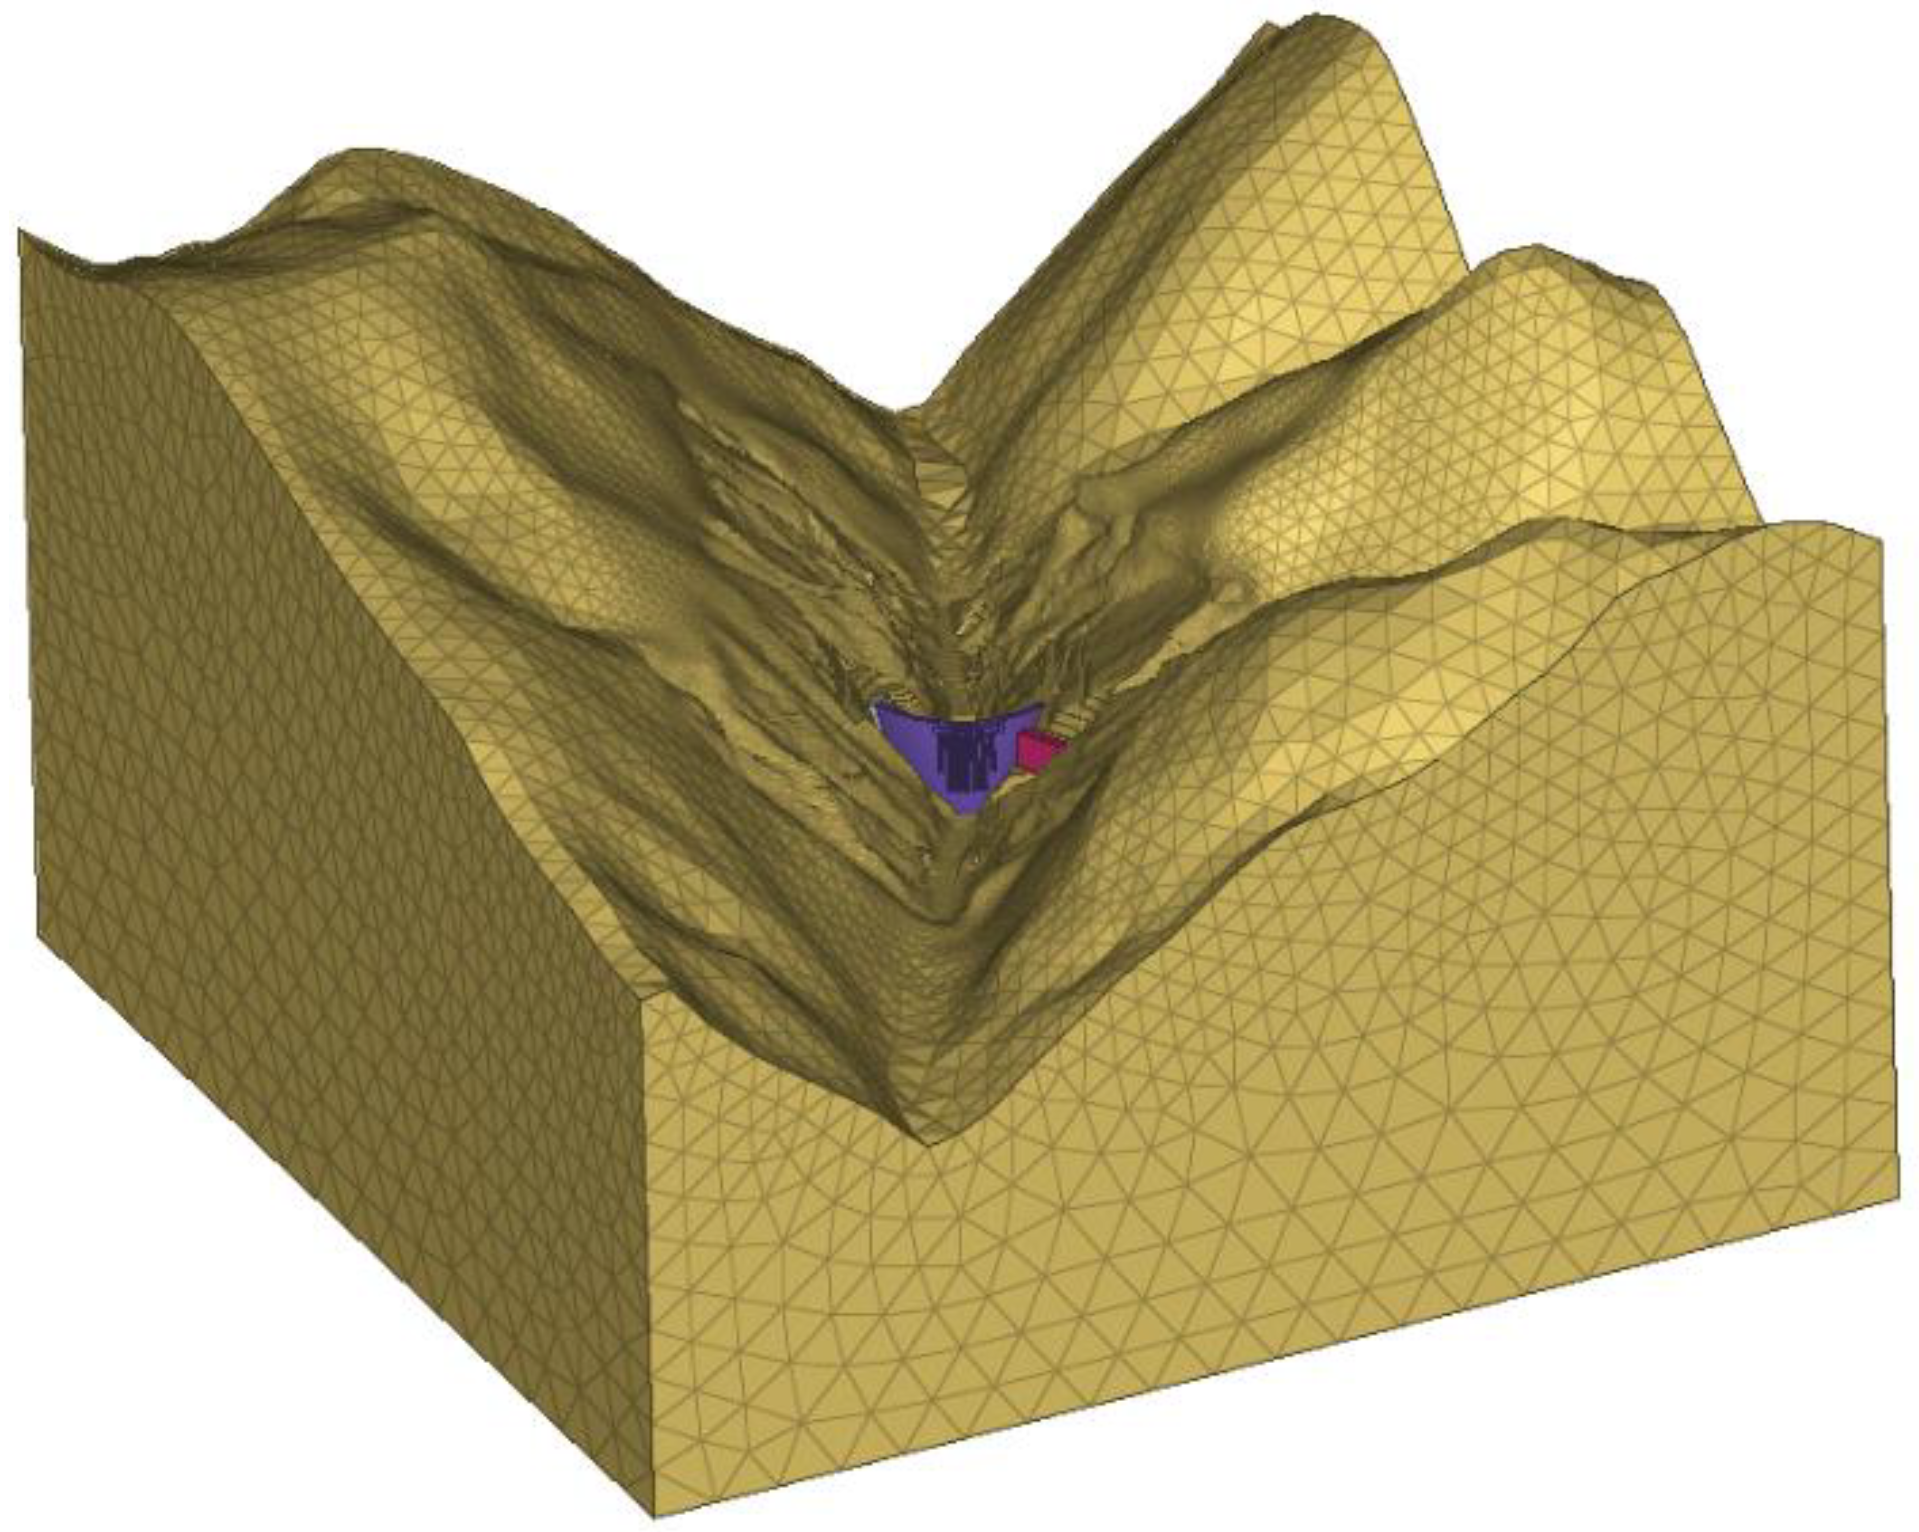
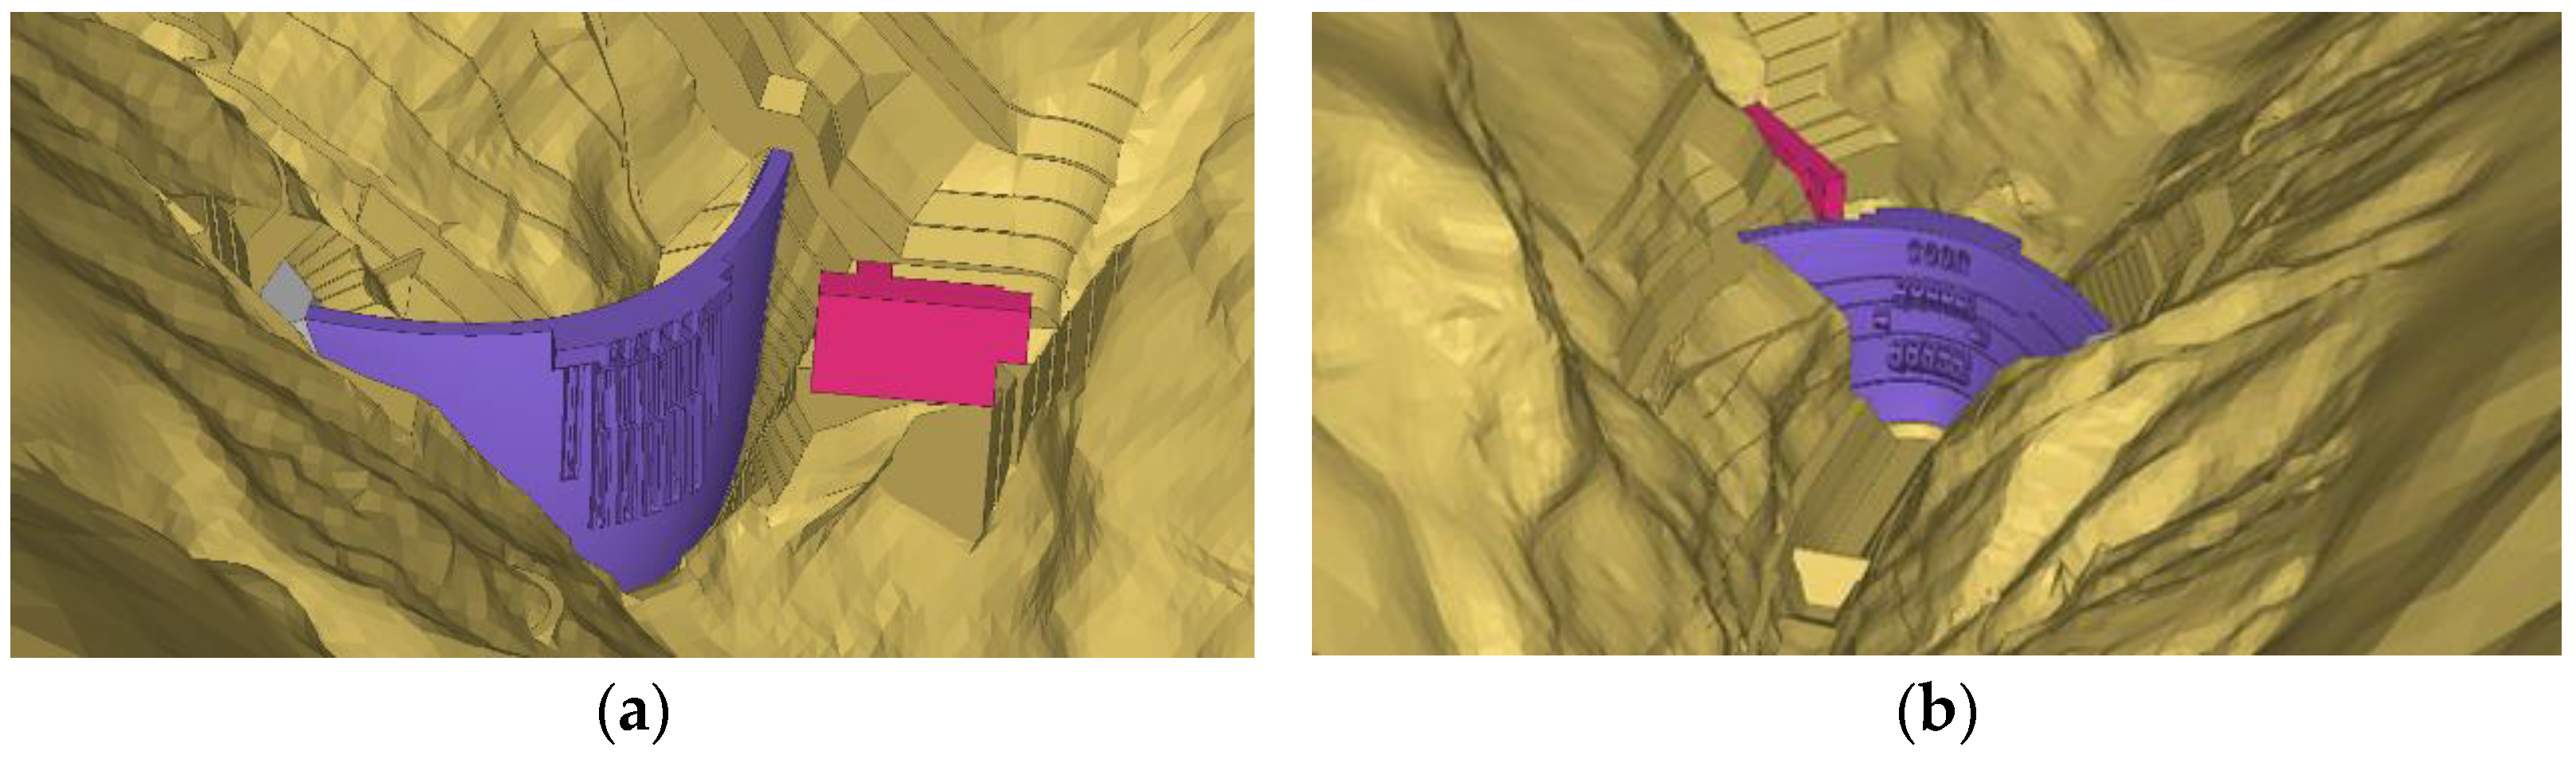
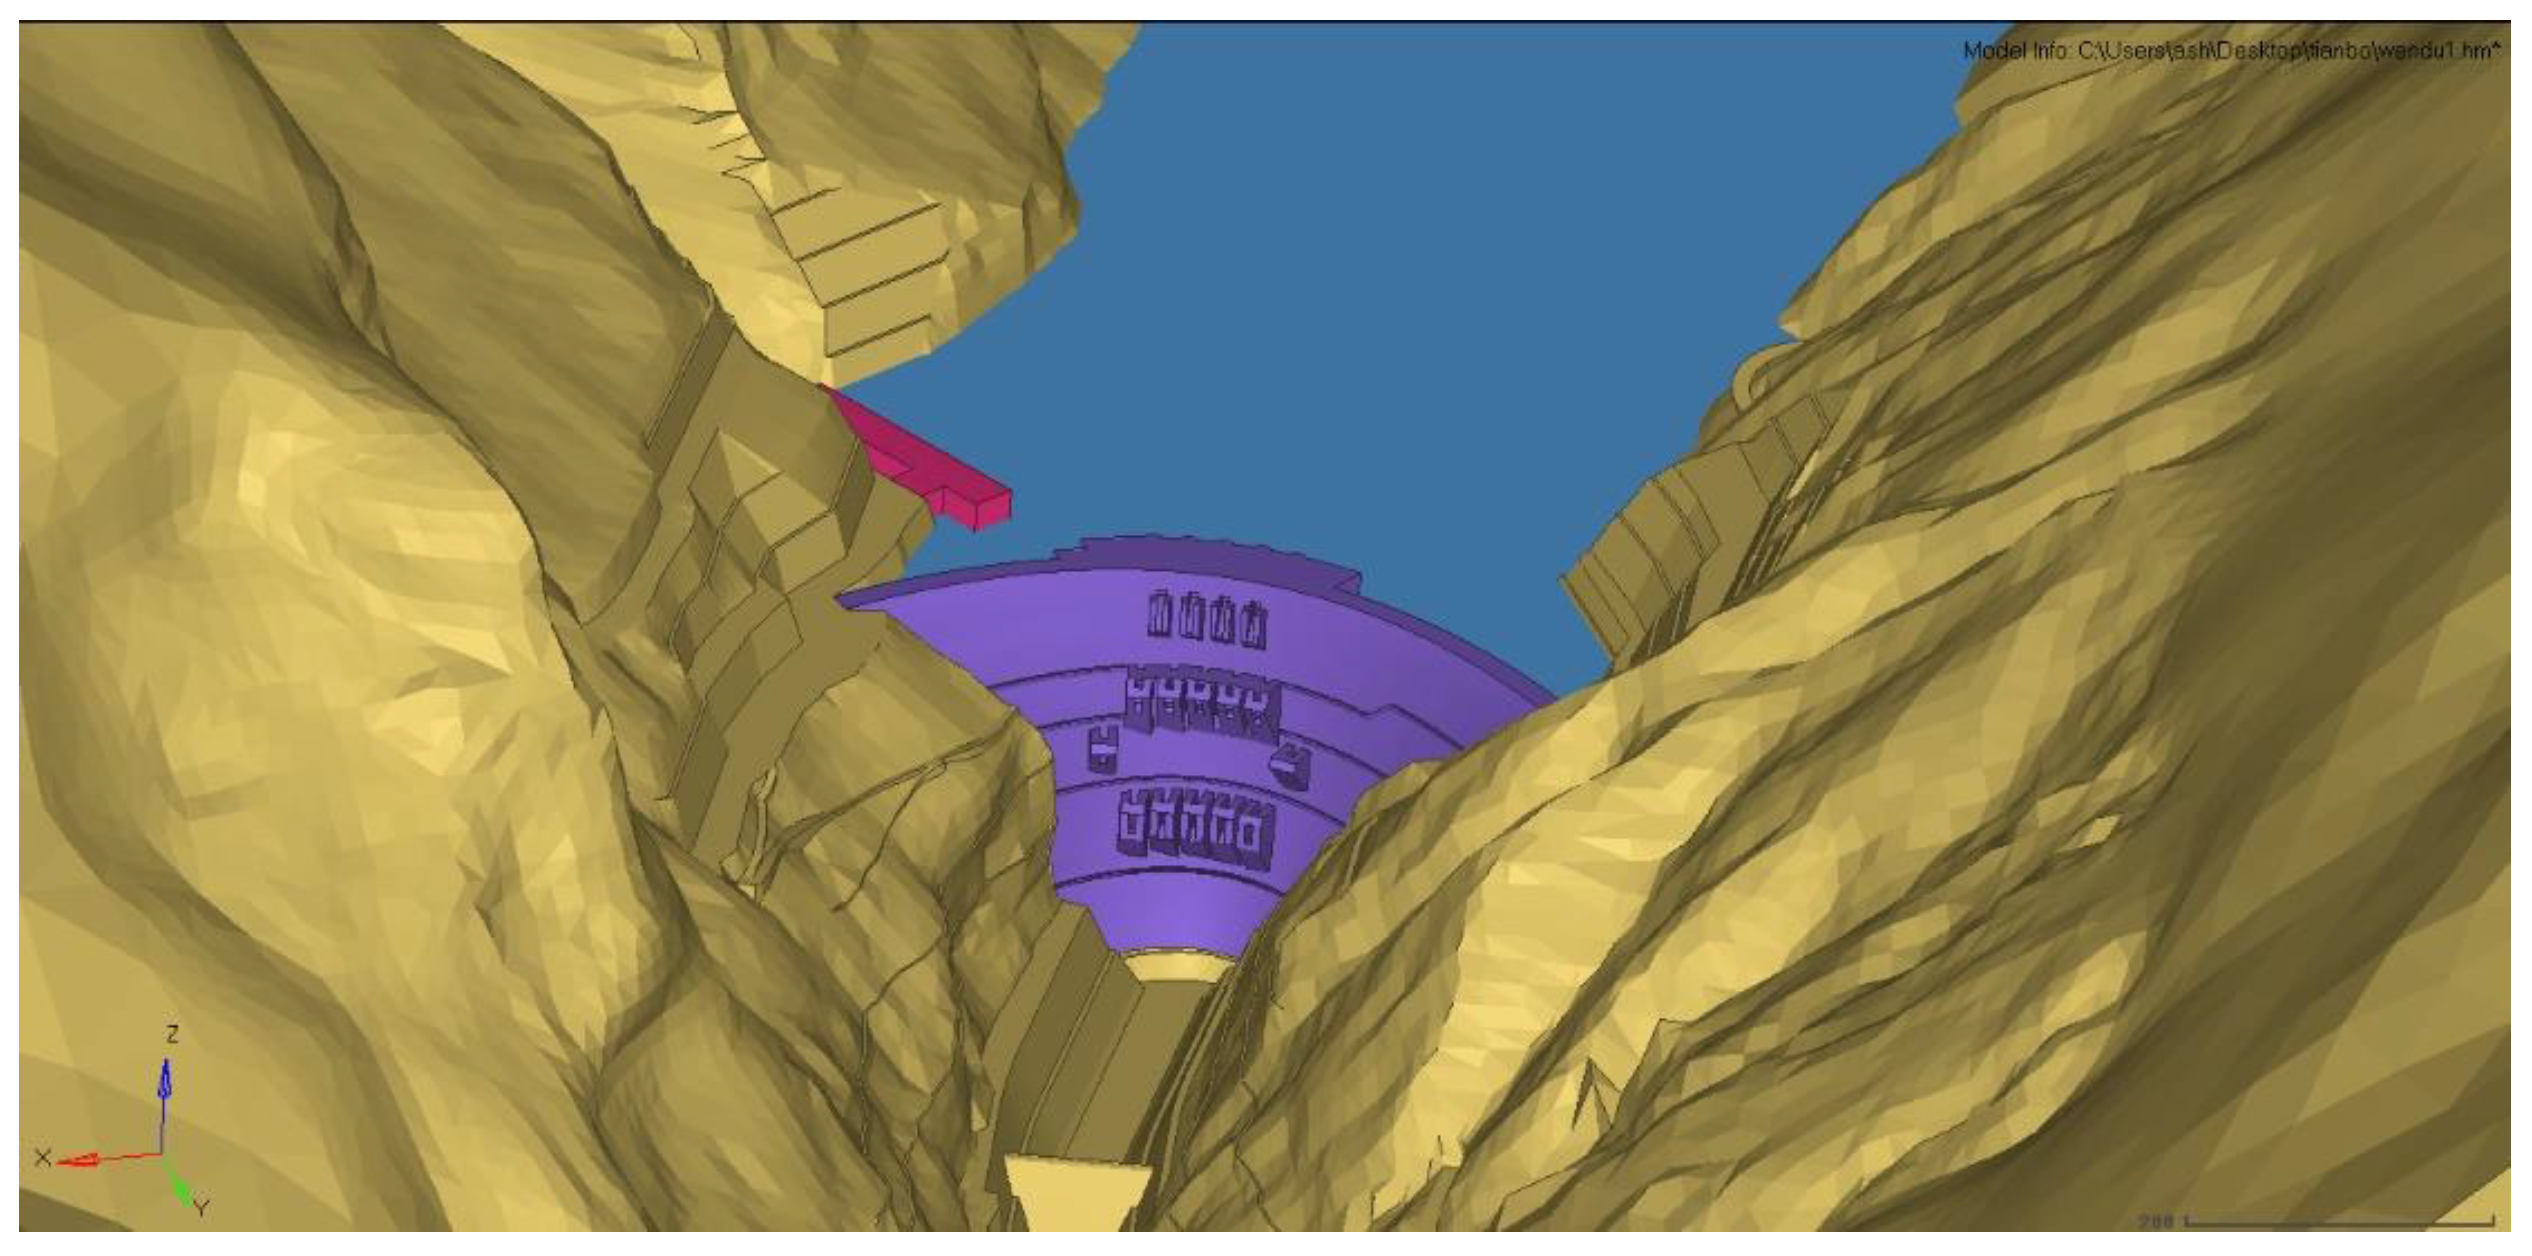
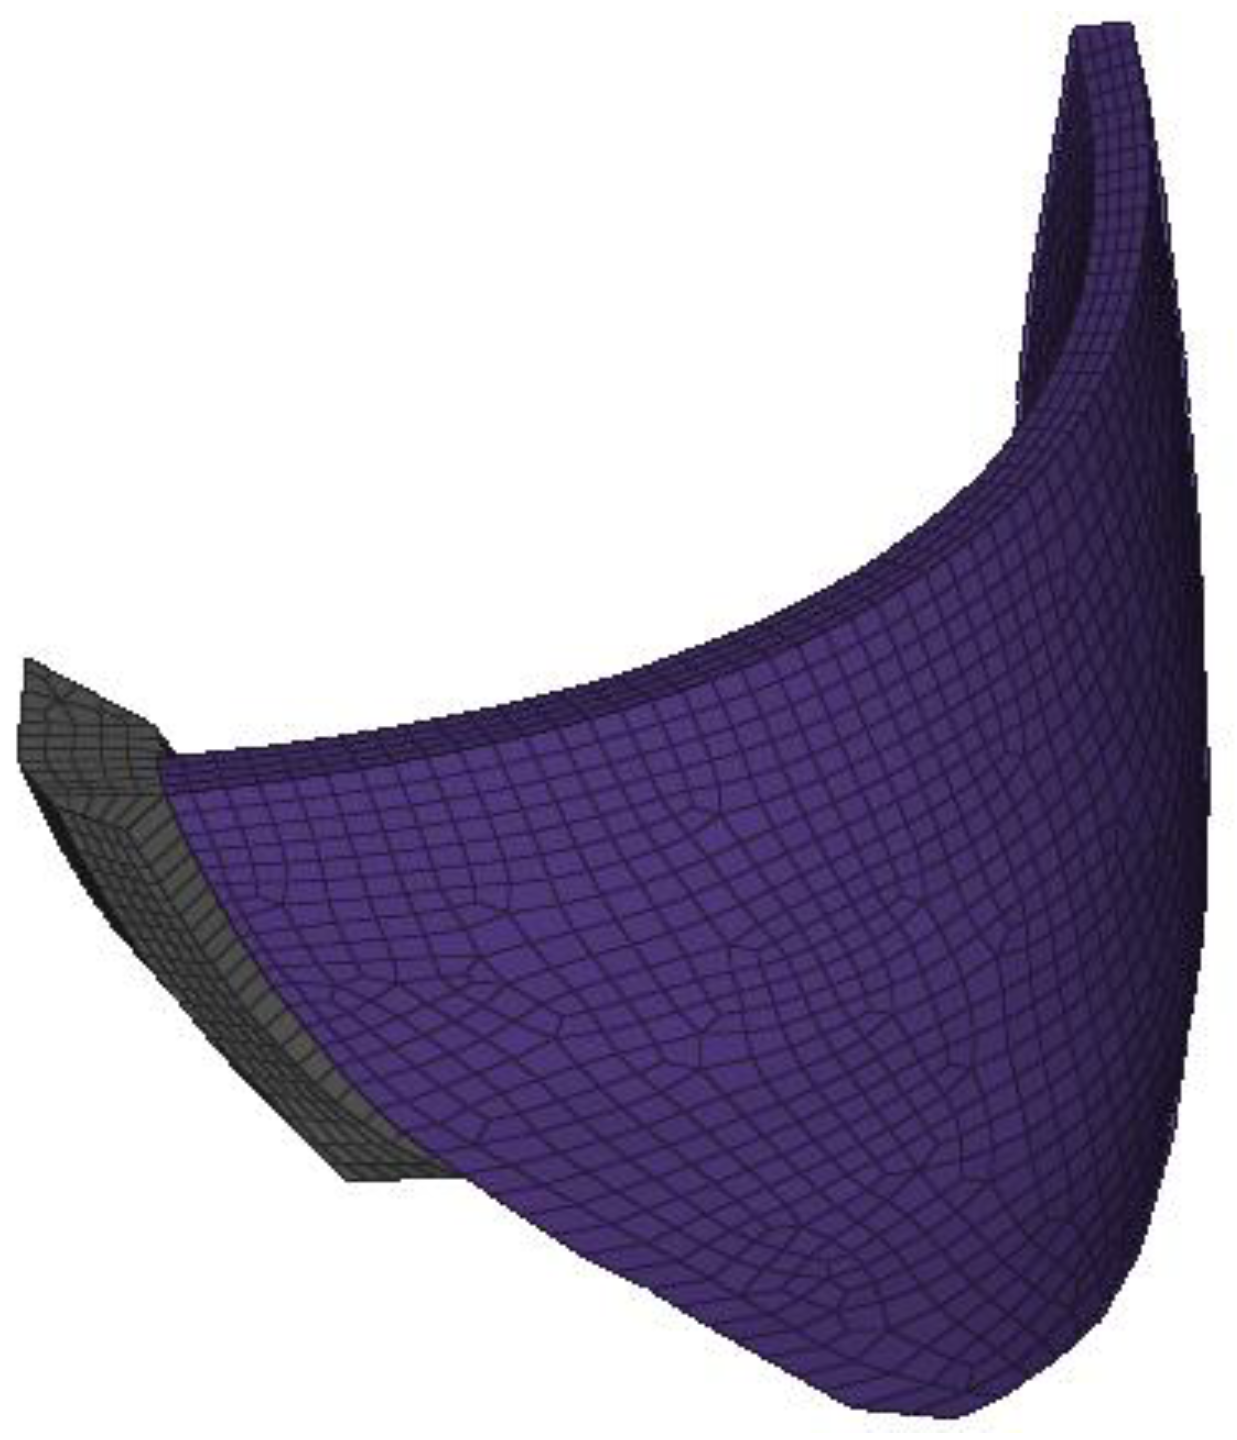
3.1.1. 3D Finite Element Model of Jinping I Arch Dam

Primarily, the finite element model for analyzing the effect of solar radiation was established. The model extended 1500 m upstream, downstream, toward the left bank, and toward the right bank from the crown beam of the super-high arch dam, and 1200 m below the dam foundation. The model adopted eight-node quadratic tetrahedral elements, with a total of 95,255 elements and 110,648 nodes, of which 51,083 were dam body elements. The horizontal and vertical sizes of the mesh for the dam body elements were both 9 to 10 m, and the horizontal and vertical sizes of the mesh for the foundation elements gradually changed from 100 to 10 m from bottom to top. The coordinate origin was set to the midpoint of the foundation surface of the crown beam, with the tangential direction pointing towards the left bank as positive, the radial direction toward downstream as positive, and the vertical direction towards upward as positive. The model accurately depicts the shape of the arch dam, slope excavation, surrounding mountain shape, etc., in order to calculate the shading range in real-time based on the ray-tracing method. The finite element model of the super-high arch dam is shown in Figure 6 and Figure 7.
As the area of the downstream water body is relatively small and is less affected by solar radiation, the focus of the analysis should be on the upstream water body. Figure 8 shows the finite element model used to calculate the effect of solar radiation on the water body, and the shading effect of the surrounding mountains must also be considered during the numerical calculation.

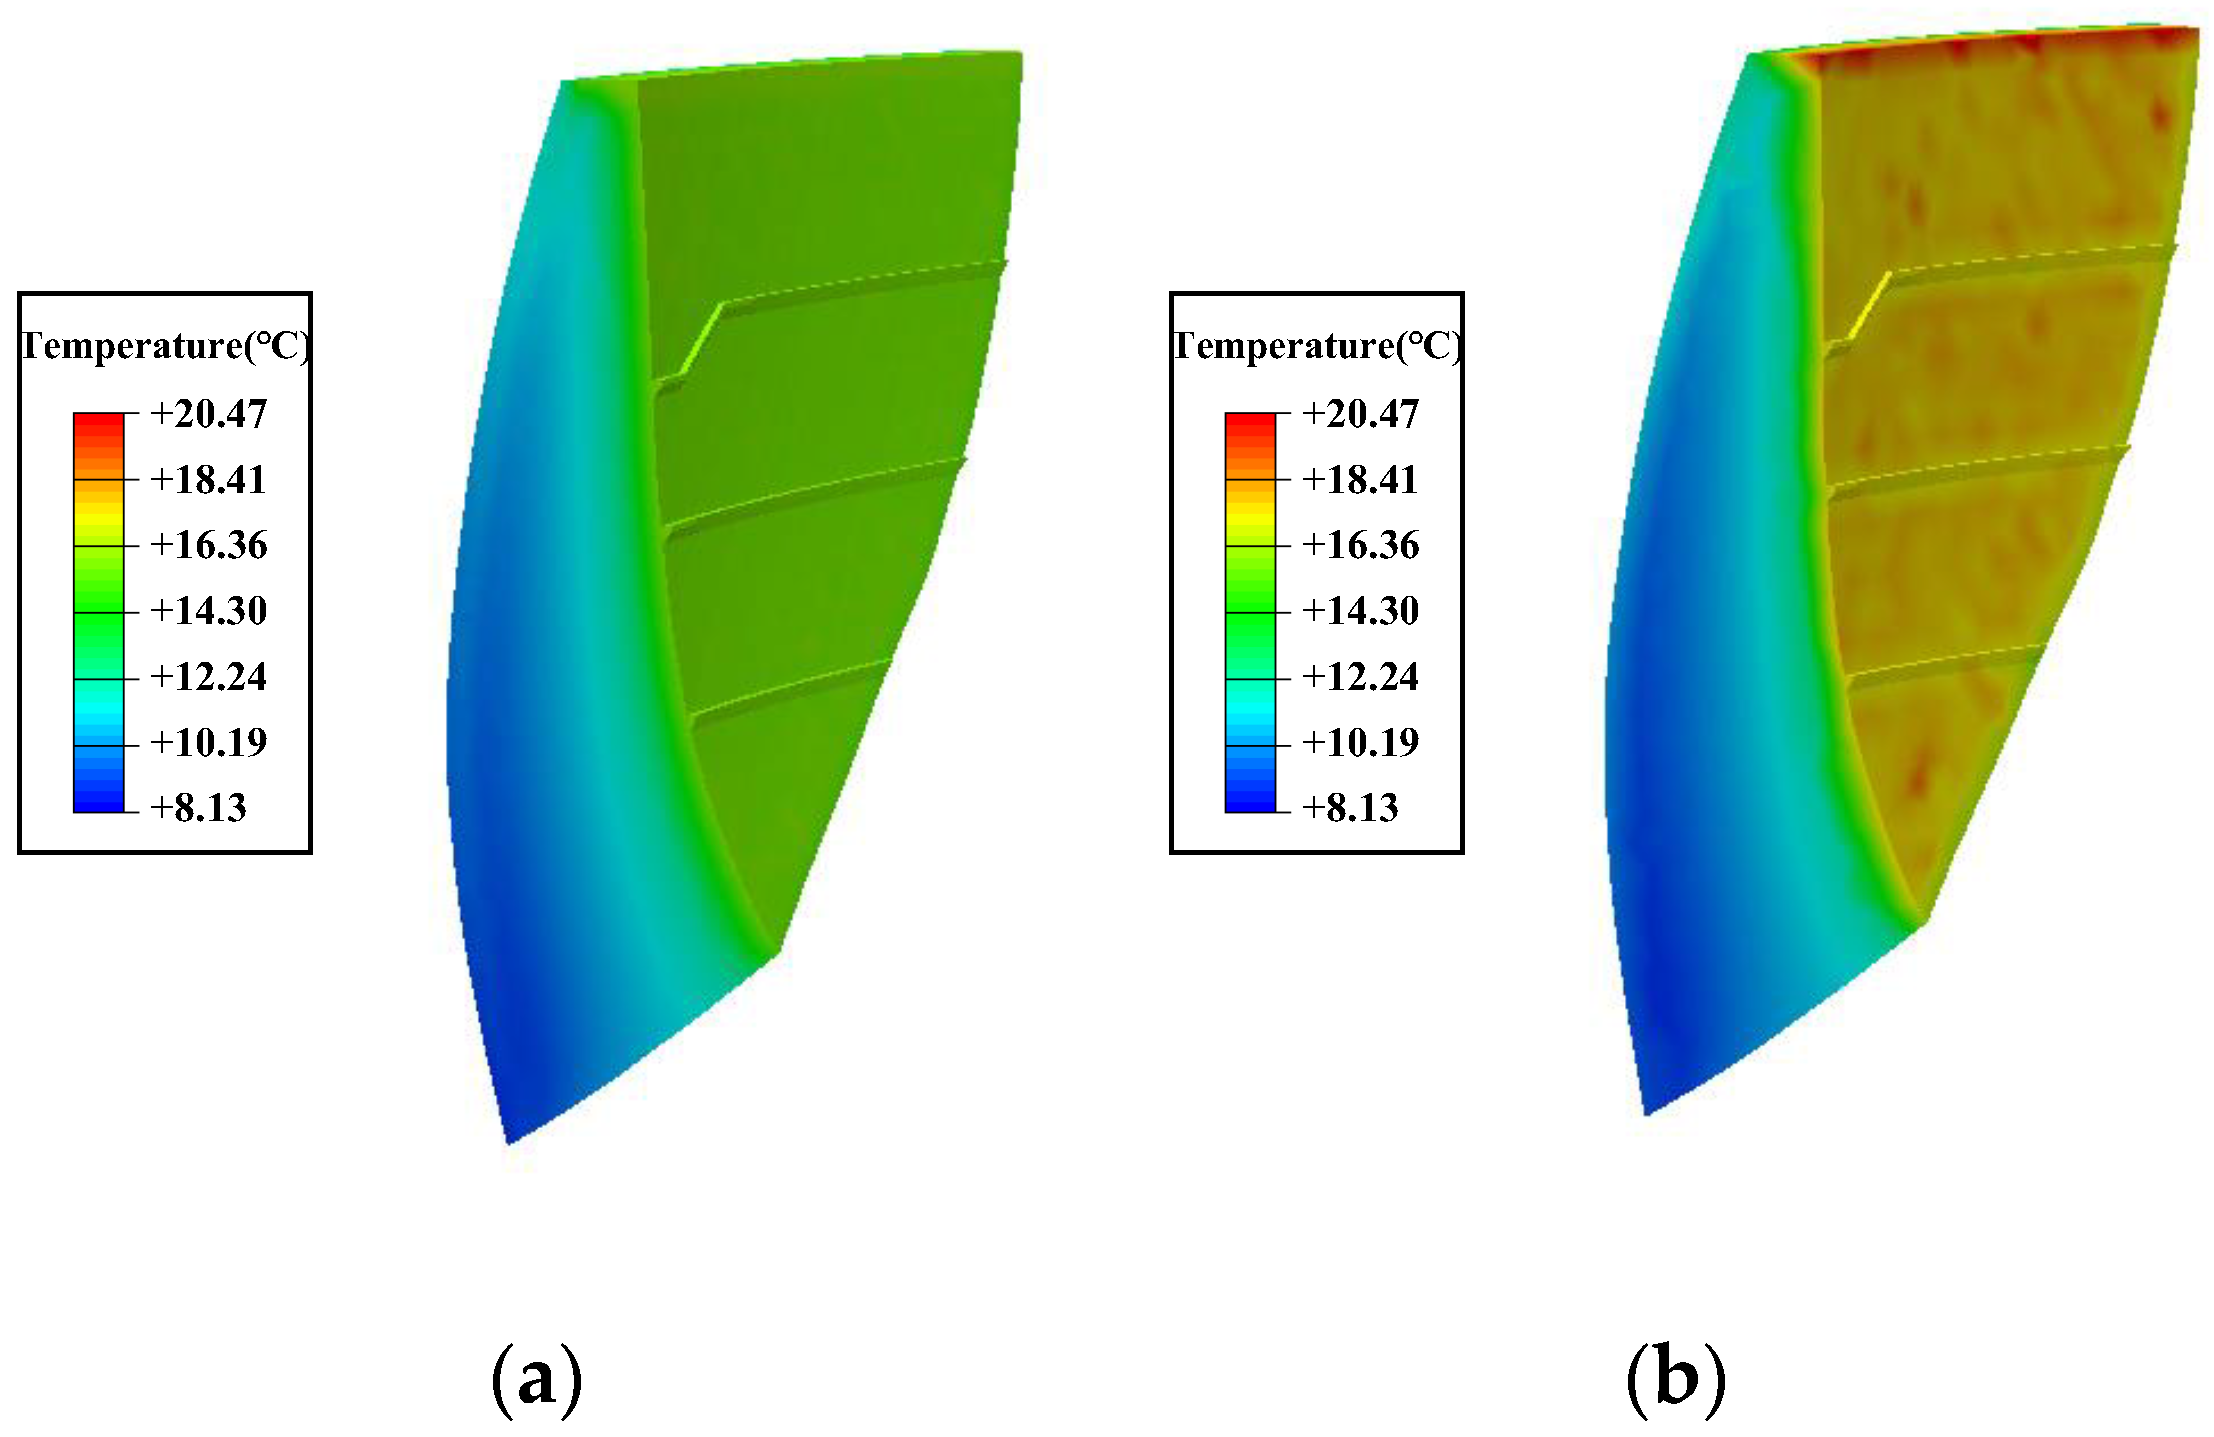
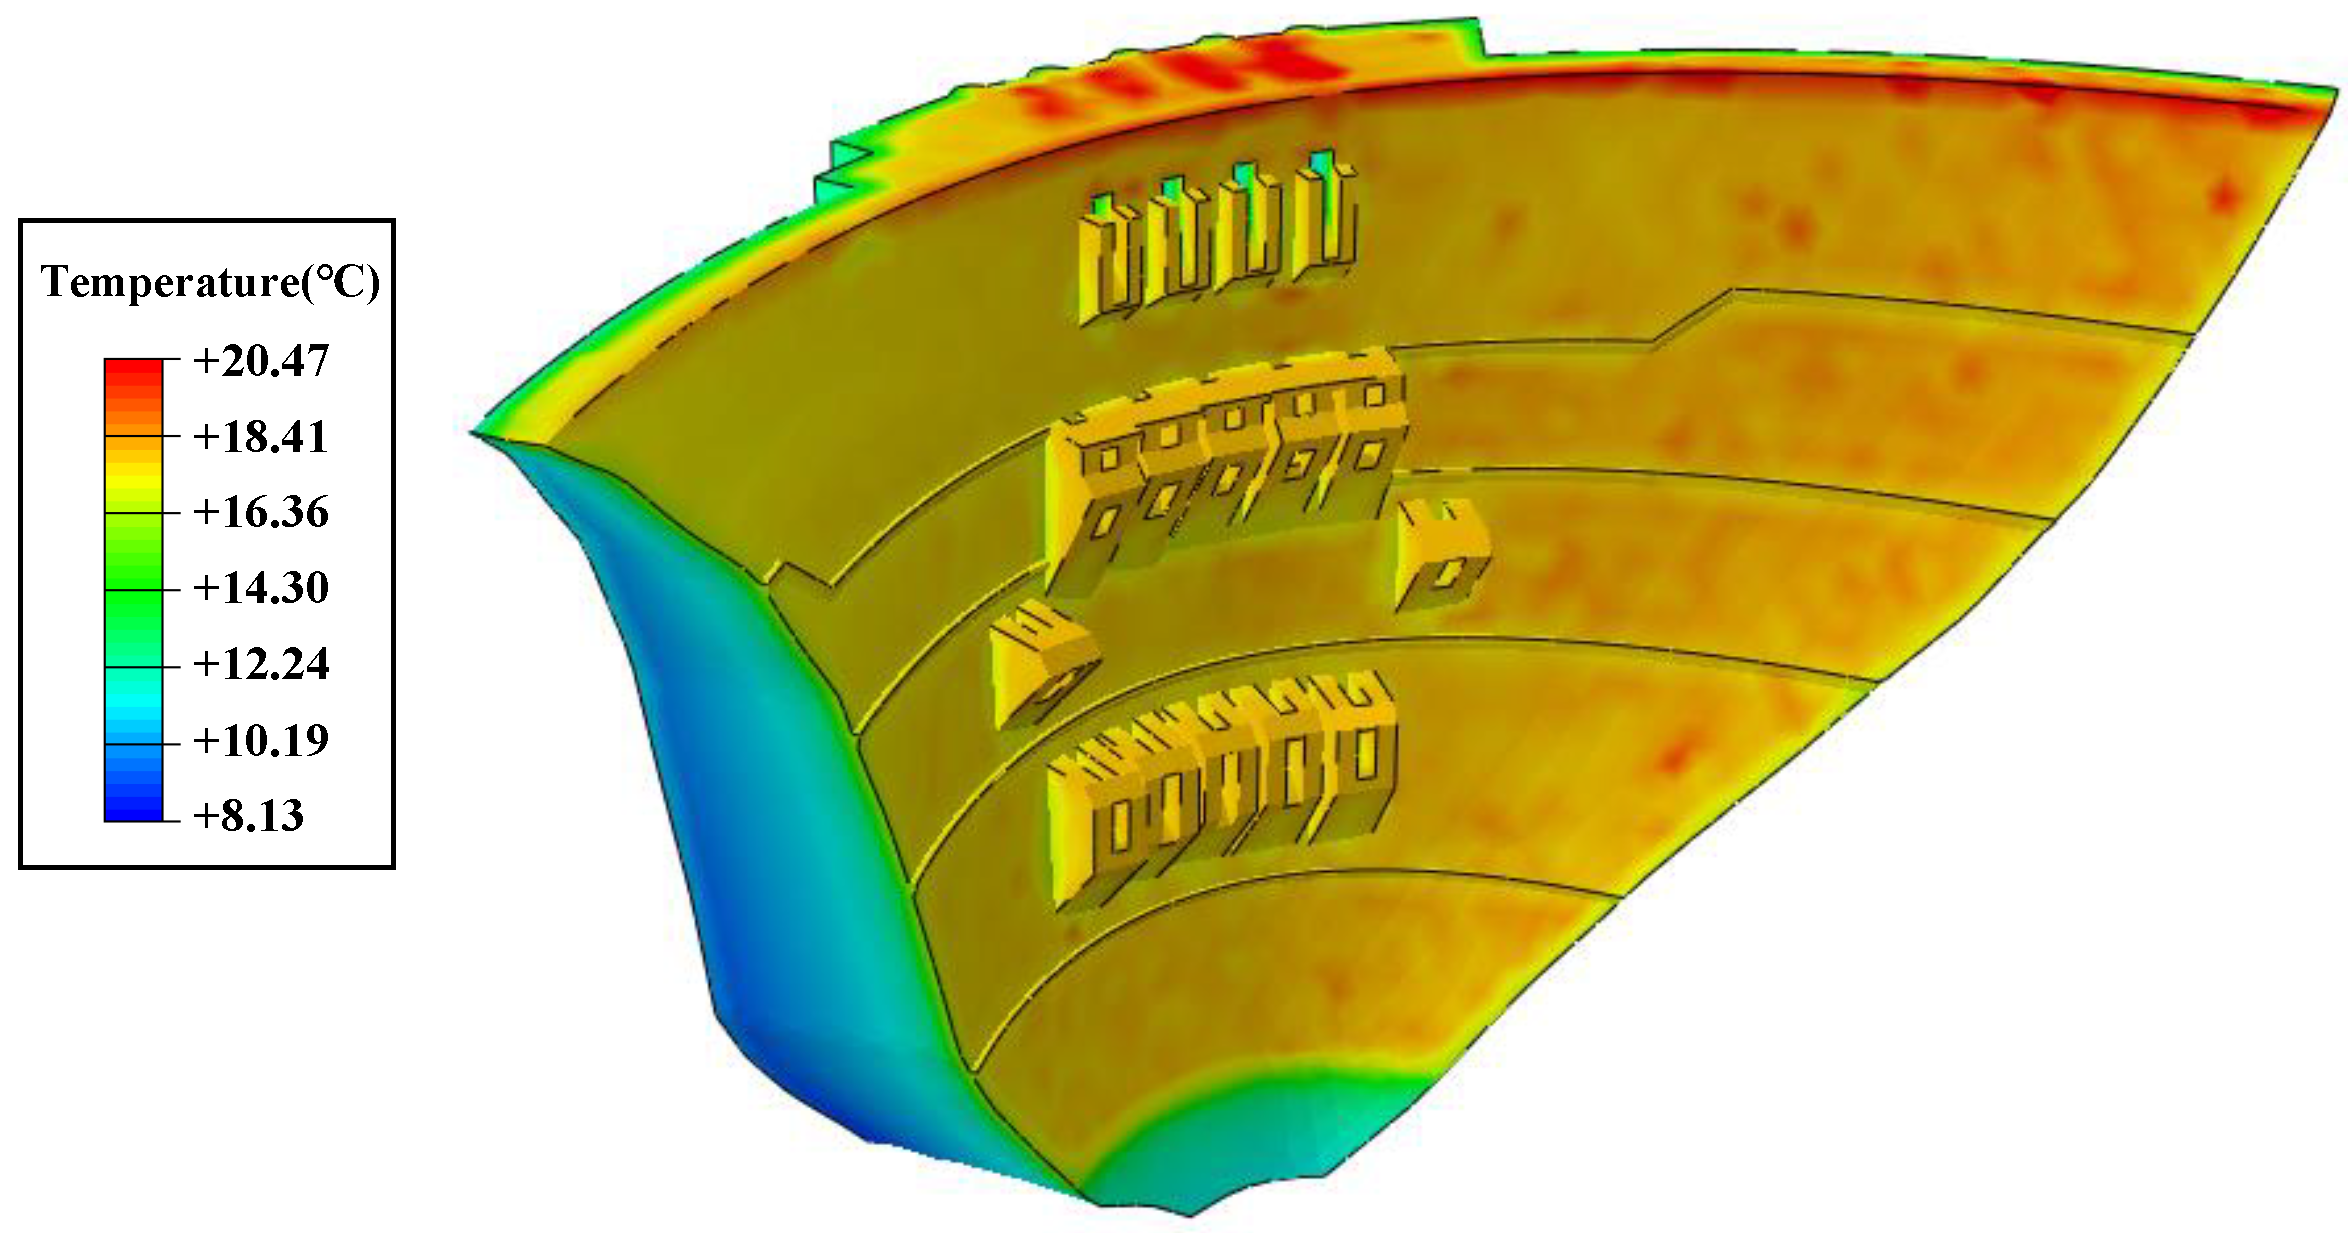
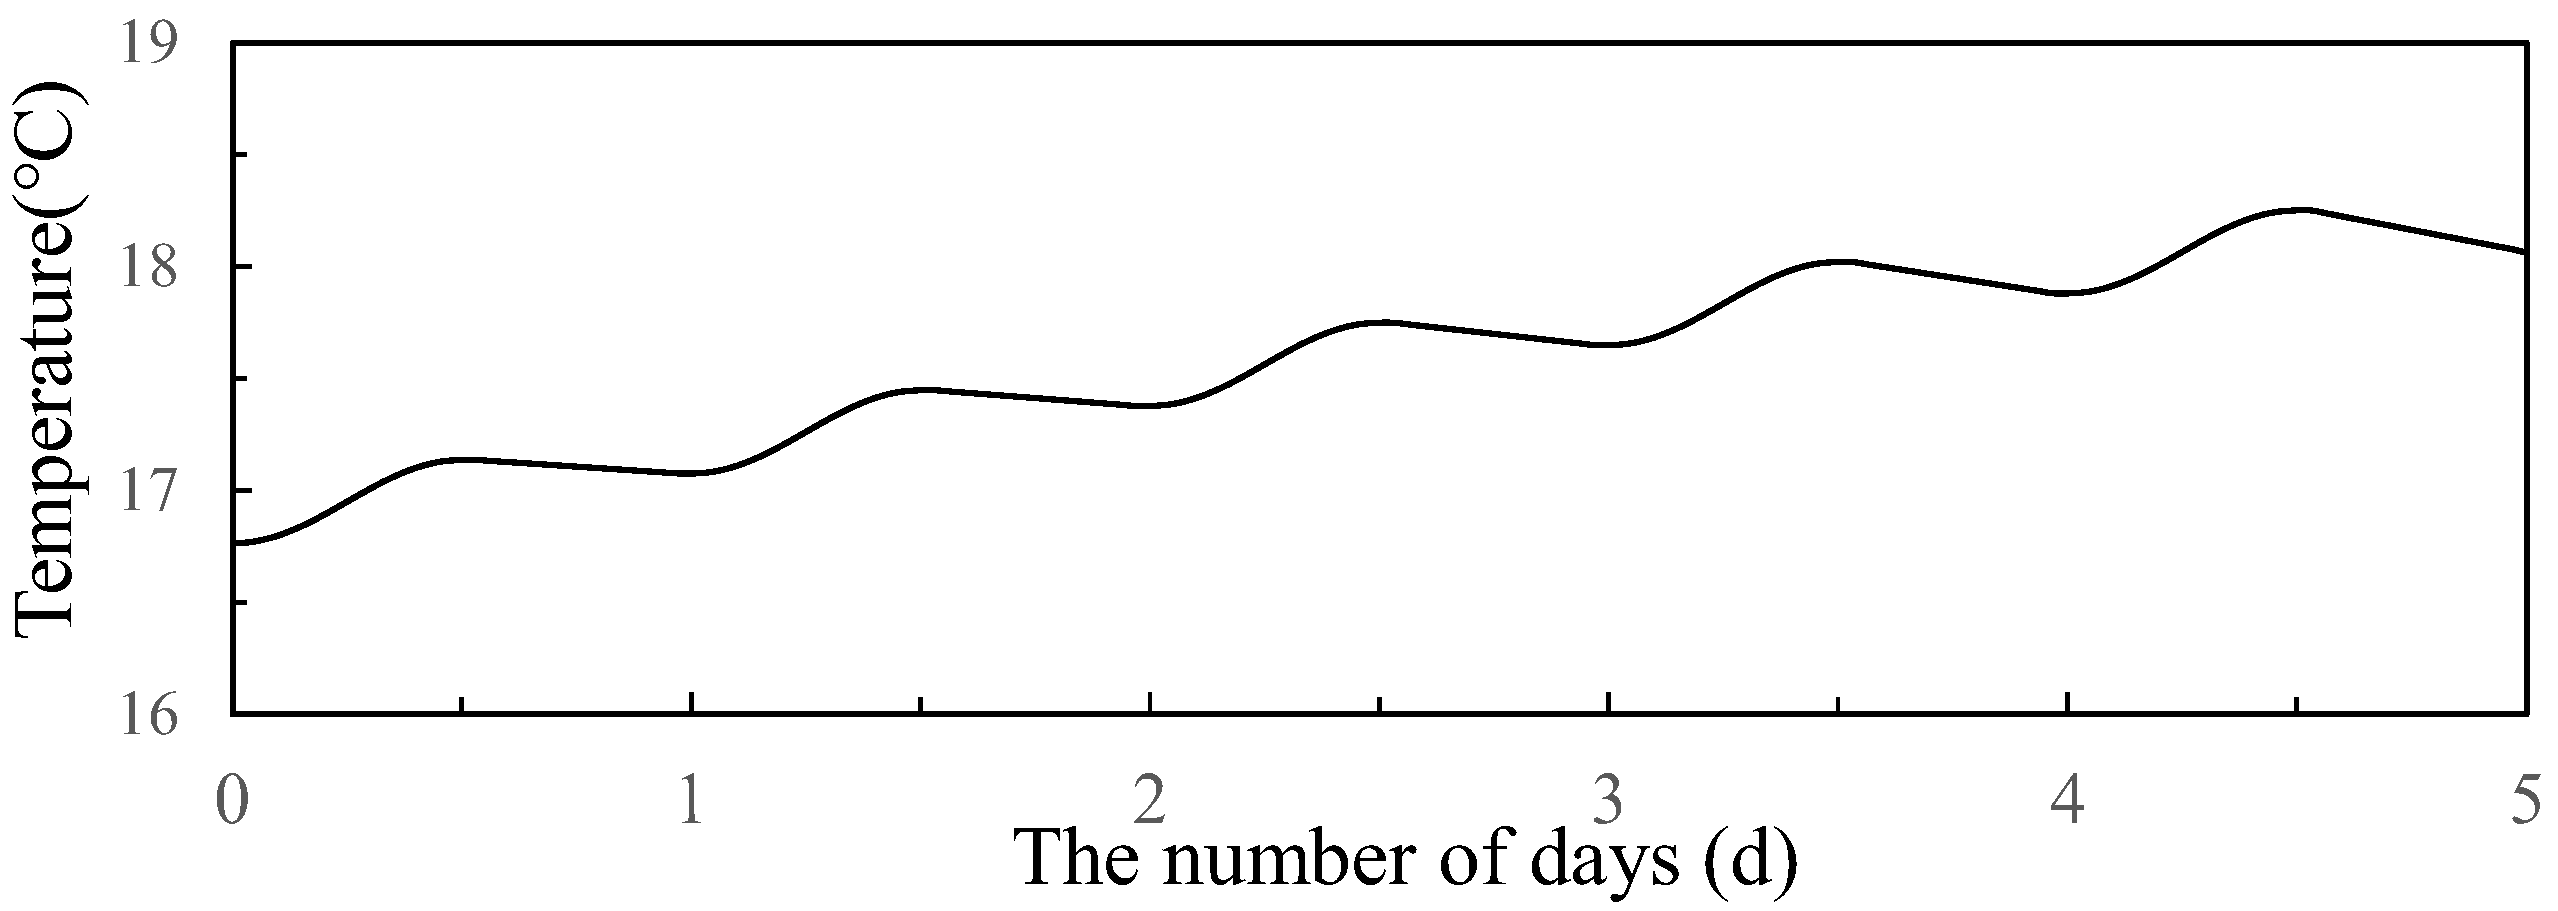
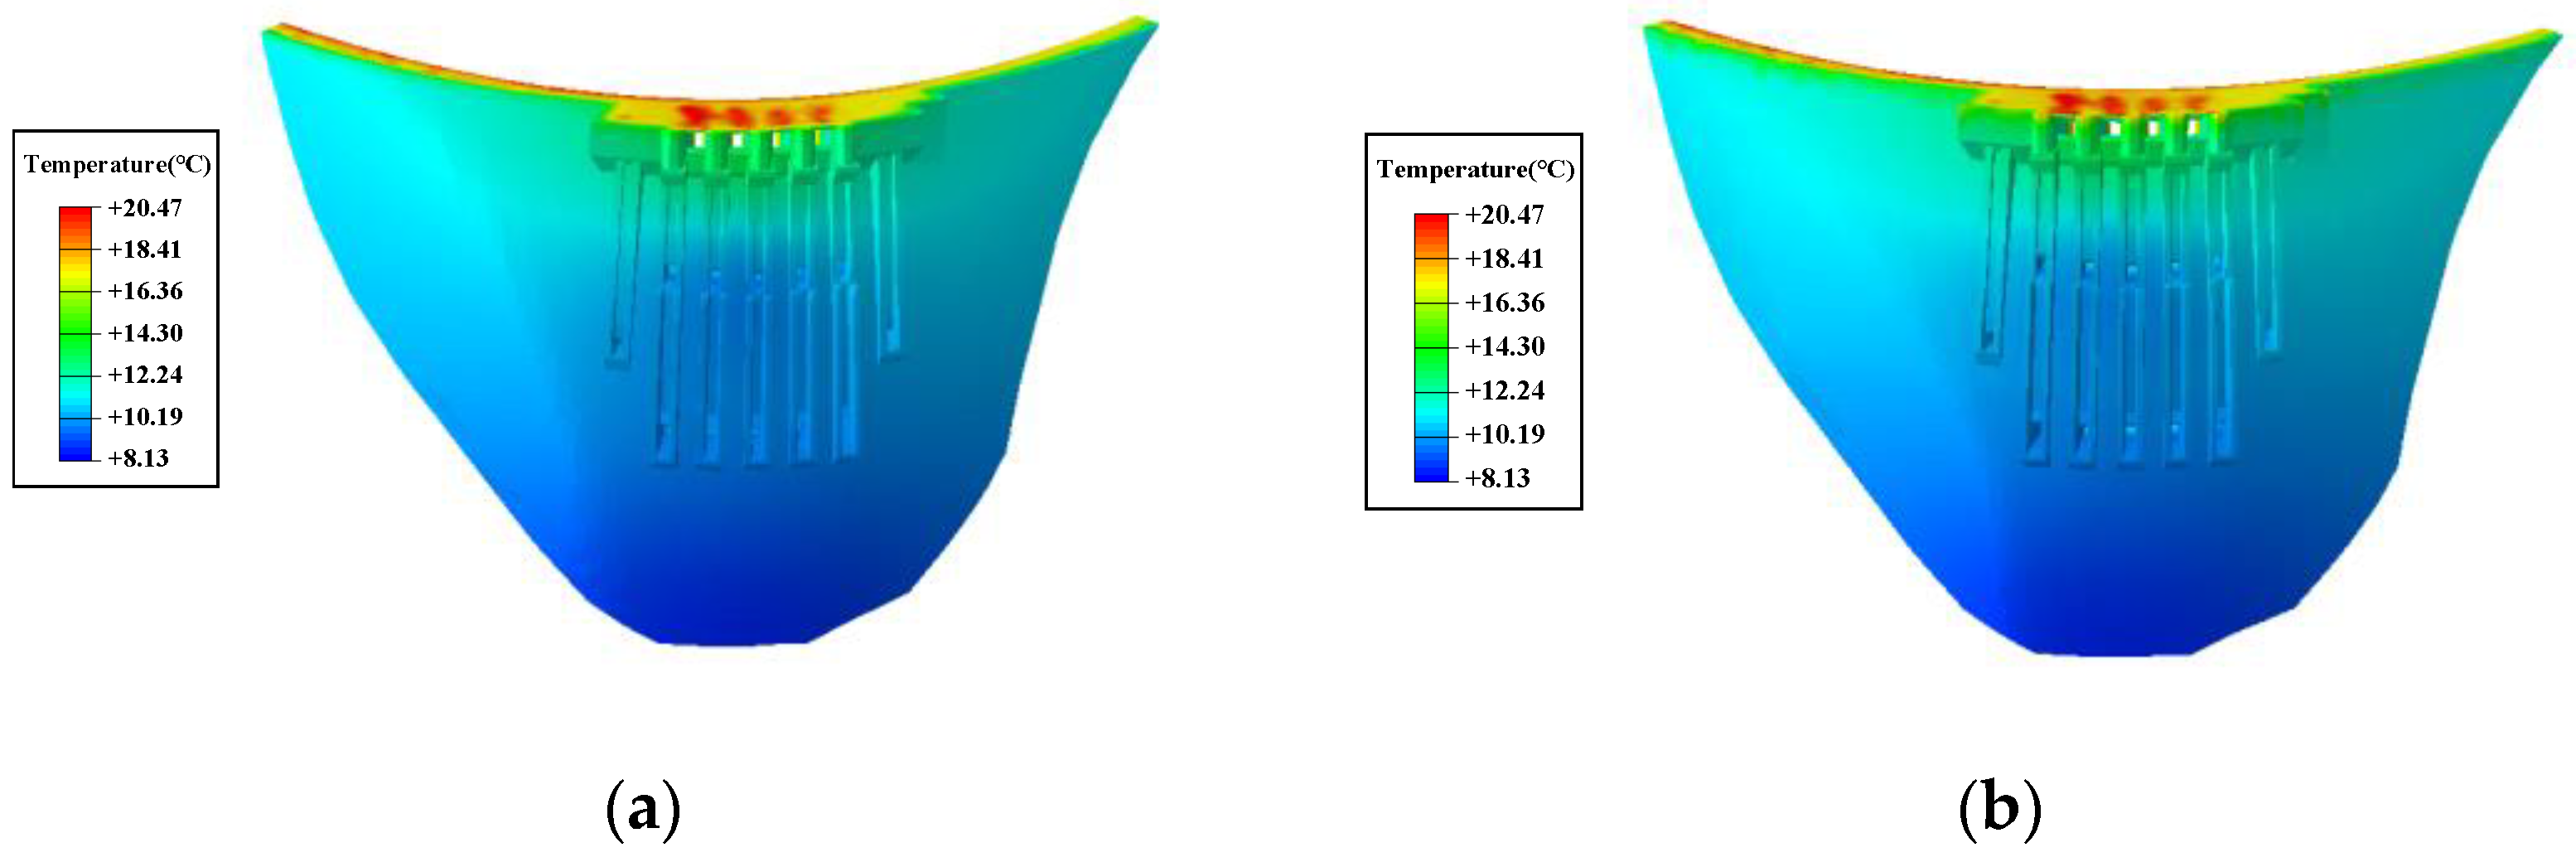
3.1.2. Numerical Calculation Results of Temperature and Deformation Fields of the Jinping I Super-High Arch Dam

Based on the calculated shading information, it can be inferred that in winter, only a small area on the downstream face of the dam on the left bank is exposed to sunlight at noon, and the upstream reservoir is only exposed to direct sunlight for a short period in the afternoon. The calculations show that the impact of solar radiation in winter is negligible. In summer, the left bank of the downstream face of the dam is strongly exposed to sunlight, and the upstream water surface is exposed to direct sunlight for a long time, resulting in a significant impact of solar radiation in summer.
Figure 9 shows a cross-sectional view of the dam’s temperature field after being exposed to sunlight on the summer solstice under clear weather conditions. It can be seen that solar radiation causes the dam’s surface temperature to rise by 2 to 3 °C, and some areas even increase by 4 to 5 °C. Solar radiation mainly affects the temperature of the dam’s surface. Figure 10 illustrates the temperature field of the dam under the influence of solar radiation on the summer solstice under clear weather conditions. It can be seen that the left bank of the downstream face of the dam experiences a significant temperature increase under the influence of solar radiation.
After the sun sets, as the temperature decreases, the dam begins to release heat, causing the surface temperature of the dam to drop. However, in the summer, when temperatures are high, the heat absorbed by the dam’s surface during the day cannot be completely released at night, and continuous clear weather can cause a cumulative increase in the dam’s surface temperature. Figure 11 shows the temperature curve of the downstream left bank of the dam during five consecutive sunny days in summer. It can be seen in the figure that as the absolute temperature of the dam’s surface increases and the temperature difference from the environment increases, more heat is released at night, ultimately forming an equilibrium state.
In summer, the upstream water body is significantly affected by solar radiation, and the temperature of the water surface increases due to heat absorption, which affects the nearby dam body. Figure 12 shows the impact of water temperature correction on the dam temperature field. It can be observed that after the water temperature correction, the temperature of the dam’s surface near the top increases to a certain extent.
The dam temperature increased by 2 to 5 °C and the dam deformed by 0.42 mm towards the upstream in summer in clear weather conditions. As shown in Figure 13, the deformation center was biased towards the left bank due to the strong solar radiation on the left bank. The deformation caused by solar radiation of a whole day was relatively small, but under the influence of continuous clear weather, the maximum deformation caused by solar radiation was 3.87 mm towards the upstream part of the dam, as shown in Figure 14.
Finally, the temperature and deformation fields of the dam body in summer, which are jointly affected by air temperature, water temperature, and solar radiation, are shown in Figure 15. The maximal deformation occurred at the arch crown beam, alongside upstream deformation of 12.61 mm. The effect of solar radiation accounted for one-third of the total deformation, when the maximum upstream deformation was 3.87 mm, indicating a significant influence of solar radiation. Considering the significant seasonal variability of solar radiation, its effect on the dam body can be ignored during winter due to the shading effect of the mountain.

3.2. Analysis of the Influence of Valley Contraction on a Super-High Arch Dam’s Deformation in the Alpine and Gorge Regions in Southwest China

3.2.1. 3D Finite Element Model of Jinping I Arch Dam

The finite element model was established to analyze the impact of valley contraction on the dam’s deformation, as shown in Figure 16 and Figure 17. The model extended 1810 m upstream, downstream, left, and right from the arch crown beam of the special high arch dam. Note that 1500 m below was the dam’s foundation. The model involved eight-node hexahedral elements, for a total of 88,144 elements and 97,659 nodes, of which 5248 were dam elements. The horizontal and vertical sizes of the mesh of dam elements were 9 to 10 m, and the horizontal and vertical sizes of the mesh of foundation elements gradually decreased from 100 to 10 m from bottom to top. The model considers the shape of the nearby mountain, the anti-seepage curtain, and the drainage system of the resisting body. The coordinate origin was set to the midpoint of the arch crown beam foundation, with the tangential direction pointing towards the right bank as positive, the radial direction pointing towards the downstream as positive, and the vertical direction pointing upwards as positive. At the same time, it can be observed in Figure 18 that the body size of the arch dam is relatively small compared to the two mountain slopes. Therefore, in the alpine and gorge regions of Southwest China, the deformation of the valley’s contraction and its squeezing effect on the dam body will be significant.

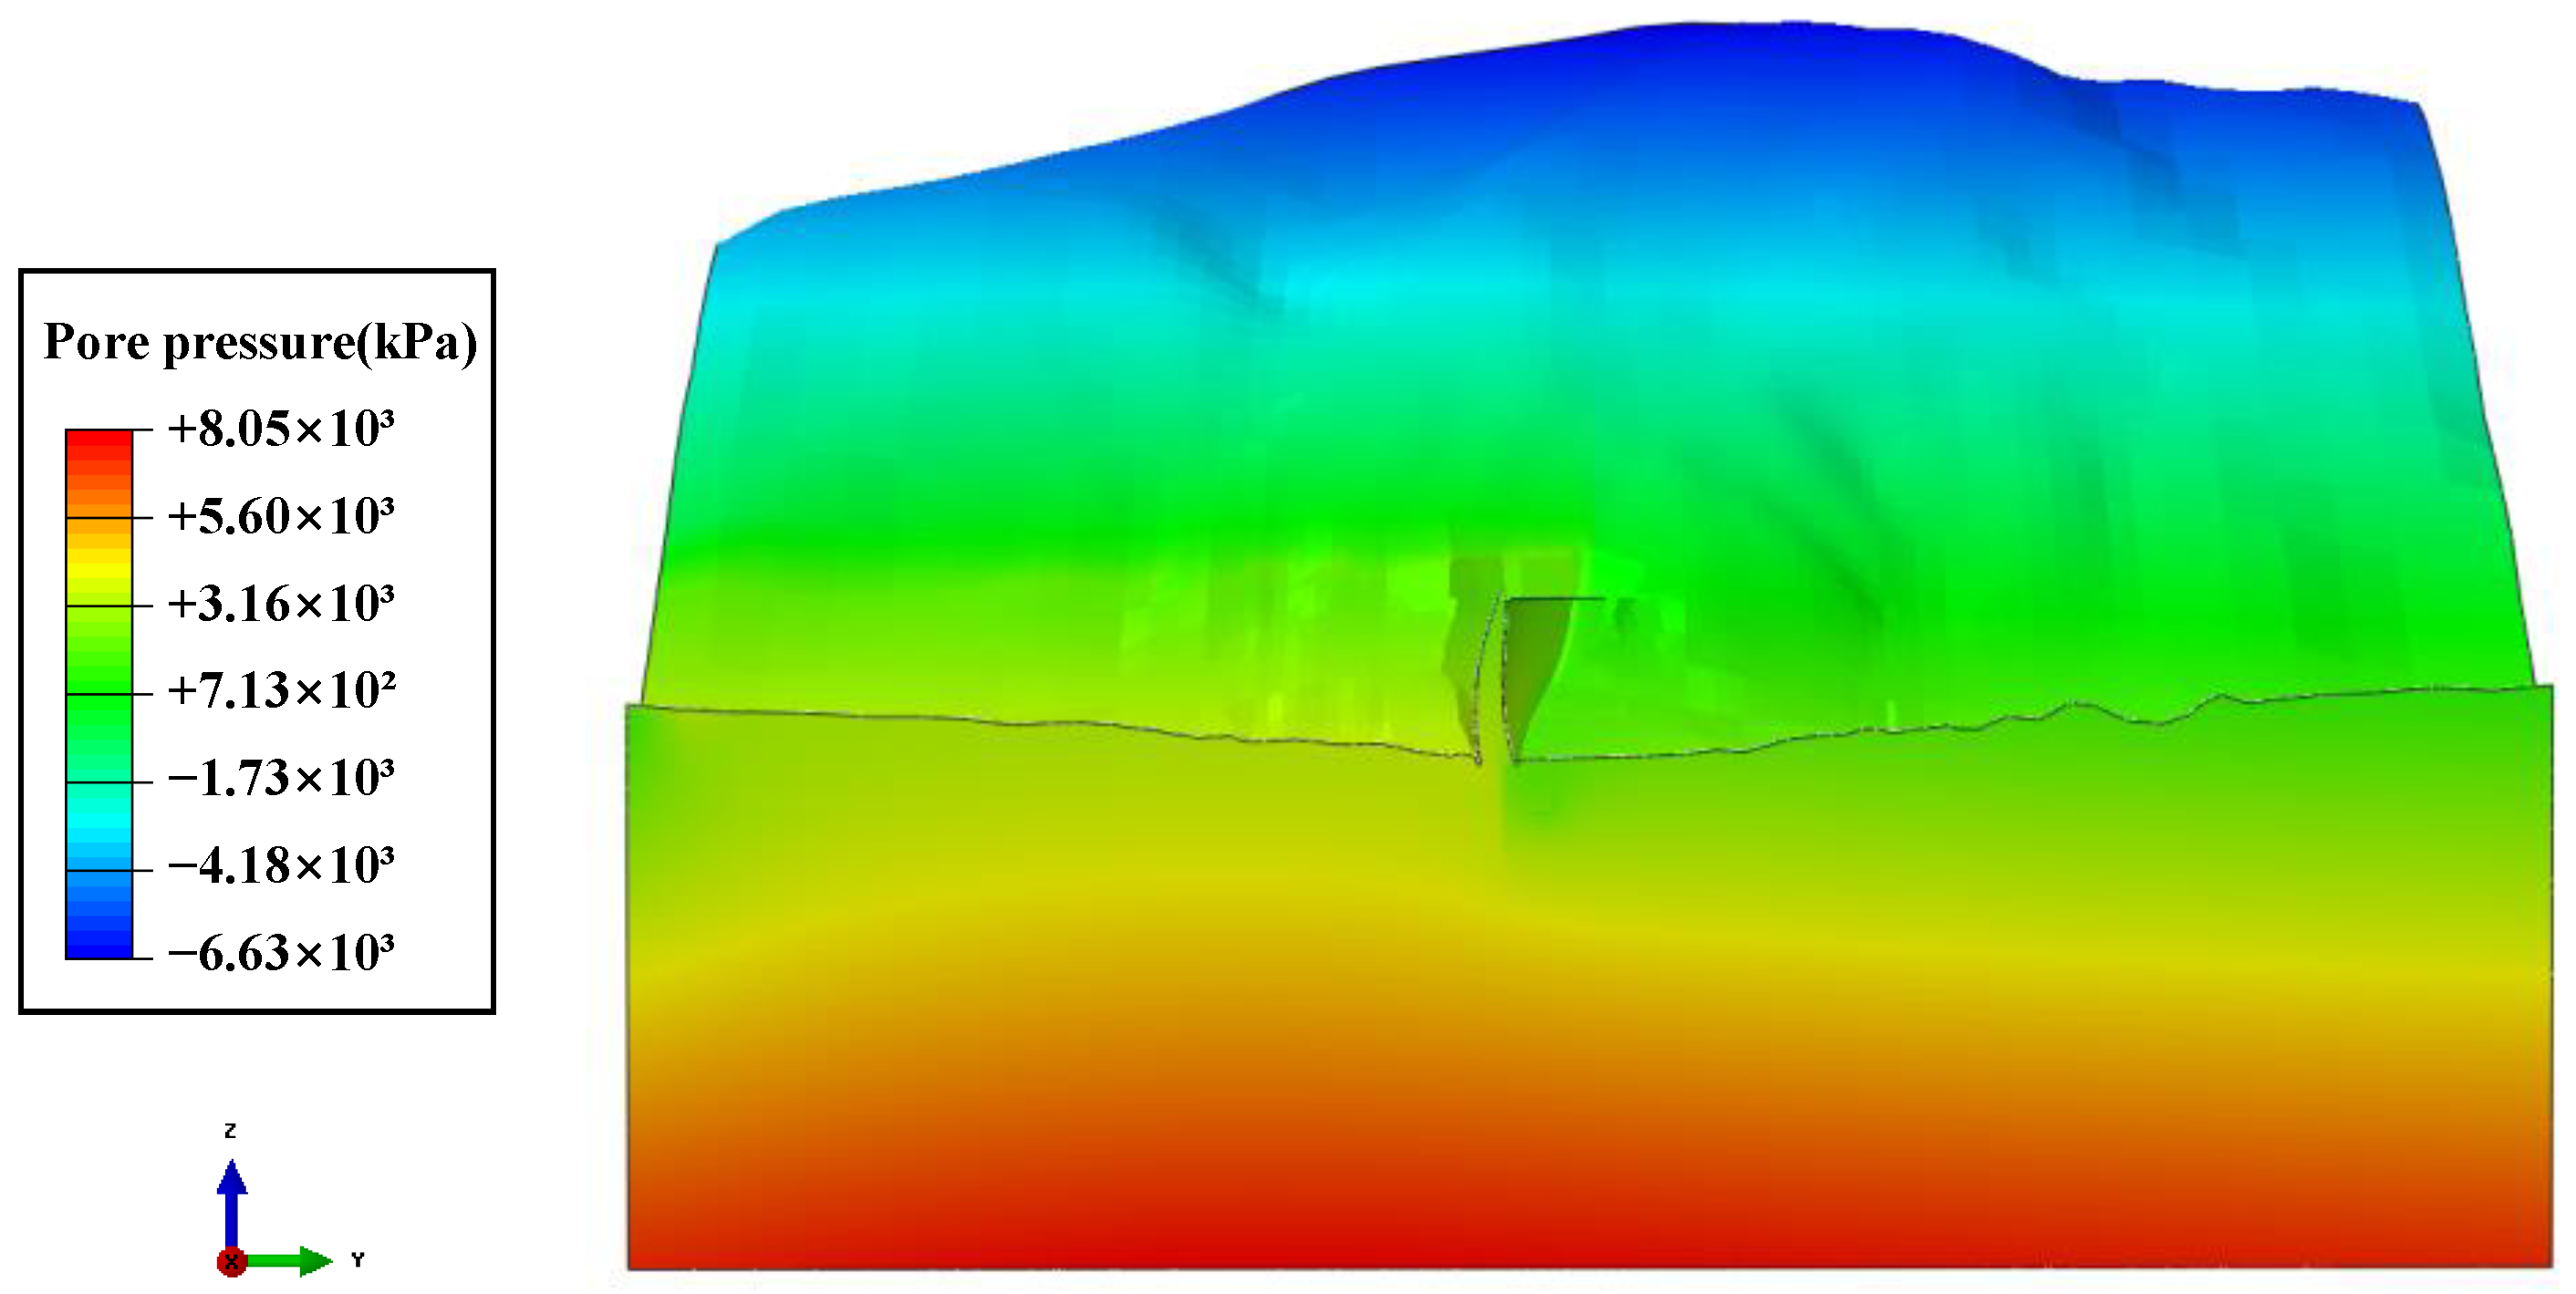
3.2.2. Analysis of the Pore Pressure of a Super-High Arch Dam under Normal Storage Conditions

Finite element numerical calculation was conducted to analyze the pore pressure of the super-high arch dam under normal storage conditions. As shown in Figure 18, the pore pressure in the riverbed cross section is highest in the upper mountain and deep foundation, reaching megapascal levels. However, the pore pressure in the upper mountain is negative, as there is no seepage of reservoir water, and the pore pressure in the deep foundation is positive. In addition, within the elevation range of the dam body, the pore pressure in the upstream rock is greater than that in the downstream rock, which is caused by the direction of internal seepage in the mountain from upstream to downstream due to the large difference between the upstream and downstream water levels.

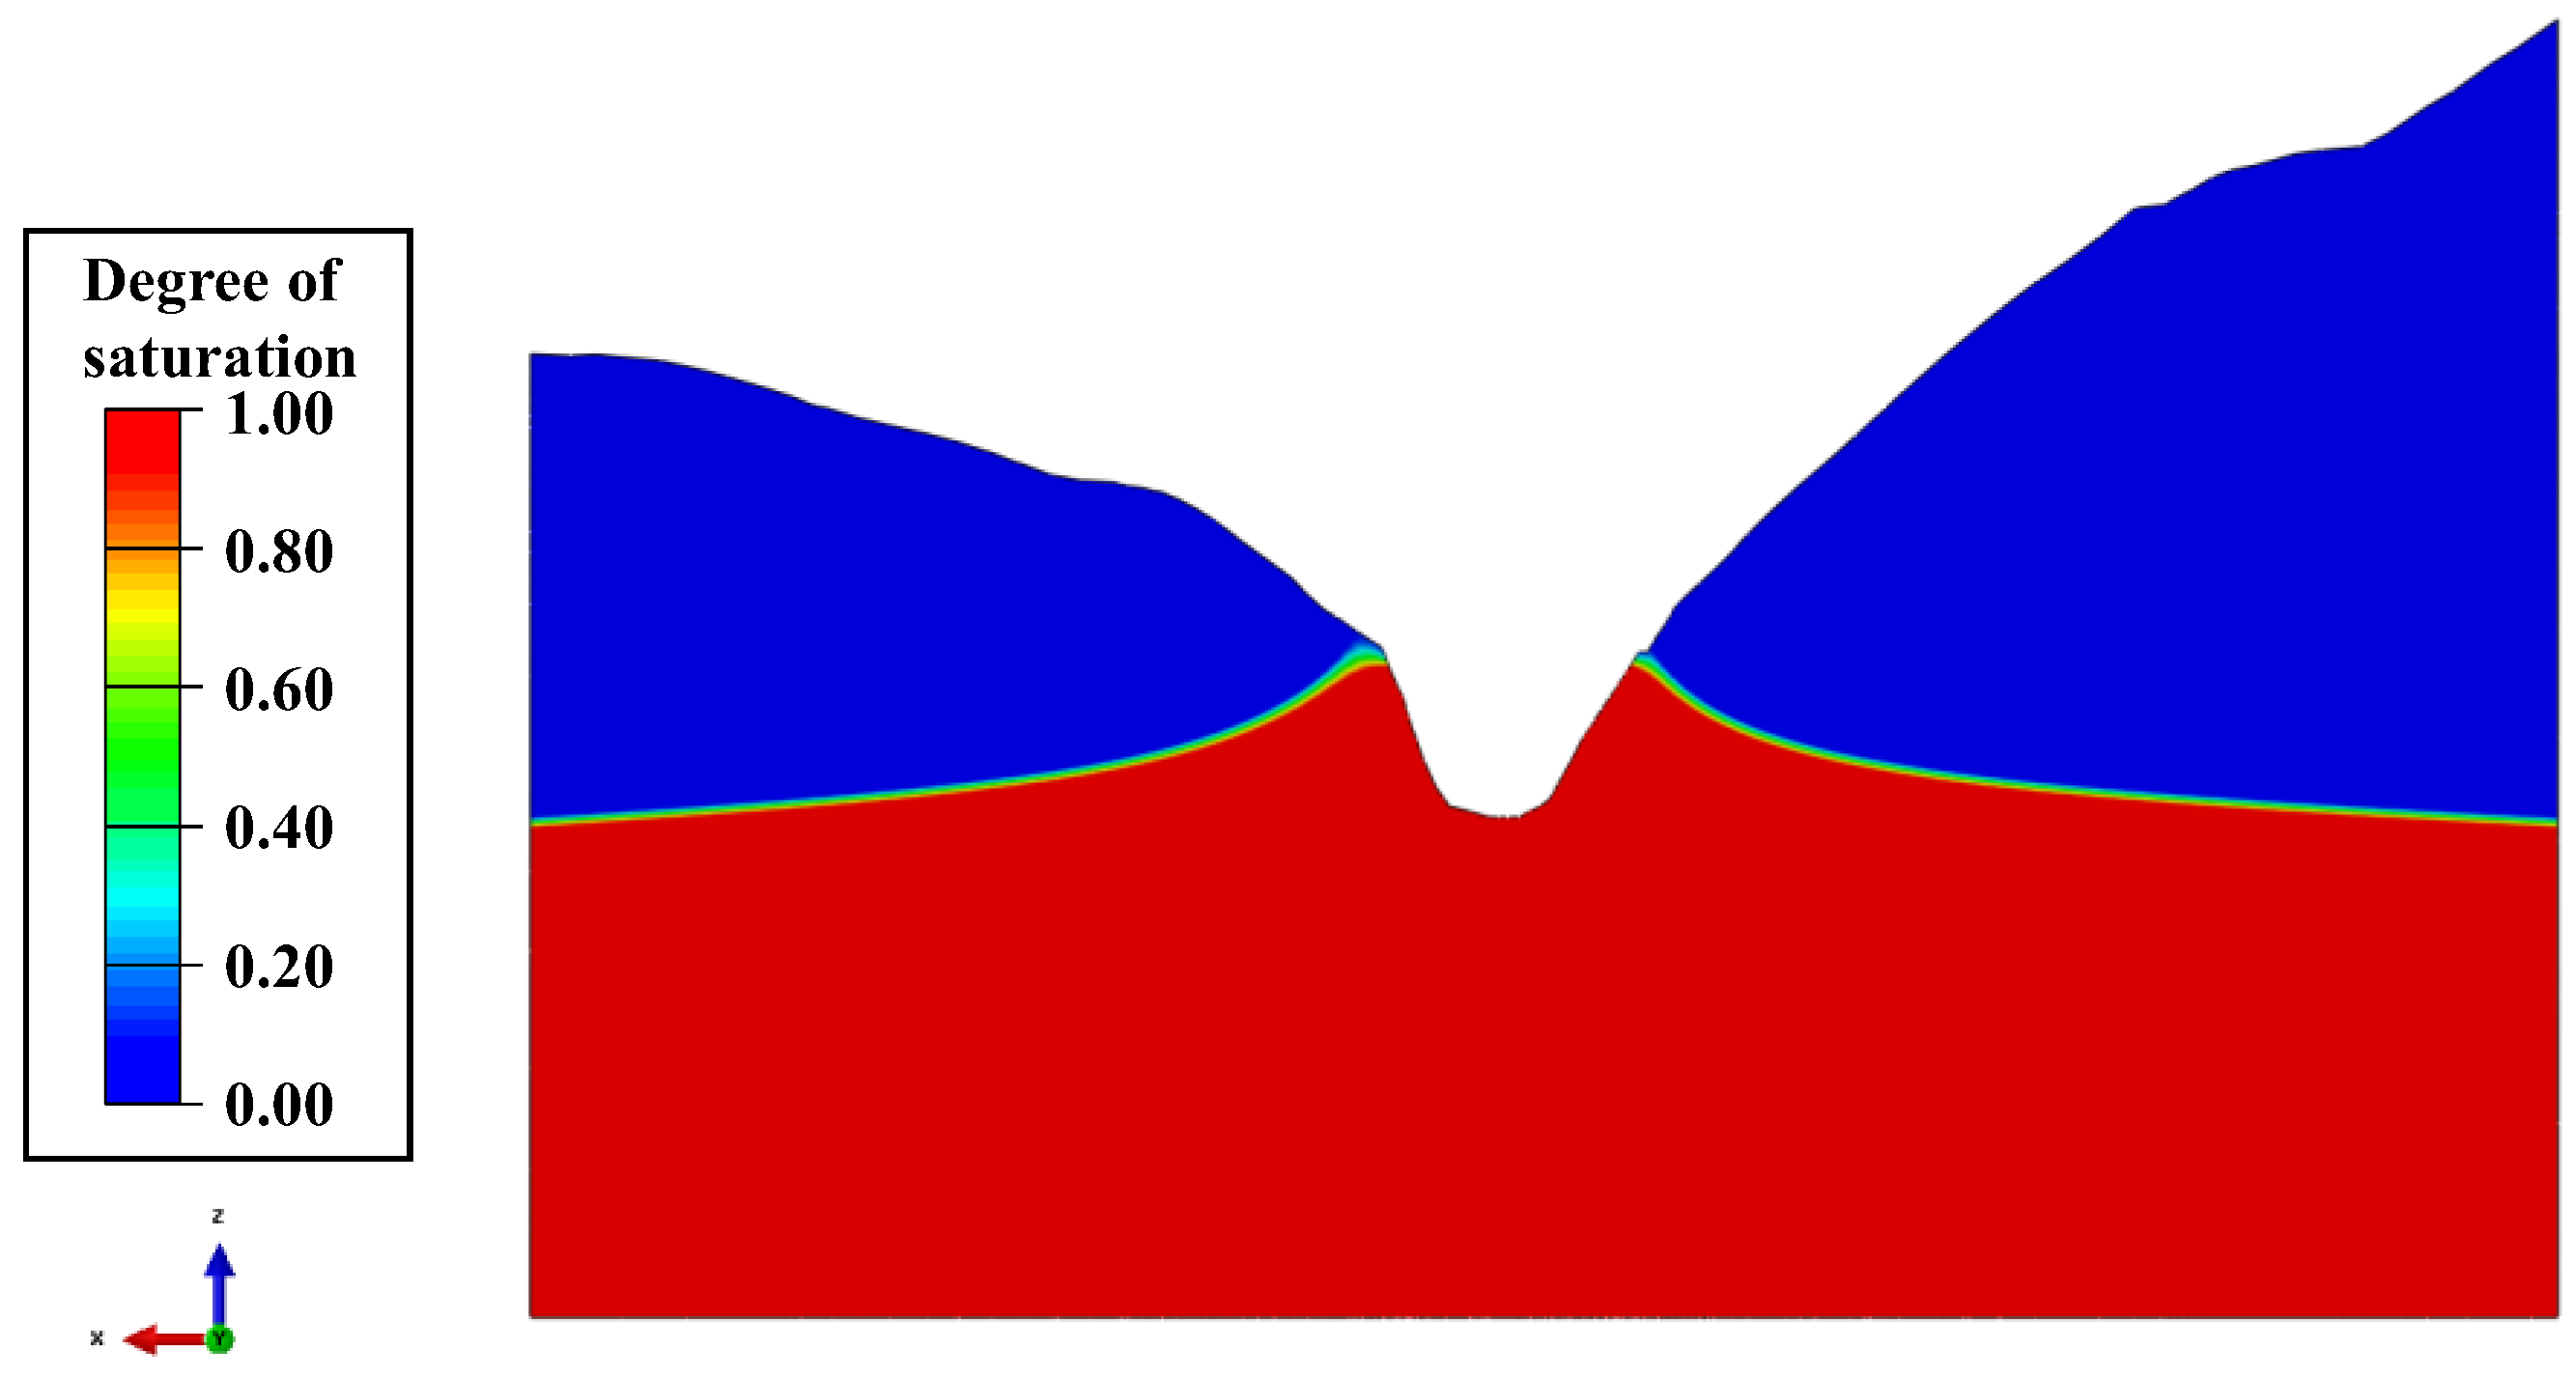
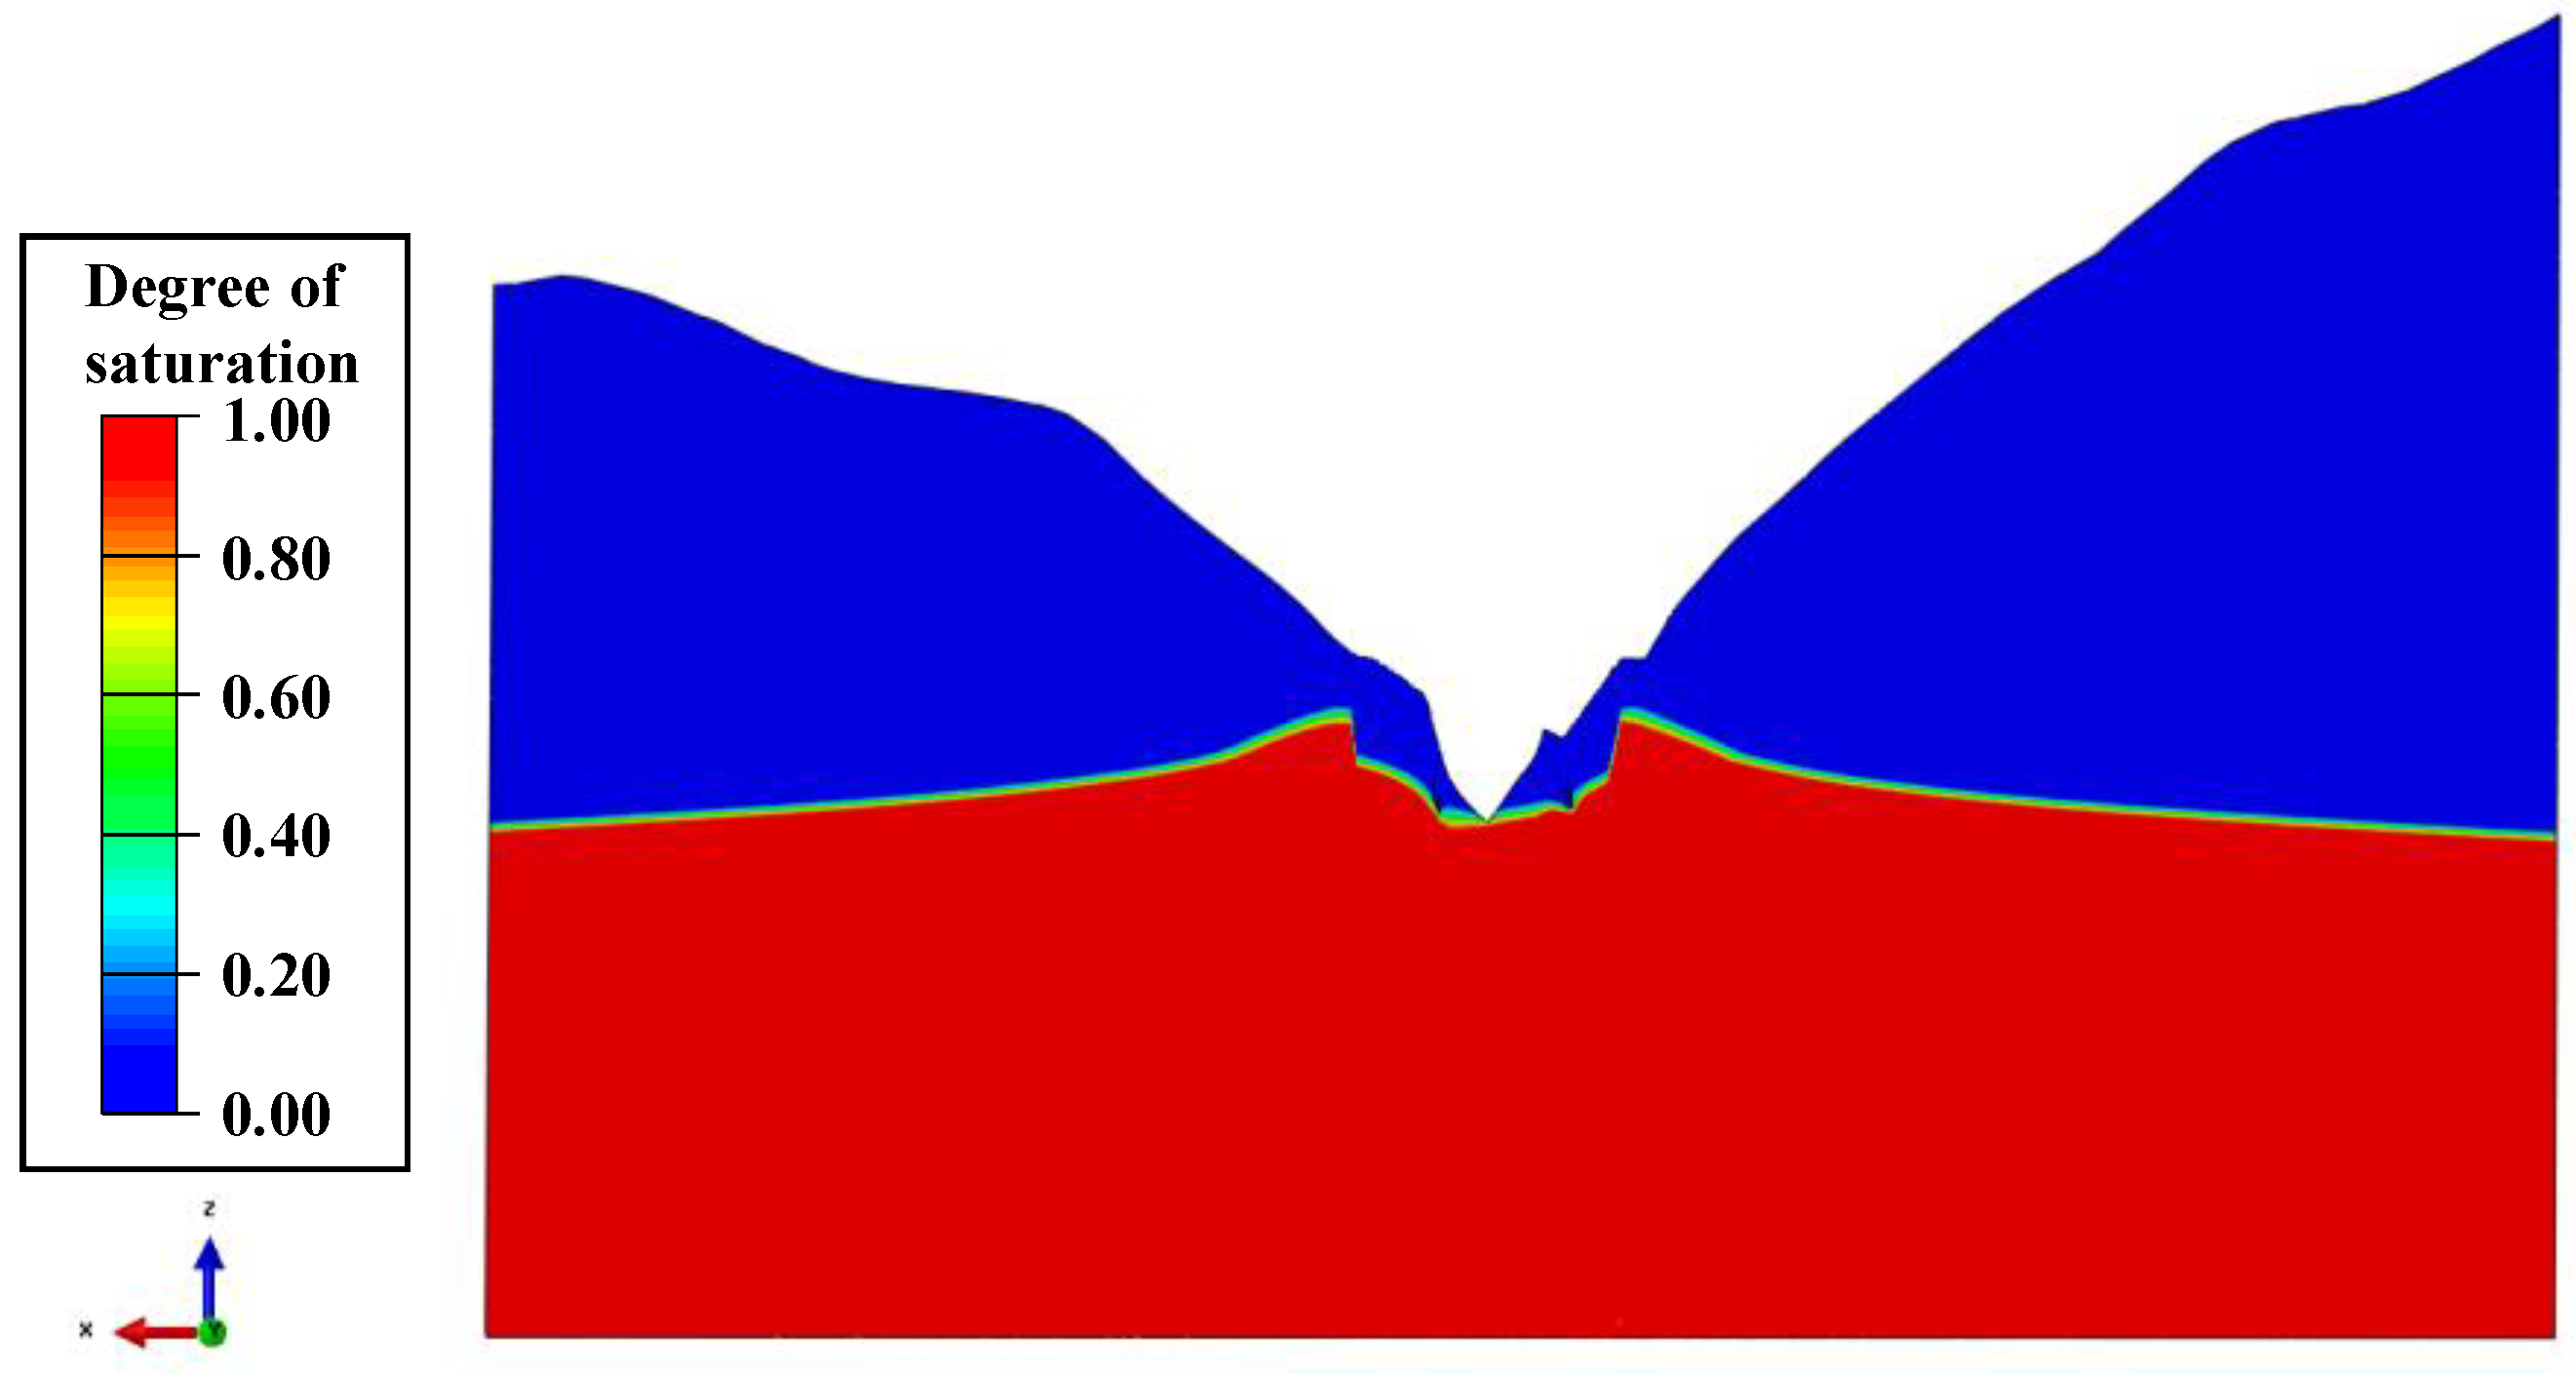
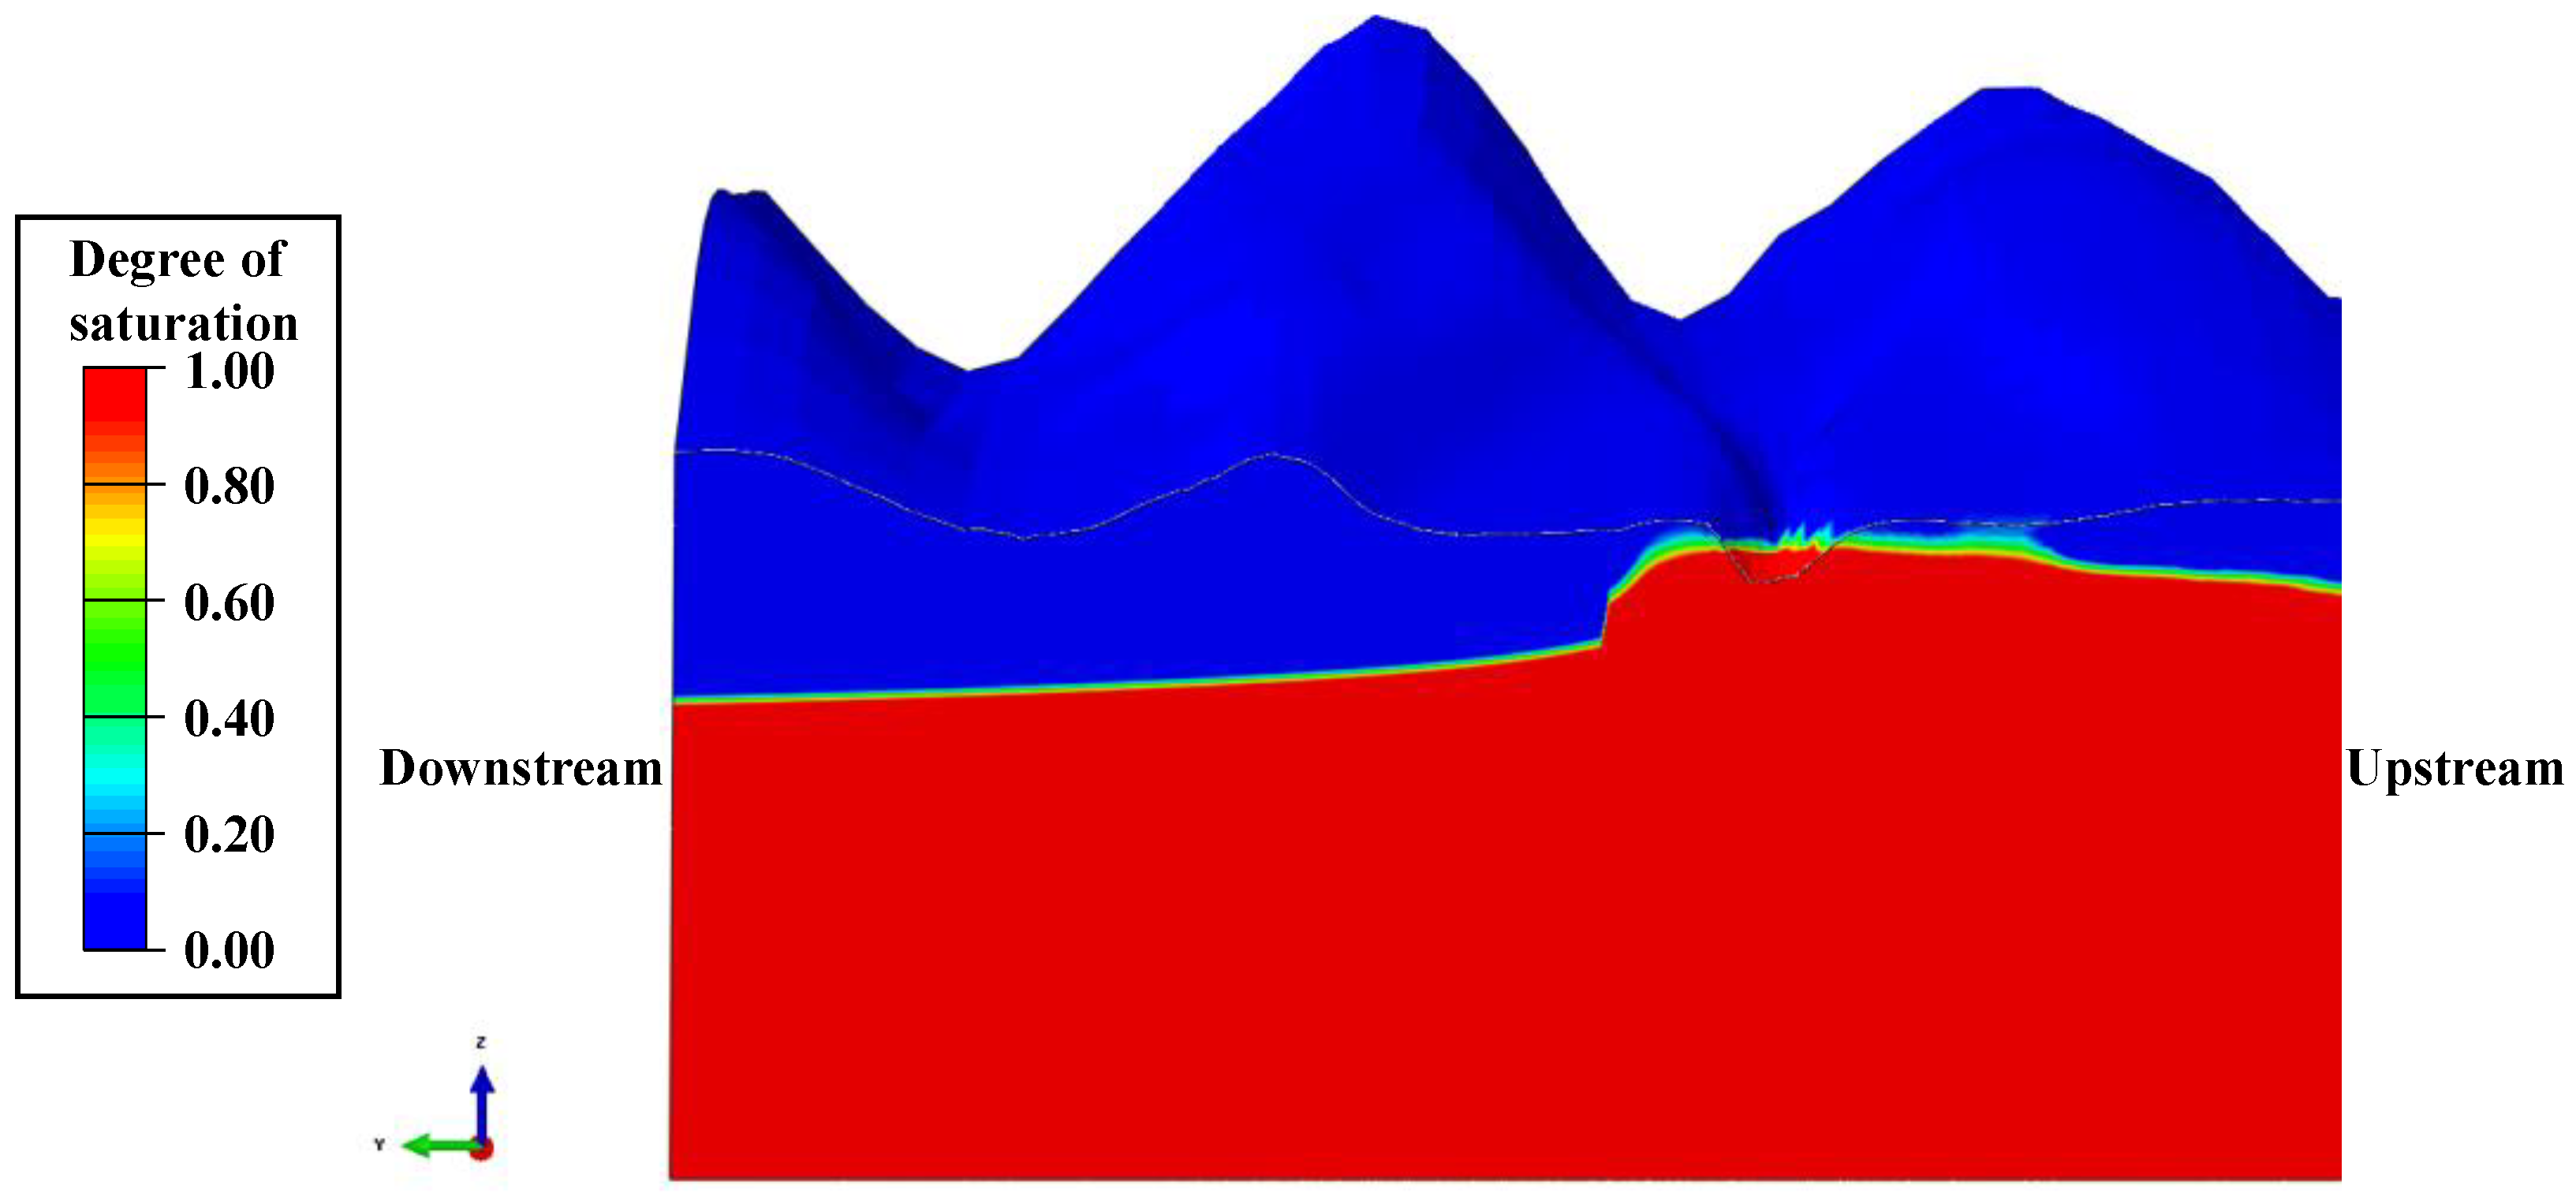
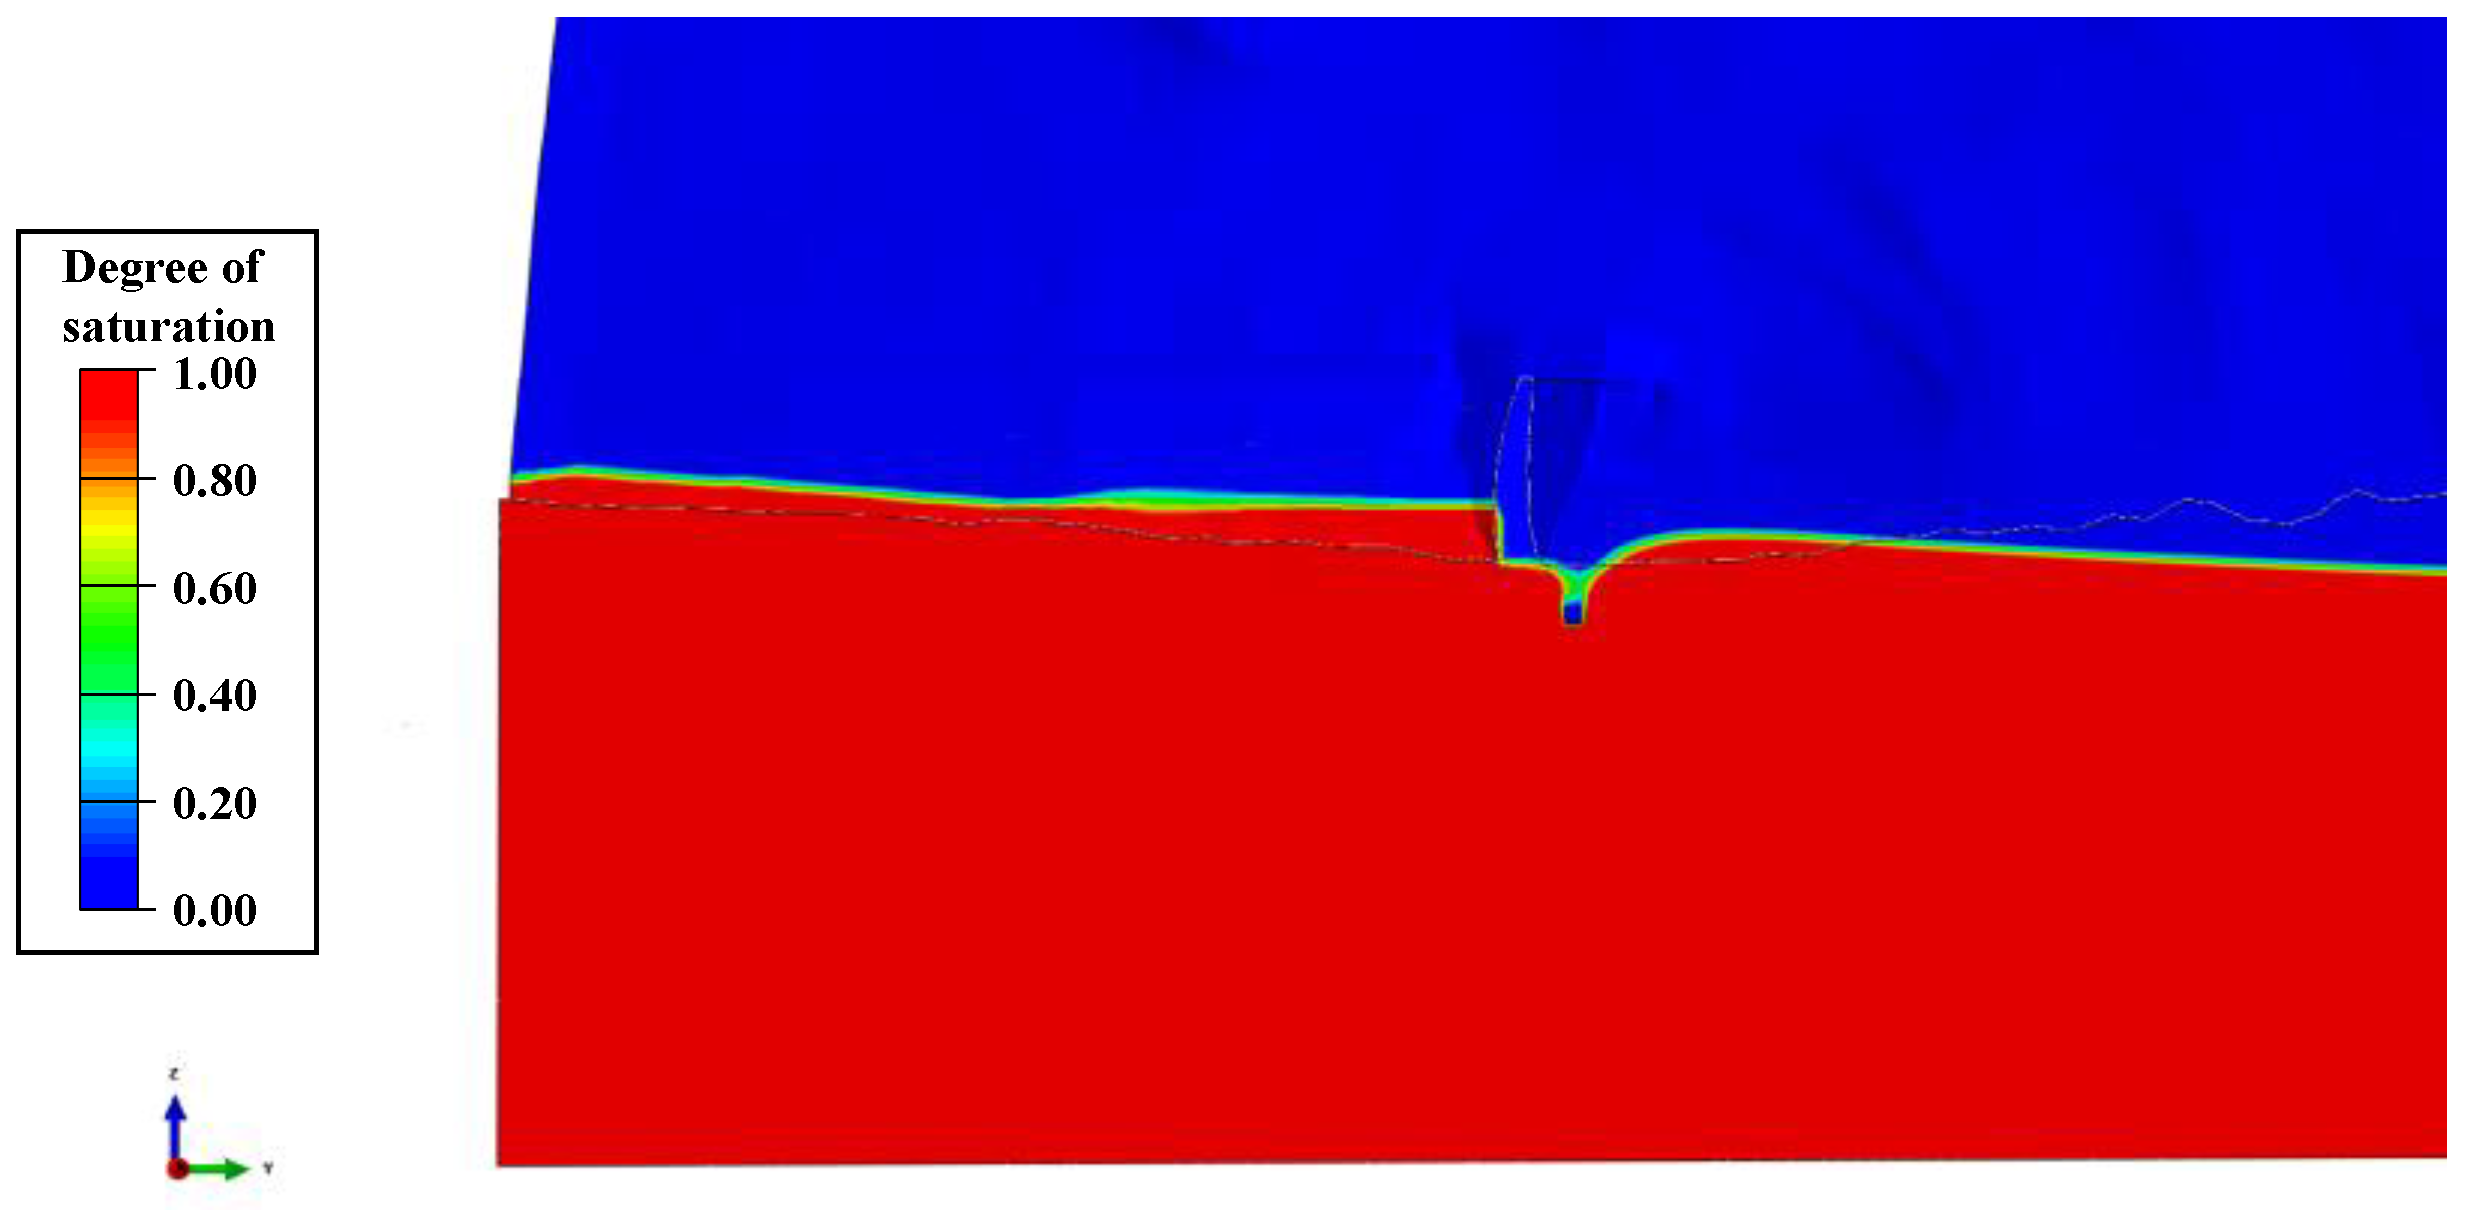
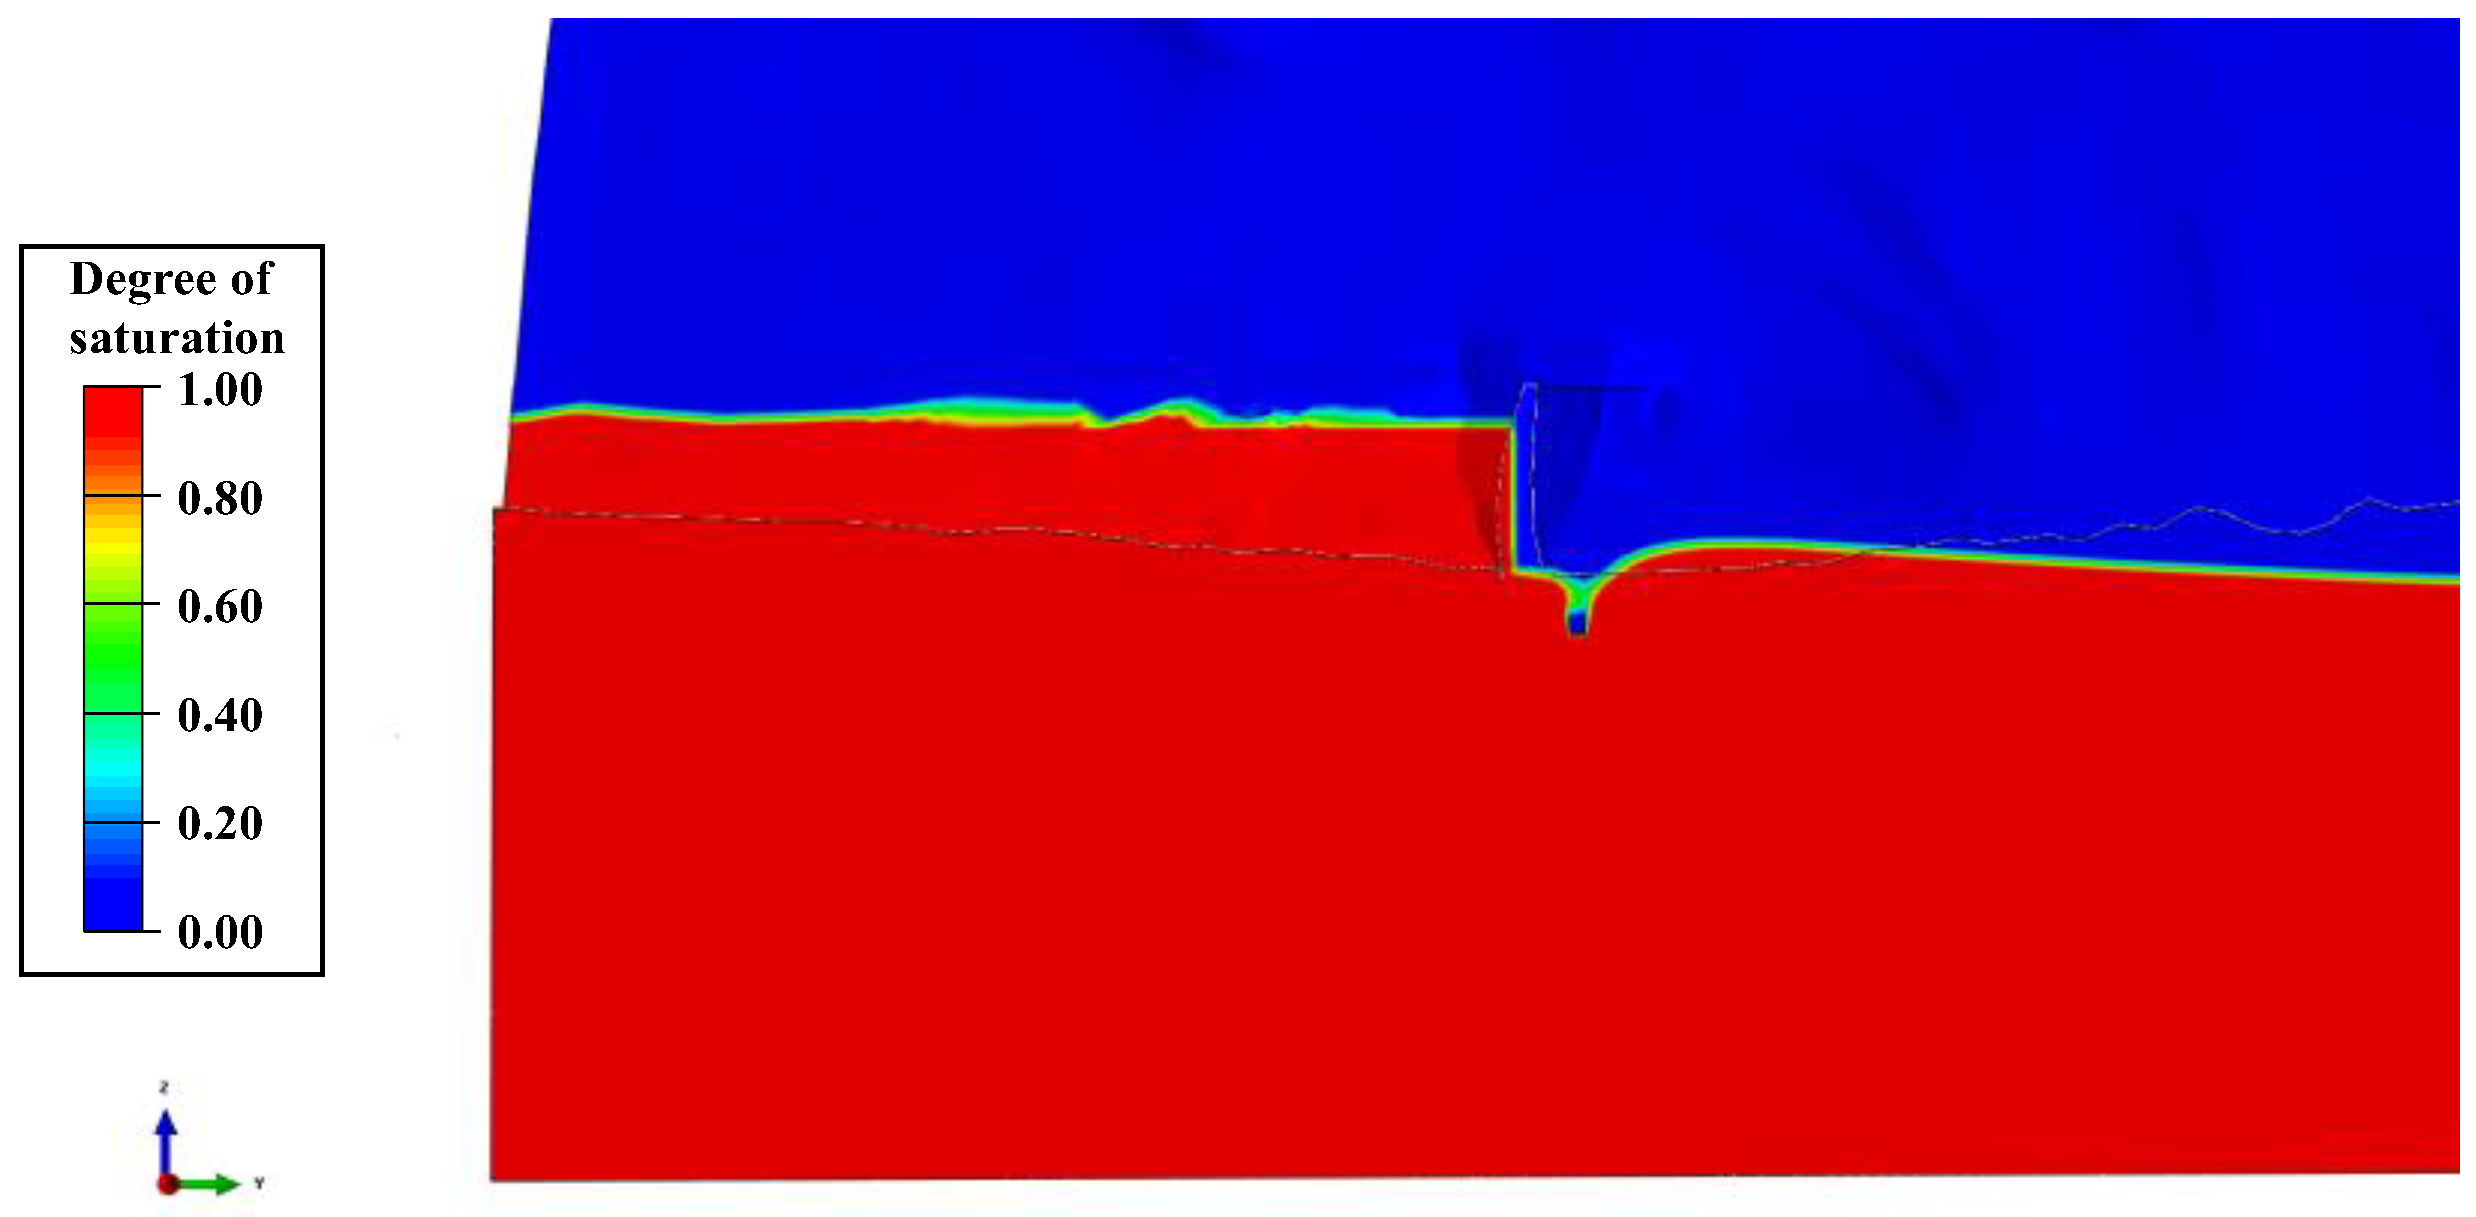
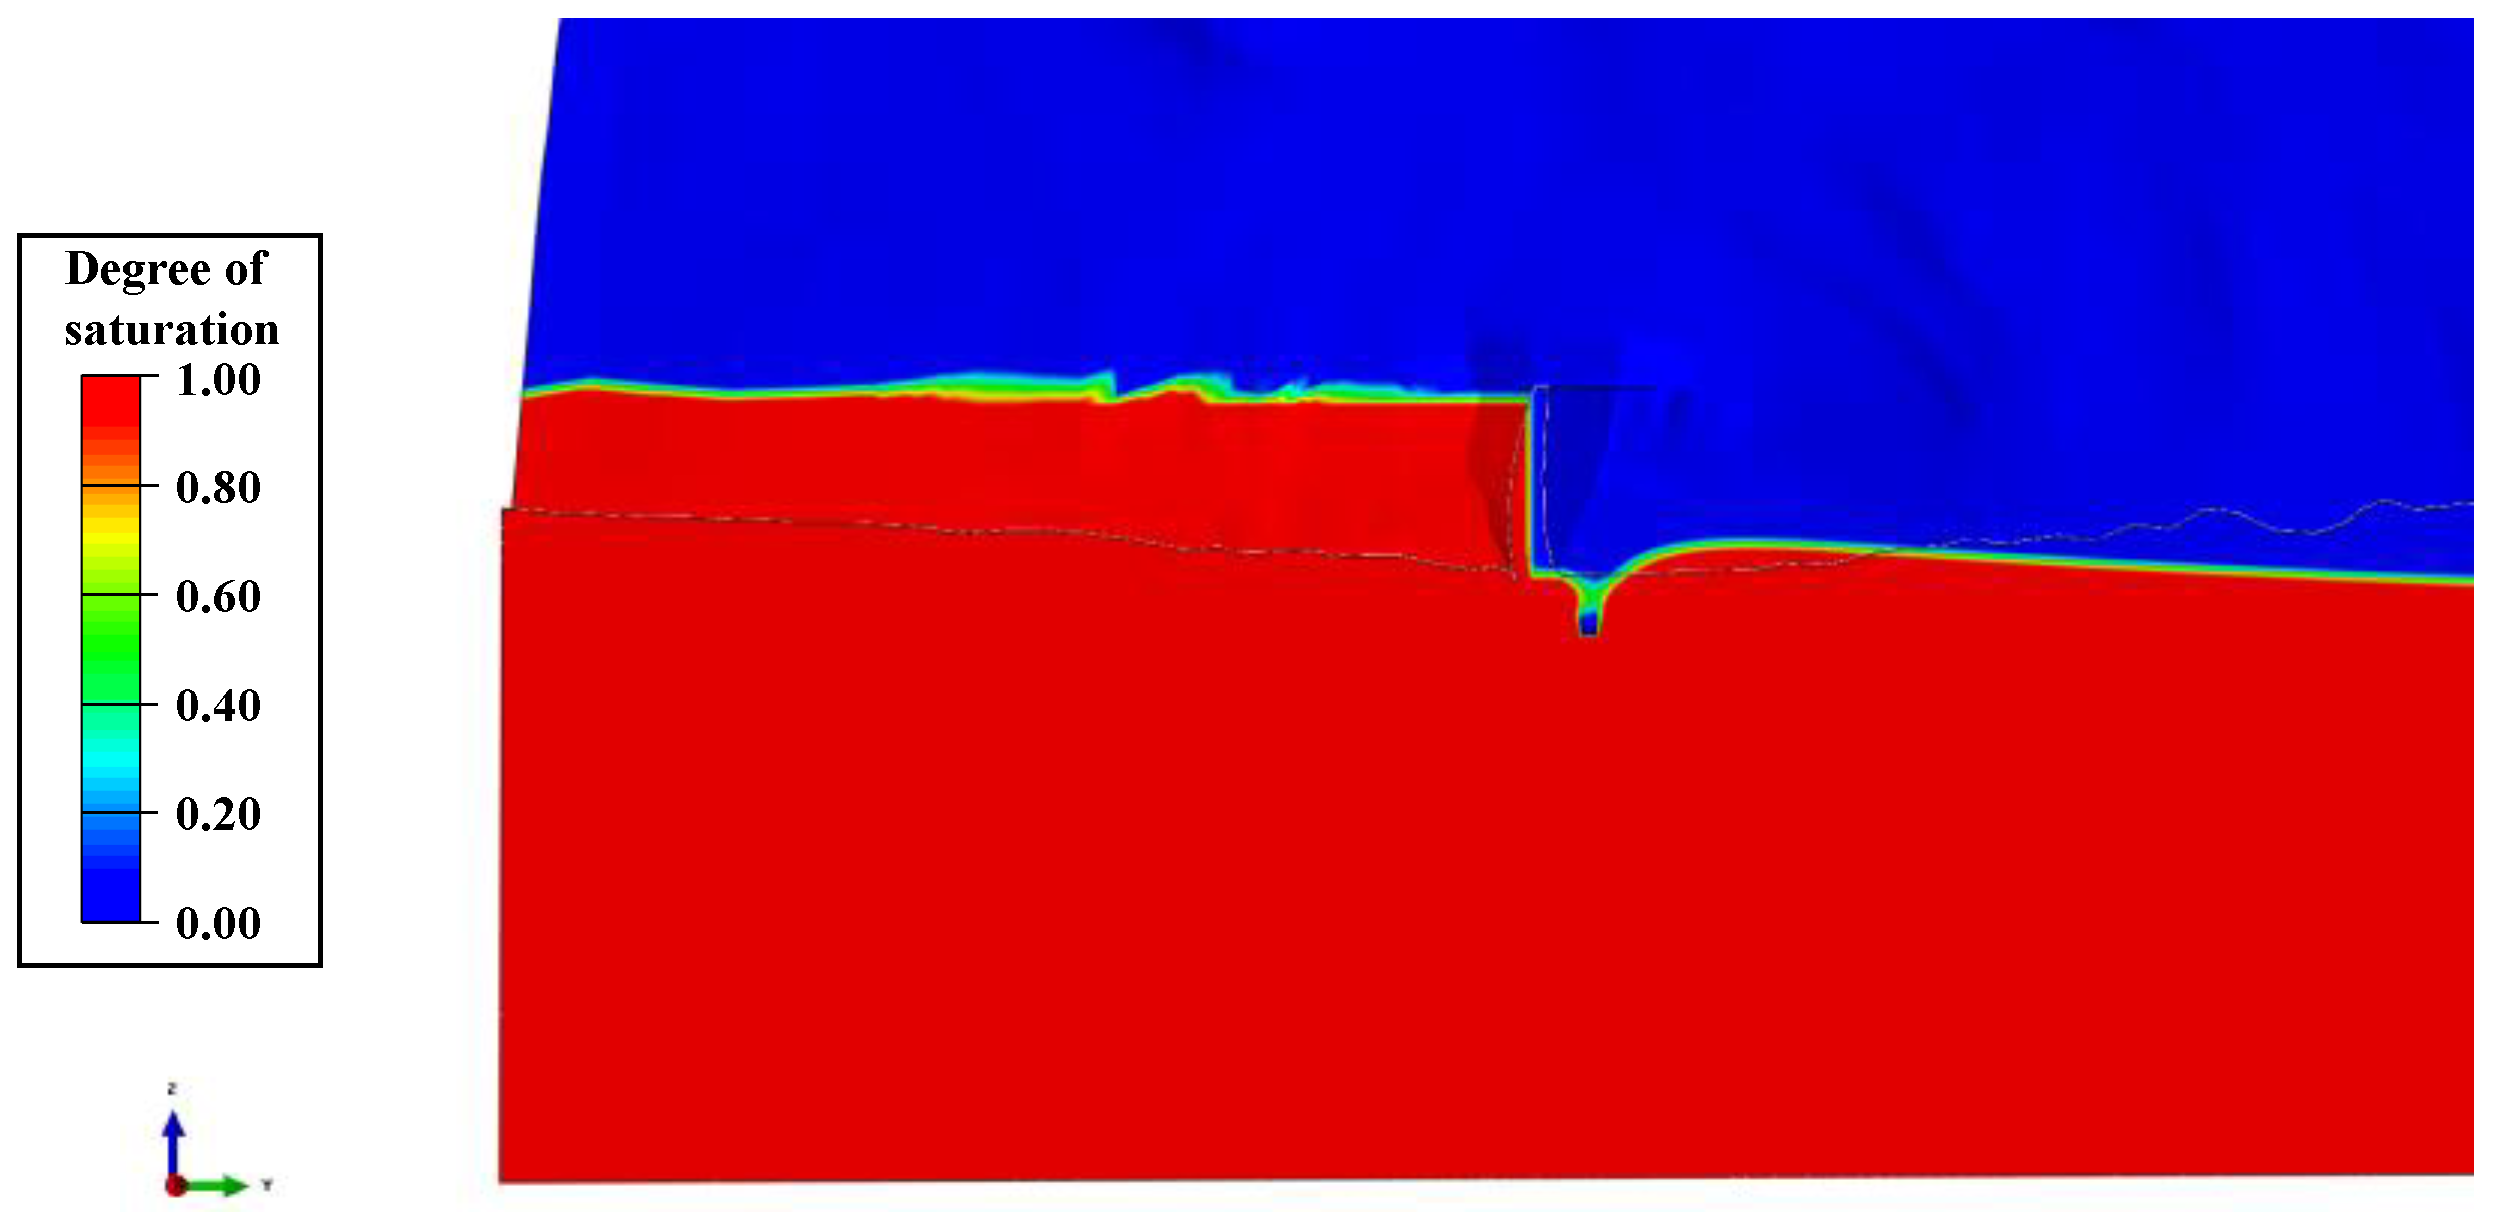
3.2.3. Numerical Calculation Results of Rock Saturation Degree for the Jinping I Arch Dam

The numerical calculation results of rock-mass saturation at the dam section, curtain section, right bank section, and left bank section of the special high arch dam under normal storage level are shown in Figure 19, Figure 20, Figure 21 and Figure 22. It can be observed that the rock-mass saturation in the upper mountain and deep foundation is relatively high, reaching several tens of percent. The saturation of the upper mountain is mainly affected by rainfall infiltration and seepage from the upstream side, and the deep foundation is mainly affected by the reservoir’s water level. The saturation of the rock mass in the curtain and the left bank is generally low, and that in the right bank is relatively high, which is related to the geological conditions and seepage characteristics of the dam site.
In Figure 19, Figure 20, Figure 21 and Figure 22, it can be observed that the groundwater levels on the left- and right-bank mountains are relatively low, and the seepage direction is towards the interior of the mountains. The seepage direction inside the mountain is from upstream to downstream, and there is seepage around the base of the dam. Furthermore, by comparing Figure 19 and Figure 22, it can be seen that the impermeable curtain has a strong effect on intercepting seepage and significantly affects the saturation degree of the rock mass. When the impermeable curtain is installed, the rock mass above the curtain in the area near the dam is in a non-saturated state, and the rock mass below the foundation is in a saturated state.
The actual water storage process of the special high arch dam is divided into four stages. In the first stage, the reservoir’s water level rose from 1650 m (elevation, hereinafter the same) to 1707 m. In the second stage, the reservoir’s water level rose to 1800 m. In the third stage, the reservoir’s water level rose to 1840 m, but the water level dropped back to 1800 m after water storage was completed. The fourth stage saw the reservoir’s water level rise from 1800 to 1880 m. In this paper, the third and fourth stages were combined as the third stage, and the saturation degree of the rock mass at the arch crown beam section was calculated for each stage, as shown in Figure 23, Figure 24 and Figure 25.
According to Figure 23, Figure 24 and Figure 25, the saturation of upstream rock mass is greatly influenced by fluctuations in the water level of reservoir—the rock mass near the shore transitions from unsaturated to saturated during the reservoir filling process. In contrast, the saturation of downstream rock mass is less affected by water level fluctuations due to the relatively large hydraulic gradient in the seepage-overflow zone of the dam shoulders and downstream of the dam, which is due to the presence of an impermeable curtain and drainage holes in the dam.

3.2.4. Analysis of the Influence of Valley Contraction on a Super-High Arch Dam’s Deformation

Before the construction of the super-high arch dam, a relatively stable seepage field and deformation behavior of the rock mass have already formed in the river channel and on both sides of the mountain. However, after the dam is filled with water, a new seepage field will be formed, resulting in corresponding valley contraction. Numerical calculations were carried out to obtain the tangential and vertical deformation of the valley under normal storage conditions of the super-high arch dam, as shown in Figure 26 and Figure 27, respectively.
In Figure 26, it can be observed that after impoundment, the river valley undergoes contraction deformation under the influence of seepage: the left bank deforms towards the right bank by 15.23 mm maximally, and the right bank deforms towards the left bank by 12.68 mm maximally. The amount of contraction deformation in the upstream valley is much greater than that in the downstream valley, and the amount of contraction deformation in the rock mass near the reservoir’s water level in the upstream is greater than that at other elevations. Monitoring data from the project show that the maximum contraction deformation of the valley near the dam axis at an elevation of 1930 m was about 34 mm in 2018, and the value found in this paper is slightly smaller than the monitoring value, considering that the monitoring value may include other factors, such as rock creep, that cause valley contraction.
The rock mass at the reservoir bank undergoes contraction deformation in the horizontal direction and upward deformation in the vertical direction due to the transition from the unsaturated to saturated state, as shown in Figure 27. When comparing Figure 26 with Figure 27, it can be found that the rock-mass areas with greater deformation in the horizontal and vertical directions are essentially coincident, indicating that the reservoir-bank mountain has a strong tendency towards outward deformation under the influence of seepage, which is manifested as an expansion deformation.
Valley contraction will exert a strong squeezing effect on a super-high arch dam. The influence of valley contraction deformation on a super-high arch dam’s deformation was calculated based on the FEM, and those of the radial deformation of the super-high arch dam and the radial deformation of the arch’s crown beam section are shown in Figure 28 and Figure 29, respectively.
In Figure 28 and Figure 29, it can be seen that the radial deformation field of the dam is symmetrically distributed along the arch beam. The upper part of the dam deforms in the upstream direction, and the maximal deformation occurred at the top of the arch beam, reaching 13.09 mm. The radial deformation of the dam caused by the valley’s contraction is opposite to the dam deformation caused by the reservoir water’s thrust, which partially explains the problem of miscalculated deformation monitoring data of some super-high arch dams in the alpine and gorge regions in Southwest China.

3.3. Analysis of the Influence of Dam-Overhanging Effect on a Super-High Arch Dam’s Deformation in the Alpine and Gorge regions of Southwest China

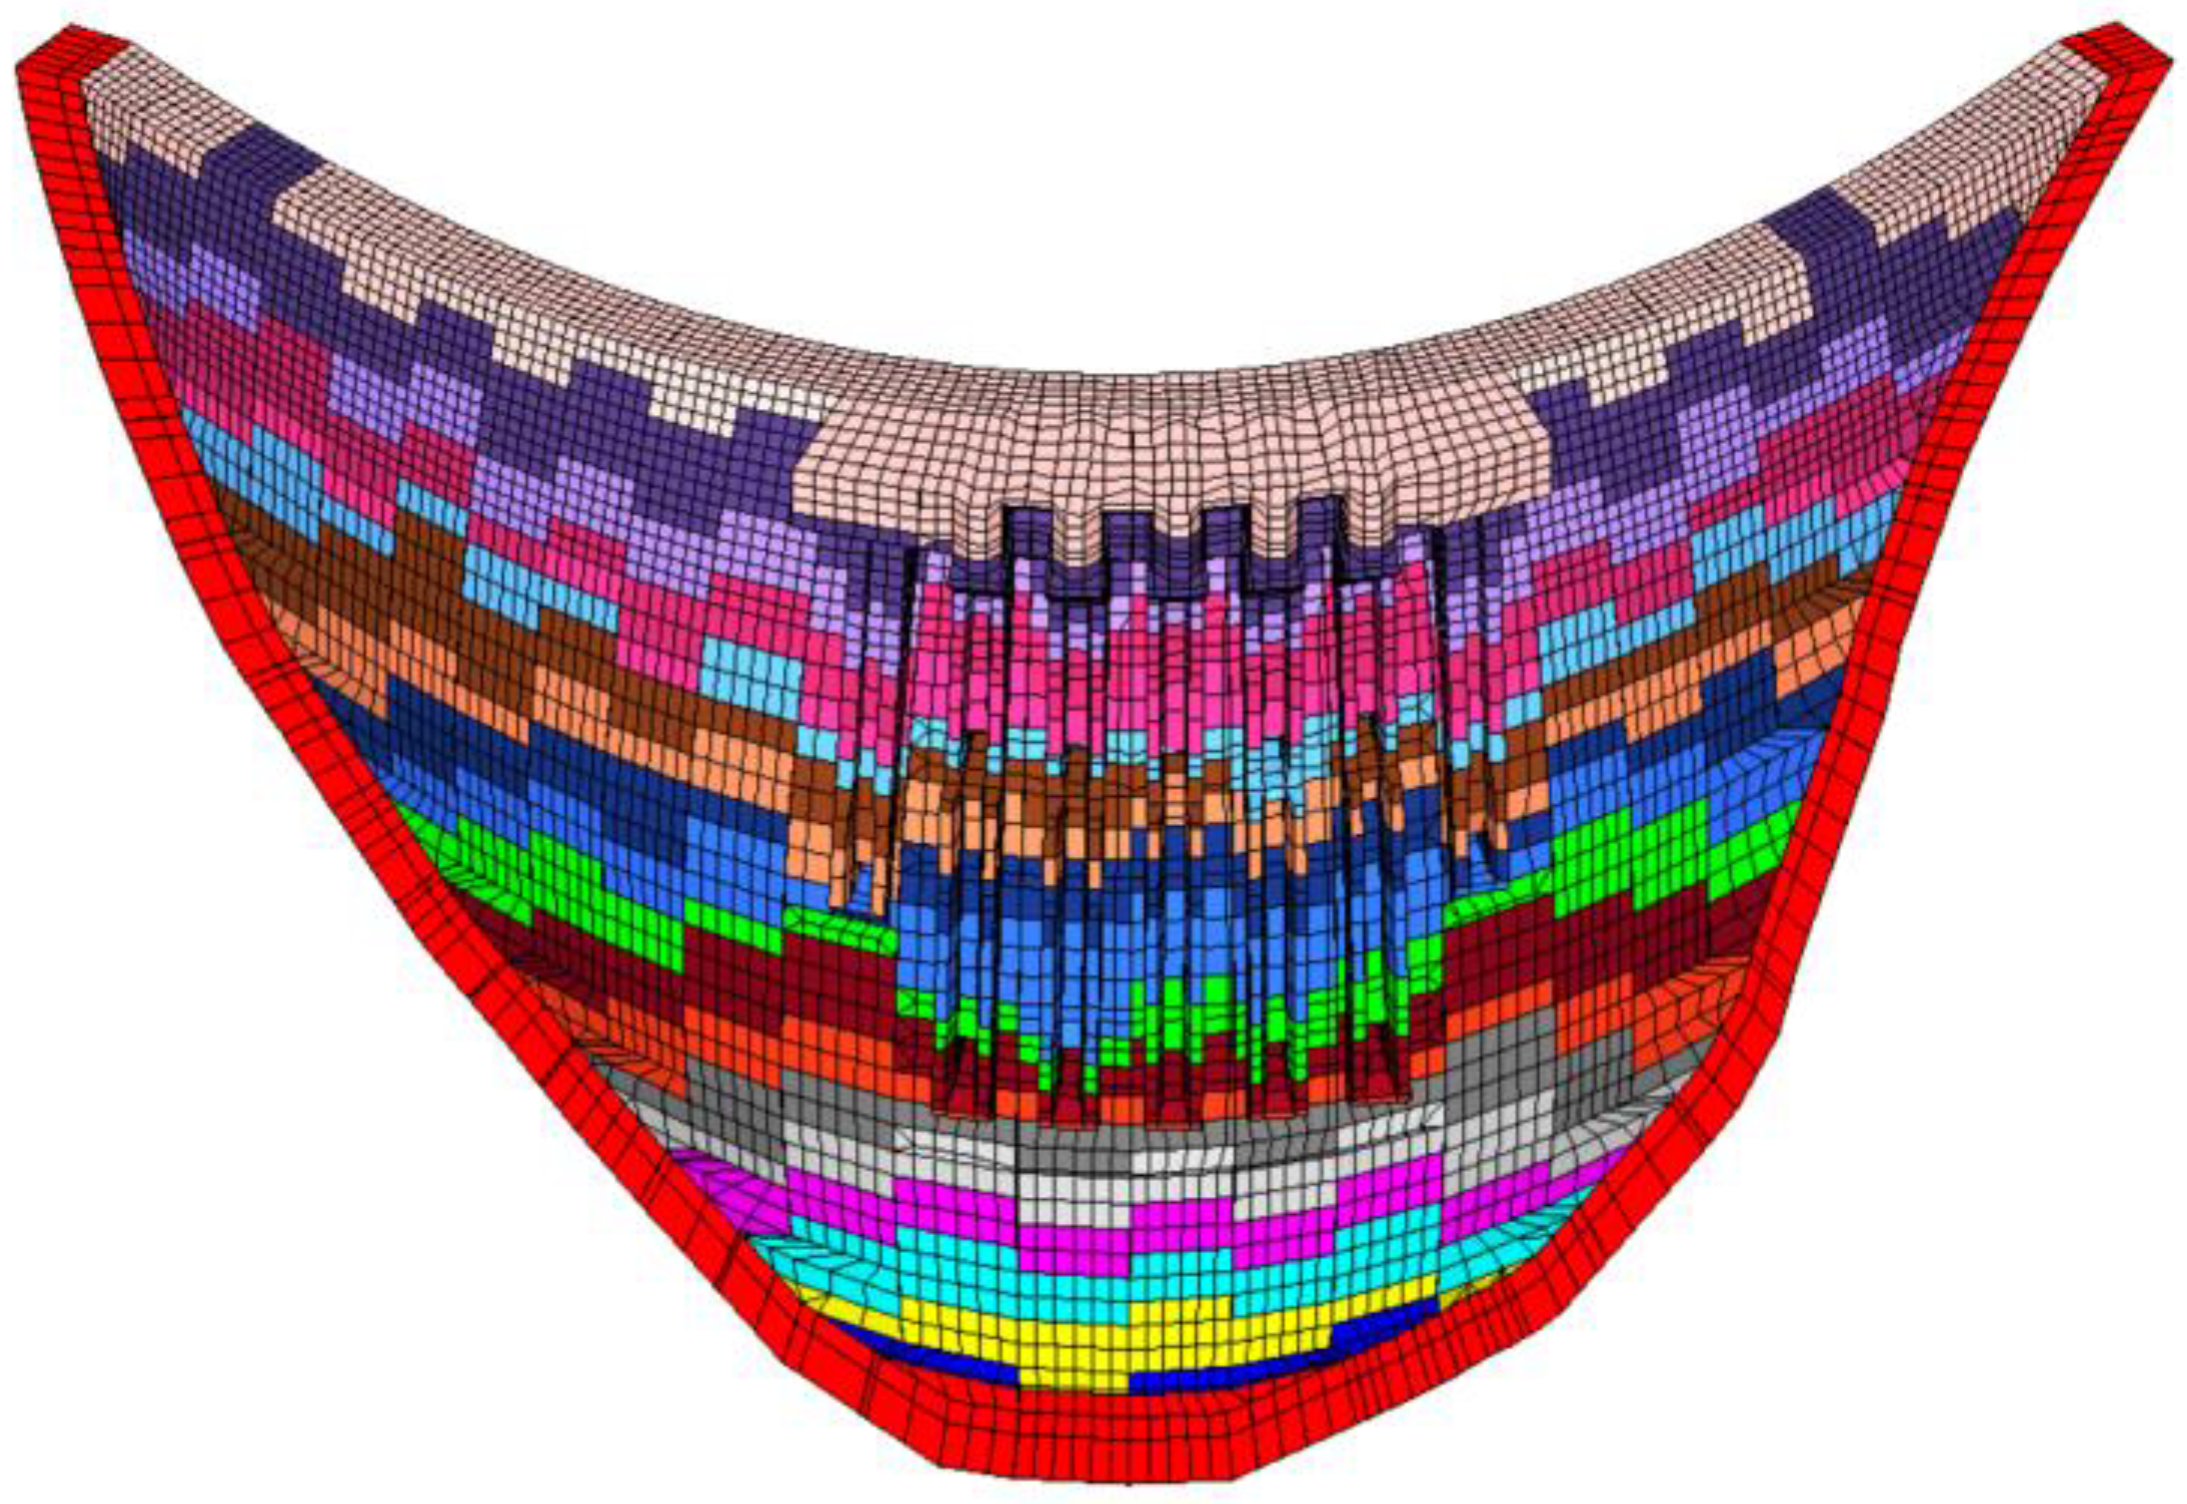
3.3.1. 3D Finite Element Model of the Jinping I Arch Dam

The finite element model for analyzing the overhanging effect was established. A layered and block-by-block approach to apply self-weight for simulating the actual construction process was used. The finite element model is shown in Figure 30. The model had 43,761 nodes and 36,240 elements. Thin-layer elements were used to simulate the transverse joints. In the calculation process, the various layers of elements were activated sequentially. The positive direction of the tangential direction was towards the right bank, the positive direction of the radial direction was towards the downstream, and the positive direction of the vertical direction was upwards. The side and upper and lower faces of the dam foundation were subject to normal constraints, and the bottom face was fully constrained.

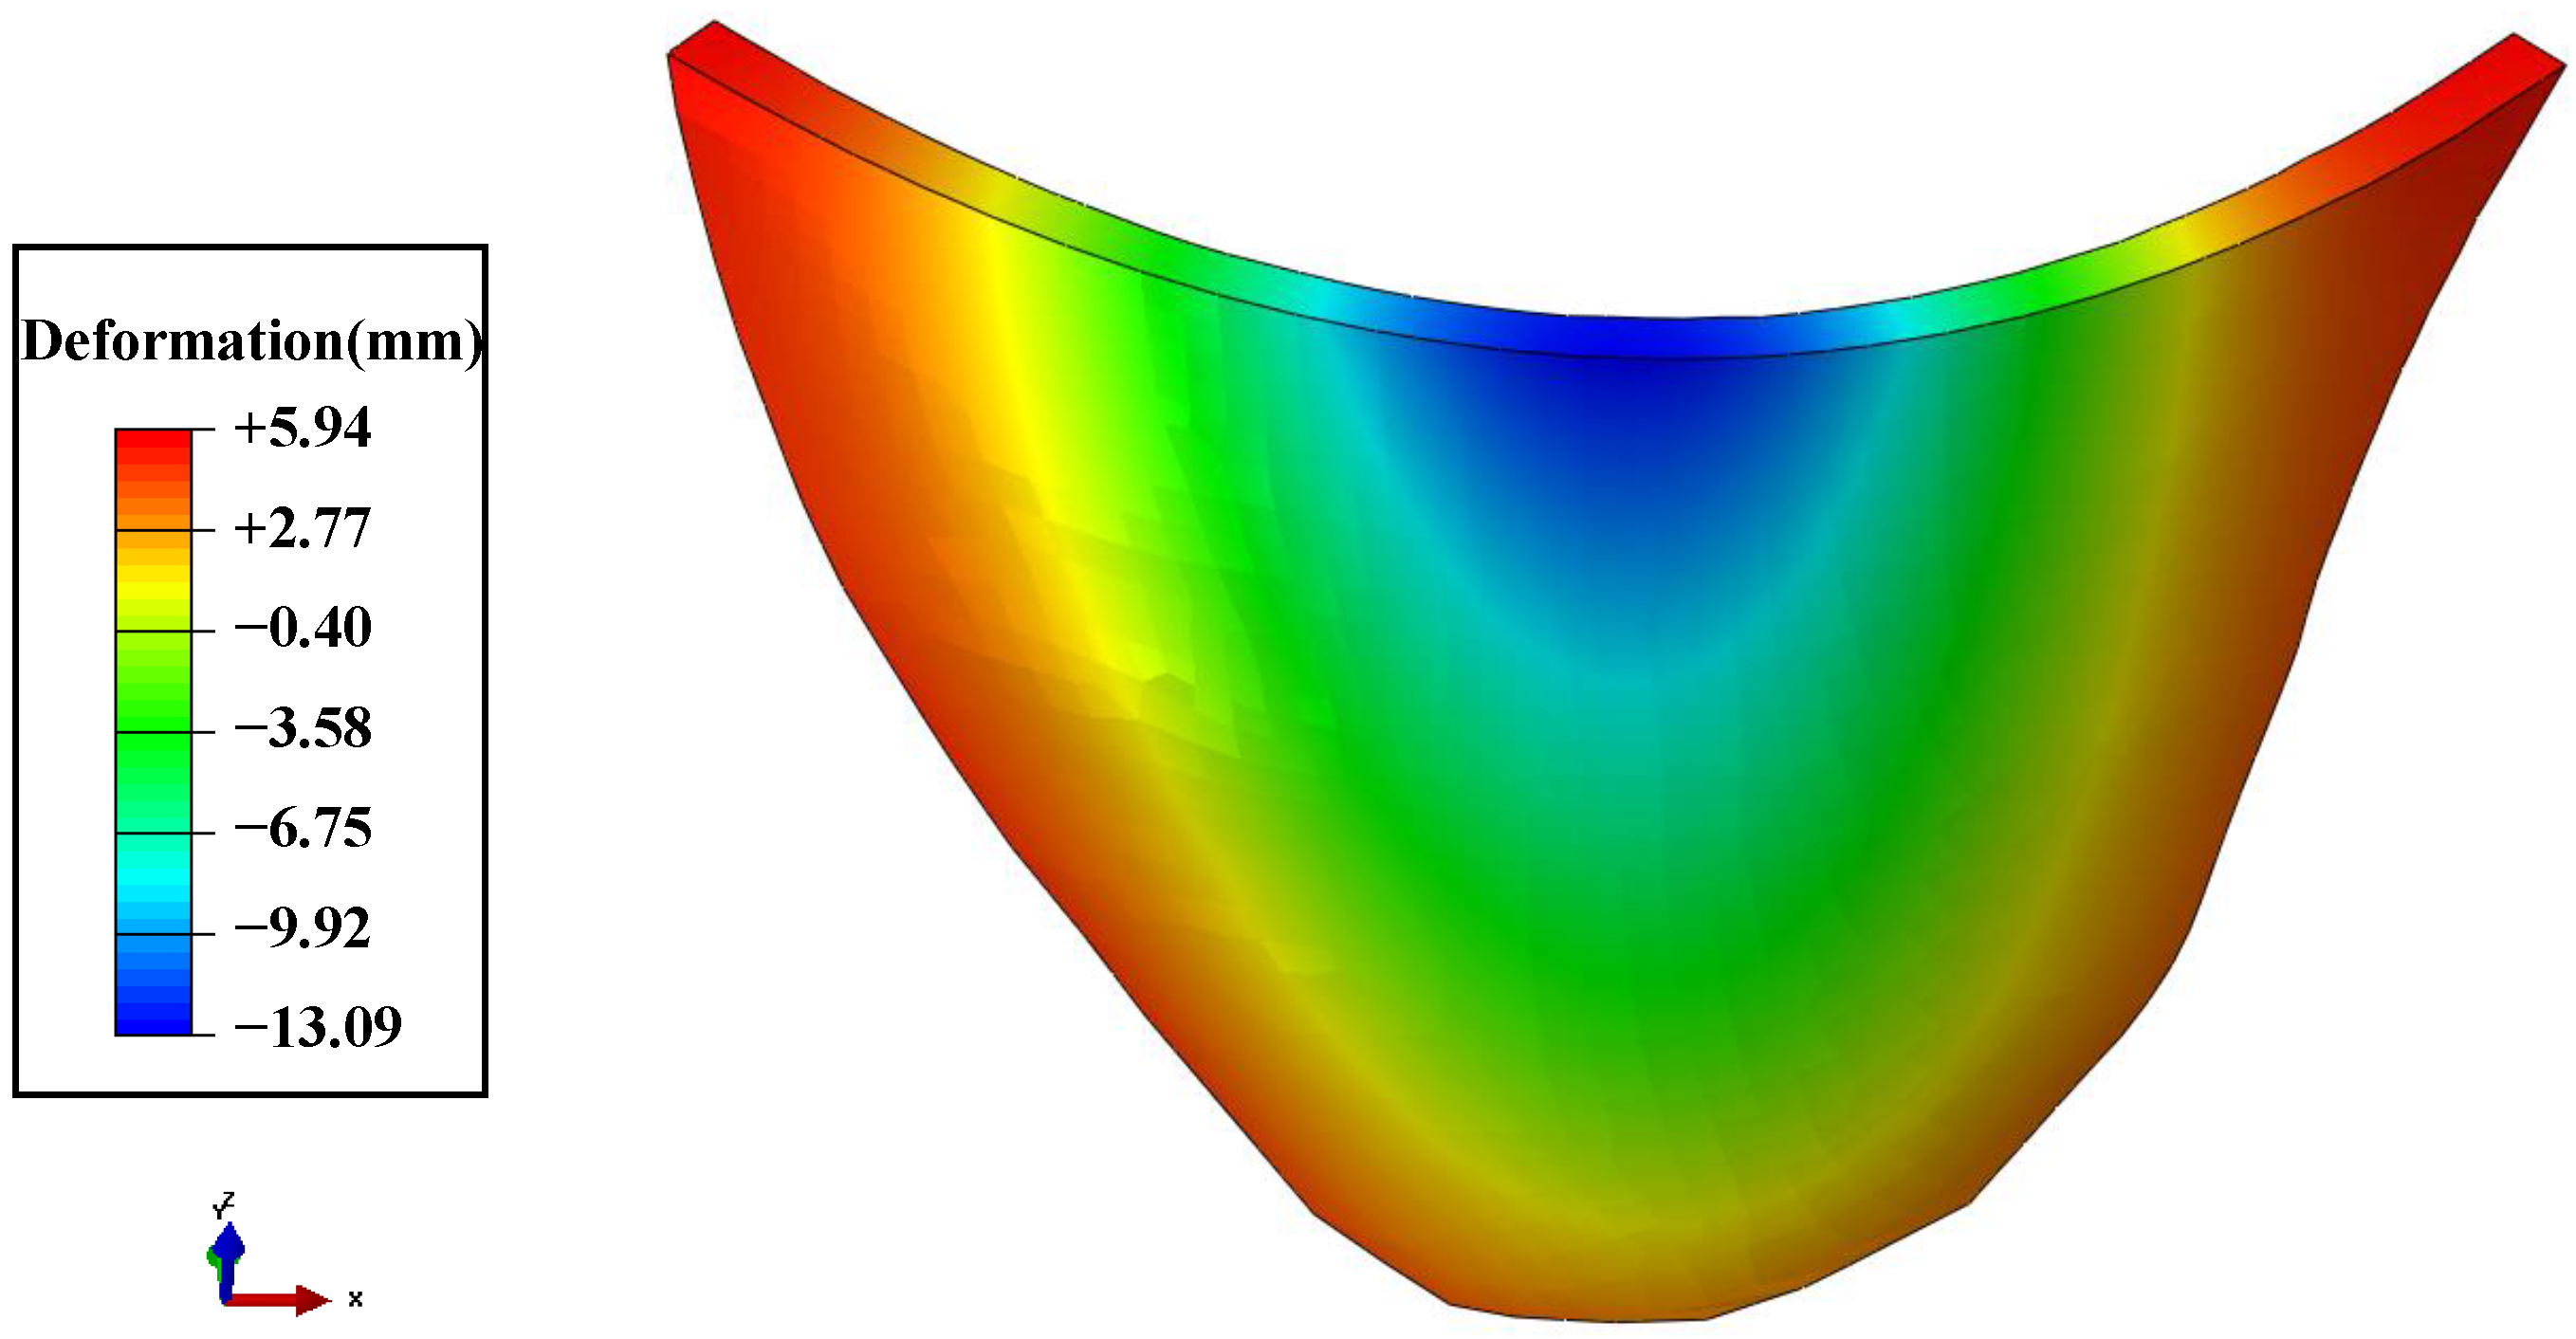
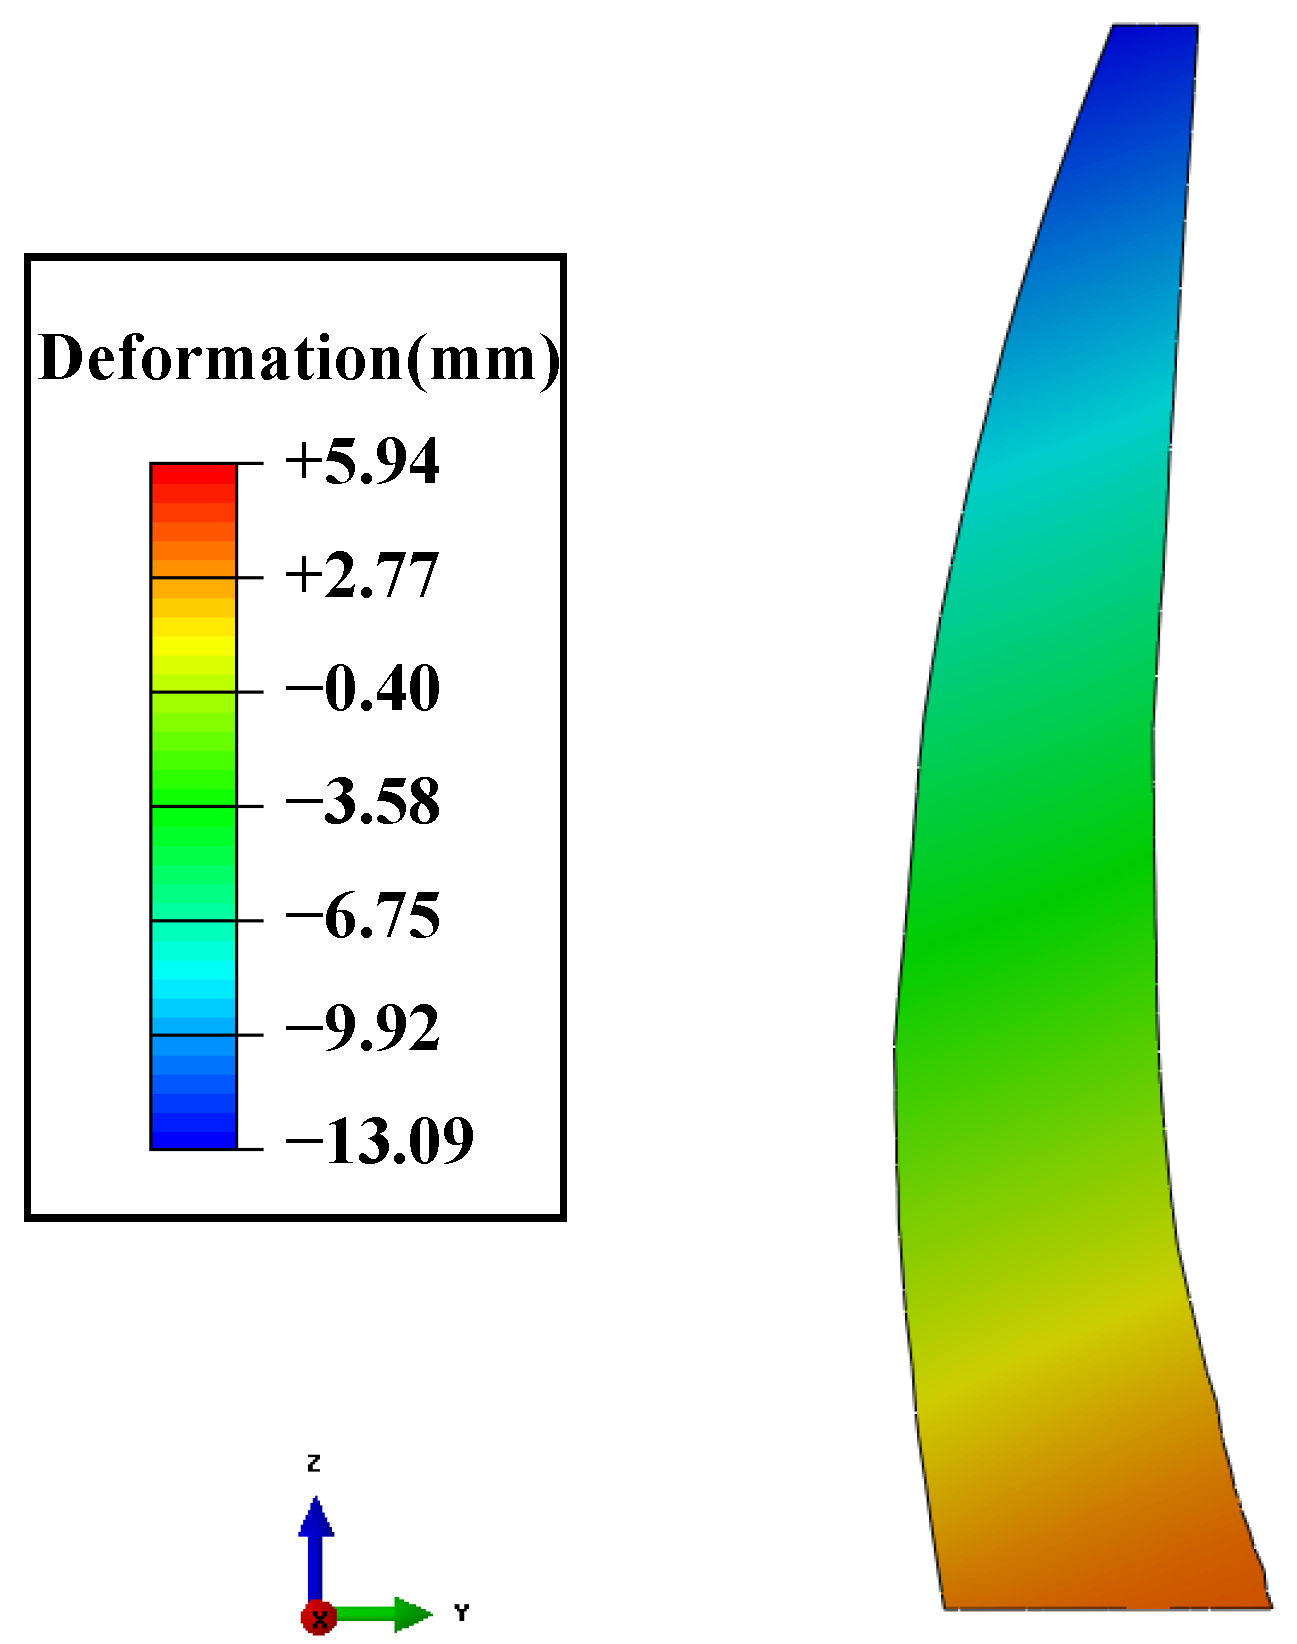
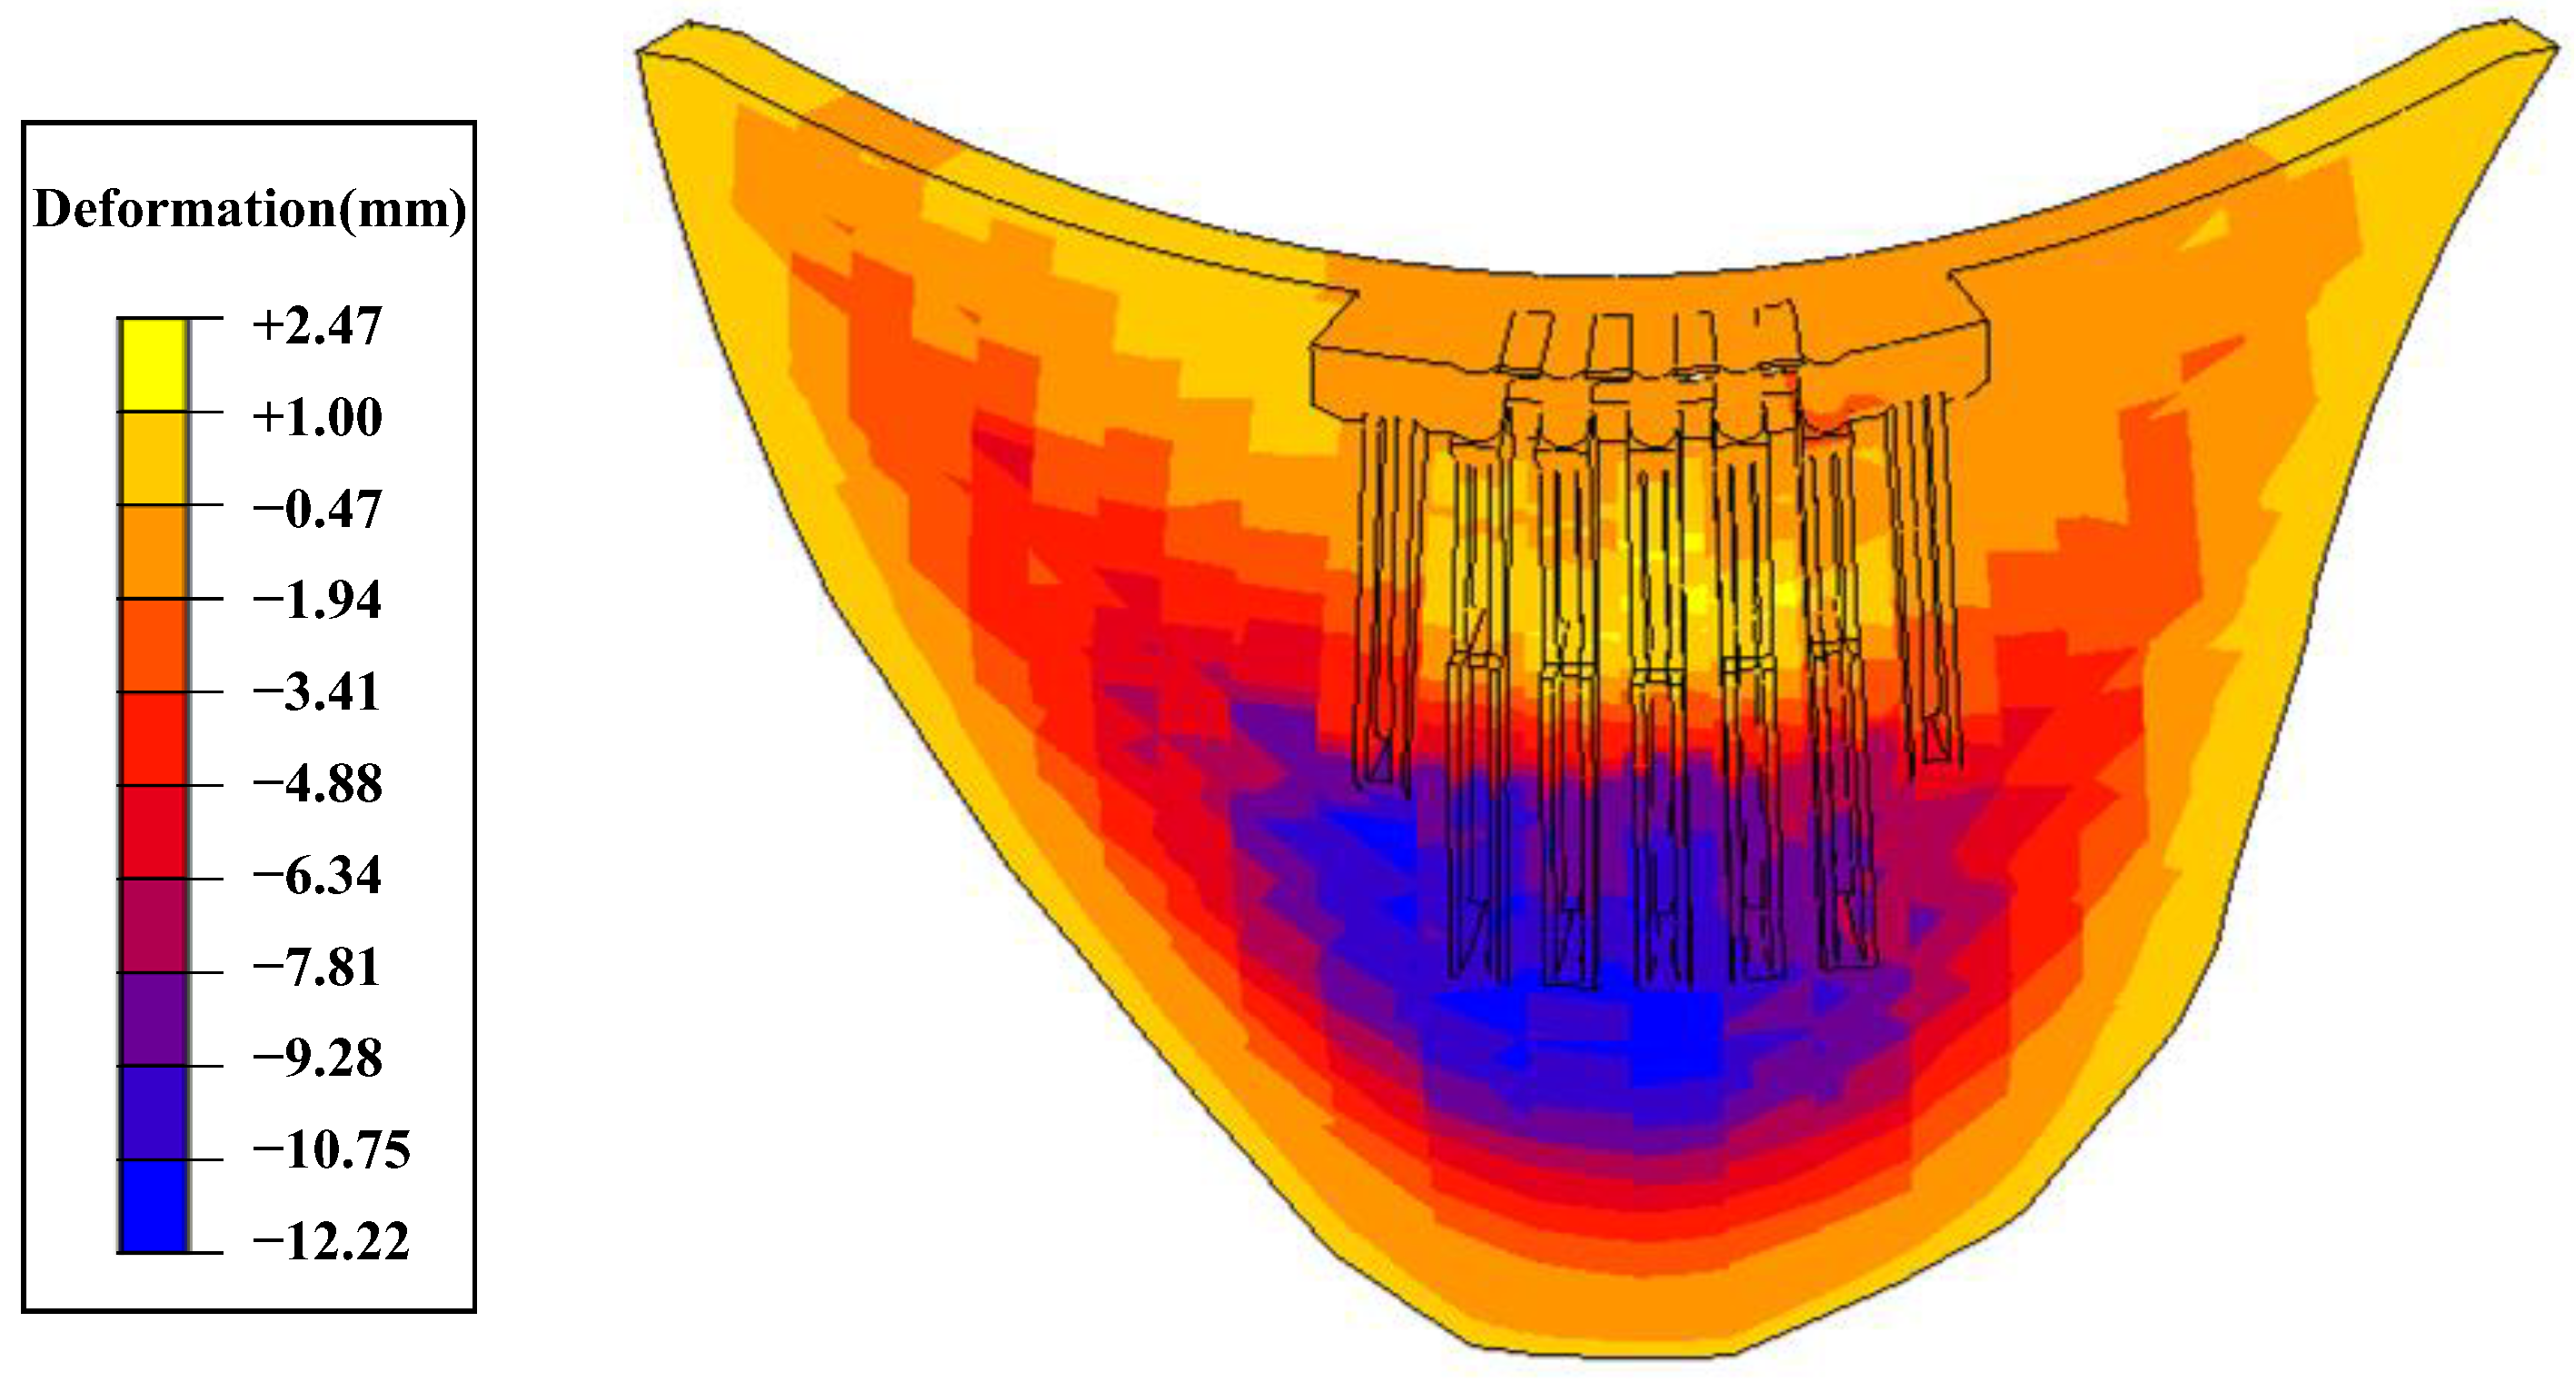
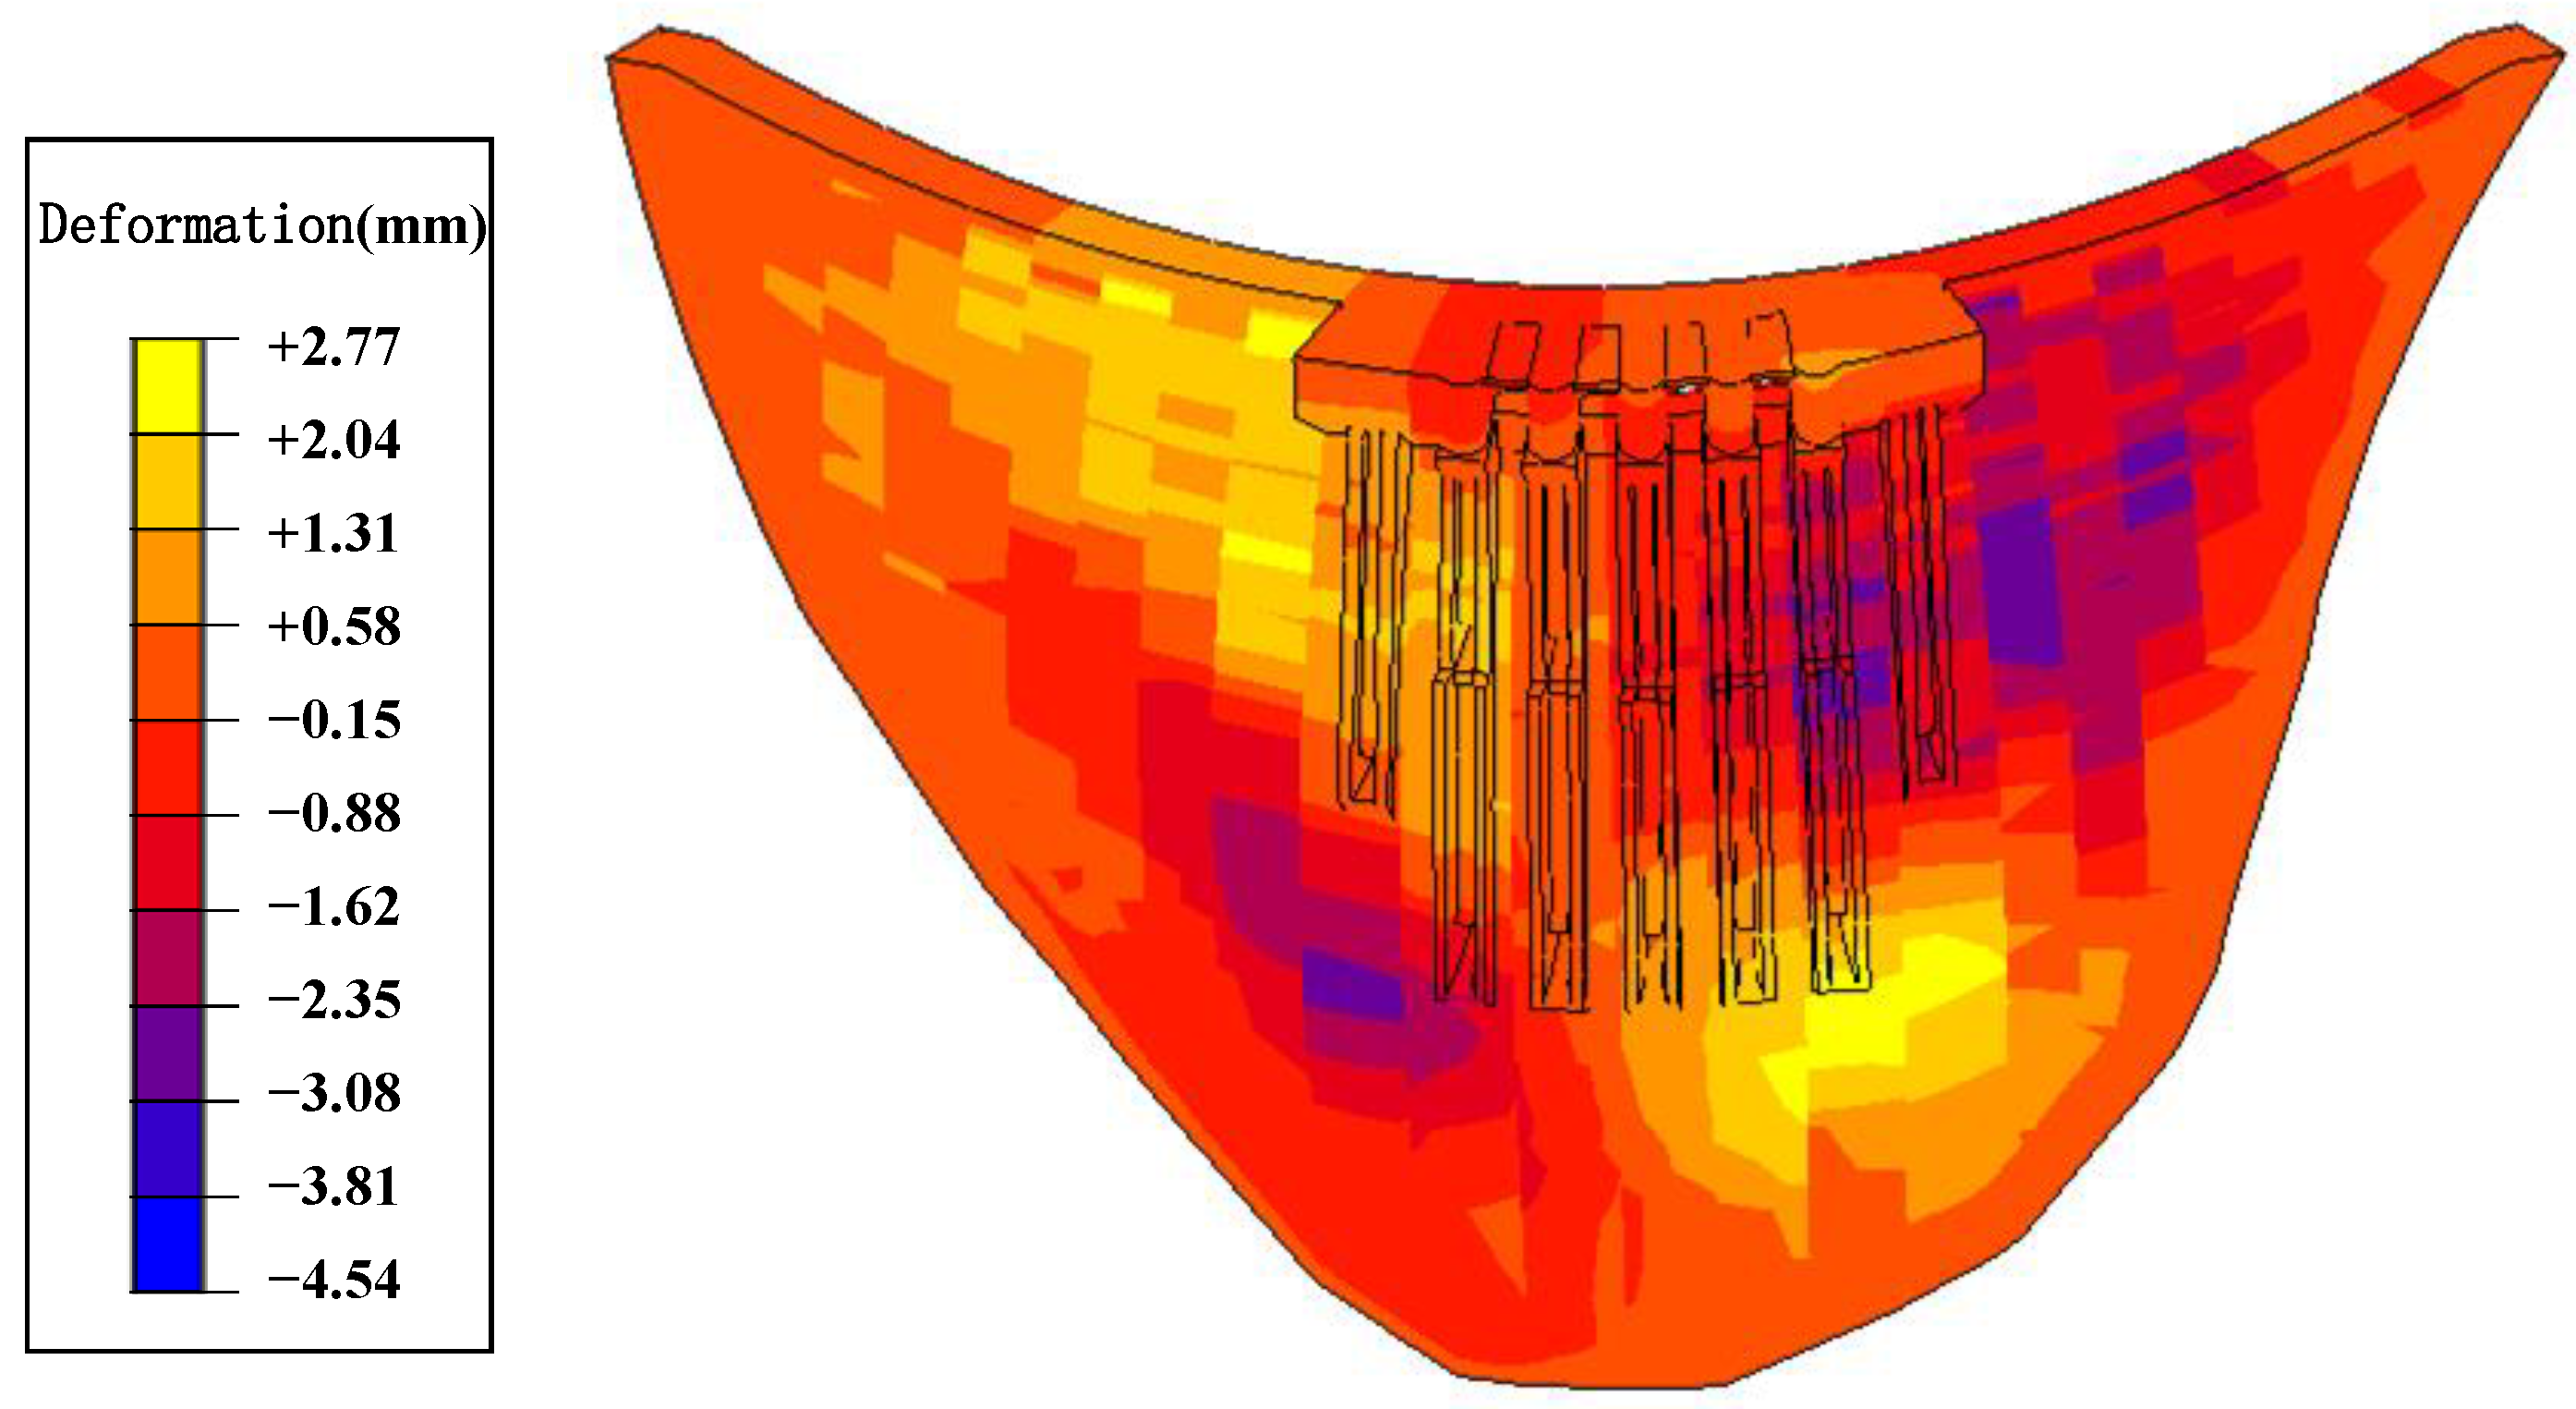
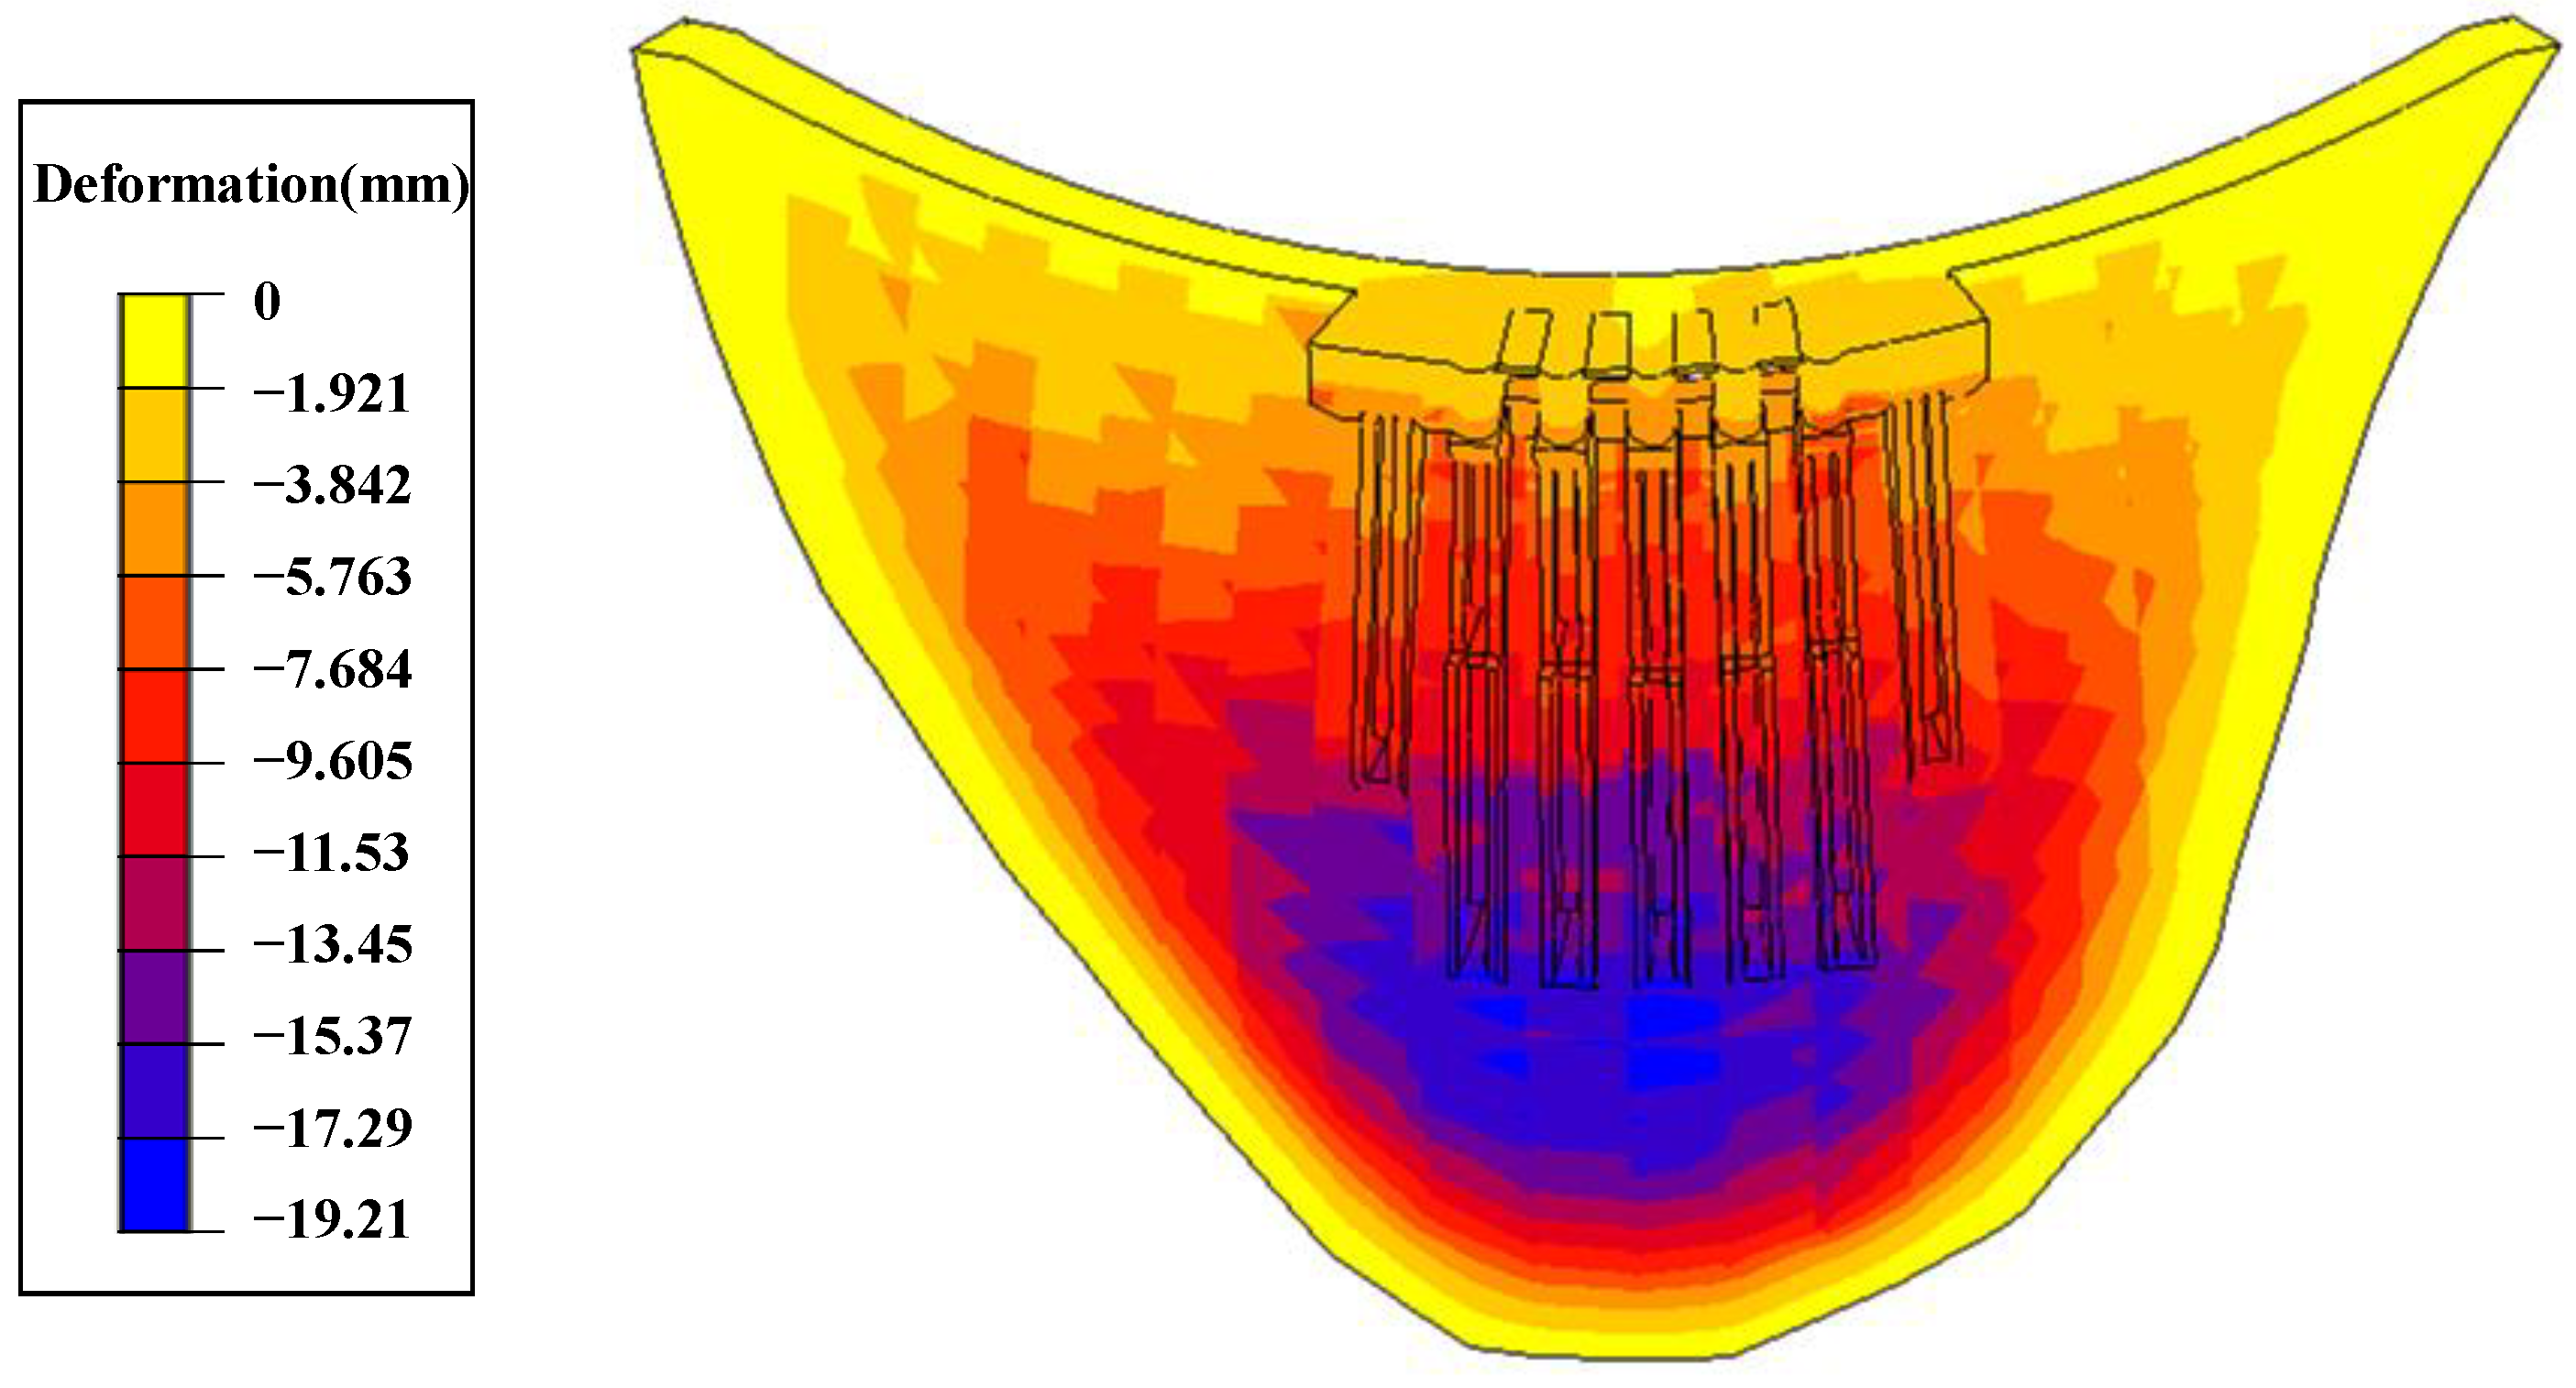
3.3.2. Numerical Calculation Results of the Influence of the Overhanging Effect on the Super-High Arch Dam’s Deformation
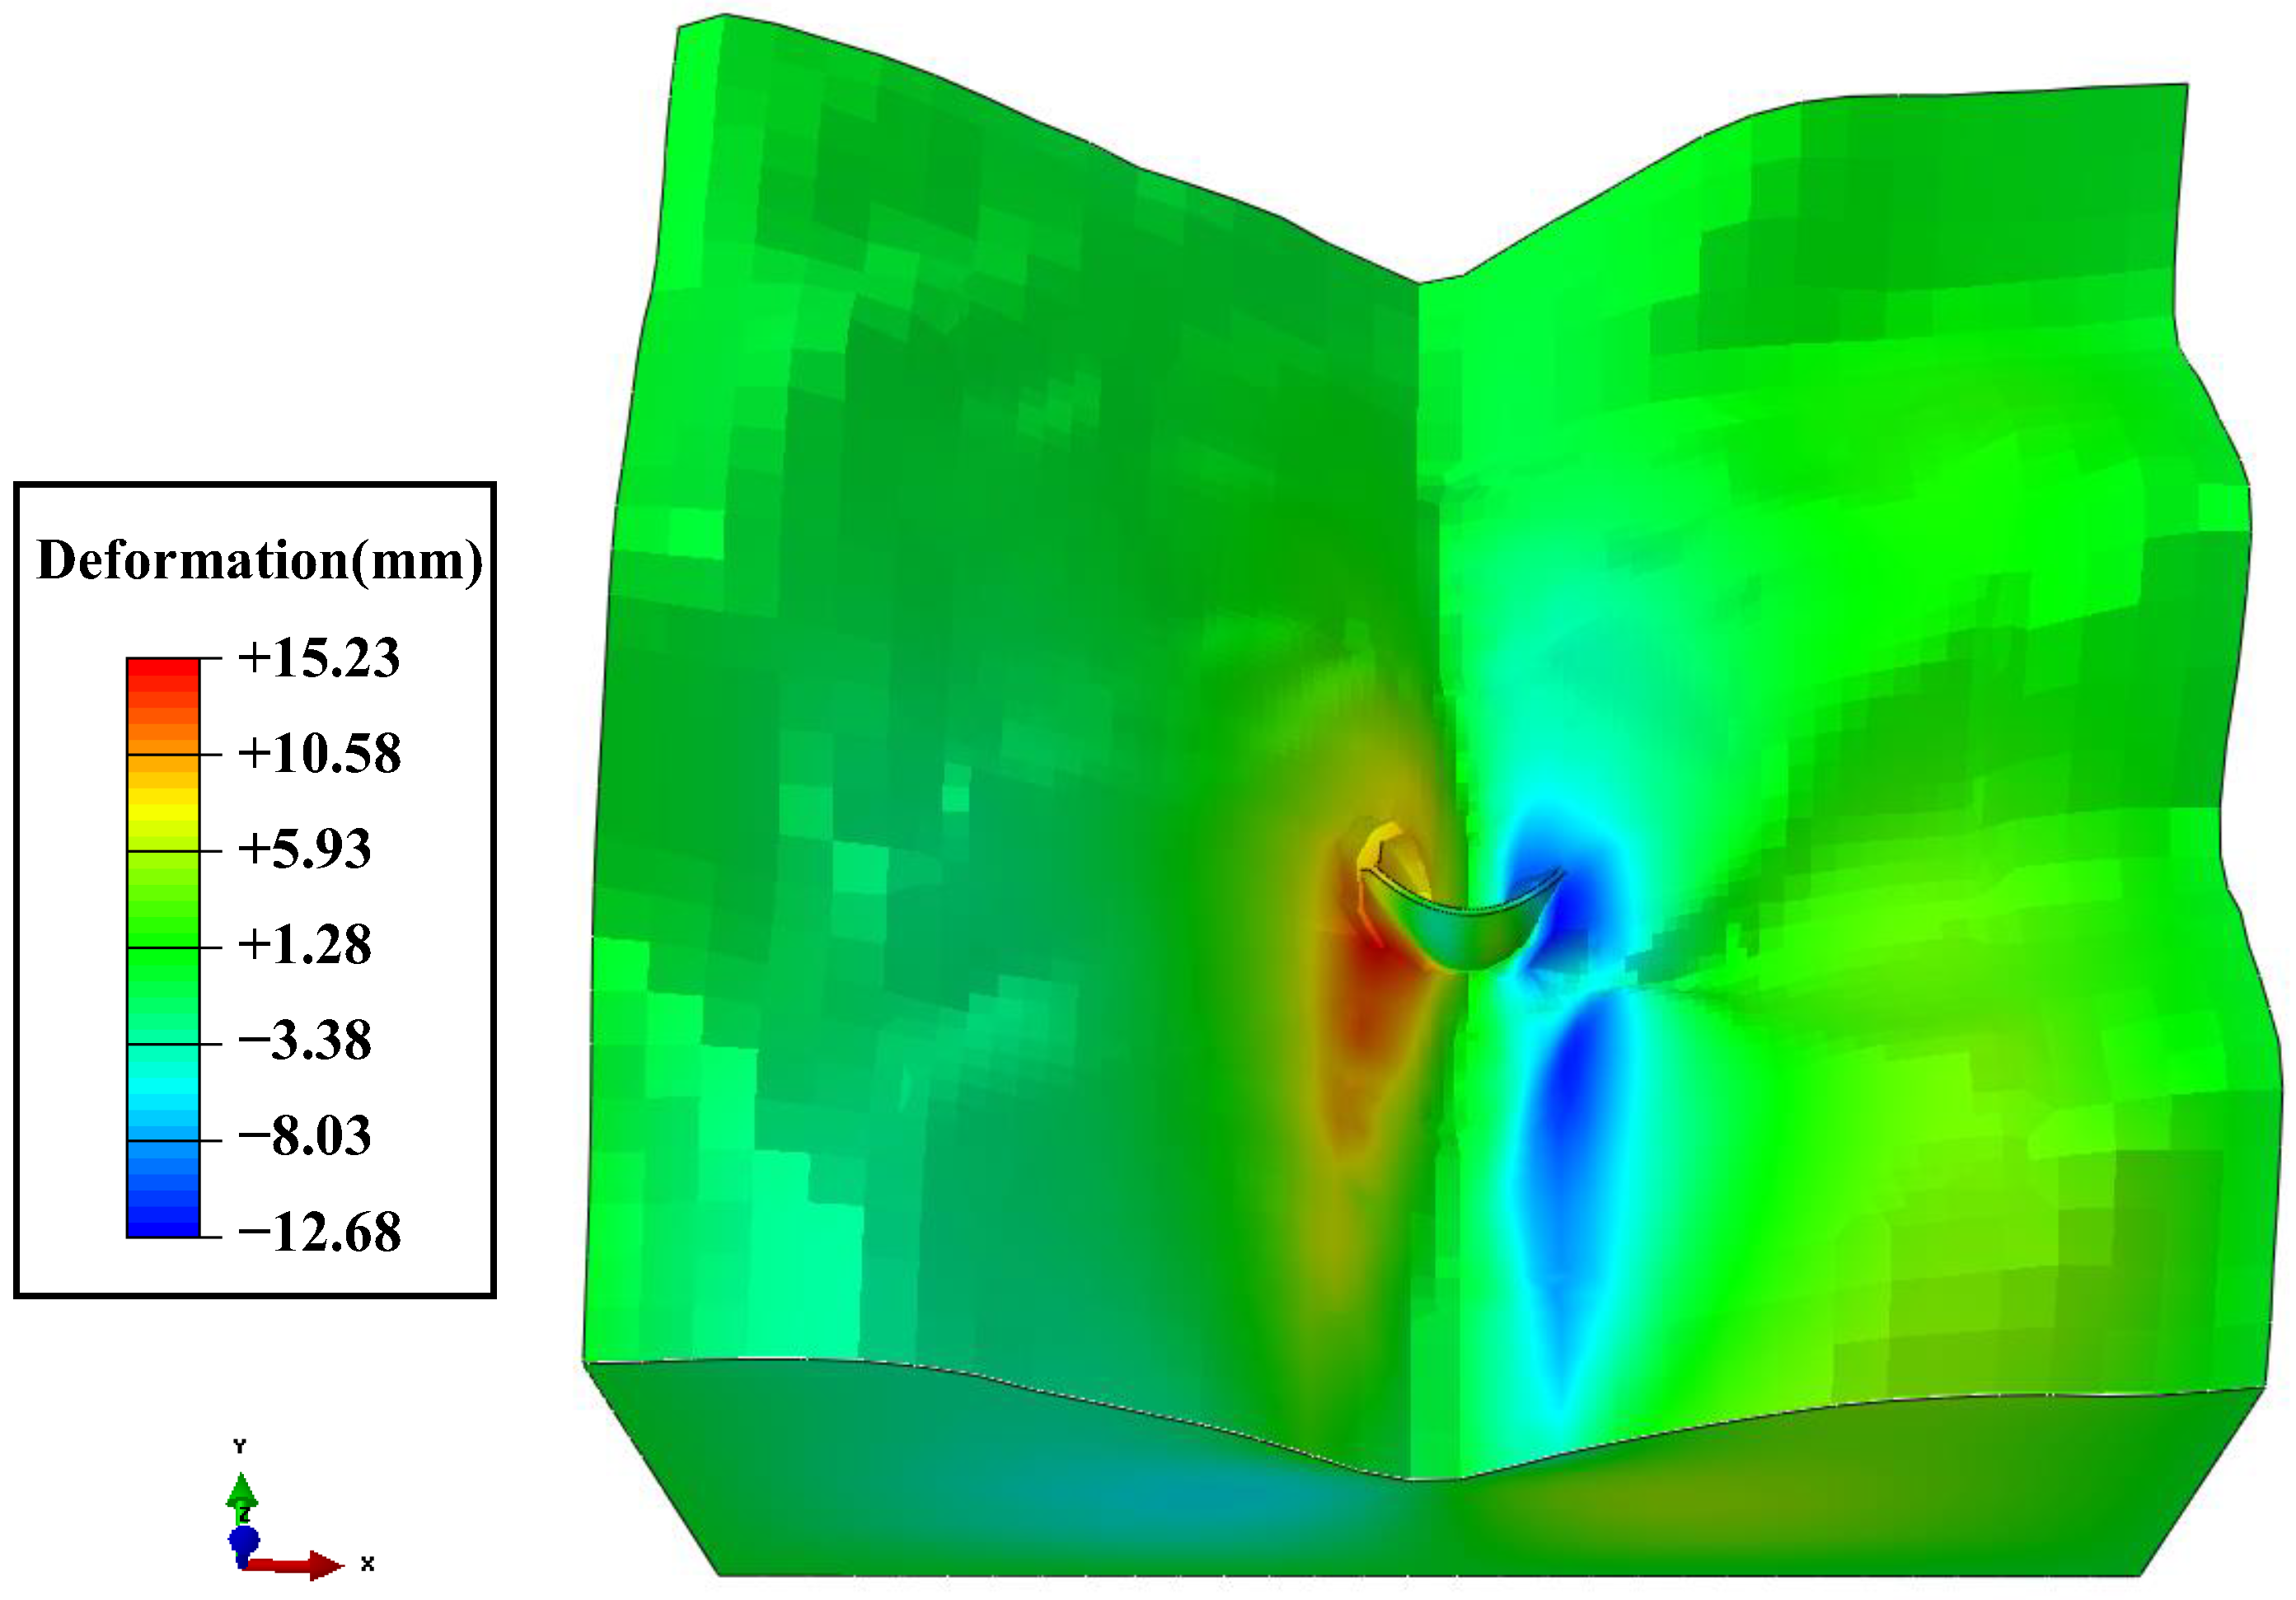
Based on the pouring progress data from 23 October 2009 to 23 December 2013, the self-weight load was applied, and the elastic modulus of the dam body and the deformation modulus of the dam foundation were obtained through laboratory tests. Then, the deformation of the dam body under the influence of the overhanging effect was calculated. The radial, tangential, and vertical deformation of the dam body are shown in Figure 31, Figure 32 and Figure 33.
The main factors affecting the deformation behavior of a super-high arch dam during construction are water level, temperature, aging, pouring elevation, and grouting elevation. In order to gain a deeper understanding of the influence of the overhanging effect on a super-high arch dam’s deformation, only the pouring elevation and grouting elevation were considered as influencing factors by applying only self-weight load. After analyzing Figure 31, Figure 32 and Figure 33, it can be concluded that:
(1)
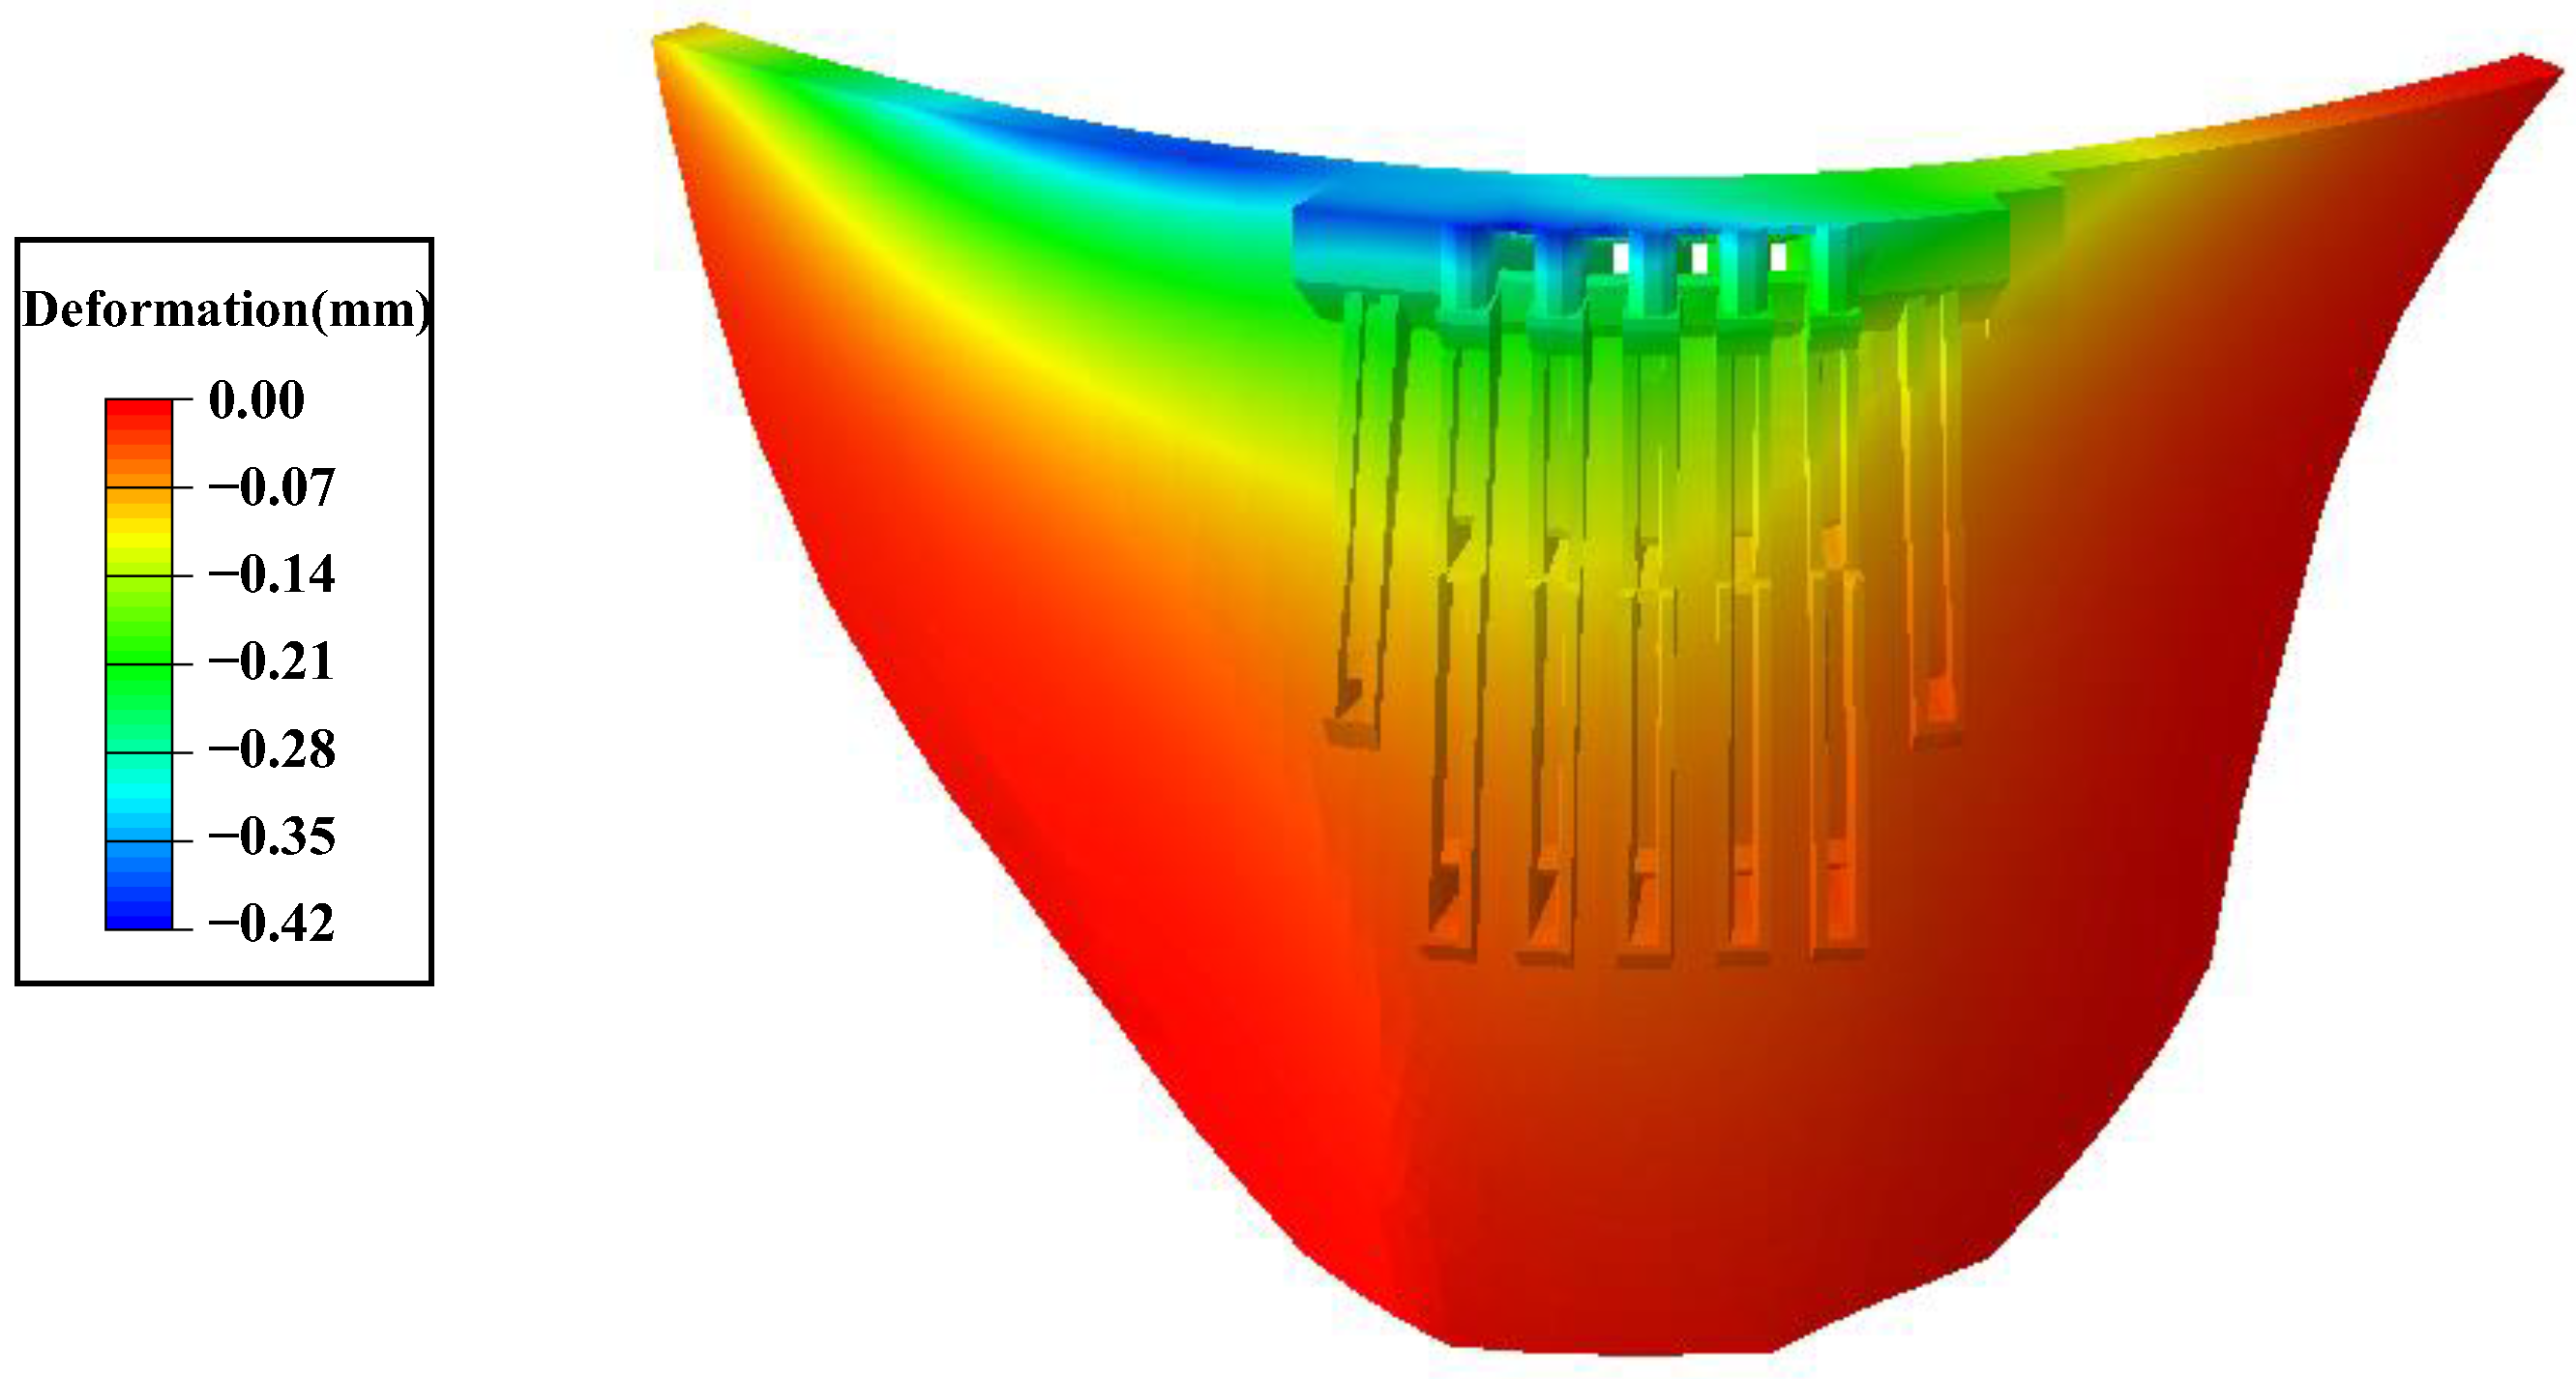
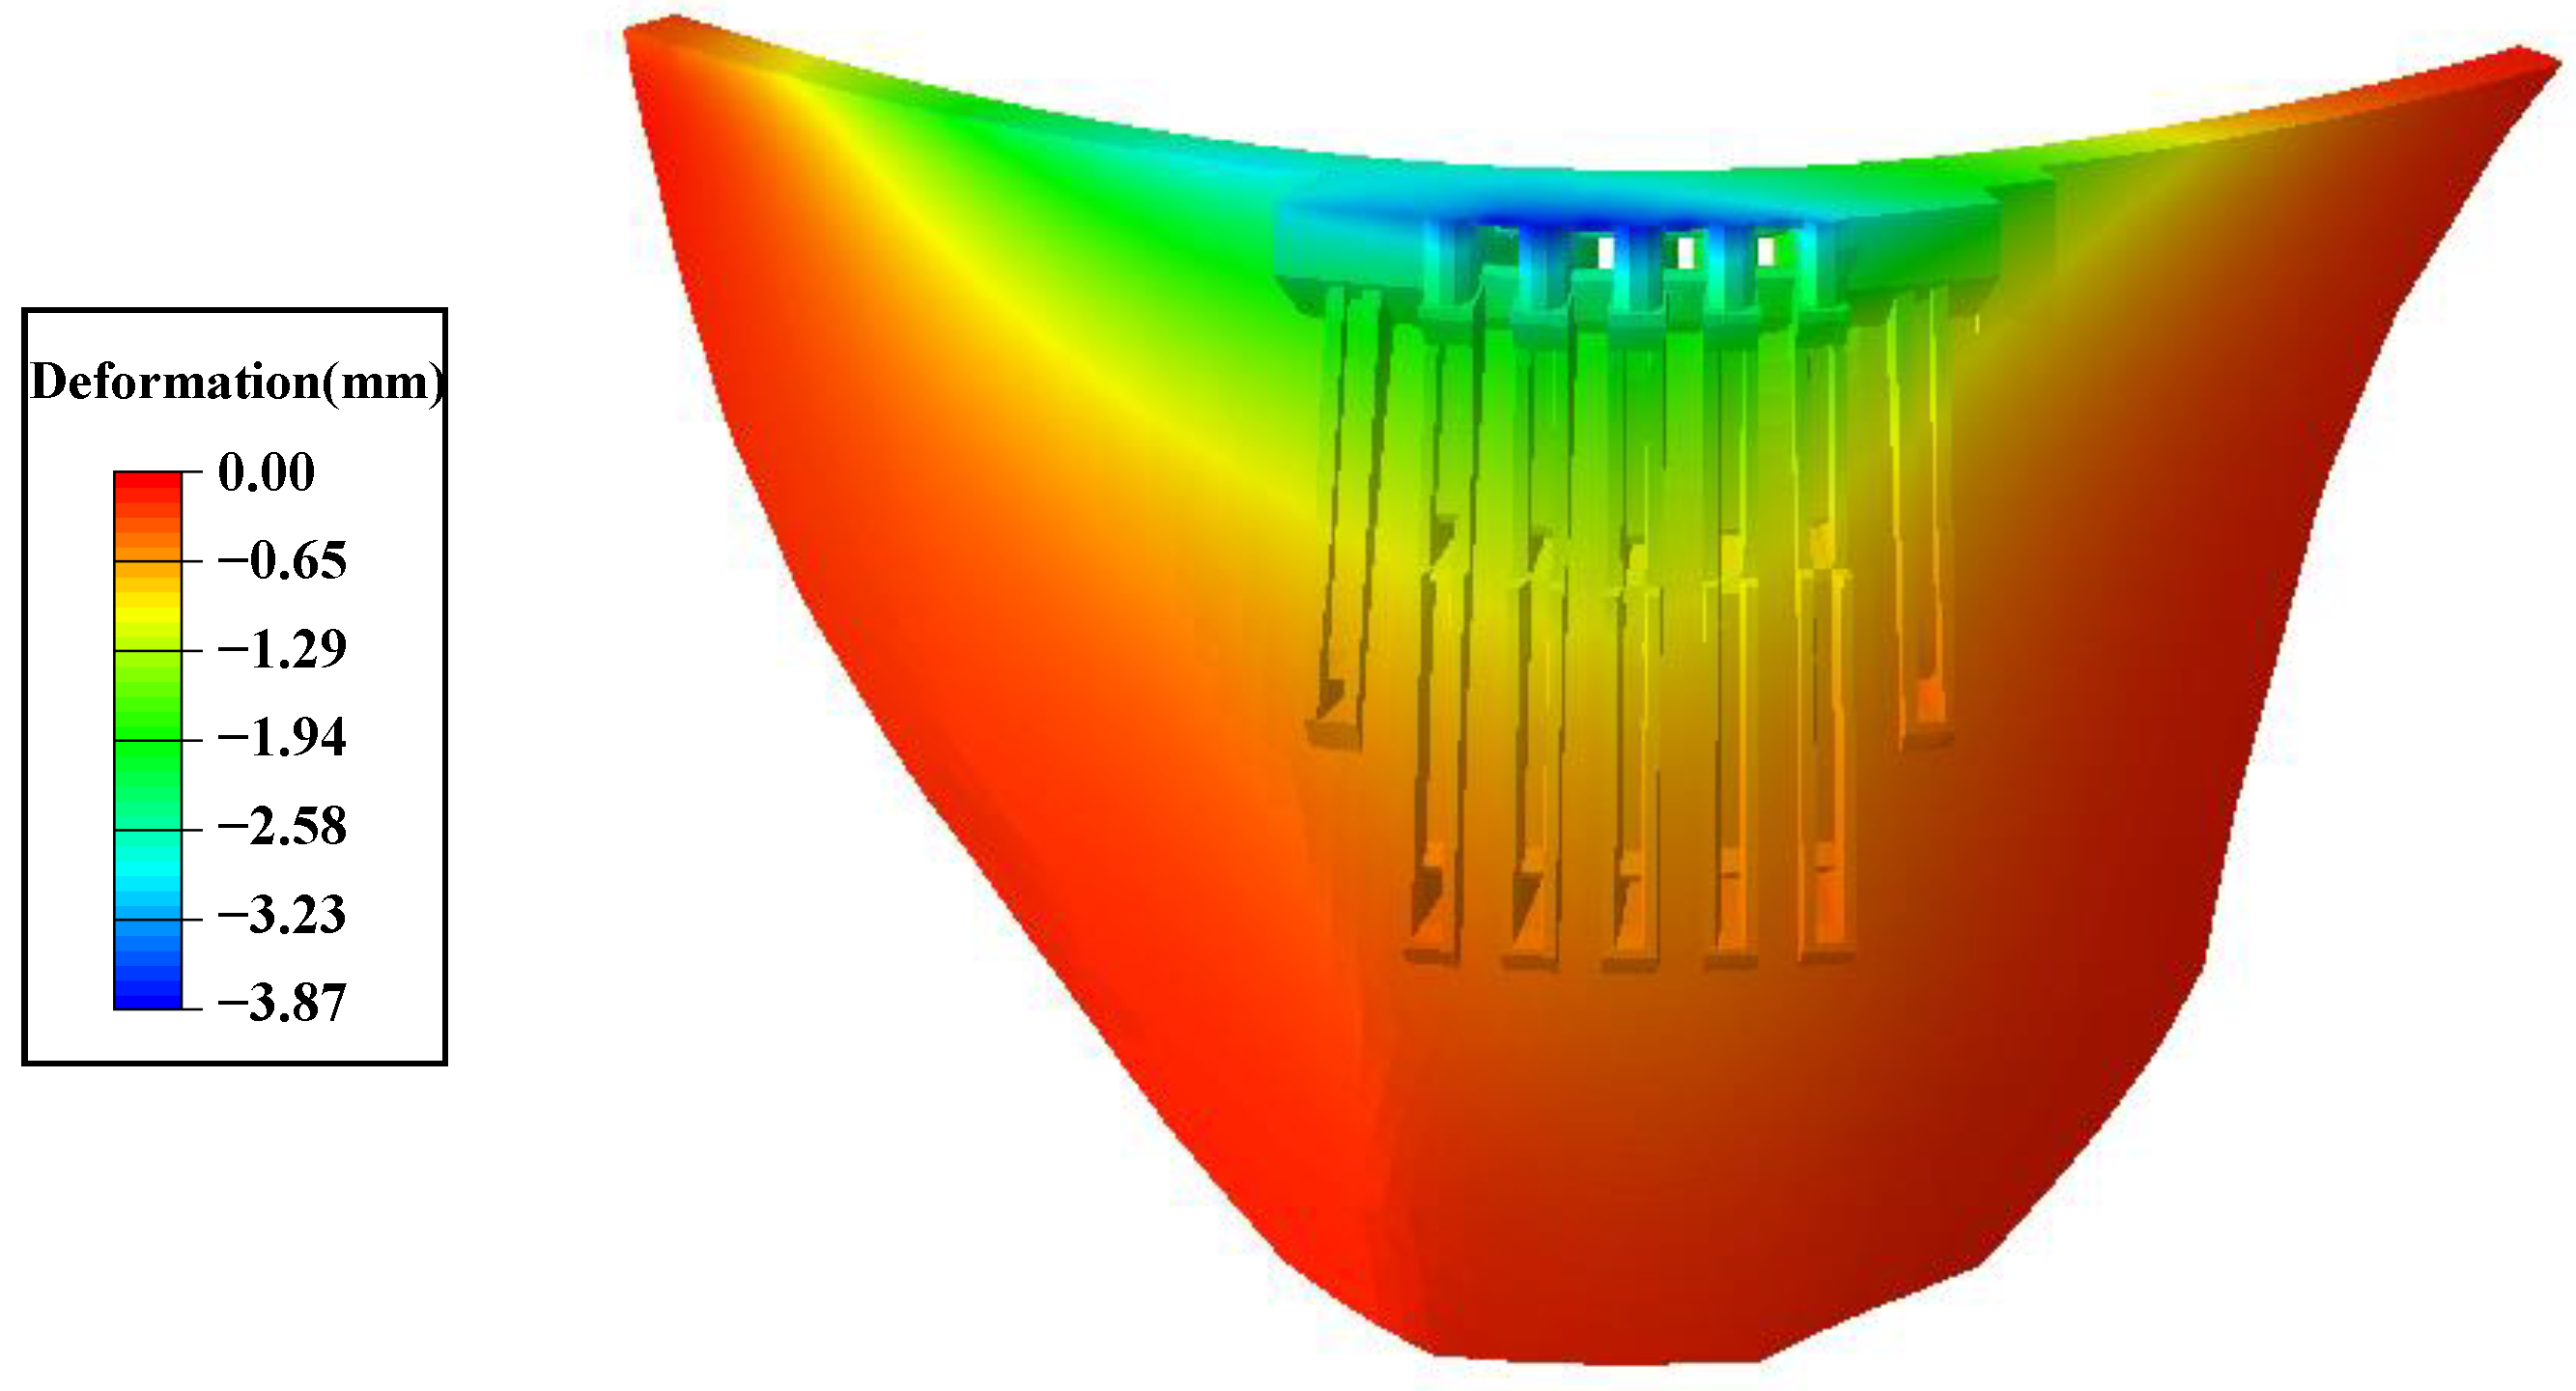
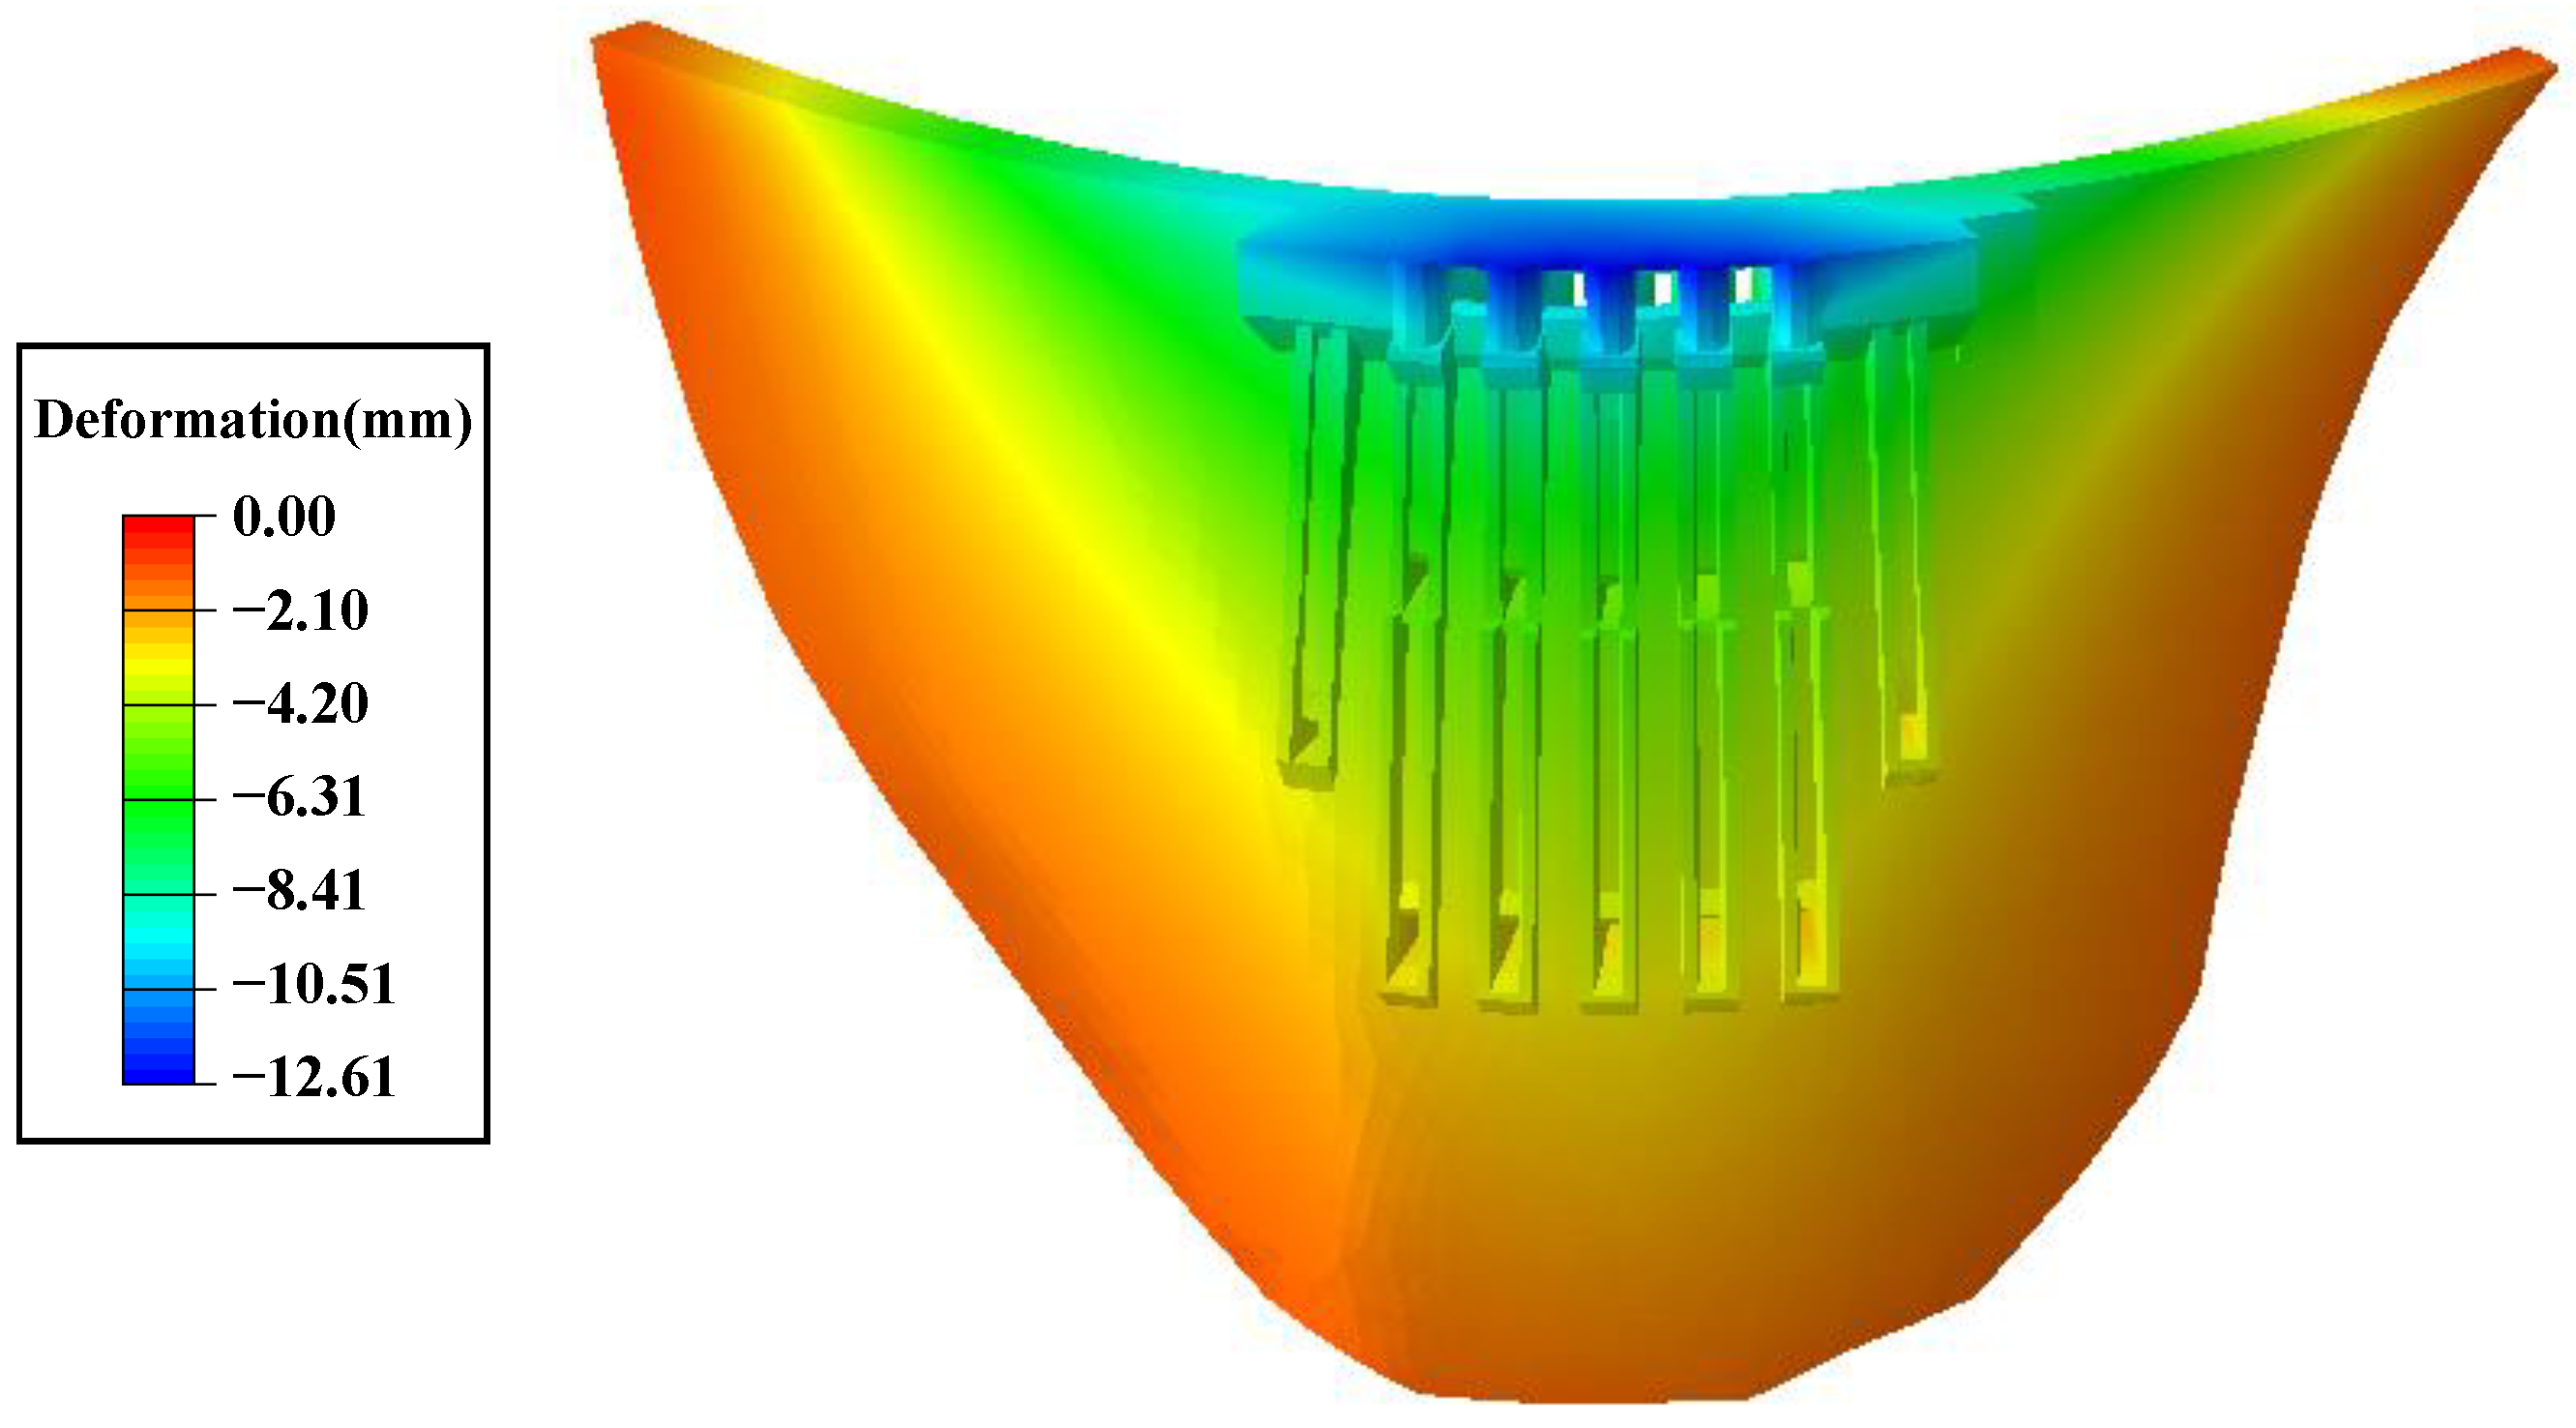
Radial deformation was mainly upward in the upstream direction. The maximal deformation occurred near the arch beam elevation on the dam’s upstream surface, reaching 12.22 mm. The dam’s downstream surface near the spillway orifice had deformation in the downstream direction with a maximum value of 2.47 mm.
(2)
Tangential deformation of the super-high arch dam was relatively small. Due to the compressive effect, the lower-left-bank dam deformed towards the left bank, and the right-bank dam deformed towards the right bank. The deformation directions in the upper dam were opposite to those of the lower dam: the left-bank dam deformed towards the right bank, and the right-bank dam deformed towards the left bank.
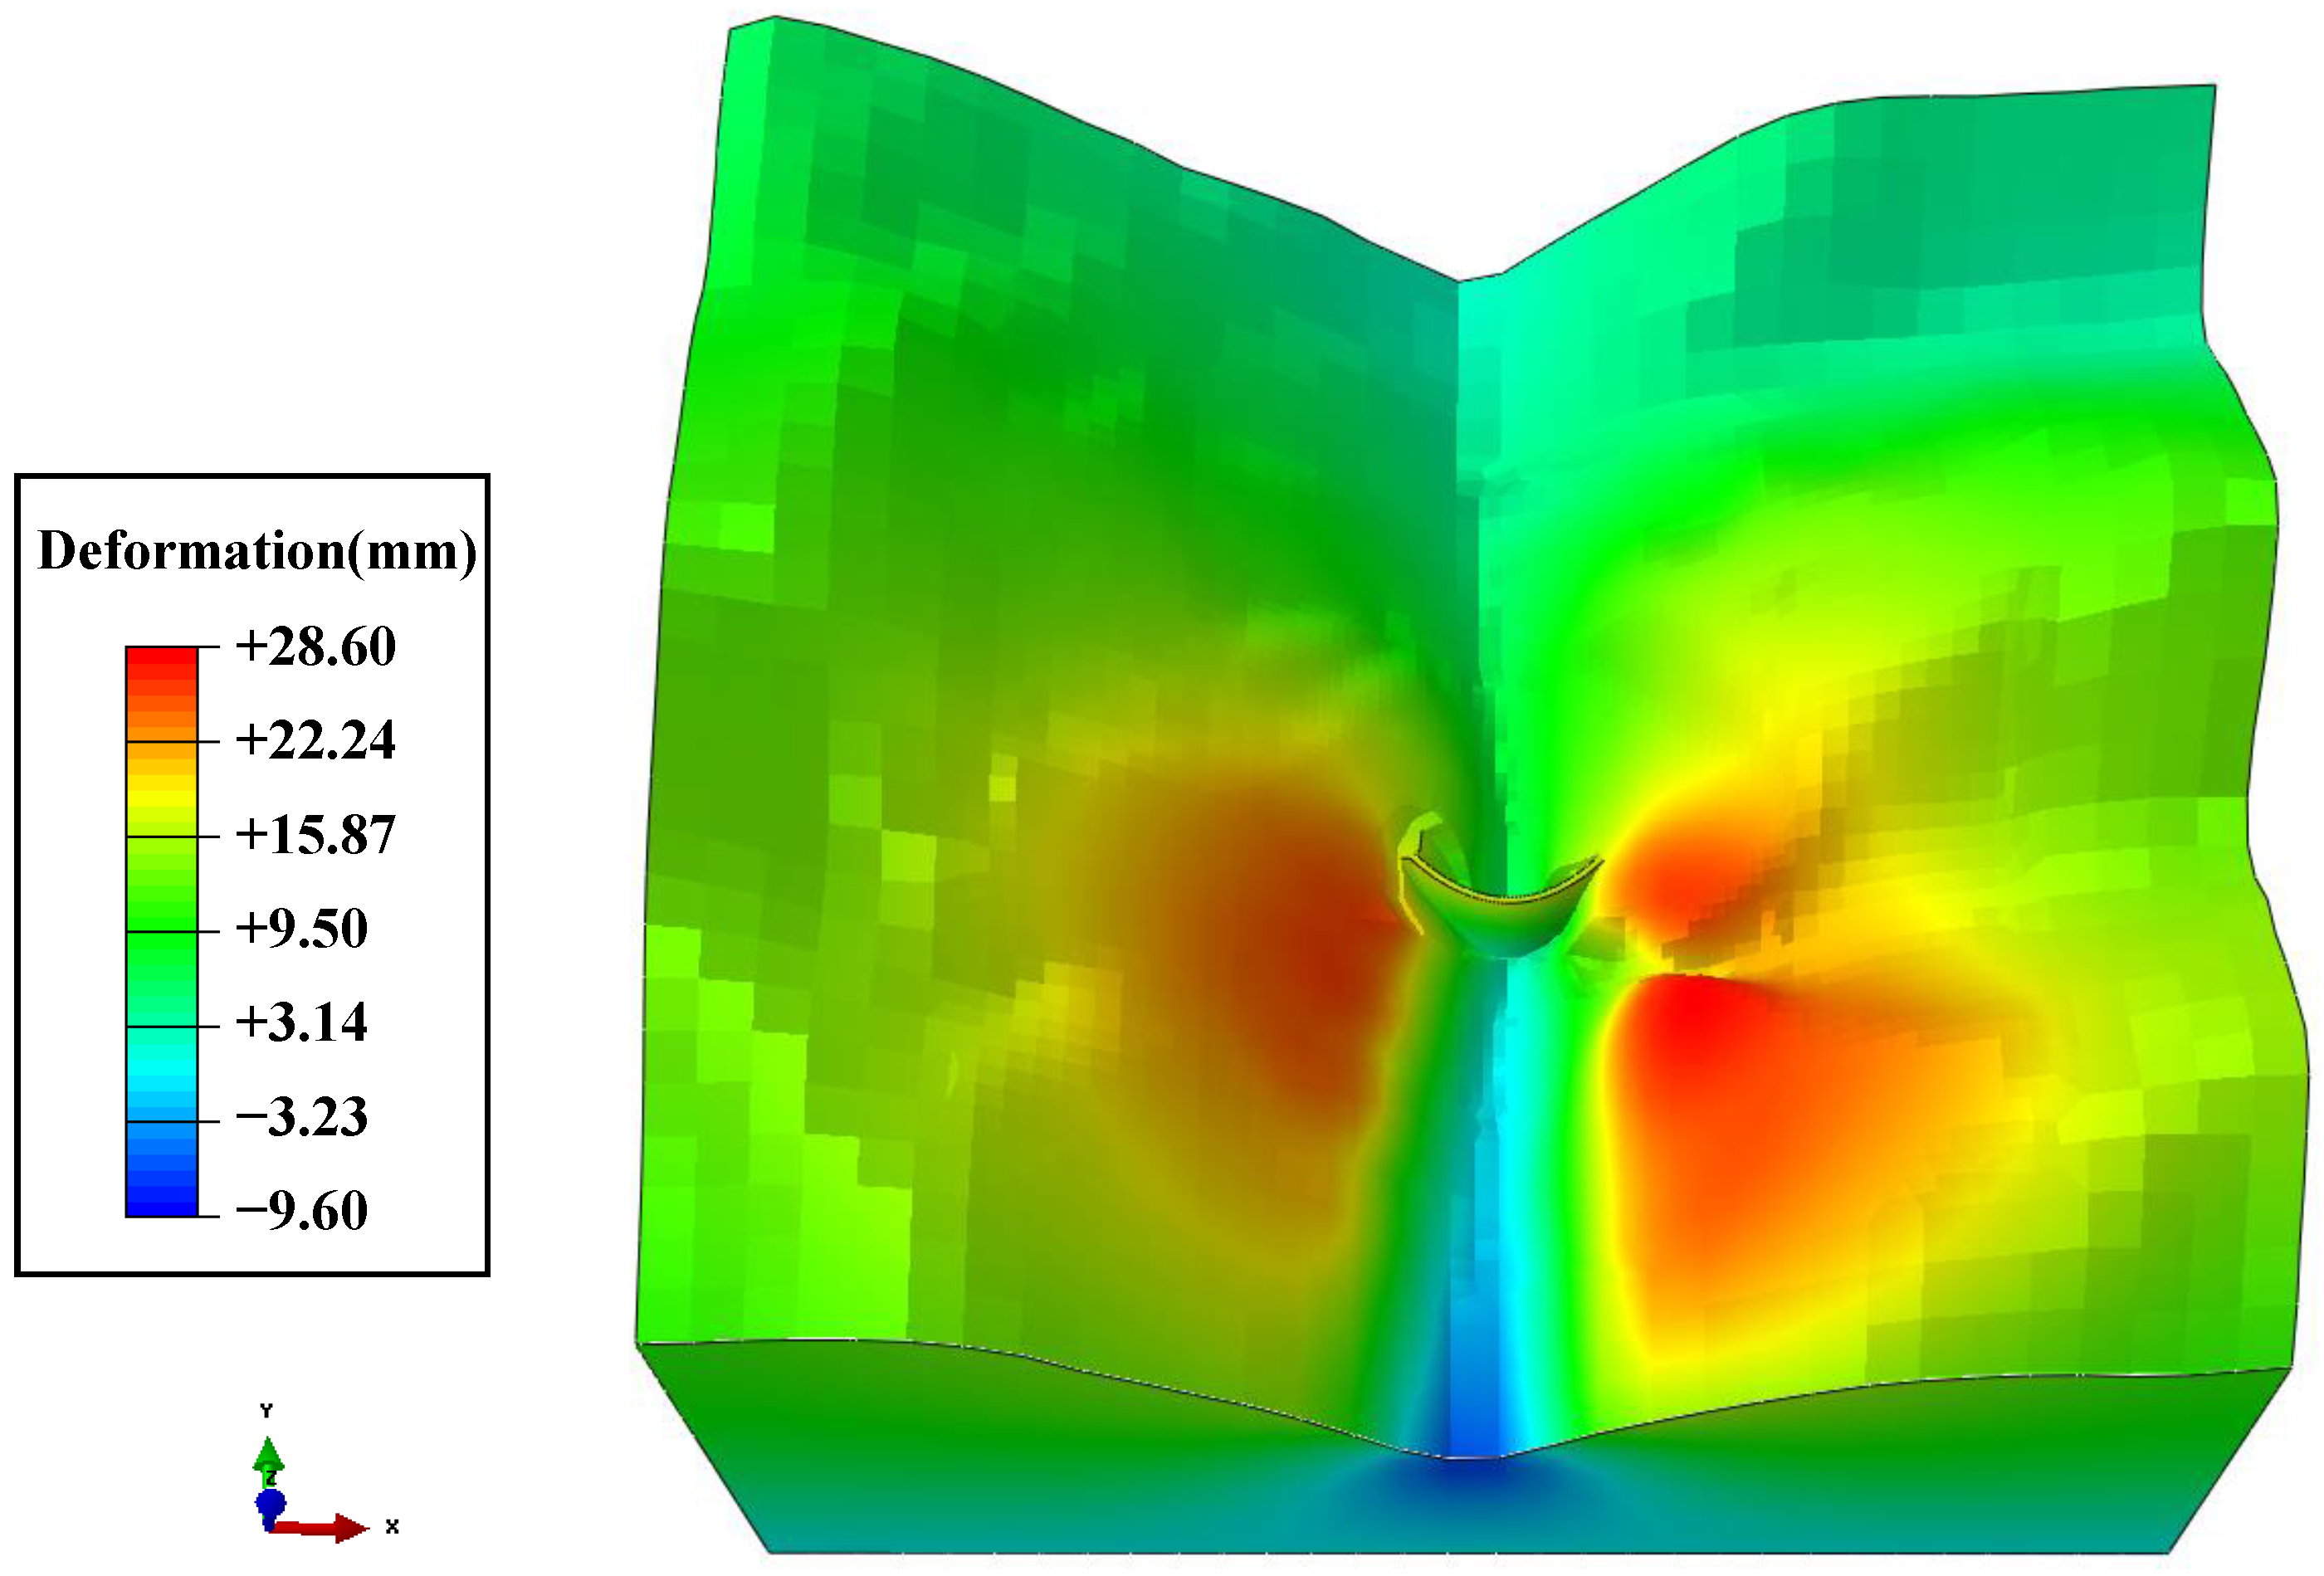
(3)
Due to the self-weight load, the deformation direction was downwards. The vertical deformation near the arch beam’s elevation on the dam’s upstream surface and the spillway orifice on the dam’s downstream surface was relatively large, reaching nearly 20 mm.
The results of finite element calculations verified the content described in Section 2.3. The overhanging effect can affect the deformation behavior of the super-high arch dam, producing radial deformation towards the upstream direction overall. However, in actual engineering, the monitoring instruments are installed after the dam has been poured to a certain elevation, and the actual monitoring data cannot reach the precision of 12 mm. The hanging effect of the arch dam reflected in the measured data still needs specific analysis based on the installation time, location of monitoring instruments, and pouring progress of the dam during construction.
Although some scholars have simulated the dam’s temperature field by considering solar radiation [11,13], most of them only focused on the uneven temperature distribution on the surface of a high arch dam. Then, they studied the unfavorable stress and cracks caused by solar radiation during construction and operation periods. Therefore, these studies did not comprehensively analyze the dam deformation characteristics under the influence of solar radiation. The numerical calculation and analysis results in this work can clearly reflect solar radiation’s effects on a super-high arch dam’s deformation characteristics, which can be used to partially explain the genetic mechanism of the special deformation of the super-high arch dam in the alpine and gorge regions of Southwest China. Most studies took the deformation mechanism of valley contraction as the major work, but few studies discussed the mechanism of influence of valley contraction on dam deformation. Hu et al. [21] simply assumed that the relationship between dam deformation and valley width narrow is linear. The above research work in this paper analyzed and quantified the influences of valley contraction on dam deformation characteristics in detail. At present, there is little research focused on the influence of the overhanging effect on super-high arch dams’ deformation characteristics. Based on the birth and death element method, the dam deformation behavior under the influence of overhanging effect during the construction period was calculated in this paper. The numerical simulation results can be applied in the analysis and quantification of the effect of overhanging effect on a super-high arch dam’s deformation.

4. Conclusions

To ensure the safe operation of super-high arch dams in the alpine and gorge regions of Southwest China, this study took into account the unique climatic and topographic conditions of the regions and combined them with the construction characteristics of super-high arch dams to analyze the effects of solar radiation, valley contraction, and overhanging effects on the dam deformation characteristics using the FEM. We proposed a numerical calculation method to analyze the deformation characteristics of super-high arch dams under the influence of the above factors. The effectiveness of the research method was verified by applying it to the Jinping I super-high arch dam. Some conclusions can be drawn as follows:
(1)
Based on the consideration of the influences of solar radiation on dam temperature and reservoir water temperature, the numerical analysis method of a super-high arch dam’s temperature fields and deformation fields considering the influence of solar radiation was proposed.
(2)
After analyzing the genesis mechanism of valley contraction from the perspective of the coupling of seepage-stress fields, the numerical analysis method of super-high arch dam deformation characteristics under the influence of valley contraction was studied.
(3)
This study analyzed the overhanging effect on the super-high arch dam and proposed a numerical calculation method for the influence of the overhanging effect on the super-high arch dam’s deformation behavior. The calculation results show that the overhanging effect will have a certain impact on the deformation of the arch dam.
(4)
The finite element models which were used to analyze the effects of solar radiation, valley contraction, and overhanging effect on the dam deformation characteristics were established. After taking Jinping I super-high arch dam as an example, we concluded that all of the above factors have an impact on the dam deformation to some extent. The research results are supposed to provide a new way to analyze the causes of super-high arch dam special deformation in the alpine and gorge regions of Southwest China.

Author Contributions

Conceptualization, C.S. and Y.X.; methodology, C.S.; software, C.S.; validation, C.S., S.Z. and Y.X.; investigation, E.Z.; resources, S.T.; data curation, C.S.; writing—original draft preparation, S.Z., Y.X. and S.T.; writing—review and editing, E.Z.; supervision, E.Z. All authors have read and agreed to the published version of the manuscript.

Funding

This research was funded by the Fundamental Research Funds for the Central Universities (B220201042) and the National Natural Science Foundation of China (52209159, 52079046, U2243223).

Data Availability Statement

The data presented in this study are available on request from the corresponding author.

Acknowledgments

The support of Hohai University, China, is gratefully acknowledged.

Conflicts of Interest

The authors declare no conflict of interest.

References

  1. Shao, C.; Zheng, S.; Gu, C.; Hu, Y.; Qin, X. A novel outlier detection method for monitoring data in dam engineering. Expert Syst. Appl. 2022, 193, 116476. [Google Scholar] [CrossRef]
  2. Zhang, X.; Xiao, J.; Lin, Y.; Zhao, D. Valley deformation analysis for a high arch dam in Jinsha river, China. Arab. J. Geosci. 2021, 14, 1374. [Google Scholar] [CrossRef]
  3. Zheng, S.; Shao, C.; Gu, C.; Xu, Y. An automatic data process line identification method for dam safety monitoring data outlier detection. Struct. Control Health Monit. 2022, 29, e2948. [Google Scholar] [CrossRef]
  4. Zhu, Y.; Tang, H. Automatic Damage Detection and Diagnosis for Hydraulic Structures Using Drones and Artificial Intelligence Techniques. Remote Sens. 2023, 15, 615. [Google Scholar] [CrossRef]
  5. Cao, W.; Wen, Z.; Su, H. Spatiotemporal clustering analysis and zonal prediction model for deformation behavior of super-high arch dams. Expert Syst. Appl. 2023, 216, 119439. [Google Scholar] [CrossRef]
  6. Li, M.; Zhou, Z.; Zhuang, C.; Zhou, Z. Deformation mechanism and model of river valley contraction of the Xiluodu reservoir, China. Environ. Earth Sci. 2022, 81, 491. [Google Scholar] [CrossRef]
  7. Zhang, C.; Yin, H. Monitoring and back analysis of Xiluodu high arch dam during initial impoundment. Des. Hydroelectr. Power Stn. 2014, 30, 7–12. [Google Scholar]
  8. Yang, X.; Ren, X.; Ren, Q. Study on influence of construction and water storage process on valley deformation of high arch dam. Bull. Eng. Geol. Environ. 2022, 81, 259. [Google Scholar] [CrossRef]
  9. Zacchei, E.; Molina, J. Reviewing arch-dams’ building risk reduction through a sustainability—Safety management approach. Sustainability 2020, 12, 392. [Google Scholar] [CrossRef] [Green Version]
  10. Pedro, J. Arch Dams: Designing and Monitoring for Safety; Springer Science & Business Media: Berlin/Heidelberg, Germany, 1999. [Google Scholar]
  11. Jin, F.; Chen, Z.; Wang, J.; Yang, J. Practical procedure for predicting non-uniform temperature on the exposed face of arch dams. Appl. Therm. Eng. 2010, 30, 2146–2156. [Google Scholar] [CrossRef]
  12. Mirzabozorg, H.; Hariri-Ardebili, M.A.; Shirkhan, M.; Seyed-Kolbadi, S.M. Mathematical modeling and numerical analysis of thermal distribution in arch dams considering solar radiation effect. Sci. World J. 2014, 2014, 597393. [Google Scholar] [CrossRef] [PubMed] [Green Version]
  13. Santillán, D.; Salete, E.; Vicente, D.J.; Toledo, M.Á. Treatment of solar radiation by spatial and temporal discretization for modeling the thermal response of arch dams. J. Eng. Mech. 2014, 140, 05014001. [Google Scholar] [CrossRef]
  14. Castilho, E.; Schclar, N.; Tiago, C.; Farinha, M.L.B. FEA model for the simulation of the hydration process and temperature evolution during the concreting of an arch dam. Eng. Struct. 2018, 174, 165–177. [Google Scholar] [CrossRef]
  15. Zhu, Z.; Liu, Y.; Tan, Y. Simulation of temperature field of high arch dams considering solar radiation. IOP Conf. Ser. Earth Environ. Sci. 2020, 455, 012003. [Google Scholar] [CrossRef]
  16. Žvanut, P.; Turk, G.; Kryžanowski, A. Thermal Analysis of a Concrete Dam Taking into Account Insolation, Shading, Water Level and Spillover. Appl. Sci. 2021, 11, 705. [Google Scholar] [CrossRef]
  17. Pan, J.; Liu, W.; Wang, J.; Jin, F.; Chi, F. A novel reconstruction method of temperature field for thermomechanical stress analysis of arch dams. Measurement 2022, 188, 110585. [Google Scholar] [CrossRef]
  18. Barla, G.; Antolini, F.; Barla, M.; Mensi, E.; Piovano, G. Monitoring of the Beauregard landslide (Aosta Valley, Italy) using advanced and conventional techniques. Eng. Geol. 2010, 116, 218–235. [Google Scholar] [CrossRef]
  19. Cheng, L.; Liu, Y.; Yang, Q.; Pan, Y.; Lv, Z. Mechanism and numerical simulation of reservoir slope deformation during impounding of high arch dams based on nonlinear FEM. Comput. Geotech. 2017, 81, 143–154. [Google Scholar] [CrossRef]
  20. Li, B.; Xu, J.; Xu, W.; Wang, H.; Yan, L.; Meng, Q.; Xie, W. Mechanism of valley narrowing deformation during reservoir filling of a high arch dam. Eur. J. Environ. Civ. Eng. 2020, 1–11. [Google Scholar] [CrossRef]
  21. Hu, J.; Ma, F. Comparison of hierarchical clustering based deformation prediction models for high arch dams during the initial operation period. J. Civ. Struct. Health Monit. 2021, 11, 897–914. [Google Scholar] [CrossRef]
  22. Li, M.; Selvadurai, A.P.S.; Zhou, Z. Observations and computational simulation of river valley contraction at the Xiluodu dam, Yunnan, China. Rock Mech. Rock Eng. 2023, 1–23. [Google Scholar] [CrossRef]
  23. Pan, J.; Wang, J. Effect of abutment movements on nonlinear seismic response of an arch dam. Struct. Infrastruct. Eng. 2020, 16, 1106–1120. [Google Scholar] [CrossRef]
  24. Shi, H.; Xu, W.; Yang, L.; Xu, J.; Meng, Q. Investigation of influencing factors for valley deformation of high arch dam using machine learning. Eur. J. Environ. Civ. Eng. 2020, 1–12. [Google Scholar] [CrossRef]
  25. Xu, W.; Cheng, Z.; Wang, H.; Meng, Q.; Xie, W. Correlation between valley deformation and water level fluctuations in high arch dam. Eur. J. Environ. Civ. Eng. 2020, 1–10. [Google Scholar] [CrossRef]
  26. Amerine, M.; Berg, H.; Cruess, W. Guide to Sources for Agricultural and Biological Research; University of California Press: Berkeley, CA, USA; Los Angeles, CA, USA, 1981; pp. F278–F279. ISBN 0-520-03226-8. [Google Scholar]
  27. Whitted, T. An improved illumination model for shaded display. In Proceedings of the ACM SIGGRAPH 2005 Courses, Los Angeles, CA, USA, 31 July–4 August 2005; p. 4–es. [Google Scholar]
  28. Tian, Y.; Davies-Colley, R.; Gong, P.; Thorrold, B. Estimating solar radiation on slopes of arbitrary aspect. Agric. For. Meteorol. 2001, 109, 67–74. [Google Scholar] [CrossRef]
  29. Rohsenow, W.; Hartnett, J.; Cho, Y. Handbook of Heat Transfer; Mcgraw-Hill: New York, NY, USA, 1998. [Google Scholar]
  30. Ren, Q.; Zhang, L.; Shen, L.; Tao, M. Analysis of deformation law of rock mass considering unsaturated seepage process. Chin. J. Rock Mech. Eng. 2018, 37, 4100–4107, (In Chinese with English abstract). [Google Scholar]
  31. Wu, A.; Fan, L.; Zhong, Z.; Zhang, Y.; Yu, M. Development of an in situ hydro-mechanical coupling true triaxial test system for fractured rock mass and its application. Chin. J. Rock Mech. Eng. 2020, 39, 2161–2171, (In Chinese with English abstract). [Google Scholar]
  32. Kong, X. Advanced Percolation Mechanics; Press of University of Science and Technology of China: Hefei, China, 2010; (In Chinese with English abstract). [Google Scholar]
  33. Yang, J.; Hu, D.; Guan, W. Analysis of high slope rock deformation and safety performance for left bank of Lijiaxia arch dam. Chin. J. Rock Mech. Eng. 2005, 24, 3551–3560, (In Chinese with English abstract). [Google Scholar]
  34. Yang, Z.; Chen, W.; Zhang, D.; Wan, X. Influence of different loading process of self-weight on performance of arch dam. J. Guangxi Univ. 2012, 37, 820–825, (In Chinese with English abstract). [Google Scholar]
  35. Chen, Z.; Zhao, Z.; Zhu, H.; Wang, X.; Yan, X. The step-by-step model technology considering nonlinear effect used for construction simulation analysis. Int. J. Steel Struct. 2015, 15, 271–284. [Google Scholar] [CrossRef]
Figure 1. Boundary conditions of the super-high arch dam’s temperature field.
Mathematics 11 01753 g001
Figure 2. Diagram of fracture water pressure.
Mathematics 11 01753 g002
Figure 3. Diagram of a super-high arch dam valley’s cross-section.
Mathematics 11 01753 g003
Figure 4. Dam-overhanging effect of the double-curvature arch dam.
Mathematics 11 01753 g004
Figure 5. Comparison of monitoring and construction progress of Xiluodu arch dam.
Mathematics 11 01753 g005
Figure 6. Finite element model of the Jinping I super-high arch dam.
Mathematics 11 01753 g006
Figure 7. Finite element model of the dam body and mountains near the Jinping I super-high arch dam. (a) Dam upstream surface. (b) Dam downstream surface.
Mathematics 11 01753 g007
Figure 8. Finite element model for calculating the effect of solar radiation on reservoir water.
Mathematics 11 01753 g008
Figure 9. The temperature fields of the arch crown beam on a summer solstice day. (a) Consideration of solar radiation. (b) Without consideration of solar radiation.
Mathematics 11 01753 g009
Figure 10. Temperature field of the arch dam influenced by the solar radiation during one day in summer.
Mathematics 11 01753 g010
Figure 11. The surface temperature of the arch dam during five days in summer.
Mathematics 11 01753 g011
Figure 12. The impact of summer water temperature correction on the temperature field of the arch dam. (a) Without consideration of solar radiation. (b) Consideration of solar radiation.
Mathematics 11 01753 g012
Figure 13. Radial deformation field of the dam caused by solar radiation during a whole day in summer.
Mathematics 11 01753 g013
Figure 14. Dam annual cumulative radial deformation caused by solar radiation.
Mathematics 11 01753 g014
Figure 15. Radial deformation field of the dam caused by summer air temperature, water temperature, and solar radiation.
Mathematics 11 01753 g015
Figure 16. The finite element model of the super-high arch dam. (a) The finite element model of the mountain in the vicinity of the dam and the dam body. (b) The finite element model of the dam and its foundation.
Mathematics 11 01753 g016
Figure 17. The finite element model of dam and the left-bank cushion.
Mathematics 11 01753 g017
Figure 18. Numerical calculation results of riverbed cross-sectional pore pressure.
Mathematics 11 01753 g018
Figure 19. Numerical calculation results of rock-mass saturation at dam site cross-section.
Mathematics 11 01753 g019
Figure 20. Numerical calculation results of rock-mass saturation at curtain section.
Mathematics 11 01753 g020
Figure 21. Numerical calculation results of rock-mass saturation in the right bank section.
Mathematics 11 01753 g021
Figure 22. Numerical calculation results of rock-mass saturation in the left bank section.
Mathematics 11 01753 g022
Figure 23. Numerical calculation results of the saturation degree of the first stage of the arch dam’s spillway section (water level: 1707 m).
Mathematics 11 01753 g023
Figure 24. Numerical calculation results of the saturation degree of the second stage of the arch dam’s spillway section (water level: 1800 m).
Mathematics 11 01753 g024
Figure 25. Numerical calculation results of the saturation degree of the third stage of the arch dam’s spillway section (water level: 1880 m).
Mathematics 11 01753 g025
Figure 26. Numerical calculation results of the valley’s tangential deformation.
Mathematics 11 01753 g026
Figure 27. Numerical calculation results of the valley’s vertical deformation.
Mathematics 11 01753 g027
Figure 28. Numerical calculation results of radial deformation field of the dam influenced by valley contraction.
Mathematics 11 01753 g028
Figure 29. Numerical calculation results of arch crown beam radial deformation influenced by valley contraction.
Mathematics 11 01753 g029
Figure 30. The finite element model for analysis of the dam-overhanging effect.
Mathematics 11 01753 g030
Figure 31. Radial deformation of the super-high arch dam.
Mathematics 11 01753 g031
Figure 32. Tangential deformation of the super-high arch dam.
Mathematics 11 01753 g032
Figure 33. Vertical deformation of the super-high arch dam.
Mathematics 11 01753 g033
Disclaimer/Publisher’s Note: The statements, opinions and data contained in all publications are solely those of the individual author(s) and contributor(s) and not of MDPI and/or the editor(s). MDPI and/or the editor(s) disclaim responsibility for any injury to people or property resulting from any ideas, methods, instructions or products referred to in the content.

