Review

Concrete 3D Printing: Process Parameters for Process Control, Monitoring and Diagnosis in Automation and Construction

Singapore Centre for 3D Printing, School of Mechanical & Aerospace Engineering, Nanyang Technological University, 50 Nanyang Avenue, Singapore 639798, Singapore
*
Author to whom correspondence should be addressed.
Mathematics 2023, 11(6), 1499; https://doi.org/10.3390/math11061499
Submission received: 20 February 2023 / Revised: 8 March 2023 / Accepted: 13 March 2023 / Published: 19 March 2023
(This article belongs to the Special Issue Mathematics in Robot Control for Theoretical and Applied Problems)

Abstract

:
In Singapore, there is an increasing need for independence from manpower within the Building and Construction (B&C) Industry. Prefabricated Prefinished Volumetric Construction (PPVC) production is mainly driven by benefits in environmental pollution reduction, improved productivity, quality control, and customizability. However, overall cost savings have been counterbalanced by new cost drivers like modular precast moulds, transportation, hoisting, manufacturing & holding yards, and supervision costs. The highly modular requirements for PPVC places additive manufacturing in an advantageous position, due to its high customizability, low volume manufacturing capabilities for a faster manufacturing response time, faster production changeovers, and lower inventory requirements. However, C3DP has only just begun to move away from its early-stage development, where there is a need to closely evaluate the process parameters across buildability, extrudability, and pumpability aspects. As many parameters have been identified as having considerable influence on C3DP processes, monitoring systems for feedback applications seem to be an inevitable step forward to automation in construction. This paper has presented a broad analysis of the challenges posed to C3DP and feedback systems, stressing the admission of process parameters to correct multiple modes of failure.

1. Introduction

In Singapore, there is an increasing need for independence from manpower within the Building and Construction (B&C) Industry [1]. Currently, the preferred construction approach in Singapore’s high-density urban landscape is the use of Prefabricated Prefinished Volumetric Construction (PPVC). The Building and Construction Authority (BCA) in Singapore has supported this construction method by implementing regulatory channels to utilize its extensive network, mainly driven by benefits in environmental pollution reduction, improved productivity, quality control, and customizability [2,3]. The off-site fabrication capabilities of this technique also enable furnishings, finishes, and fittings prior to its deployment to the site. In turn, these benefits positively affect manpower costs and safety ratings on-site. However, overall cost savings have been counterbalanced by new cost drivers such as modular precast moulds, transportation, hoisting, manufacturing & holding yards, and supervision costs [3]. Case studies of two pilot projects carried out at North Hill, Nanyang Technological University and Changi Crown Plaza Hotel reported more than 15% increase in costs compared to traditional cast methods, largely attributed to these cost drivers [3].
Concrete 3D Printing (C3DP) is an additive manufacturing approach that deposits a mixture of concrete slurry or cement using a layer-by-layer methodology to form a structure without the use of traditional formwork. Potentially, the emergence of C3DP can improve sustainability by reducing material wastage, costs, and construction risks, with the reduction of labor intensive processes [4,5]. The highly modular requirements for PPVC places concrete additive manufacturing in an advantageous position due to its high customizability and low volume manufacturing capabilities for a faster manufacturing response time, faster production changeovers, and lower inventory requirements [4]. The inherent characteristics of 3D printing may seem advantageous, but C3DP has only just begun to move away from early-stage development and its success rate in the real-world environment is still being evaluated, as buildability, extrudability, and pumpability concerns persists. These current challenges in C3DP have been attributed to numerous parameters that include environmental, material, and process parameters [6].

Objective

This review paper will attempt to discuss the importance of process control parameters. The introduction has provided a brief overview of the building and construction industry in Singapore. This covered the research gap in C3DP and a brief description of the existing issues. Section 2 will give an overview of 3D printing’s characteristics, exploring, and listing current challenges and solutions in the C3DP process. At the same time, a short discussion will be given of the parameters involved for the respective research challenges. Section 3 will specify and describe the need for monitoring systems to complement the requirements for a complete diagnosis system. Section 4 will discuss and describe the core requirements of a diagnosis system for C3DP applications and provide a correlation explanation for the previous two chapters. Section 5 displays existing systems that utilize machine vision technologies for diagnosis of varying aspects in traditional construction workspaces. Finally, Section 6 offers a conclusion and a future vision for feedback systems in C3DP.

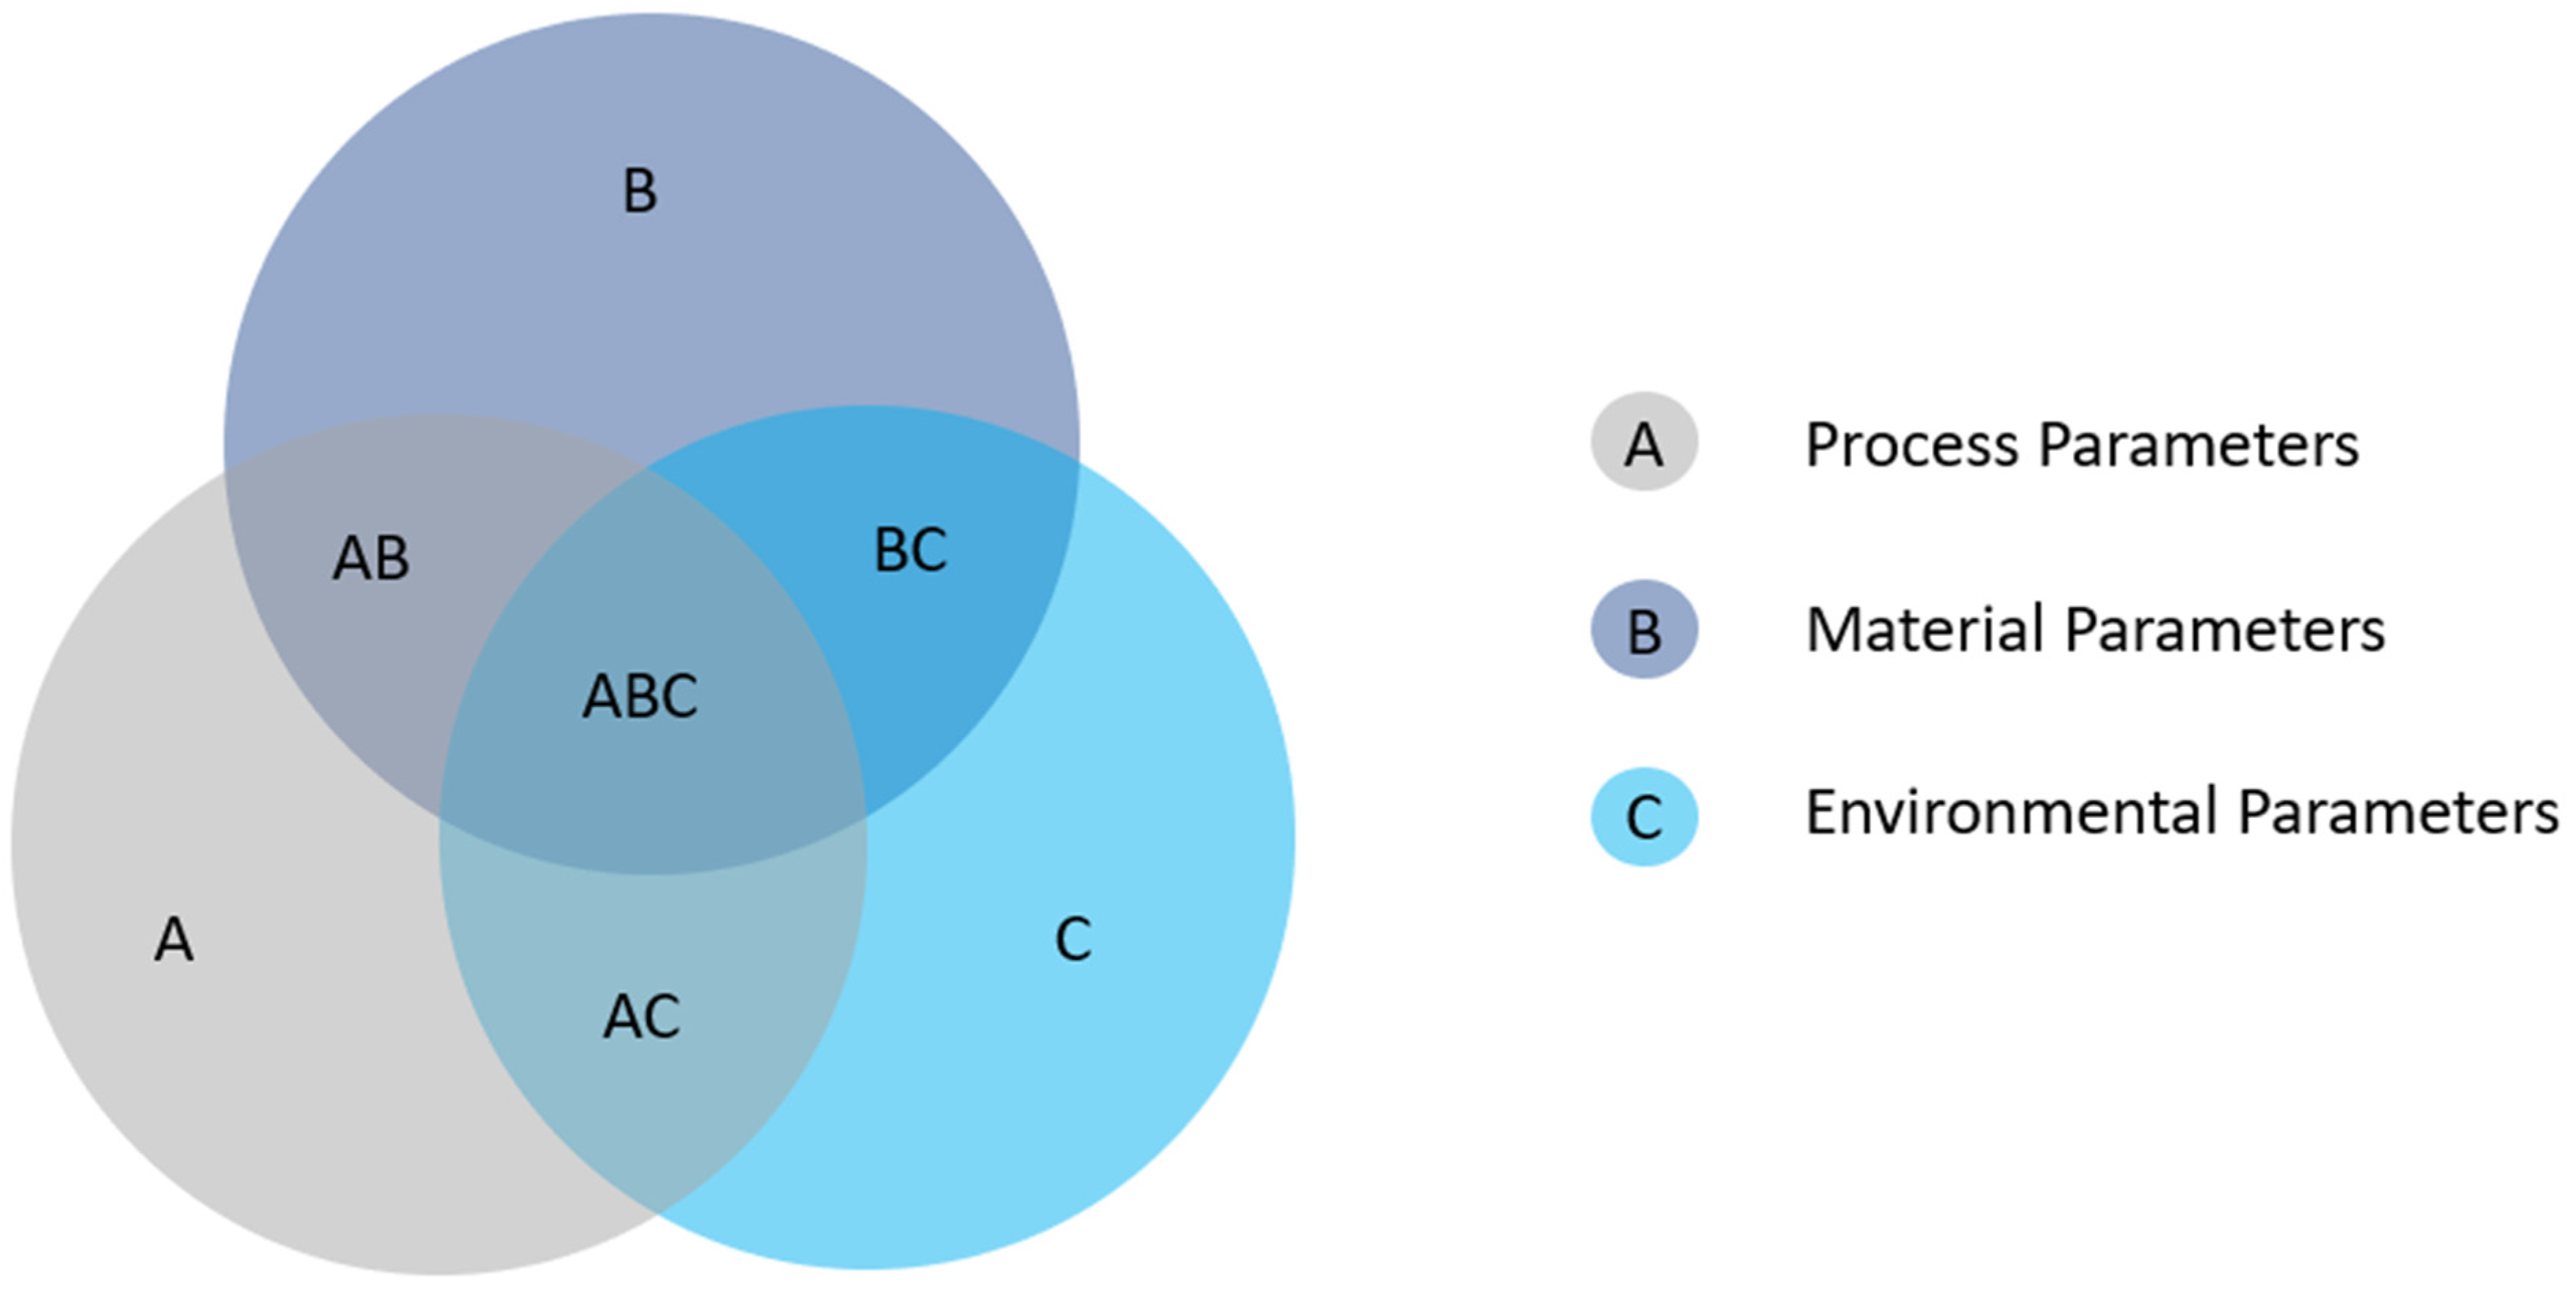
2. Parameter Classification in C3DP Structural Faults

Ma et al. observed an eightfold increase in Concrete 3D Printing research from 2017 to 2020. The authors reported that about 80% of all research in the field was dedicated to material optimization studies, while the remainder were distributed between processing (10%), software (9%), and building integration (1%) [7]. A greater focus on material related studies was reported. Research conducted to implement optimization via process control for this field is sparse, which is an indicator that the research direction is still in its early-stage development, as process control is one of the considerations for later-stage or end-stage development.
Process control and automation falls under the branch of processing. This includes the study of process parameters in C3DP, such as material flow rate, nozzle travel speed, and nozzle stand-off distance [8,9,10]. Generally, these parameters are estimated and calibrated as an open-loop process prior to the print, which may introduce errors and could affect the print quality, and any unexpected in-process developments require manual intervention. Currently, several researchers are investigating a closed-loop control for these parameters to achieve an improved printing performance and outcome. However, these process control augmentations tend to require substantial developmental time and costs, which may discourage research in the area. Hence, this chapter attempts to focus on the importance of assessment for process parameters and process control.
With the current development, these parametric studies are independently defined within their own research scope. Solutions derived from these issues can appear subjective when two or more parametric categories are involved in the issue. In this section, the current issues and challenges encountered in C3DP will be classified according to their attributed parameters. This paper references the parameters classified in several literature sources and simplifies these technical parameters according to Figure 1, summarized into process, material, and environmental parameters [6,11,12,13,14].
We can refer to the table below to categorically define these parameters, based on the factors currently known. In this paper, qualified parameters are considered as observable qualitative or quantitative factors that can influence the printing outcome. This categorization includes pre- and post-process, in-situ and ex-situ measured parameters, and is non-exhaustive. The classification is sorted and organized according to current research findings and will distinguish and emphasize the importance of process parameters in process control, along with the following sections. Table 1 displays a list of parameters in their respective categories.

2.1. Weak Interlayer Bond

Weak interfacial bond strength has been considered by several researchers in the following areas: (a) porosity and saturation state of the substrate, (b) moisture condition of the surface, (c) magnitude of plastic shrinkage, (d) varying yield stress and/or plastic viscosities of the deposited material and substrate [17]. To date, this remains one of the biggest challenges n C3DP, as requires a deep understanding of material and machine parameters.

2.1.1. Porosity and Moisture Conditions

Microstructure discrepancies occur due to entrapped air pockets. In C3DP, air pockets within the extruded filament mainly appear due to the lack of formwork and vibration, which are prevalent methods in traditional construction to densify the concrete [25]. However, recent evidence suggests that the interconnected porosity within a 3D printed filament is much more complex, when compared to pores found in casted concrete, which poses a postponed fatal cracking facility [25,26,27,28]. Fundamental knowledge indicates that air entrapment begins in mixing and occurs between layers during deposition [29]. Air entrapment also occurs at the interlayer during deposition [17,27,28,30,31]. Both occurrences are typically assessed collectively in porosity tests such as Scanning Electron Microscope (SEM), Mercury intrusion porosimetry (MIP), and Computed tomography (CT) imaging [31].
Nerella et al. observed and categorized four cases of porosity in poor interlayer bond strength: (1) weakly bonded, (2) weakly bonded under process and curing conditions, (3) temporarily weakly bonded, and (4) strongly bonded. Case 1 indicates long and wide separation between layers that cannot be connected by hydration constituents before 28 days assessment. Case 2 is caused by air entrapped by process and curing parameters such as drying shrinkage, moisture conditions, or printing parameters that cannot undergo proper hydration. Situations of Case 3 are usually the least porous compared to the other cases and are likely to be self-healed overtime via hydration. Finally, case 4 indicates well-bonded regions [17]. The presence of porosity reveals poor densification within the C3DP structure, for which Shakor et al. stated that this was due to limited moisture and the presence of fine particles that decrease wettability of powder [32].

2.1.2. Plastic Shrinkage

3D printed concrete is extremely susceptible to plastic shrinkage cracks. The lack of formwork, low bleeding water, low aggregate to binder ratio and high quantities of fine aggregates are the material-based constraints that allow fresh concrete to retain its extrudability and buildability. These material properties are vulnerable to early age water evaporation that can result in volumetric shrinkage. Physical restraints lead to increased tension that causes plastic shrinkage cracking [33]. The combination of high surface-to-volume ratio and dry environment conditions also fosters an undesirable effect [34,35]. Aside from its aesthetic damage, the presence of cracks can increase the likelihood of water seepages and water penetration in the structure, which can cause corrosion in steel reinforcements, and crack propagation may occur from thermal expansion of water in varied environmental conditions, such as saltwater penetration and freeze–thaw cycles [24,36,37,38,39]. Plastic shrinkage appears to cause interlayer slips and leads to poor interlayer bond strength and structural durability [34].

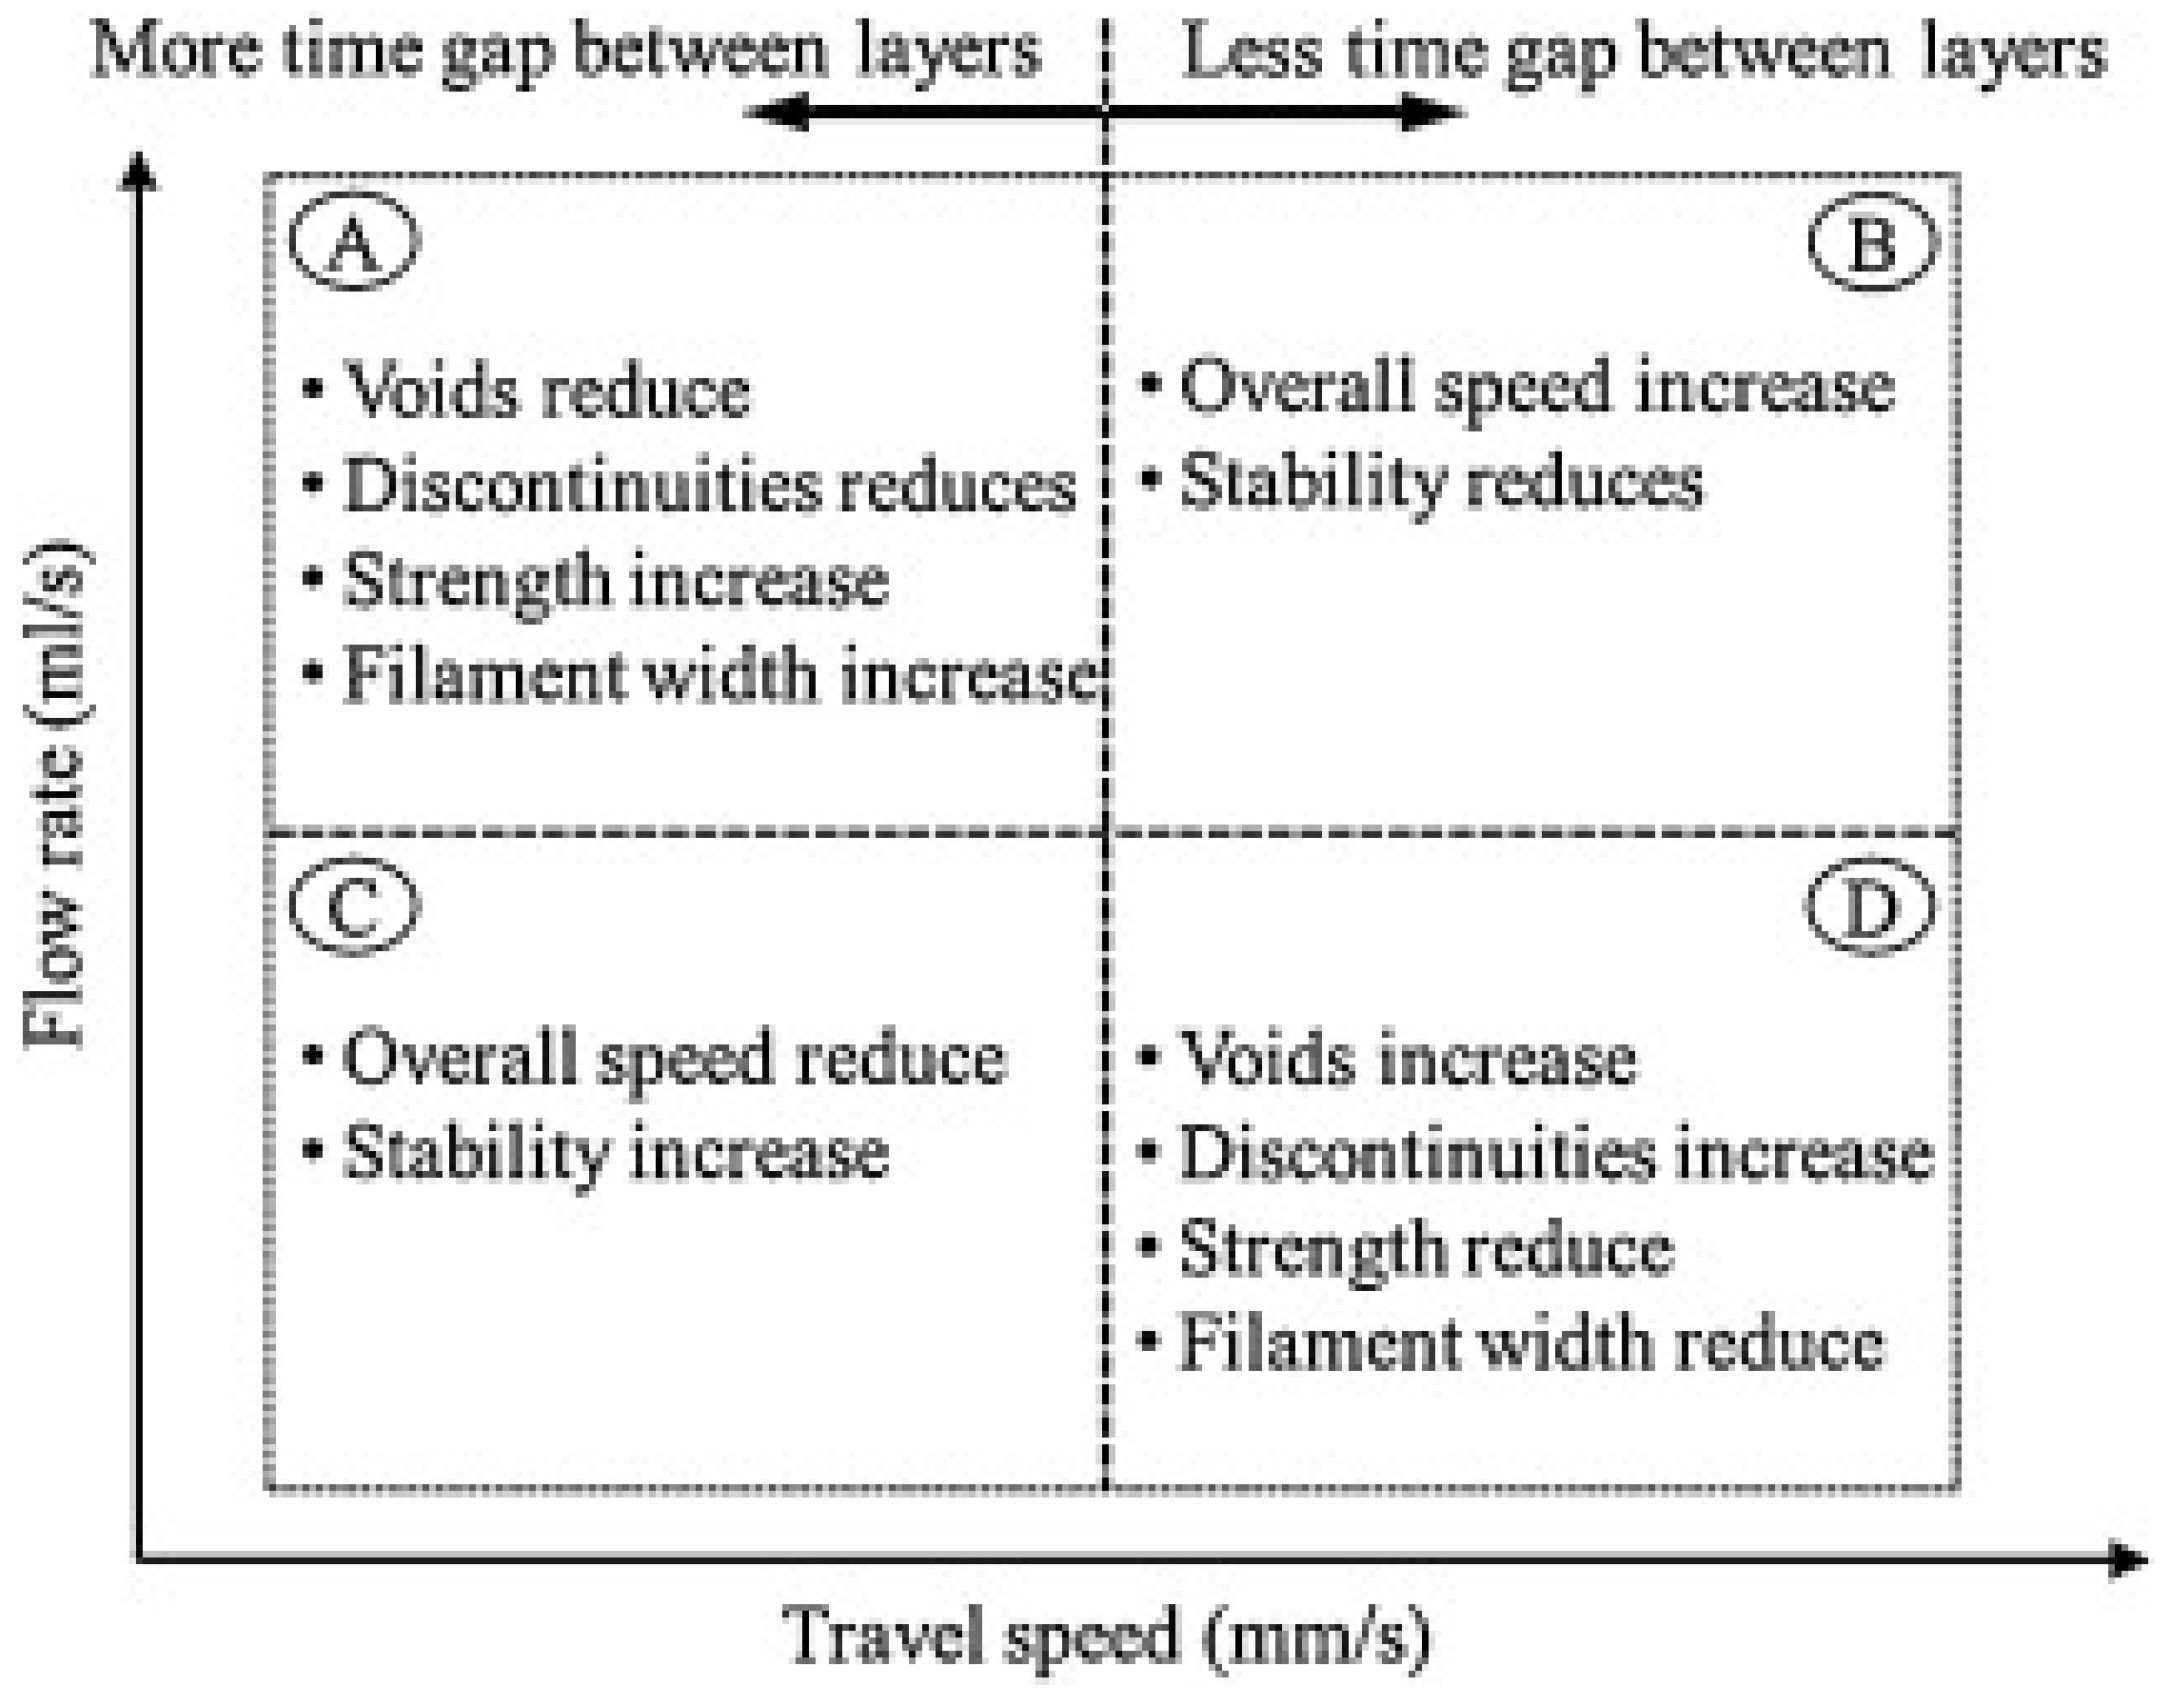
2.1.3. Yield Stress Evolution Rates and Deposition Speed

The uninterrupted vertically assembled manufacturing process of 3DPC determines that synchronic curing methods pose a challenge in mitigating poor interlayer bond effects, as curing methods are typically implemented as a post-process procedure [40]. Panda et al. [41] determined that interlayer tensile bond is not dependent on the material hardening rate. Instead, the author’s experiment suggests that the tensile bond strength of the interlayers can be optimized by adjusting the printing parameters, such as nozzle travel speed. Tay et al. [42] also studied the interlayer bond strength and both authors noted that a decrease in printing time gap enhances the interlayer tensile strength, but also inversely affects the structural stability due to the increase in printing speed. Hence, Panda et al. suggested that there must be an optimal printing parameter for all concrete variants and 3D printing designs [41,43]. Figure 2 shows the qualitative observation of interlayer bond with varying printing speeds.
This section has established a correlation to the effects of poor interlayer bond strength between different research studies. We summarized the above effects into Table 2, based on a handful of research articles.

2.2. Buildability

2.2.1. Plastic Collapse and Elastic Buckling

Plastic collapse is caused by the weight load at the bottom-most layer exceeding the maximum yield strength of the printing material. Suiker et al. describe this phenomenon as accumulated vertical deformation, where the influence on the critical height of the wall was studied in various supported structures [13,14]. Ashrafi et al. [43] reveal that the deformation of the base layer is not only a result of the weight of the subsequent layers, but is also caused by the extrusion pressure (Figure 3). It was demonstrated in the experiment that layer deformation can be reduced by extending the printing time gap between layers and the number of base layers used to reduce filament deformation. The author’s methodology also aligns with the observations made by Panda et al. [41] and Tay et al. [42], that machine parameters should be controlled to optimize the time gap between layers.
Elastic failure is an out-of-plane deflection failure mode that occurs before the maximum yield strength is reached. As opposed to plastic collapse, this phenomenon may also be caused by environmental or machine parameters. Suiker et al. describe this as lateral deformation, concluding that the filament width and the material curing rate have a significant influence on elastic buckling, with insignificant results from poor layer-wise deposition. The author’s further work also validates the model with accelerators [13,14]. Nguyen-Van et al. also concluded that wider filament widths and lower printing speeds improve buildability and constructability [69]. Studies related to filament widths and printing speeds have been conducted by many researchers, where process control parameters indicate some degree of influence in this failure mode [6,70,71]. However, the extent of the parametric influence appears to be confounded between the two failure modes among these studies, the outcome of which leads to a convoluted discussion in research, with the use of terms such as “collapse”, “deformation” or “shape stability” as a generalized encapsulation of both failure modes [41,69,71]. The need to isolate (or combine) and study the two effects will be further revealed in the next chapter as a thin wall process control solution.

2.2.2. Rapid Setting

Rapid setting binders can be used in concrete slurry to increase yield strength for the prevention of plastic collapse and elastic buckling. However, activators increase the initial yield strength in the mixing process, reducing pumpability and risking material build up in the printer. Set-on-demand has since been a method to perform activation near the nozzle end. This includes the modification of process parameters that moderates the feed rate of the accelerator [72]. It should be noted that this is a relatively new method to enhance buildability, with only limited research, pursued by Muthukrishnan et al. [72,73,74].

2.2.3. Reinforcements

Integration of reinforcements remains one of the central challenges in concrete 3D printing. Reinforcement methods are mainly used to enhance tensile strength and ductility. For C3DP, the method includes the use of bars, meshes, fibers or cables that can be incorporated, usually in one of three printing process stages (pre-process (mixing), in-process (printing), and post-process (cured/pre-wired) stages).
  • Pre-process
A significant amount of research has been focused on adding synthetic fiber reinforcements to the concrete matrix. Addition of steel [75], polymer [76,77,78,79], glass [79,80,81,82], and plant-based fibers [83,84,85,86] has been explored over the years. Incorporating different fiber types has been a long-standing research topic in pursuit of Ultra High-Performance Concrete (UHPC). Chun et al. [83] assessed different fibers in concrete paste and uncovered different performances between a few notable fiber types; (1) Structural performance of fiber-reinforced concrete is still subject to the printability, nozzle travel speed, and printing direction of the process, (2) inorganic fibers, in comparison to organic fibers, tend to deter adhesion in the geopolymer matrix. Stiff materials, such as steel fibers, prevent complete adhesion to the interlayer bond strength due to increased porosity. For short fiber reinforcement methods, there is an overall improvement in ductility and tensile strength within the concrete filament but little to no improvement in the interlayer region [87,88,89,90]. Apart from the abovementioned reinforcements, research on other unique fiber configurations, such as thermoplastic composites and recyclable materials, are also being explored as a prospective expansion of UHPC materials for 3D printing [91,92,93,94,95].
  • In-process
Extrusion of cementitious material fed with steel cables at the center of the extruded filament is a relatively common approach, despite scarcity in this area of research [96]. Pull-out tests and four-point bending tests were conducted by Bos et al. [97] to observe performance difference in different wire types. Bos observed an increase in ductility and post-crack resistance. However, cable slips were noted as a phenomenon, with smooth cables embedding inducing poor bond strength between the materials. Li et al. [96] agree that the inclusion of a metal cable exhibited a ductile failure mode during four-point bending tests. However, the authors also noted that cable reinforcements showed weaker interlayer bonding strength as compared to that without reinforcements, due to reduced contact area at the interlayer. Hojati et al. [98] attempted to mitigate cable slips via barbed-wire reinforcements. The inclusion of barbs alleviated cable slips but introduced a larger scale presence of voids surrounding the barbed protrusions. Hojati also highlighted that further investigation of barb frequency, cable types, and varying barb configuration is needed to optimize these findings. Xiao et al. [99] also explored the perpendicular insertion of steel cables to decrease the flexural anisotropy of concrete printed structures and noted a 10 times improvement in flexural capacity.
Alternatively, other methods of in-process installation include bolting of metal brackets in layered intervals within concrete filaments, developed by Simon and Sungwoo [100], and U-nail insertion into several layers of concrete filament to reduce the effects of poor interlayer bond, carried out by Wang et al. [101]. Both methods showed improved tensile strength in the steel reinforcement support. While these options offer promising methods for tensile strength improvement from a material study standpoint, scaling to a structural reinforcement system proves to be a challenge.
  • Post-process
The definition of post-process printing in this section is defined by prior work done to the structure before addition of concrete or wires. There are currently two approaches to this process. (1) Mesh wires, cables, or bars are fitted into a completed 3D printed concrete structure, (2) Concrete is extruded around a pre-installed configuration of wires, cables, or bars.
(1)
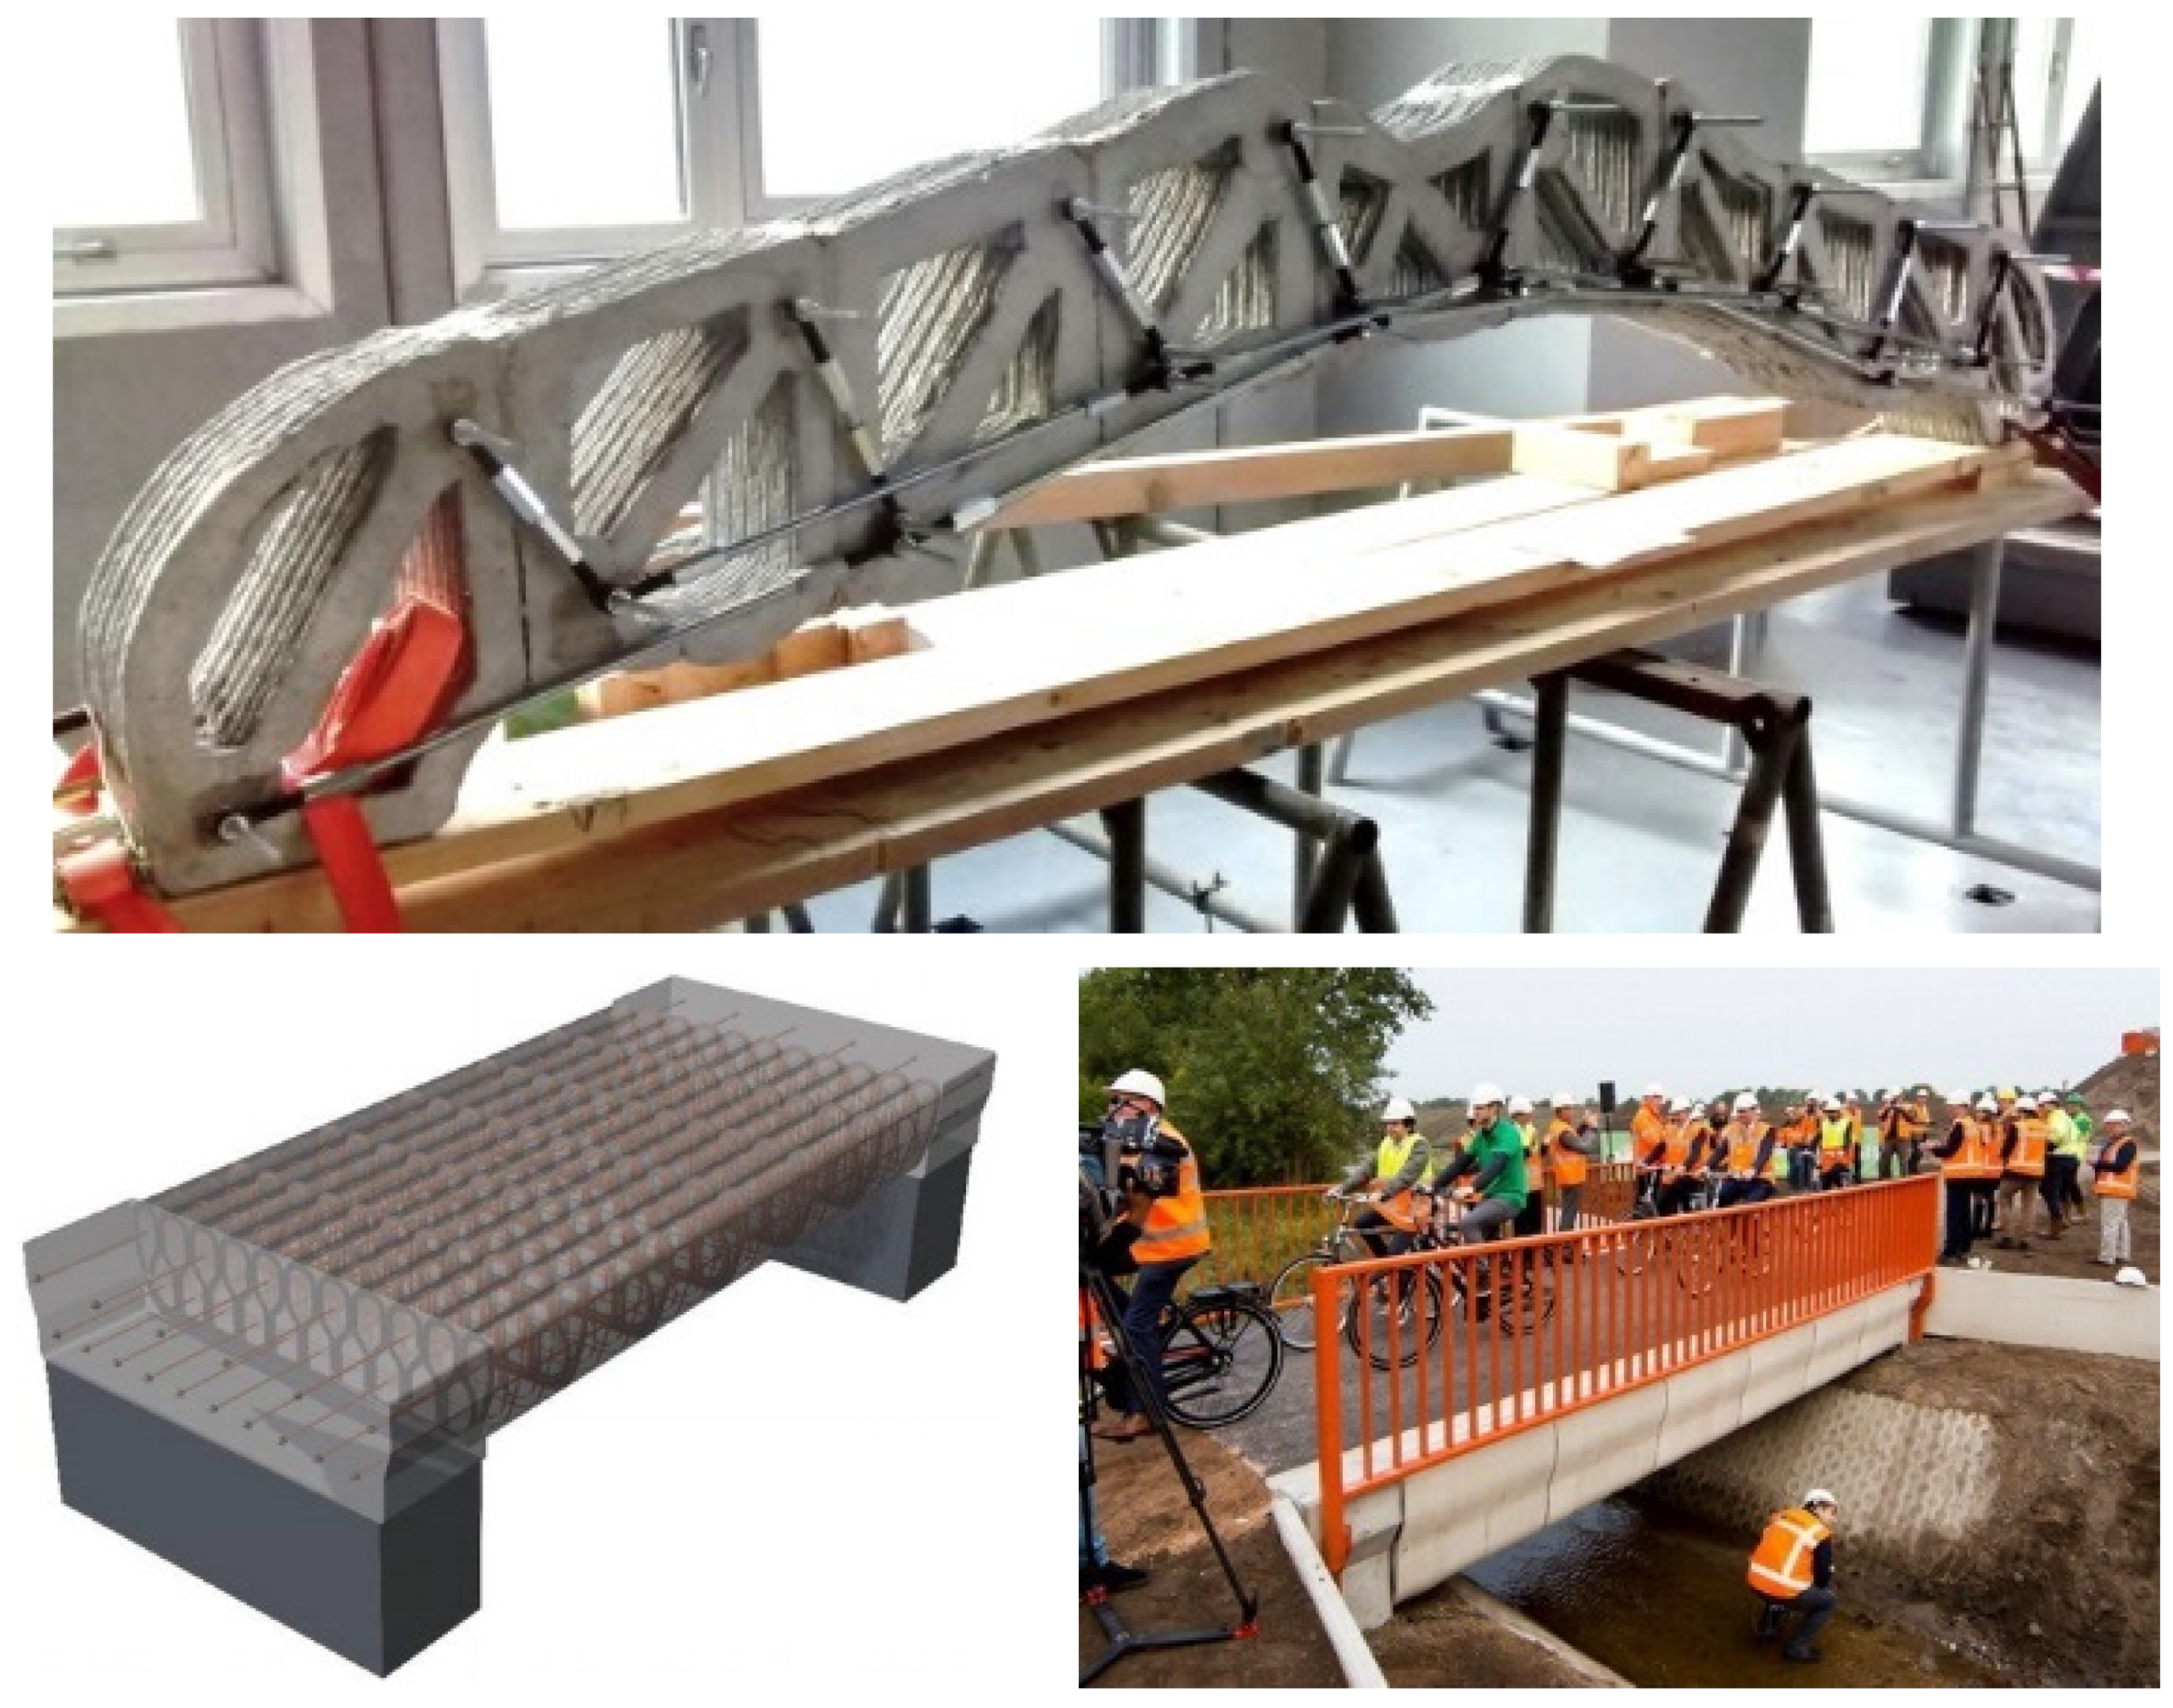
Asprone et al. [102] developed an external anchor connection design approach to install an out-of-plane reinforcement system in a 3D printed structure. Local fractures arise from shear forces between segments and steel–concrete anchors. Salet et al. [103] conceptualized post-tensioning reinforcements in which concrete structures are built with design considerations to sandwich C3DP slabs as an assembly, where the middle slab design allows cable passthrough. These parts are then pressed together by post-tensioned prestressing tendons. The method showed much promise, as the prototype passed all structural regulations in assembly trials (Figure 4).
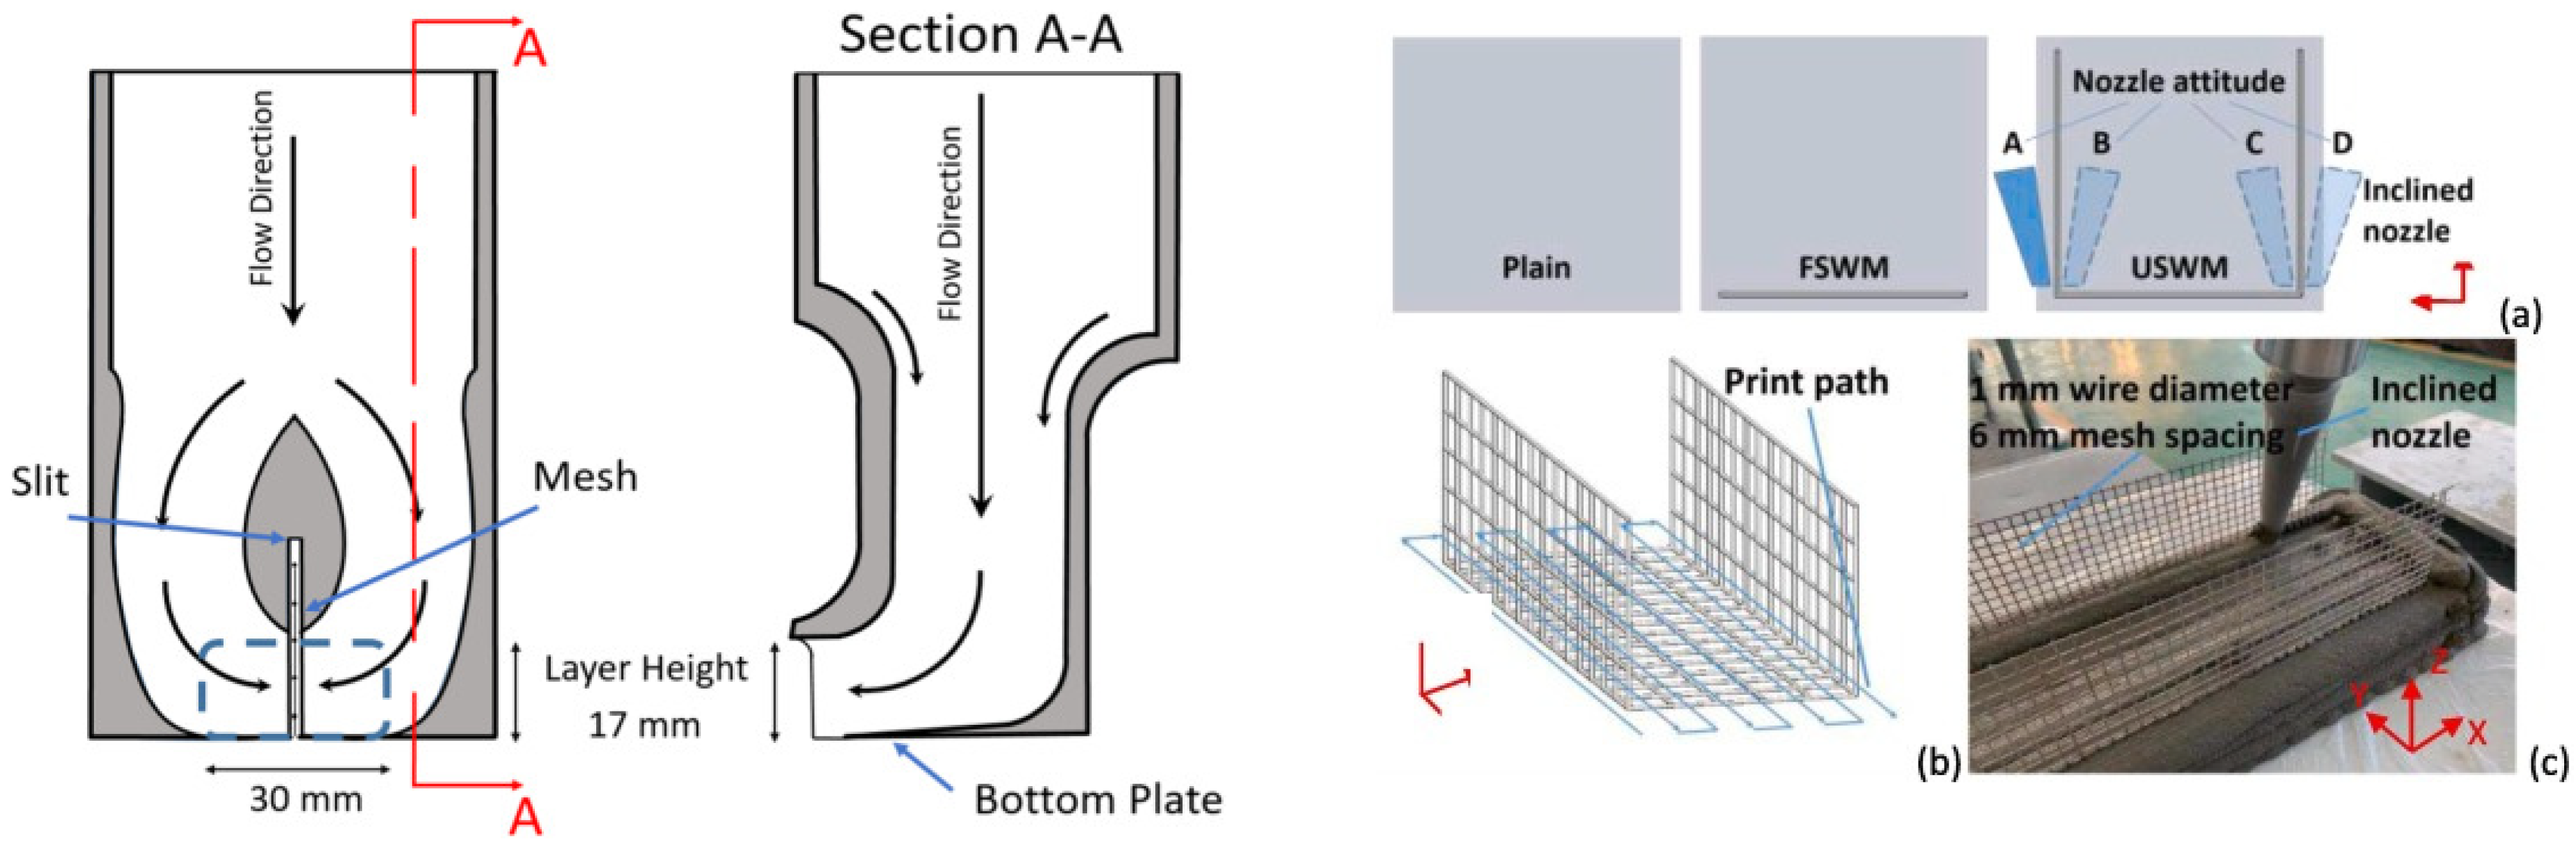
(2)
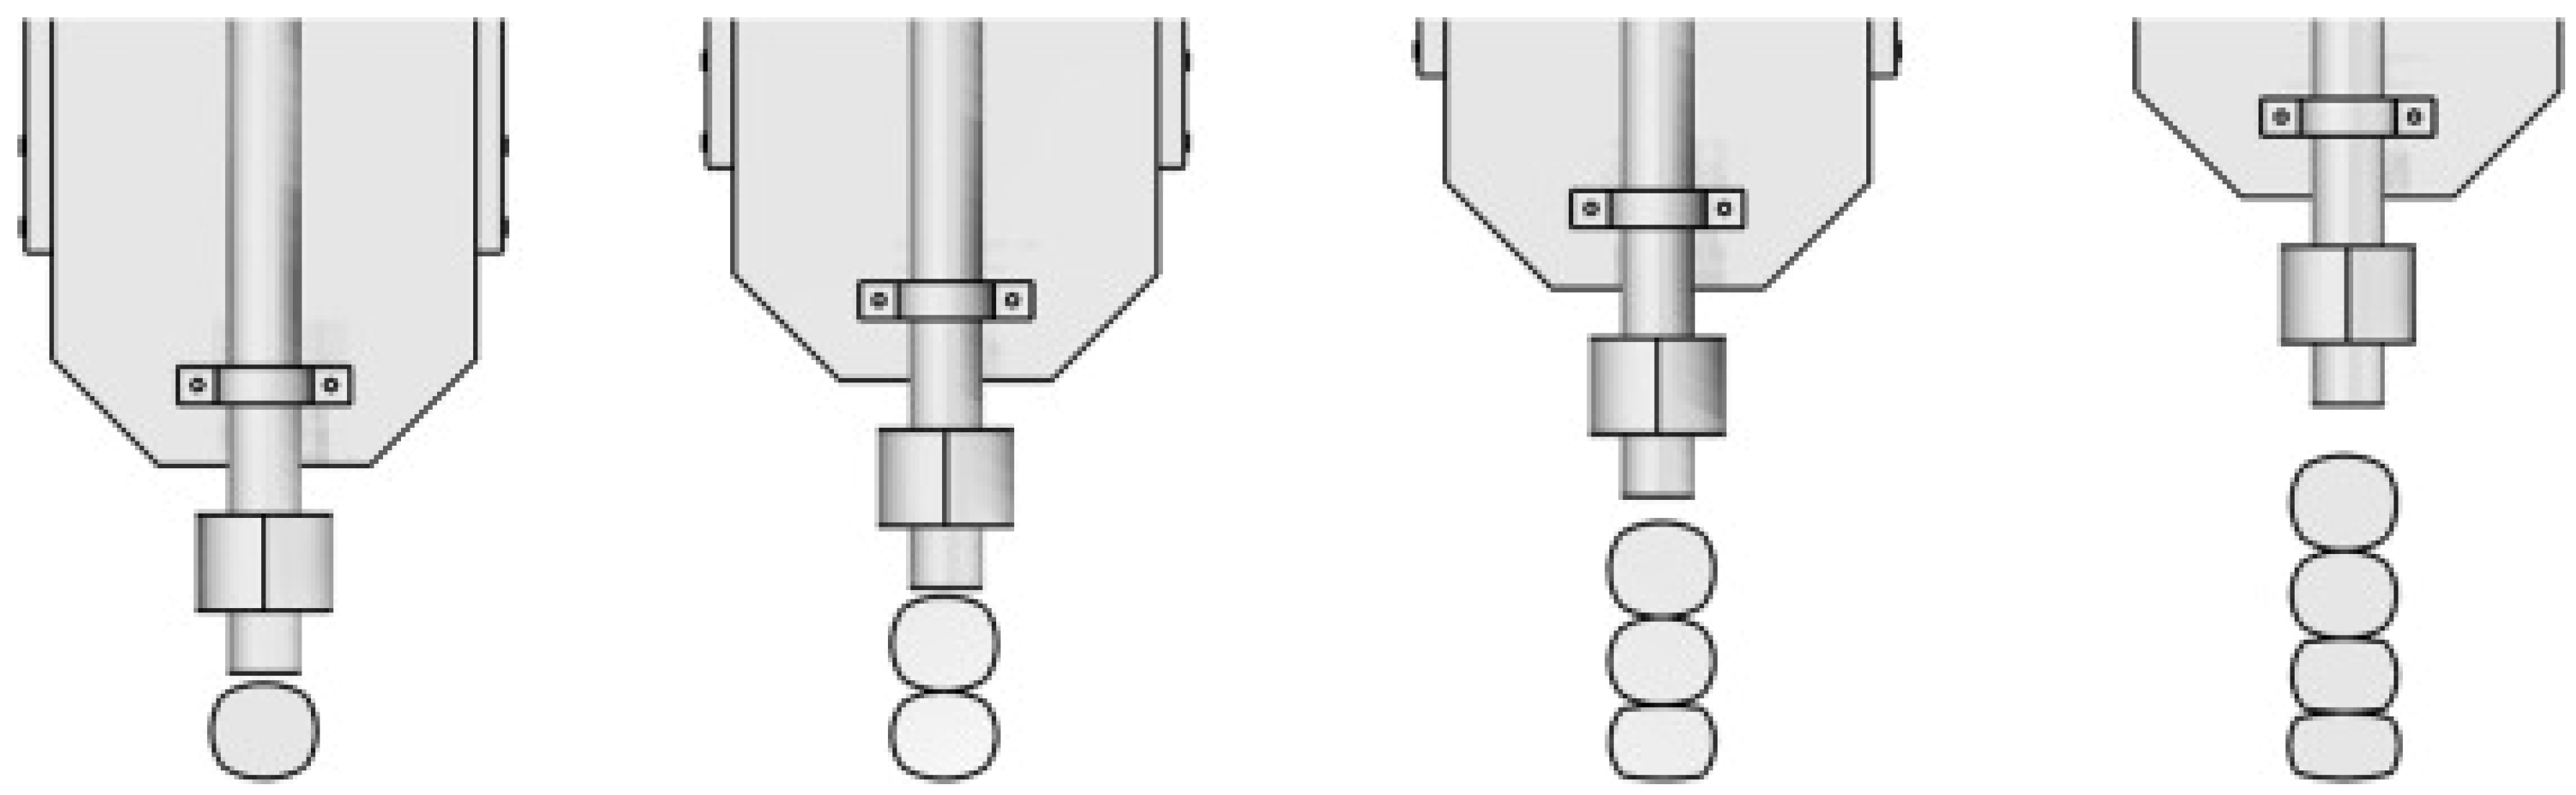
For a pre-configured wire mesh approach (Figure 5), Marchment et al. [104] introduced a nozzle design that enables printing about the mesh. Liu et al. [105] later developed a U-shaped wire mesh (USWM) configuration, where concrete is extruded at an inclined angle around the mesh wire. This configuration showed significant improvement in tensile strength. Table 3 shows the parameters involved in buildability.

2.3. Extrudability

Extrudability in C3DP is defined as the process of transporting material through the feedpipe and the print head. Good extrudability is defined as the ability to extrude filaments consistently. Nozzle blockage, filament tearing, and filament buckling can occur from poor process control and mixture composition. However, as cementitious material hardens with time, pumpability can be used to manage the printability of the material [107]. These factors were studied by Liu et al. and it was observed that a change in flow rate over time can improve the overall print and structural quality [108]. Furthermore, Tay et al. noted that pump flow rate and nozzle travel speed have similar significance in quality control for 3DCP [109,110]. Figure 6 shows the relationship between pump flow rate and nozzle travel speed in quality control.
Khalil et al. concluded that a diameter ratio, or the nozzle geometry, of Dnozzle/Dparticle should be larger than 4 for continuous flow to occur [111,112,113]. Multiple evidence also suggests that constituents of concrete, such as admixtures, water, binders, and cement, directly affect its flowability, stability and self-levelling. These factors have been associated with aggregate size, yield stress, plastic viscosity and open time [107,111,112,113,114]. Malaeb et al. [10] identified that good flowability can be optimized by reducing sand and increasing cement. Hence, both material and process parameters are attributed to the effects of poor extrudability [115]. These effects are amplified along sharp corners in the C3DP process when extrusion rate remains inconsistent within the nozzle geometry. A difference in curvature exists between the inner and outer radii of the filament, where the inner and outer radiuses exhibit overflow and underflow effects, respectively, if a corner rotation is sharp. Liu et al. determined that rheological properties have little significance in this occurrence, which is associated with the corner radius, nozzle travel speed, and nozzle geometry [116,117,118]. Large-scale implementation has also been shown to cause accelerated hardening due to friction caused by prolonged pumping, causing reduced workability, potentially causing clogs in the extruder, and quickening the effects of filament tearing and buckling [118].
Researchers conduct extrudability tests to assess the printability of a setup. It is still a common practice to conduct extrudability tests via visual inspection of single layer extrudate of a fixed length for any filament tearing or buckling in the sample [20,119]. Recent work conducted by Ting et al. attempts to leverage the manual inspection method with an instance segmentation model by quantifying surface defects with real-time in-situ monitoring [93]. It is relatively clear that filament tearing and bucking are qualitatively distinguished, time-dependent parameters that lead to nozzle blockage with material influence, and can be controlled by process parameters. Table 4 lists all parameters listed in this section.

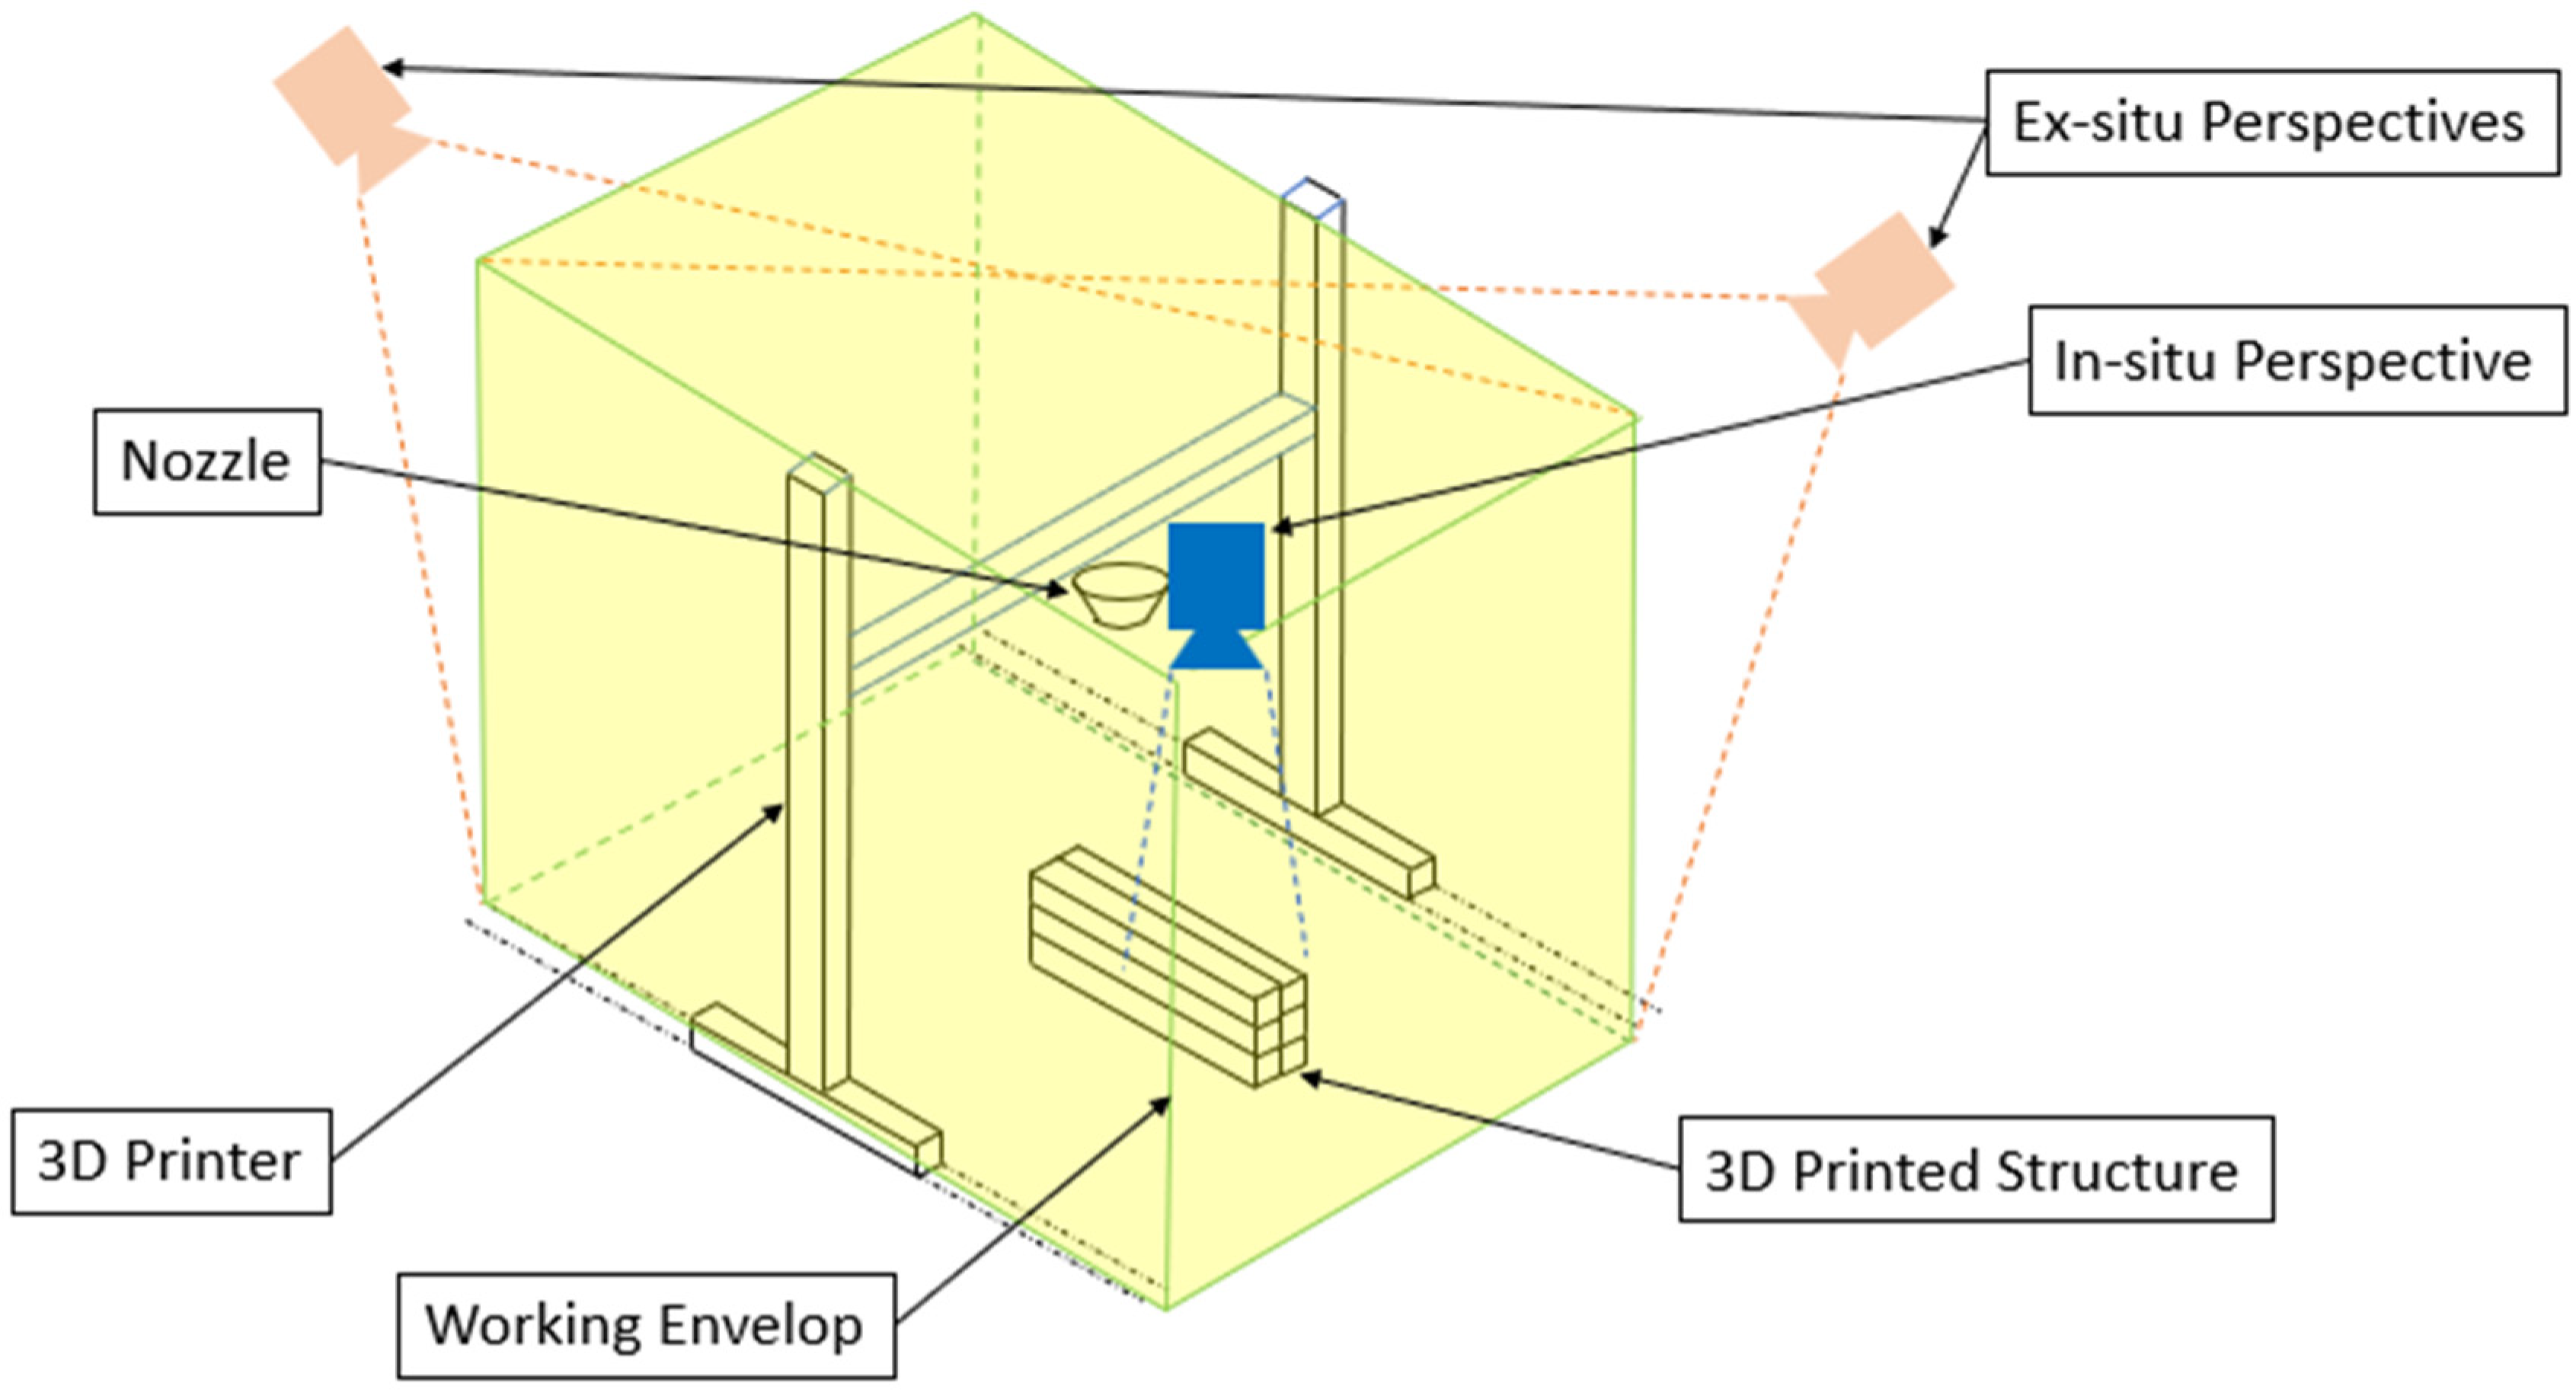
3. Process Monitoring for Fault Detection

The chapter above provided a summary of the current challenges in C3DP and discussed the parameters involved. Each challenge presented above has an established significance for process parameters. As cementitious material exhibits unpredictable mechanisms in the printing process, feedback systems make sense for process parametric adjustments in C3DP in place of manual observations and interventions [18,42,135,136,137]. However, from a process control standpoint, managing process parameters in a C3DP application for a closed loop feedback is challenging due to the required interdisciplinary understanding of material behaviour, computer vision, and fault diagnosis. Consequentially, feedback systems investigation in C3DP research is relatively uncommon compared to other branches of research. Generally, the process flow for a feedback system is listed as follows: Data Acquisition, Pre-Processing, Feature Extraction, Classification, and Diagnosis at a desired interval [138,139,140]. Several methods can be used as classification tools (this will be discussed in a later section). Depending on the classification methods used, pre-processing and feature extraction steps will typically be adjusted accordingly. This chapter attempts to breakdown the requirements needed in process monitoring for fault diagnosis (refer to Figure 7).

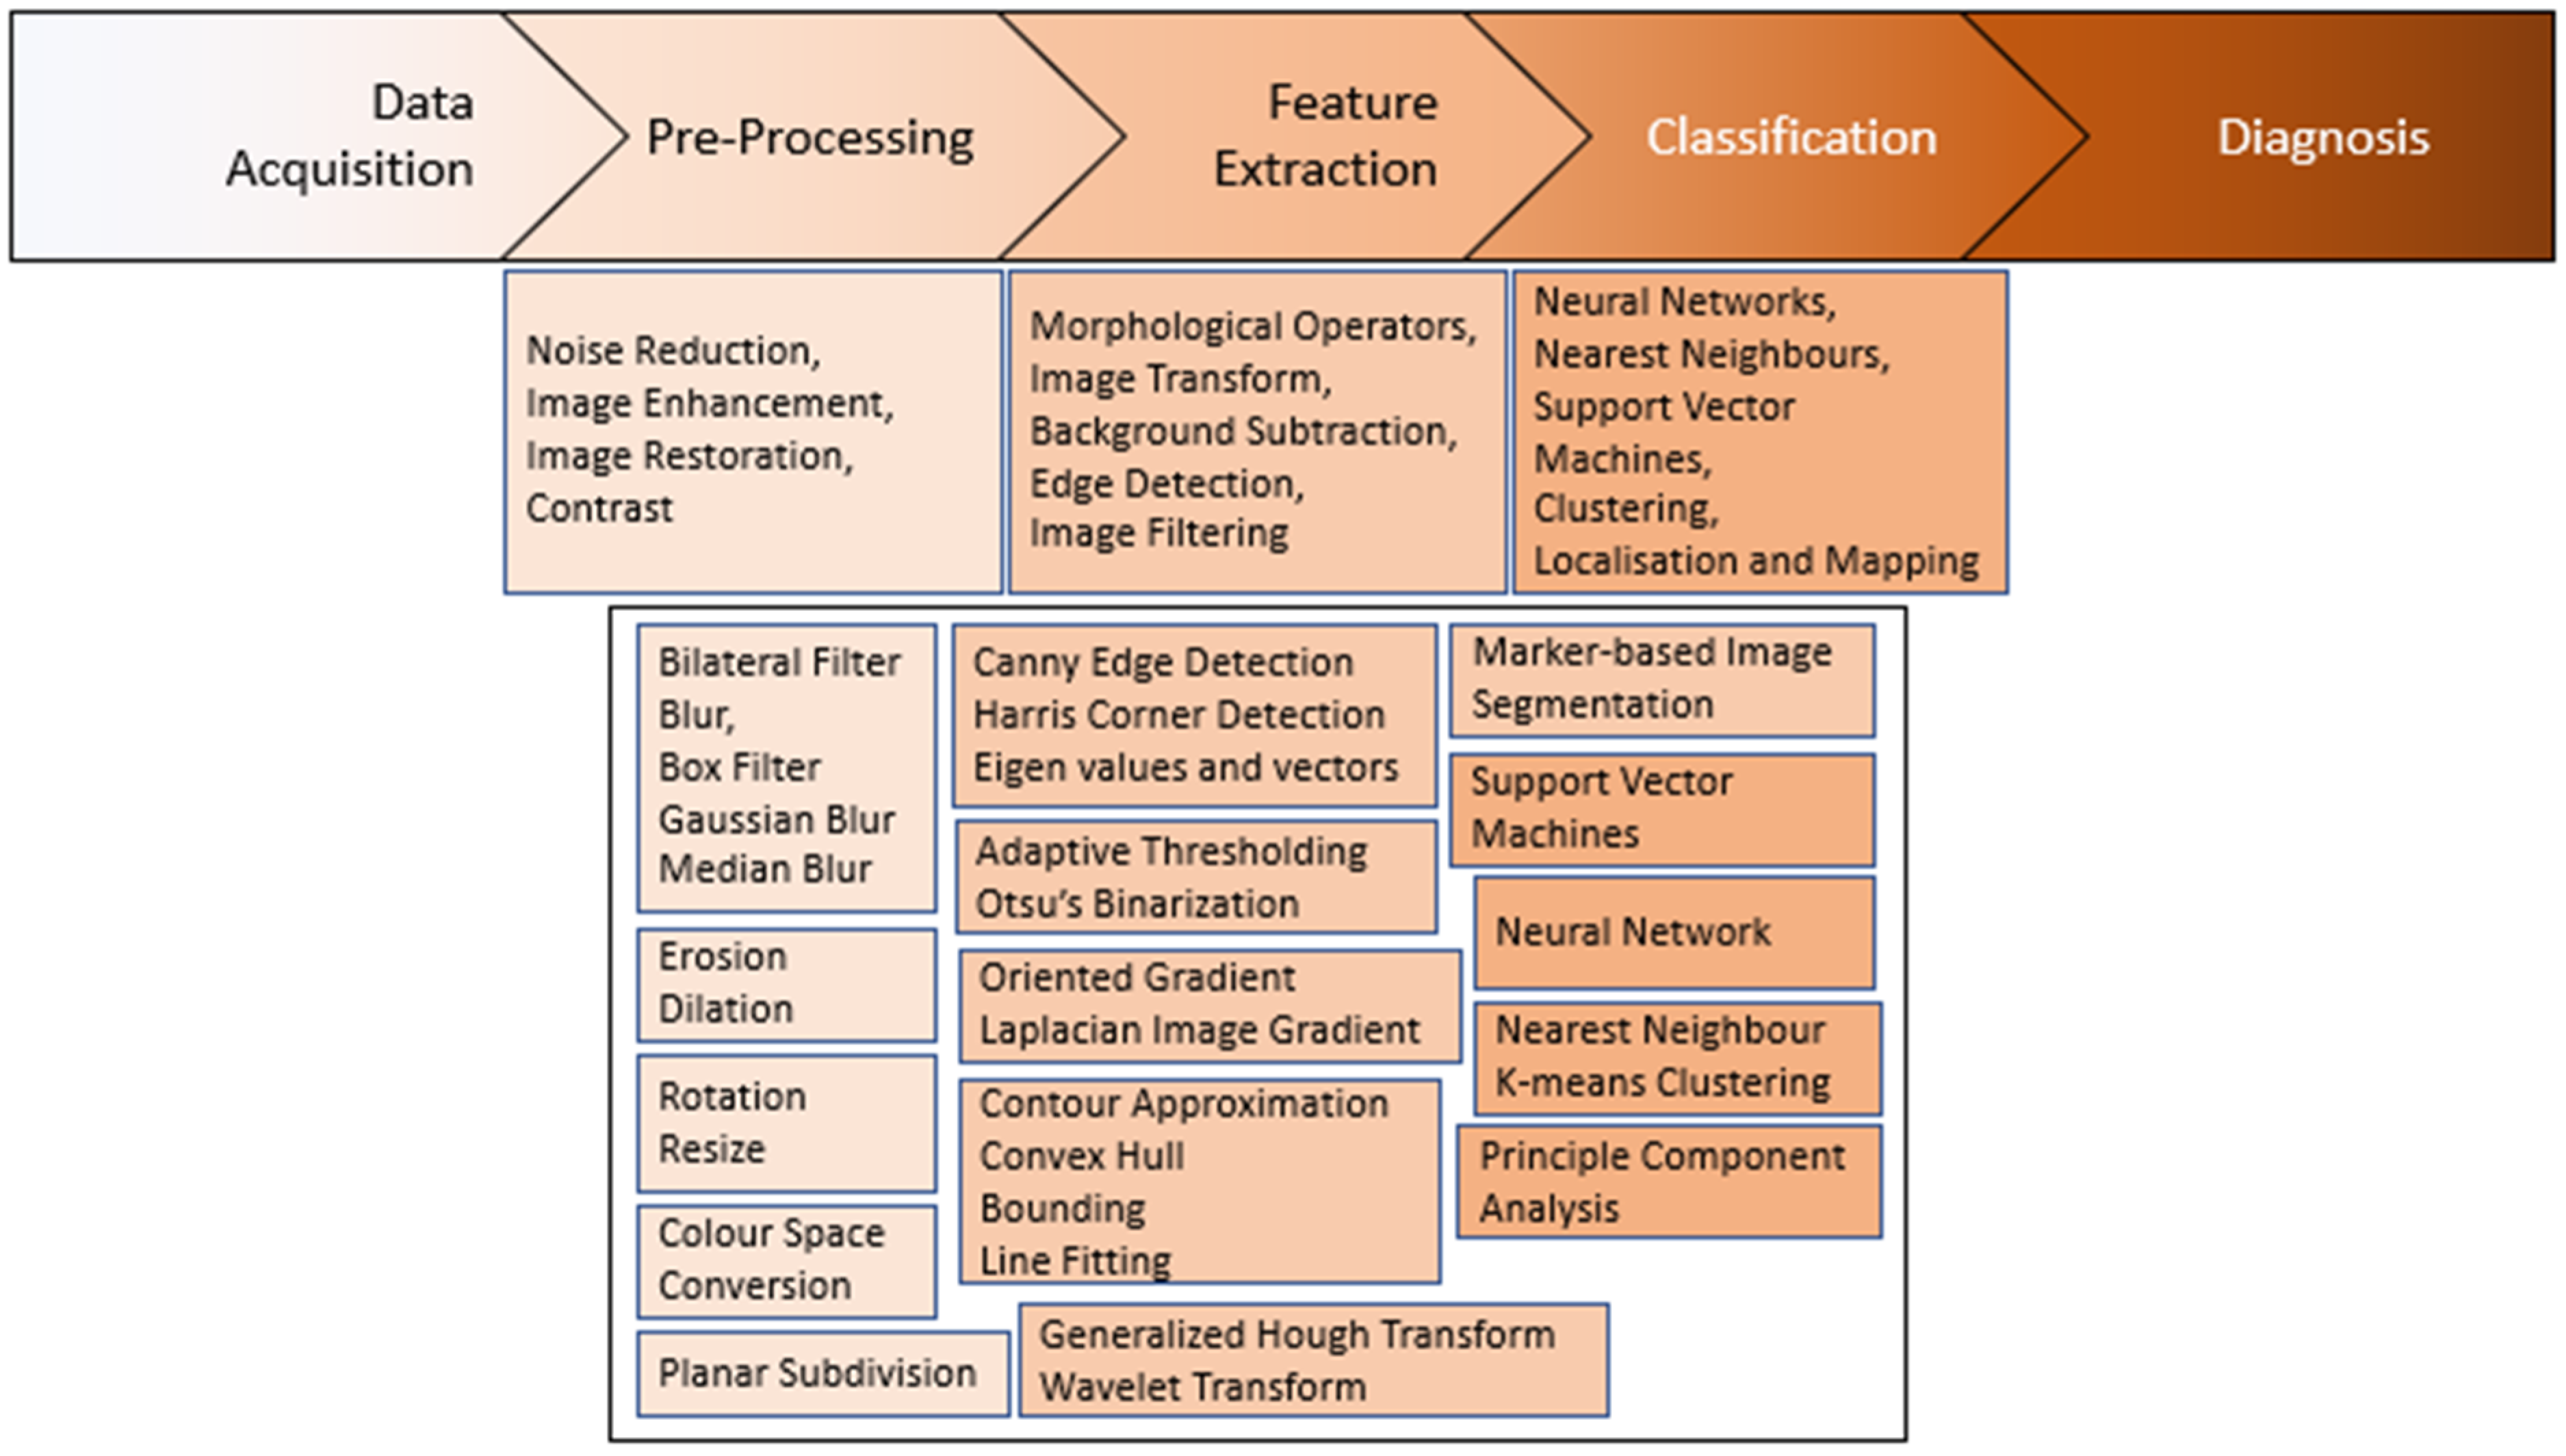
3.1. Data Acquisition

Feedback systems in C3DP require an input data stream. These data inputs can be obtained with various arrays in one-dimensional to three-dimensional streams of data, often acquired in the form of an image with color spaces, such as HSI [142], HSV [143], Binary [144,145], Greyscale [18] and RGB [146]. Data obtained can then be interpreted for monitoring applications, such as safety monitoring [147], Building Information Modelling (BIM) [148], Structural Health Monitoring (SHM), and process monitoring [149]. A camera layout is typically installed, based on in-situ or ex-situ configurations, and depends greatly on the attention to detail needed for the operation. In this paper, in-situ and ex-situ monitoring systems will be defined as the measurement or camera sensor planted inside and outside the work envelop of the 3D printer, respectively (refer to Figure 8).
Concrete 3D printed structures are generally large, thus varying environmental conditions, such as indoor or outdoor C3DP, can considerably affect sensor inputs. Noise, such as ambient light, temperature, and weather conditions, can easily impact the accuracy of the data acquired and the general outcome of the resulting diagnosis. Apart from a clear line of sight for the sensor, factors such as object cleanliness, reflectivity of the object, and occlusions in scanning path should also be considered. Depending on the sensor used, the calibration process, including lens distortion, bundled adjustment, and unit scaling for instance, must be regarded [150,151,152]. The visual cues for geometrical capture are dependent on lens/sensor perspective, object occlusion, and shading. In other words, computer vision tools are strongly affected by perspective and illumination strategies [153]. Refer to Figure 9 for examples of illustration strategies.
Further categorization can also be achieved by monitoring the print through in-process and post-process methods for process control [18,135,136,137,154,155,156]. The following research consists of monitoring techniques that have been. or will be, used in feedback for process monitoring. These publications indicate the progress made towards autonomy in C3DP. As of now, implementation has been largely discussed as future work and these solutions have not been fully realized, as the experimentation has been conducted in a fully controlled environment. The extent of the effectiveness of computer vision feedback control has not been thoroughly established, but has been successful in detection in most cases. It can be understood that post-process feedback applications are not thoroughly explored due to the scarcity of environmental input for long-term assessment in C3DP structures at the current time. Refer to Table 5 for examples of monitoring architectures with computer vision implementation.

3.2. Pre-Processing and Feature Extraction

Pre-processing and feature extraction in computer vision applications are necessary steps to clean up and enhance acquired data in the C3DP workspace. Raw image data obtained directly from a camera sensor may face a variety of obstacles that could hinder the classification result. Pre-processing methods are commonly used in vision-based process systems to mitigate such errors early in the process [144,162,163,164,165,166,167,168]. In this paper’s definition, pre-processing methods can be redefined into two groups: corrections are required to change the artifacts in the image prior to feature extraction, enhancements are utilized to augment key features for ease of classification in later steps.
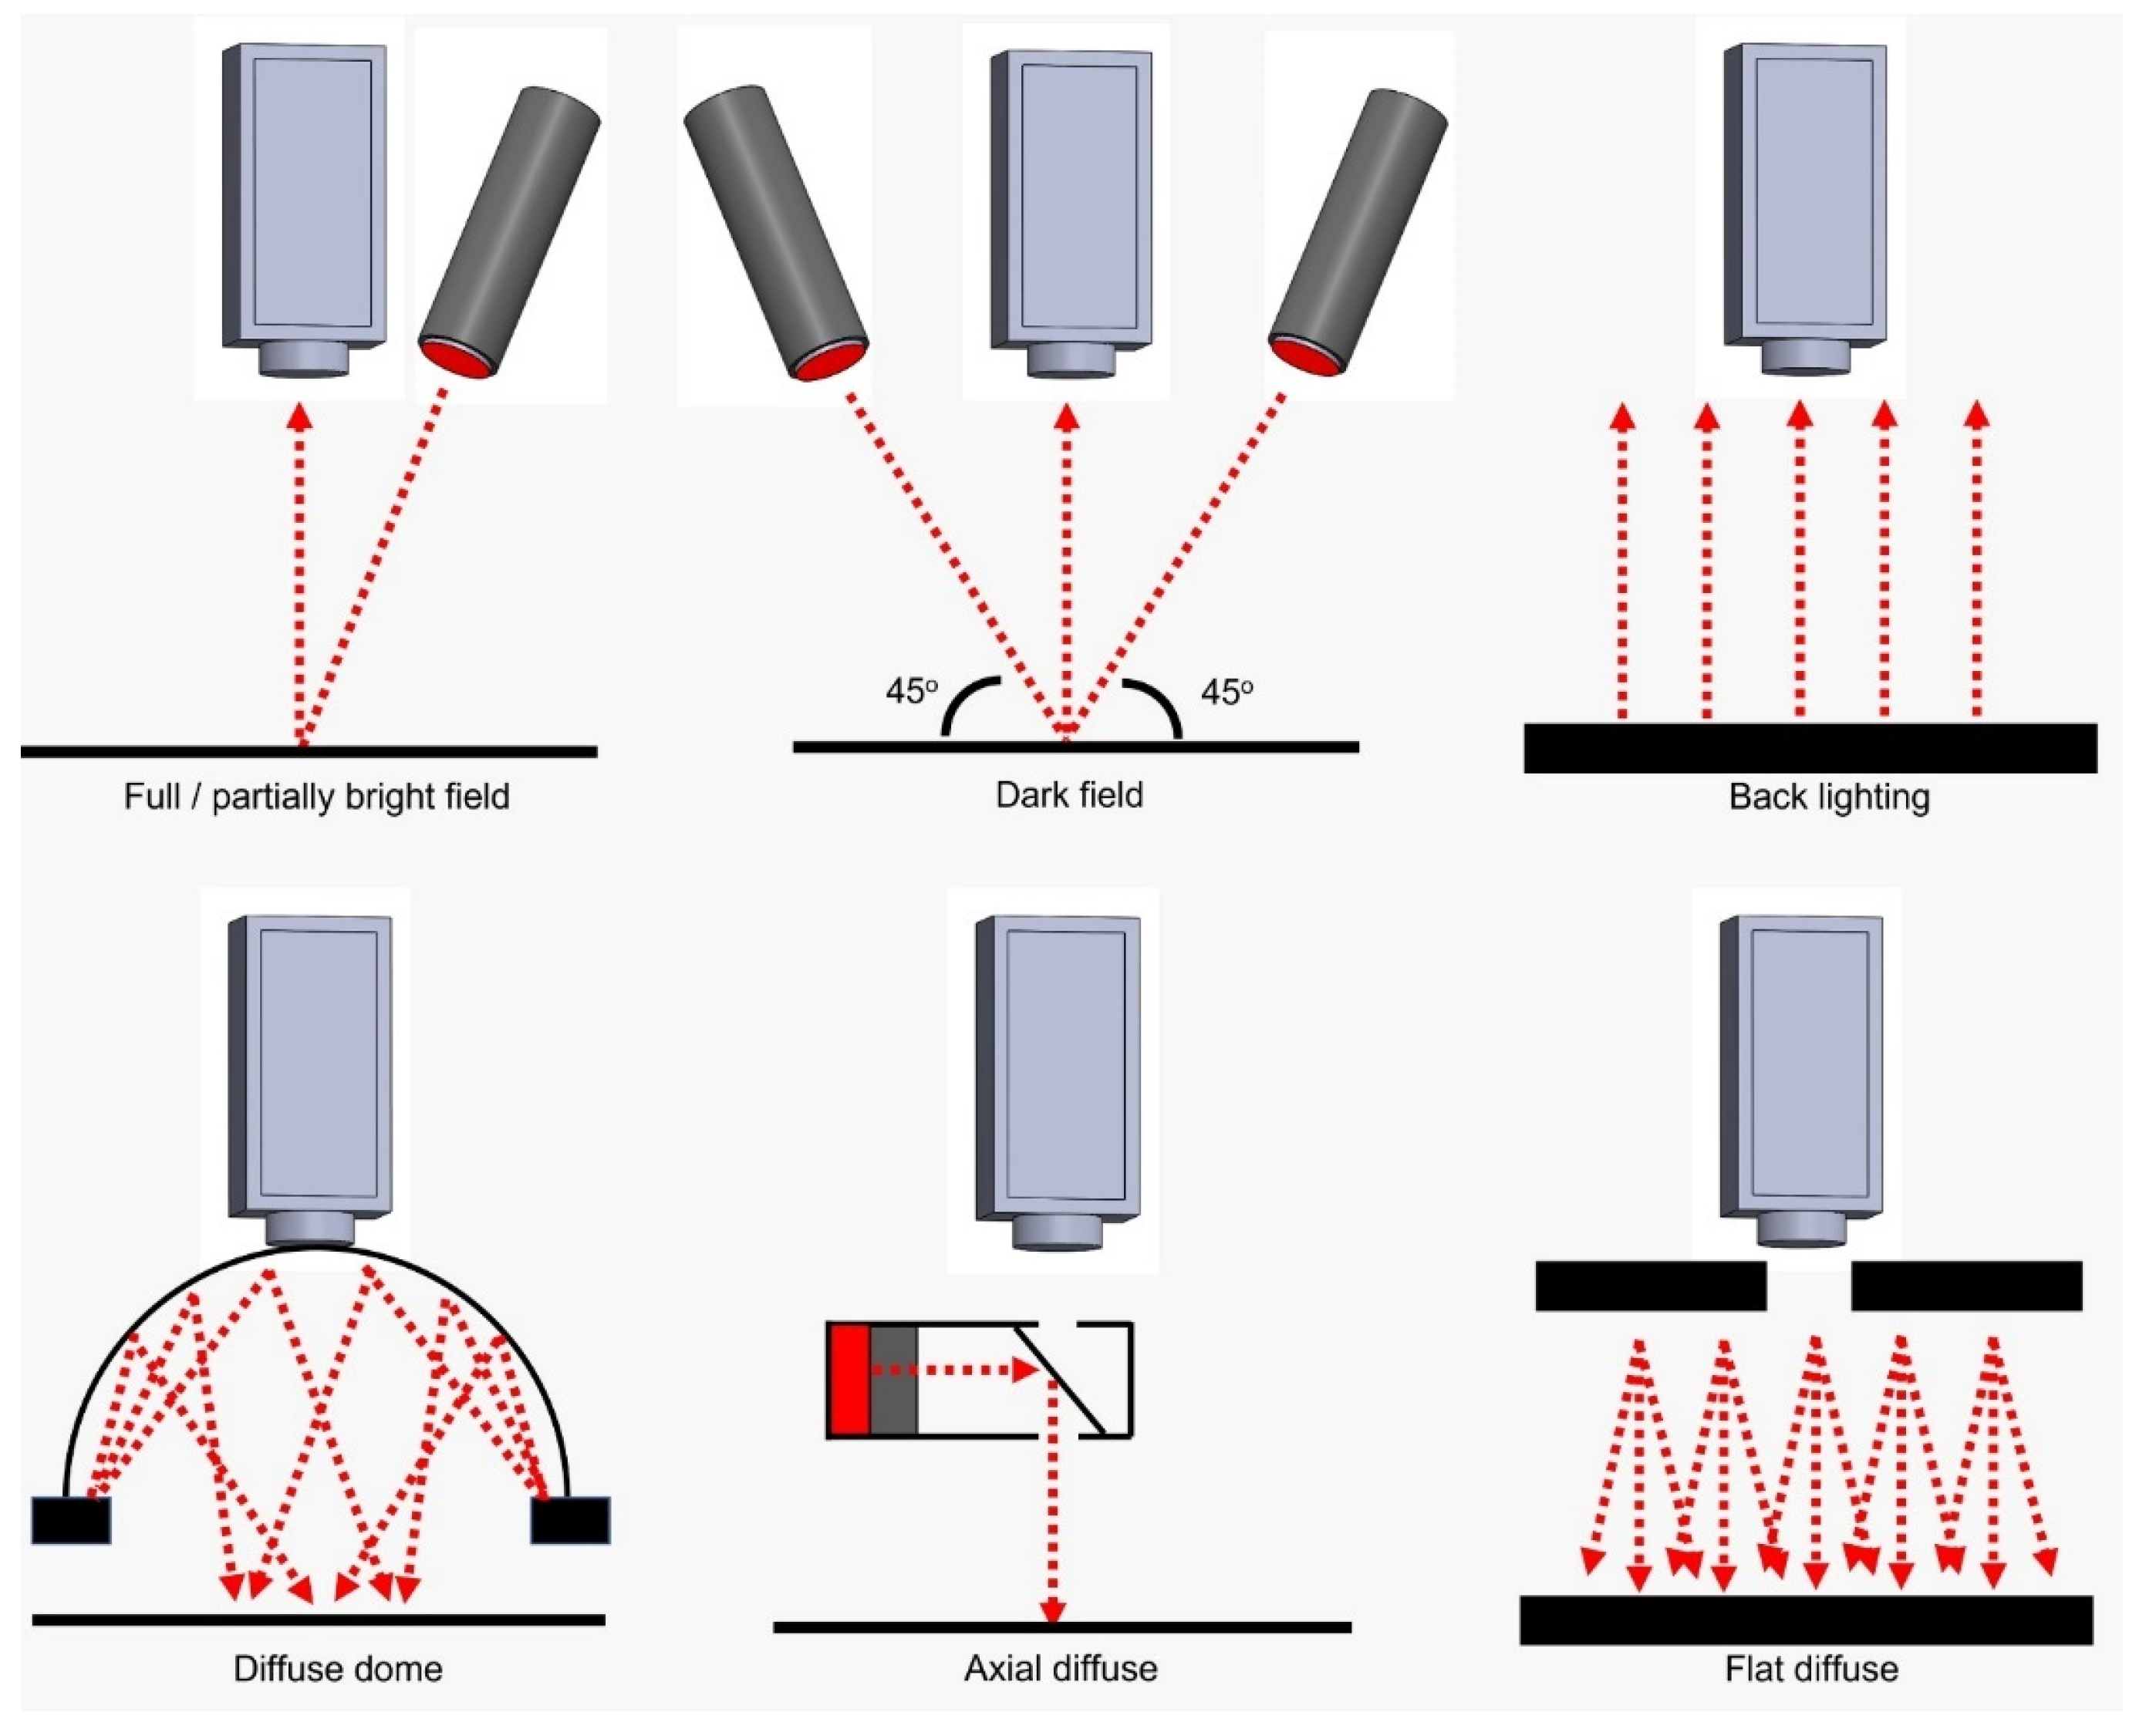
  • Corrections: Sensor Corrections, Lighting Corrections, Noise, Geometric Corrections, Color Corrections.
  • Enhancements: Blur and Focus, Illumination, Thresholding. Edge Enhancement, Morphology, Segmentation, Region Processing, Color Space Conversions.
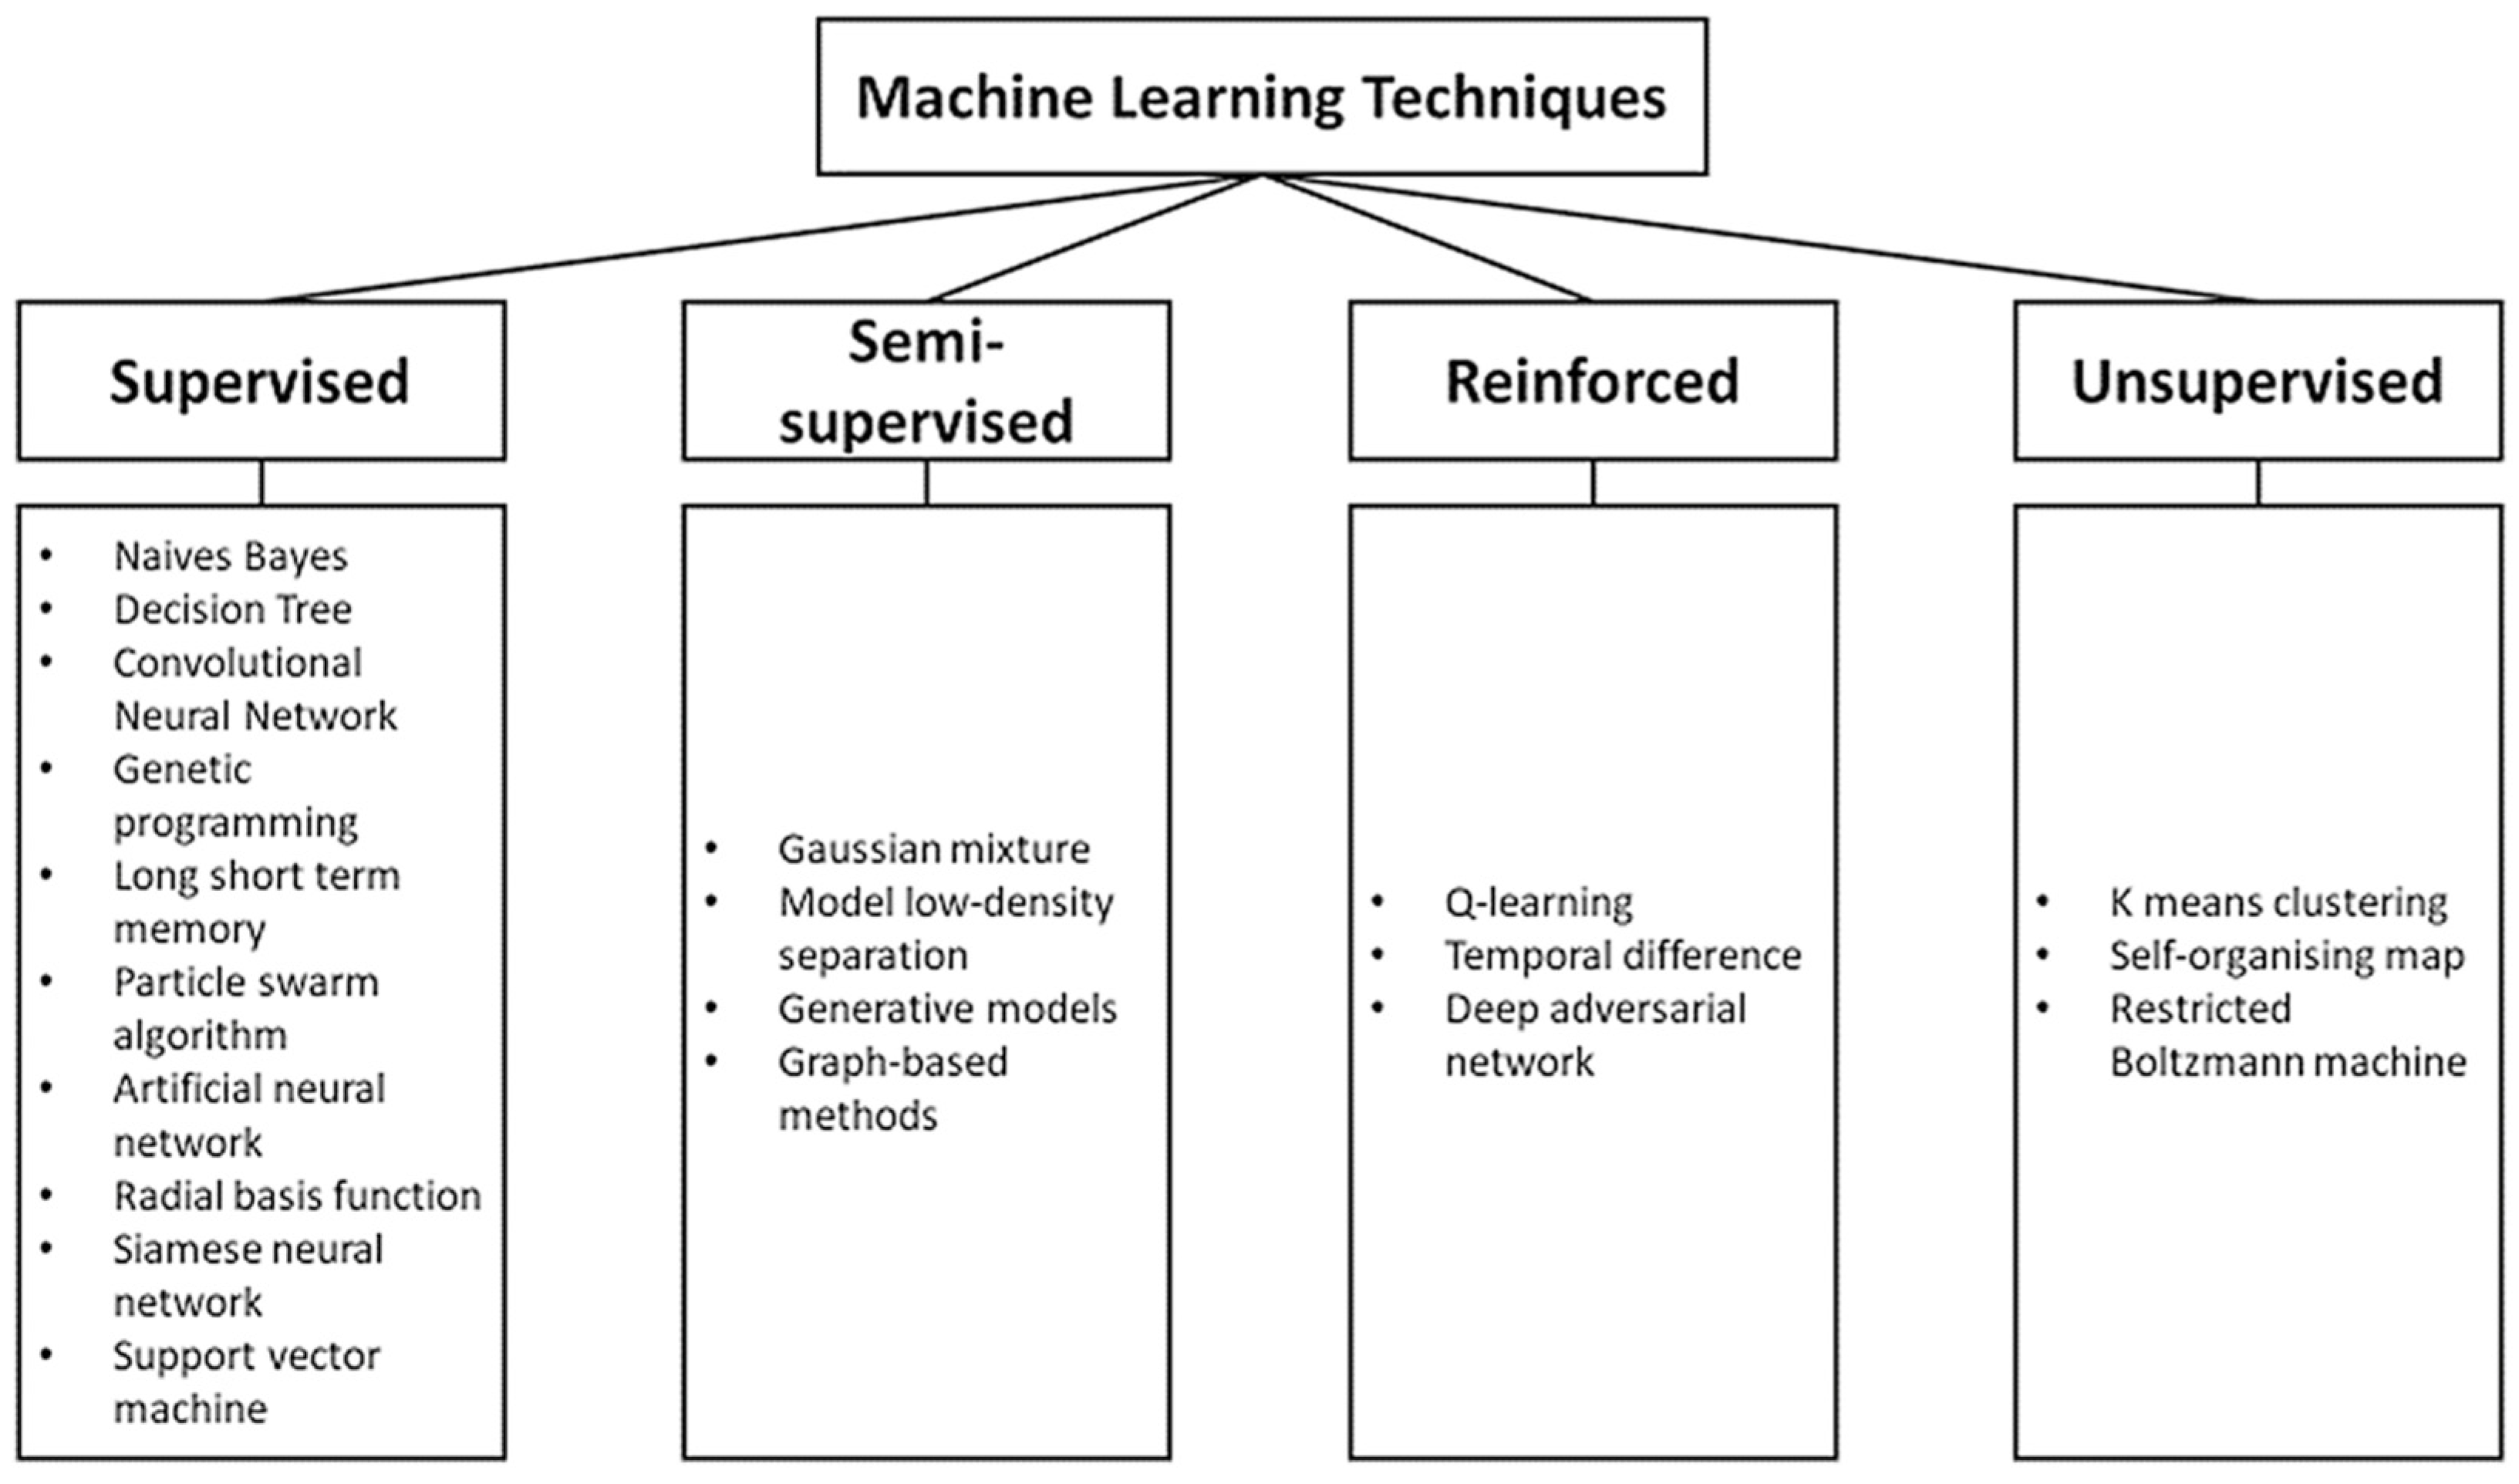
Despite the need for a robust illumination strategy as described earlier [169], features of interest in C3DP may still be suppressed by external factors, such as ambient light conditions and occlusions. The C3DP monitoring process flow would face difficulties replicating isolated environments, as seen in other disciplines such as metal additive manufacturing process monitoring [165,166,167,170,171]. Splatters, residuals, light, reflection, and shadow interferences can be observed on the substrate while printing. While it may not compromise the 3D printing process, it can cause a camera sensor’s erroneous reading that may lead to poor diagnosis (Refer to Figure 10). Hence, digital corrections are essential to minimize the negative effects of the environment and setup. Kazemian et al. [18] have noted this effect in a feedback control process. The authors noted stray detections of concrete filament due to obstructed lighting conditions, hence developing an approach to conduct frame drops to minimize the erroneous readings.
Enhancement, or feature extraction, methods such as morphological operators [142], image cropping, frame selection [18,136], filters, blurs, rotation, resizing, and color space conversion (refer to Figure 7), are some of the functions used to digitally enhance, modify, or amplify desired characteristics in a dataset, specific to any machine learning algorithms. Generally, supervised classification methods such as Deep Neural Networks require a model with numerous variations. Images are typically obtained and labelled manually, which are then fed into a training model. Pre-processing methods are used to expand the dataset variations in order to enhance the model, such as image augmentations for rotation, flipping, or contrast [145,146,172,173], whereas, in typical unsupervised machine learning techniques, pre-processing methods, such as binarization, image blurring, thresholding, contour extraction, and edge detection, are used to de-noise prior to classification [18,136,161]. Correction and enhancement methods can be interchangeably used for all classification methods and are not specific to a single use case. Davtalab et al. [146] utilized pre-processing methods for thresholding and binarization to provide a binary mask image as ground truth reference for a SegNet DNN model. This resulted in a post-process, in-situ monitoring method for observing deformities on the printed layers from a side profile (Figure 11).

3.3. Classification

Classification consists of categorization and labelling groups of pixels or variables within a dataset. These classification methods can be divided into four categories: Supervised, Semi-supervised, Reinforced, and Unsupervised systems, as shown in Figure 12 [174]. Supervised learning requires a training dataset that includes the input and ideal output data. Classification and regression algorithms are used to allow the model to learn over time. A loss function is used to measure its accuracy and recycled for the next iteration or dataset to an acceptable margin of error [145,172,173]. Unsupervised machine learning is typically used when labelled data is unknown or scarce [18,160,175]. Techniques used are normally based on clustering data samples, leaning towards a probabilistic model in which the output data may reside. A reinforced learning algorithm employs trial and error to identify a solution to a problem. The algorithm will be rewarded or penalized when it performs an action until it achieves its goals [176,177].
Object recognition tasks typically focus on high-resolution images (megapixel range), with few constraints on the viewing angle. Depending on the array size of the image and the number of pre-process methods used for classification, accuracy and performance should be considered, especially for real-time assessment [141,175,178,179].
Here, we can assess some image-based techniques used to optimize data acquisition, with some possible suggestions for implementation with C3DP (Table 6). This list is non-exhaustive, as a vast number of implementations are being developed over time. However, it intends to provide information useful for vision techniques in feedback. Some of the challenges in detection are related to noise, processing speed, and translation to control.

4. Discussion of Process Control and Fault Diagnosis Systems

The earlier chapter focused on fault detection with computer vision for C3DP. Fault detection and diagnosis is an essential element to operations management in automatic systems [187]. A fault is defined as an event or occurrence outside of the acceptable range of observable parameters in the process [188]. This definition, by extension, implies that symptoms such as plastic collapse or elastic bucking (in Section 2) are considered anomalies. The underlying failure(s), basic event(s), or root cause(s)—to date—are associated with the printing time gap, nozzle standoff distance, curing rate, etc., (as observed in Table 3). Some of these features, such as nozzle standoff distance, can be acquired through sensor inputs, e.g., the 1D Time-of-Flight Sensor by Wolfs et al. [135]. Taking the model of Suiker et al. [12,13] as reference for plastic collapse and elastic bucking, the diagnosis model will inherit the parameters, boundary conditions, interactions, and assumptions defined by the author. Failure arising beyond the scope of these restrictions are deemed as exogenous factors, and can be expanded to a malfunction of the process, the sensor, and/or the actuator.
Based on this categorization, researchers in C3DP have extensively studied structural faults, though identification of faults in sensors and actuators are not commonly discussed in C3DP publications, largely due to incomplete, on-going, or proof-of-concept implementations for these process control systems. We attempt to breakdown the requirements for fault diagnostics in C3DP applications. Fault diagnostics is a comprehensive topic in a premature field in C3DP. Hence, we limit the categorizations to the components that should be considered. This chapter will discuss the performance vs. speed trade-off, isolation, robustness, novelty identifiability, classification estimate adaptability, explanation facility, and modelling requirements for the purpose of C3DP systems.

4.1. Detection Speeds/Diagnosis Performance

Detection speed in fault diagnosis refers to the time taken for the system to detect objects of interest. Diagnosis performance refers to accuracy in identifying the intended features. These are important considerations for real-time applications that require rapid processing and decision making. High speed and reliable accuracy in a diagnosis system is ideal but unrealistic [189]. These chokepoints can stem from software, where different architectures exhibit varying performances depending on situation. Clear examples have been given in a comparative study of unsupervised classical computer vision techniques conducted by Hussain et al. [190], who noted varying accuracies and computational speeds for the different techniques. Hardware limitations such as camera sensor resolution are a factor in computational efficiency. A clear example can be observed in the experimentations conducted by Yaacob and Fahmi [191] for object tracking tasks. For C3DP processes, the trade-off between detection speeds and diagnosis performance can be an important consideration when selecting a process monitoring method. For example, in-process monitoring would require speed-sensitive computational performance, whereas a post-process assessment can focus on better diagnosis performance measures.

4.2. Fault Isolation

Fault isolation is defined as the ability of the system to identify and set apart the specific causes of faults in a system. This refers to the diagnostic classifiers’ capability to generate an output statistically independent of faults that are beyond the scope of the classifier. Process monitoring, data analysis, and root cause analysis are some of the methods employed for isolability. In C3DP, correction of properties for material and environmental changes are limited during the printing cycle. Hence, any unforeseeable changes are most likely dependent on adjustments made to process parameters. However, it is observable that there are common process parameters that contribute to all faults identified in Section 2. Root cause identifiability of current faults is still an ongoing pursuit, as post-process assessment is the current quantifiable evaluation mode. There is a gap in data points obtainable during in-process printing. Several researchers have attempted this via in- and ex-situ monitoring methods to obtain quantifiable results, such as layer height and layer width. However, reliability and standardization remain uncertain. This is critical as there is a trade-off between fault isolation and rejection of modelling uncertainties. Strict fault isolation requirements can incur false rejection of modelling uncertainties, and vice versa.

4.3. Robustness

A well-defined boundary condition in a robust diagnosis system should be impartial to noise and uncertainties. Failure in robustness will invalidate any diagnosis performance. Hence, ideally, there should be a proportional loss of performance in exchange for better robustness in the system. Monitoring systems that are based on neural networks pose a fundamental flaw for robustness, which is unstable and unusable for high-stakes applications [192]. Several studies have reported adversarial attacks on neural networks [192,193,194,195]. The image below is an example of an adversarial attack. Su et al. [196] modified a single pixel of an image. The resulting prediction provided high confidence with incorrect labels, showing that neural networks involving image-based systems are not spared from this limitation (Figure 13).
Its relevance is dominant once in-process monitoring with neural networks i used for correcting critical processes. Researchers are still uncertain to an extent, regarding the cause and effect of adversarial robustness. However, the current consensus studied by Ilyas et al. [193] shows that adversarial attacks are not bugs, but instead are highly predictive non-robust features caused by human interpretation during model training. Hence, stable representations for DNN should be improved by introducing a human prior, for the elimination of human biases, to secure monitoring and printer head manipulation in C3DP feedback systems.

4.4. Novelty Identifiability

An abnormal behaviour in a process could be an indicator of a malfunction. If sufficient data is collected to validate any unknown malfunction, this can be known as novel identifiability. In cases with some available data for the unknown malfunction, the diagnosis system should be adequately robust to model the abnormal regions correctly without misclassification. Sparsity of abnormal data points could contribute to poor classification, which poses a challenge in novel identifiability. Ideally, unknown faults should not be misclassified as other known malfunctions.
Tay et al. [42] identified the importance of time gap effects on the interlayer bond strength, whereby a low modulus is required to bond the two printed layers sufficiently. The authors also specified that the opposite is required to maintain strength in the support of subsequent layers. Research [41,197] has indicated that effects of nozzle printing speeds and nozzle standoff distance have an influence on the interlayer bond strength. Post-process assessment methods mentioned above were able to identify root causes that define poor interlayer bond strength. However, as the requirement to manage the printing time gap between layers can be dynamic based on design, a monitoring or management process is needed to identify and handle the process. There is yet to be a classification method for poor interlayer voids with monitoring methods. However, there have been studies related to managing extrusion rates to avoid structural failure [6,13,17,108]. Hence, poor interlayer voids can be grouped as an unknown malfunction class in a monitoring or management method.

4.5. Classification Error Estimate

A diagnostic system should be able to provide an error estimate to project the confidence levels to the user on a practical basis for ease of facilitation and management of the existing errors. In computer vision, these classification estimates are akin to comparison to ground truth images. Many AI and machine learning techniques refer to this standardized test for error estimation [160,172,175,189,190,191]. Each method used in this manner can be fairly evaluated for its effectiveness. Additionally, complementary scores and matrices are often used as a quantitative assessment, such as Mean Average Precision (mAP), Intersection-over-Union (IoU), and F-Score. Each of these assessment methods utilize Precision and Recall parameters, which consist of True Positive (TP), True Negative (TN), False Positive (FP), and False Negative (FN) regions in classified data and provide a metric for comparison and evaluation [198,199,200,201,202]. These functions (TP, FP, FN) can be summarized with Ground Truth (GT) and Segmentation Mask Values (S) (Refer to Table 7). These metrics can enable the user or machine to make decisions on the ground for corrective measures or safety evaluation in C3DP applications.

4.6. Adaptability

A system’s process can be dependent on more than just noise and outliers. Different environmental conditions or process parameters can occur. Optimally, the diagnosis system should be able to adapt to these changes though gradual implementations during emerging issues. Kazemain et al. [18] (Section 3.2) represent an example of gradual implementation on unaccounted and unexpected issues with environmental lighting effects. This resulted in an occasional erroneous reading. Implementation was made to the algorithm to adjust accordingly by introducing frame drops. As of now, there are only a handful of researchers recruiting vision-based techniques for quantification and evaluation, and even less so for feedback implementations with vision-based systems (refer to Table 5). The lack of research interest in this area undermines the development of adaptable systems.

4.7. Explanation Facility

To provide an explanation in a diagnosis of an identified malfunction is critical for a support system. This should be able to provide cause and effects and justify its recommendations to the user. As only a handful of feedback systems have been developed in the field, there are limited examples for explanation. Wolfs et al. [135] developed a 1D time-of-flight sensor implementation, which was able to control the nozzle height as a feedback system, preventing buckling and collapse. The explanation facility dynamics for this application were the height values provided by the sensor, subsequently providing a recommendation to the machine to adjust the nozzle height upon deviation from the ideal elevation. As observed, the explanation facility provides critical support for the machine to respond to changes, failure of which would invalidate the diagnosis action and system.

4.8. Modelling Requirements

The model should be designed appropriately to optimize performance requirements. For an in-situ diagnostic system, modelling effort should be lightweight to reduce computational load for machine-based parameters. In supervised learning techniques, various network architectures can be used to optimize the process according to the application requirements: Mobilenet, Regnet, and Efficientnet, for example, are designed with detection speeds in mind, whereas ResNet and DenseNet are intent on better diagnosis performance with less focus on detection speeds [203]. As mentioned in the above section, modelling requirements should factor in human priors to eliminate predictive non-robust features. This addition will also increase the computational load in the feedback system. Hence, it is important to find an optimal operation rate to enable fluidity within the process.

5. Current and Potential Applications

Feedback implementations regarding C3DP applications are far from ready for deployment in industrial projects. However, similar diagnostic applications have already been implemented broadly in the construction industry. This section will consider the current and potential applications in diagnosis systems for C3DP based on existing technologies in the construction field.

5.1. Safety Monitoring

Camera equipped Unmanned Aerial Vehicles (UAVs) can be an inexpensive option to real-time monitoring and documenting of data. Fernandaz Galarreta et al. [204] developed a UAV monitoring system that uses point cloud assessment and object-based image analysis to inspect facades and roofs (Figure 14). Unfortunately, due to the early development of the technology, the data acquired misaligns with the requirements of ground-based Building Damage Assessments. The authors noted that feature extraction should be further developed to improve image characterization for damaged facades.
On the other hand, Jhonattan et al. designed and developed an aerial monitoring system that utilizes Unmanned Aerial Systems (UAS) to inspect the workplace for common safety hazards such as worker distractions, signal interference, or workplace obstruction. There are some limitations in regulatory, safety, and technical aspects that can be problematic in UAS deployment. Some of the discussed problems reside in flight spaces, flying time reduction, data collection optimization, and battery life coverage in large workspaces. The research team is also leaning towards utilizing a computer vision algorithm to autonomize data collection (Figure 15) [147].
Lei et al. proposed a k-means clustering machine vision system to analyze construction sites for long term workplace safety, as opposed to a filter membrane that was used to collect the same data. The weight of the filter membrane had to be recorded before and at the end of the experiment, which is labor intensive and inefficient. Thick construction dust emissions that obscure the optical lens are detected with the k-means clustering algorithm in an HSV-formatted image. This method provided some levels of automation at the construction site that could streamline construction monitoring processes, reduced workload, and improved responsiveness to dangerous environmental changes. From a technical standpoint however, the authors expressed challenges in classifying low dust concentration levels and distinguishing between low and high dust concentration levels (Figure 16) [163].

5.2. Building Information Modelling

Photogrammetry was also used in documenting cultural heritage and gathering physical information, due to its low-cost feasibility. Documentation of cultural heritage can assist in protection, restoration, and renovation. However, accuracy and best practices are not well established for proper implementation on-site [205].
Yastikli [206] coupled laser scanning with photogrammetry to improve the accuracy of the documentation of cultural heritage sites. A ranged laser scanner was utilized to measure and compute the distance between the laser and the object while using a high-resolution camera to enhance the image feature quality. The combination of both techniques enabled the autonomous generation of high-quality images using a processing software, RiSCAN PRO. This allows all scans and images to be registered onto the reference coordinated system using reflectors in the scan area. With a series of images taken from multiple perspectives and angles, an RGB color value was assigned to every scanned 3D point. The images in Figure 17 show the results.
Implementing digitalization and BIM in the early phase of construction projects helps to establish a new method for process optimization. BIM can be useful for documenting progress information on a site, providing evidence that the work has been completed on-site and in accordance with the architectural design. Braun and Borrmann [207] proposed a solution to capture the construction process by taking photographs at regular intervals at different viewpoints. When sufficient images are taken, a 3D point cloud can be reconstructed with the help of photogrammetry methods (Figure 18).

5.3. Structural Health Monitoring

5.3.1. Computer Vision

Computer vision has also been used in buildings to monitor structural health [137]. Cracks that undermine traditional construction methods can propagate due to tropical or cold weather conditions and can be attributed to poor hydration processes [208,209]. Small cracks are typically identified with electron microscopy and optical fluorescent microscopy [210,211,212]. Talab et al. [144] applied and compared several image filters (see Figure 19) to qualitatively scrutinize cracks in an image. Concrete surfaces exhibit noise, especially with Otsu’s Method and the Kittler Met Method when processed individually. The experiment found that foreground and background features can be distinguished when concatenating more than one threshold method.
Dung et al. used VGG16-based convolutional neural network architecture to detect cracks on the surface of concrete (Figure 20) [162]. The model was able to detect cracks and crack density, proposing individual segmentation methods. While the proposed method is not in real time, it provided about 99.9% accuracy in classification. The experiment found that Otsu’s thresholding and segmentation method can work well in both convoluted and non-complicated backgrounds.
The crack detection methods showed the different capabilities of computer vision approaches to surface detection in construction. Both methods could identify crack methods generally well. The classical method can produce levels of convoluted data in distinguishing any desired features with little training, while neural networks can be more accurate but time consuming, as a large dataset is generally needed to train the model. Collecting datasets can also be a challenge in analyzing 3D printed concrete, due to the lack of relevant research.

5.3.2. Sensor Embedment

Alternatively, SHM methods can also be used to characterize the internal properties of concrete structures. Sensor embedment can carry out various long-term non-destructive tests as an early-detection and early-prevention measure to preserve structural integrity [213,214,215,216]. Some of these methods include the embedding of piezoresistive materials and piezoelectric sensors within the concrete structure during the fabrication process [217,218,219,220,221]. The mechanical reactions to internal structural changes can be picked up by the piezoresistive materials via electromechanical translation. This has enabled access to previously non-accessible analyses, such as damage assessments [222,223], strain logging [224,225,226,227], electromechanical interference shielding [228,229], corrosion sensing [230,231], and self-heating [232]. However, one of the pending challenges with sensor embedment is the high fabrication cost and poor material lifecycle in full scaled construction applications [220,221].

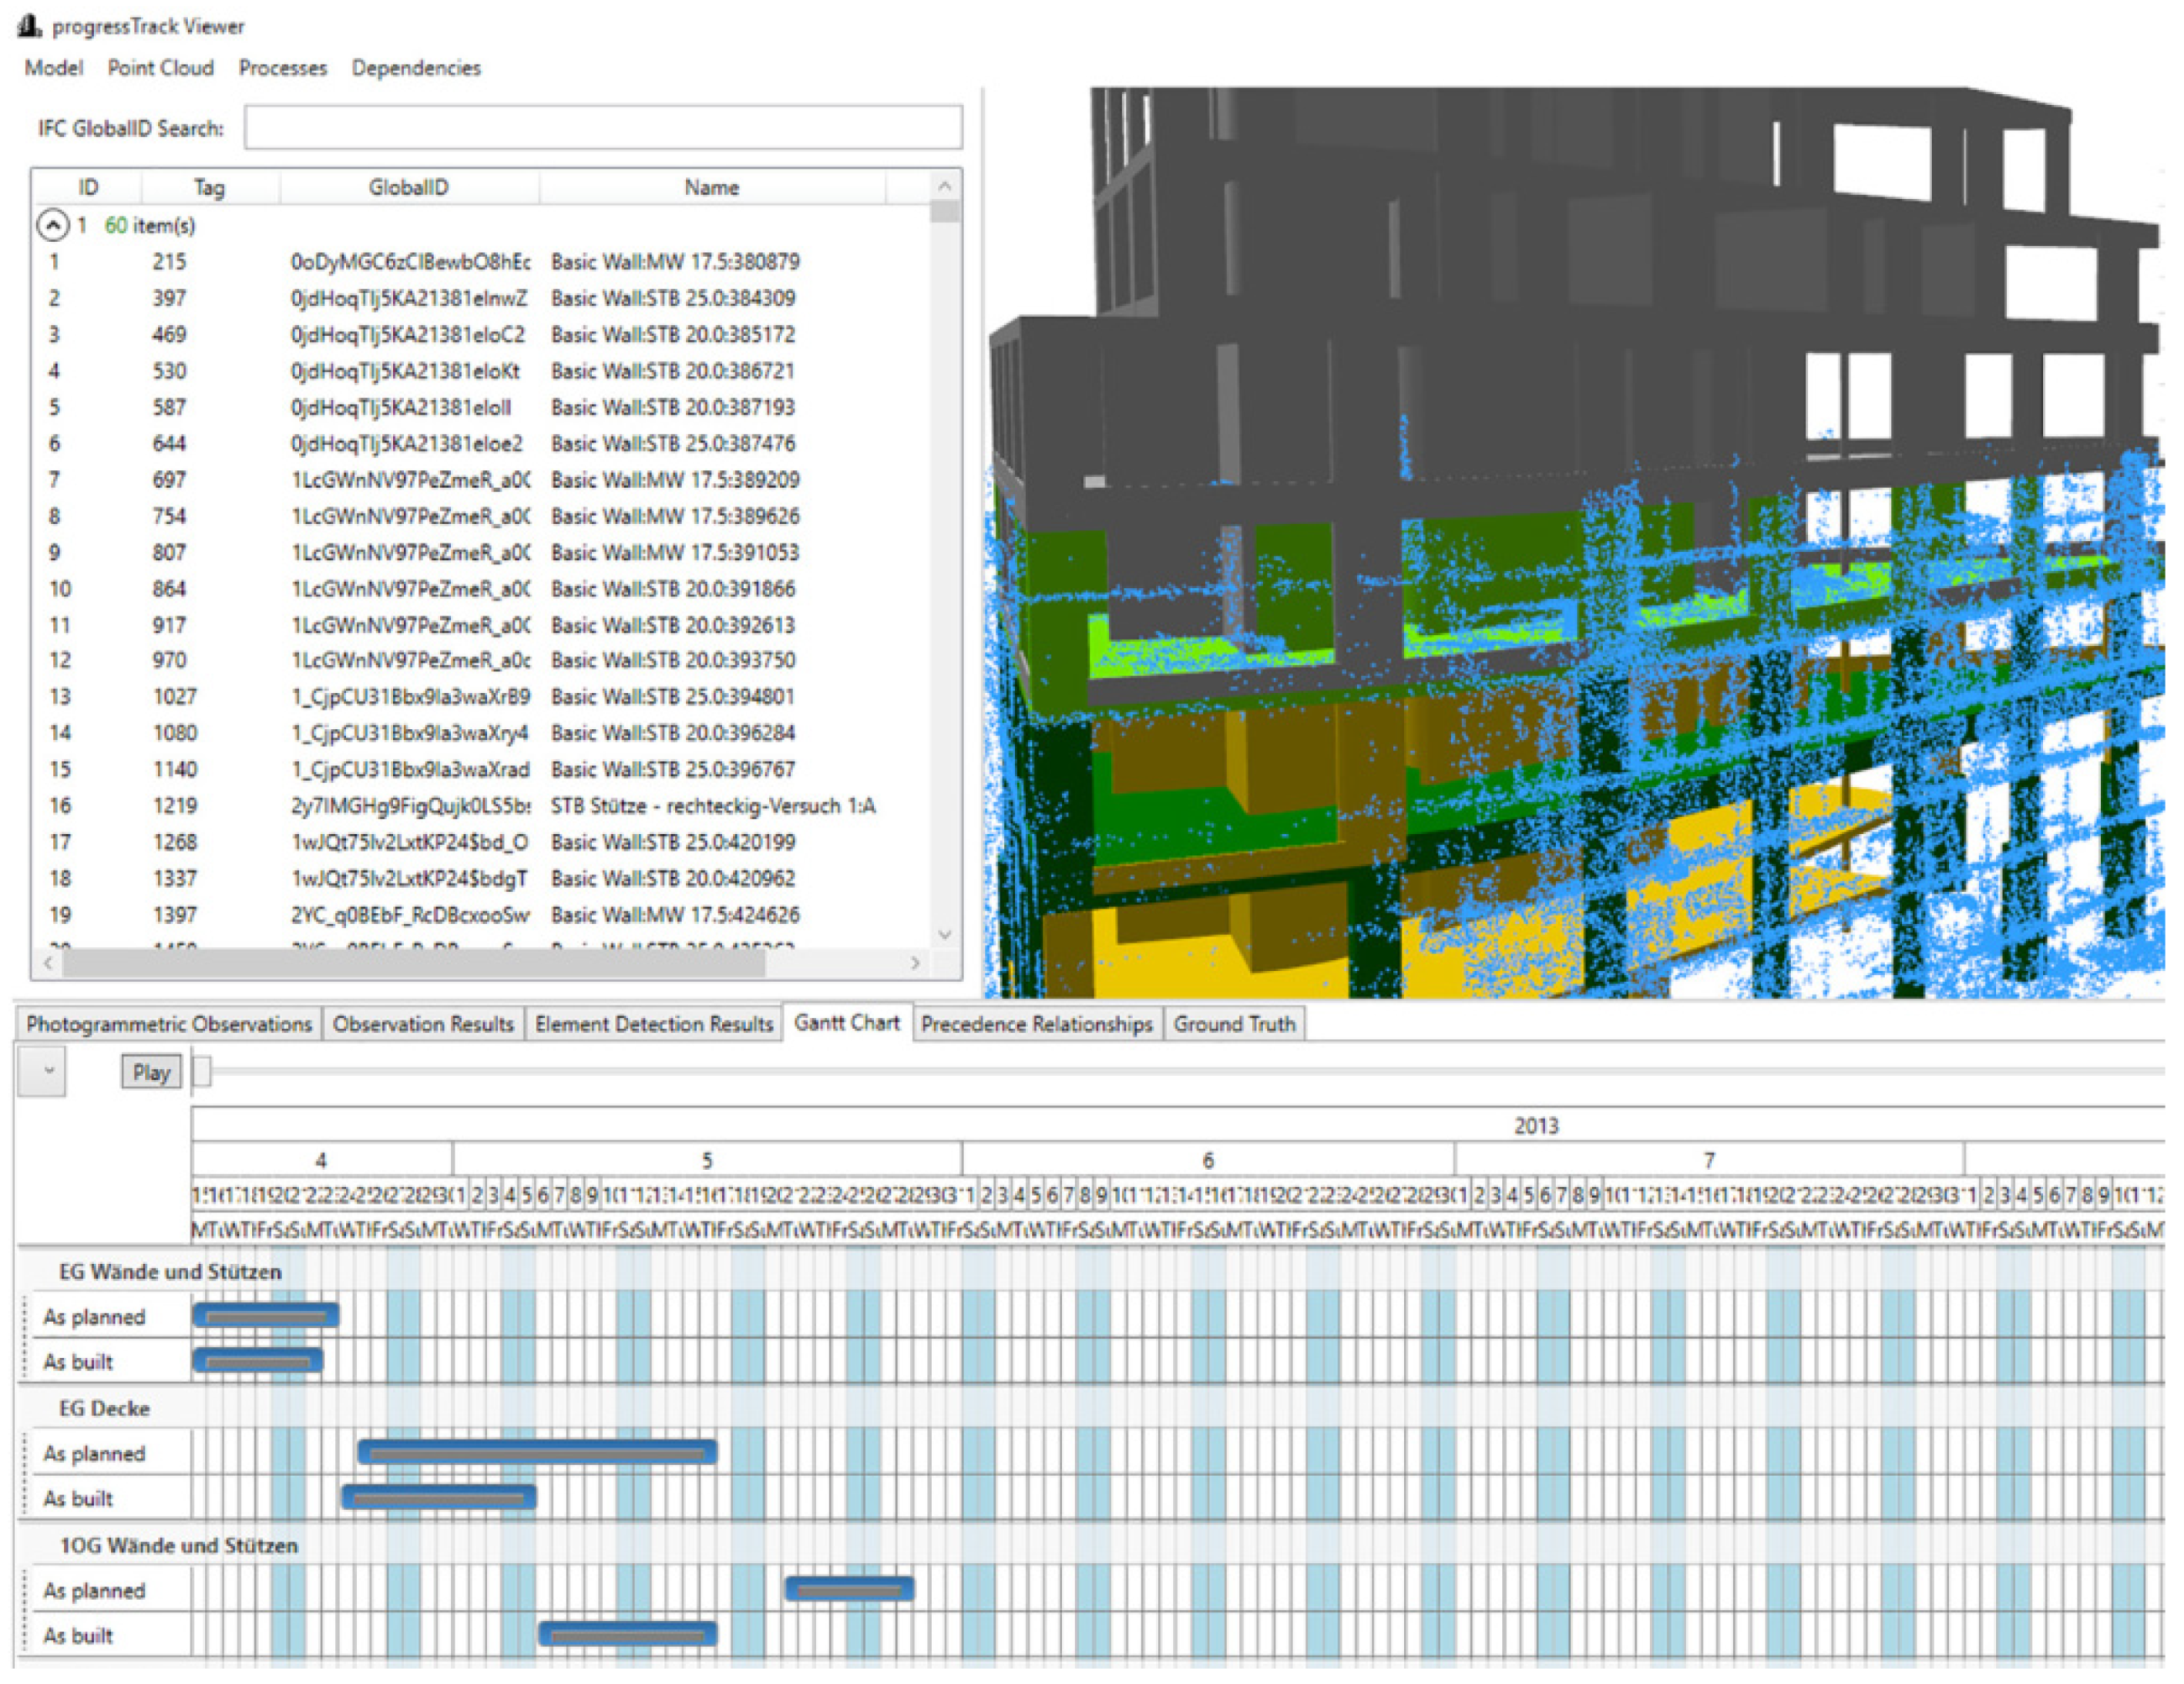
5.4. Progress Tracking

Bayrak and Kaka [149] discussed the use of photogrammetry to monitor the construction process from photos taken periodically during construction. The 3D model created can then be used to compare and track the measurements of the construction progress. The approach has shown to improve productivity in traditional construction and provided a better flow of information to all involved personnel. However, the CAD model is unable to obtain details of the plastering, electrical systems, and pipes. The method proves that a photogrammetric system can collect information, despite limitations at the time, and was able to monitor the general layout in the early stages of construction (Figure 21).
Despite the recent advancements in monitoring and management systems for Building Information Modelling (BIM) in the construction industry, the traditional approach that utilizes manual paperwork and recording of on-site activity is still prevalent in the industrial workflow [148]. Case studies of intra-production construction have been carried out to identify potential deviations from the intended construction schedule. Any deviations observed will activate an automatic notification system that is sent by email to inform the key decision makers [148]. Omar et al. [148] proposed a monitoring system that can achieve a significant improvement in accuracy and automation. However, occlusions are found to be one of the largest limitations in the advanced monitoring system. Exposure to static and dynamic obstructions present in construction sites are often deemed inevitable.

5.5. Sustainability

Sustainable technologies are described as self-sustaining efforts to improving overall quality of life, with little compromises to current technological efficiency and cost measures [233]. The heatmap of sustainability has been growing for the construction industry, as it contributes to approximately 40% of current world energy usage based on the 2019 Global Status Report for Buildings and Construction [234]. C3DP has a likely potential to significantly reduce the heavy reliance on natural resources and could introduce a robust circular economy framework with reusable materials and sustainable structural designs [235,236]. According to the Brundtland Commission (formerly known as the World Commission on Environment and Development), sustainability can be fragmented into economic, societal, and environmental factors [237].
C3DP researchers have been advocating for economic and environmental sustainability measures using industrial waste materials [80,85,86,93,238,239]. Operational benefits can also be achieved with a reallocation of manpower, with automated C3DP on-site [240]. Other sources within the construction industry have discussed the societal, economic, and environmental benefits of green buildings, where usage of natural resources (such as energy, water, material, waste, toxicity, and air quality) throughout the lifecycle of the building remains efficient [241]. Unfortunately, practical implementation studies related to sustainability in C3DP is not yet well documented, as challenges remain on a technical and process level, as described in Section 2 [236,242,243].

6. Conclusions and Future Vision

Currently, the preferred construction approach in Singapore’s high-density urban landscape is the use of PPVC. This method is mainly driven by benefits in environmental pollution reduction, improved productivity, quality control, and customizability. However, its overall cost savings have been counterbalanced by new cost drivers, such as modular precast moulds, transportation, hoisting, manufacturing and holding yards, and supervision costs. The highly modular requirements for PPVC place additive manufacturing in an advantageous position due to its high customizability and low volume manufacturing capabilities for a faster manufacturing response time, faster production changeovers, and lower inventory requirements. As C3DP technology moves away from its early-stage development, there is a need to closely evaluate the process parameters across buildability, extrudability, and pumpability aspects.
As process parameters have been identified to have considerable influence in C3DP processes, monitoring systems for feedback applications seem to be an inevitable step forward towards automation in construction. This paper has presented a broad analysis of the challenges posed to C3DP and feedback systems, stressing the admission of similar parameters, evaluated and used for multiple failure modes that potentially confound the fault diagnosis processes. This paper covers some aspects of technicality and fundamental groundwork to develop a diagnosis system that consists of three parts.
  • Existing parameter studies on various effects/challenges,
  • Monitoring systems for fault diagnosis,
  • Fault diagnosis principles in the context of C3DP.
Much work needs to be done to fully implement fault diagnosis methods for C3DP applications as a feedback system, as researchers must understand the material, the process, and the feedback methodologies. This paper hopes to contribute as a bridge between the complex branches of each aspect of C3DP for ease of understanding and further development of diagnosis systems in C3DP.

Author Contributions

Conceptualization, T.K.N.Q. and J.H.L. Resources, M.J.T., T.N.W. and K.H.H.L. Data Curation, T.K.N.Q. and J.H.L. Writing-Original Draft, T.K.N.Q. and Y.W.D.T. Writing-Review and Editing, T.K.N.Q. and K.H.H.L. Visualization, T.K.N.Q. and J.H.L. Supervision, T.N.W. and K.H.H.L. Project Administration, M.J.T., T.N.W. and K.H.H.L. Funding Acquisition, T.N.W. and K.H.H.L. All authors have read and agreed to the published version of the manuscript.

Funding

This research received no external funding.

Data Availability Statement

No new data were created or analyzed in this study. Data sharing is not applicable to this article.

Acknowledgments

This research is supported by the National Research Foundation, Prime Minister’s Office, Singapore under its Medium-Sized Centre funding scheme, National Additive Manufacturing Innovation Cluster, Singapore Centre for 3D Printing, Enviro Sand Pty Ltd., and Chip Eng Seng Corporation Ltd.

Conflicts of Interest

The authors declare no conflict of interest.

References

  1. S’pore’s Construction Sector Faces Manpower, Materials Roadblocks with Future Uncertain. The Straits Times. Available online: https://www.straitstimes.com/singapore/spores-construction-sector-faces-manpower-materials-roadblocks-with-future-uncertain (accessed on 28 June 2022).
  2. Prefabricated Prefinished Volumetric Construction (PPVC). Building and Construction Authority (BCA). Available online: https://www1.bca.gov.sg/buildsg/productivity/design-for-manufacturing-and-assembly-dfma/prefabricated-prefinished-volumetric-construction-ppvc (accessed on 24 April 2021).
  3. Kong, H.; Managing, M.; Jien, L.; Director, P. Pre-Fabricated Pre-Finished Volumetric Construction (PPVC) For Residential Projects; Threesixty Cost Management Pte Ltd.: Singapore, 2018. [Google Scholar]
  4. Chua, C.K.; Leong, K.F. 3D Printing and Additive Manufacturing: Principles and Applications, 4th ed.; World Scientific Publishing Co.: Singapore, 2014. [Google Scholar] [CrossRef] [Green Version]
  5. Khoshnevis, B.; Hwang, D. Contour Crafting. Rapid Prototyp. 2006, 6, 221–251. [Google Scholar] [CrossRef]
  6. Carneau, P.; Mesnil, R.; Baverel, O.; Roussel, N. Layer pressing in concrete extrusion-based 3D-printing: Experiments and analysis. Cem. Concr. Res. 2022, 155, 106741. [Google Scholar] [CrossRef]
  7. Ma, G.; Buswell, R.; da Silva, W.R.L.; Wang, L.; Xu, J.; Jones, S.Z. Technology readiness: A global snapshot of 3D concrete printing and the frontiers for development. Cem. Concr. Res. 2022, 156, 106774. [Google Scholar] [CrossRef]
  8. Xu, J.; Ding, L.; Cai, L.; Zhang, L.; Luo, H.; Qin, W. Volume-forming 3D concrete printing using a variable-size square nozzle. Autom. Constr. 2019, 104, 95–106. [Google Scholar] [CrossRef]
  9. Bos, F.; Wolfs, R.; Ahmed, Z.; Salet, T. Additive manufacturing of concrete in construction: Potentials and challenges of 3D concrete printing. Virtual Phys. Prototyp. 2016, 11, 209–225. [Google Scholar] [CrossRef] [Green Version]
  10. Malaeb, Z.; AlSakka, F.; Hamzeh, F. 3D Concrete Printing: Machine Design, Mix Proportioning, and Mix Comparison between Different Machine Setups. In 3D Concrete Printing Technology; Elsevier: Amsterdam, The Netherlands, 2019; pp. 115–136. [Google Scholar] [CrossRef]
  11. Souza, M.T.; Ferreira, I.M.; de Moraes, E.G.; Senff, L.; de Oliveira, A.P.N. 3D printed concrete for large-scale buildings: An overview of rheology, printing parameters, chemical admixtures, reinforcements, and economic and environmental prospects. J. Build. Eng. 2020, 32, 101833. [Google Scholar] [CrossRef]
  12. Suiker, A.S.J. Mechanical performance of wall structures in 3D printing processes: Theory, design tools and experiments. Int. J. Mech. Sci. 2018, 137, 145–170. [Google Scholar] [CrossRef] [Green Version]
  13. Suiker, A.S.J. Effect of accelerated curing and layer deformations on structural failure during extrusion-based 3D printing. Cem. Concr. Res. 2022, 151, 106586. [Google Scholar] [CrossRef]
  14. Suiker, A.S.J.; Wolfs, R.J.M.; Lucas, S.M.; Salet, T.A.M. Elastic buckling and plastic collapse during 3D concrete printing. Cem. Concr. Res. 2020, 135, 106016. [Google Scholar] [CrossRef]
  15. Buswell, R.A.; de Silva, W.R.L.; Jones, S.Z.; Dirrenberger, J. 3D printing using concrete extrusion: A roadmap for research. Cem. Concr. Res. 2018, 112, 37–49. [Google Scholar] [CrossRef]
  16. Lao, W.; Li, M.; Wong, T.N.; Tan, M.J.; Tjahjowidodo, T. Improving surface finish quality in extrusion-based 3D concrete printing using machine learning-based extrudate geometry control. Virtual Phys. Prototyp. 2020, 15, 178–193. [Google Scholar] [CrossRef]
  17. Nerella, V.N.; Hempel, S.; Mechtcherine, V. Effects of layer-interface properties on mechanical performance of concrete elements produced by extrusion-based 3D-printing. Constr. Build. Mater. 2019, 205, 586–601. [Google Scholar] [CrossRef]
  18. Kazemian, A.; Yuan, X.; Davtalab, O.; Khoshnevis, B. Computer vision for real-time extrusion quality monitoring and control in robotic construction. Autom. Constr. 2019, 101, 92–98. [Google Scholar] [CrossRef]
  19. Kashani, A.; Ngo, T.D. Optimisation of mixture properties for 3D printing of geopolymer concrete. In Proceedings of the International Symposium on Automation and Robotics in Construction, New Orleans, LA, USA, 2–4 April 2018; IAARC Publications: Chennai, India, 2018. [Google Scholar]
  20. Le, T.T.; Austin, S.A.; Lim, S.; Buswell, R.A.; Gibb, A.G.F.; Thorpe, T. Mix design and fresh properties for high-performance printing concrete. Mater. Struct. Mater. Constr. 2012, 45, 1221–1232. [Google Scholar] [CrossRef] [Green Version]
  21. Almusallam, A.A. Effect of Environmental Conditions on the Properties of Fresh and Hardened Concrete. Available online: www.elsevier.com/locate/cemconcomp (accessed on 14 January 2021).
  22. Ji, G.; Xiao, J.; Zhi, P.; Wu, Y.C.; Han, N. Effects of extrusion parameters on properties of 3D printing concrete with coarse aggregates. Constr. Build. Mater. 2022, 325, 126740. [Google Scholar] [CrossRef]
  23. Geng, Z.; She, W.; Zuo, W.; Lyu, K.; Pan, H.; Zhang, Y.; Miao, C. Layer-interface properties in 3D printed concrete: Dual hierarchical structure and micromechanical characterization. Cem. Concr. Res. 2020, 138, 106220. [Google Scholar] [CrossRef]
  24. Ma, Z.; Wittmann, F.H.; Xiao, J.; Zhao, T. Influence of freeze-thaw cycles on properties of Integral Water Repellent Concrete. J. Wuhan Univ. Technol. Mater. Sci. Ed. 2016, 31, 851–856. [Google Scholar] [CrossRef]
  25. Danish, A.; Khurshid, K.; Mosaberpanah, M.A.; Ozbakkaloglu, T.; Salim, M.U. Microstructural characterization, driving mechanisms, and improvement strategies for interlayer bond strength of additive-manufactured cementitious composites: A review. Case Stud. Constr. Mater. 2022, 17, e01217. [Google Scholar] [CrossRef]
  26. Moini, R.; Baghaie, A.; Rodriguez, F.B.; Zavattieri, P.D.; Youngblood, J.P.; Olek, J. Quantitative microstructural investigation of 3D-printed and cast cement pastes using micro-computed tomography and image analysis. Cem. Concr. Res. 2021, 147, 106493. [Google Scholar] [CrossRef]
  27. Balapour, M.; Thway, T.; Moser, N.; Garboczi, E.J.; Hsuan, Y.G.; Farnam, Y. Engineering properties and pore structure of lightweight aggregates produced from off-spec fly ash. Constr. Build. Mater. 2022, 348, 128645. [Google Scholar] [CrossRef]
  28. Liu, J.; Setunge, S.; Tran, P. 3D concrete printing with cement-coated recycled crumb rubber: Compressive and microstructural properties. Constr. Build. Mater. 2022, 347, 128507. [Google Scholar] [CrossRef]
  29. Ramachandran, V.S. Concrete Admixtures Handbook: Properties, Science, and Technology; William Andrew: Norwich, NY, USA, 1995; p. 1153. [Google Scholar]
  30. Marchment, T.; Sanjayan, J.G.; Nematollahi, B.; Xia, M. Interlayer Strength of 3D Printed Concrete: Influencing Factors and Method of Enhancing. 3D Concr. Print. Technol. 2019, 241–264. [Google Scholar] [CrossRef]
  31. Micro-and Macroscopic Investigations on the Interface between Layers of 3D-Printed Cementitious Elements. Available online: https://www.researchgate.net/publication/319504633_MICRO-AND_MACROSCOPIC_INVESTIGATIONS_ON_THE_INTERFACE_BETWEEN_LAYERS_OF_3D-PRINTED_CEMENTITIOUS_ELEMENTS (accessed on 1 January 2023).
  32. Shakor, P.; Sanjayan, J.; Nazari, A.; Nejadi, S. Modified 3D printed powder to cement-based material and mechanical properties of cement scaffold used in 3D printing. Constr. Build. Mater. 2017, 138, 398–409. [Google Scholar] [CrossRef]
  33. Le, T.T.; Austin, S.A.; Lim, S.; Buswell, R.A.; Law, R.; Gibb, A.G.F.; Thorpe, T. Hardened properties of high-performance printing concrete. Cem. Concr. Res. 2012, 42, 558–566. [Google Scholar] [CrossRef] [Green Version]
  34. Moelich, G.M.; Kruger, J.; Combrinck, R. Plastic shrinkage cracking in 3D printed concrete. Compos. Part B Eng. 2020, 200, 108313. [Google Scholar] [CrossRef]
  35. Shahmirzadi, M.R.; Gholampour, A.; Kashani, A.; Ngo, T.D. Shrinkage behavior of cementitious 3D printing materials: Effect of temperature and relative humidity. Cem. Concr. Compos. 2021, 124, 104238. [Google Scholar] [CrossRef]
  36. Cheewaket, T.; Jaturapitakkul, C.; Chalee, W. Concrete durability presented by acceptable chloride level and chloride diffusion coefficient in concrete: 10-year results in marine site. Mater. Struct. Mater. Et Constr. 2014, 47, 1501–1511. [Google Scholar] [CrossRef]
  37. Zheng, X.; Liu, F.; Luo, T.; Duan, Y.; Yi, Y.; Hua, C. Study on Durability and Pore Characteristics of Concrete under Salt Freezing Environment. Materials 2021, 14, 7228. [Google Scholar] [CrossRef] [PubMed]
  38. Wang, L.; Xiao, W.; Wang, Q.; Jiang, H.; Ma, G. Freeze-thaw resistance of 3D-printed composites with desert sand. Cem. Concr. Compos. 2022, 133, 104693. [Google Scholar] [CrossRef]
  39. Assaad, J.J.; Hamzeh, F.; Hamad, B. Qualitative assessment of interfacial bonding in 3D printing concrete exposed to frost attack. Case Stud. Constr. Mater. 2020, 13, e00357. [Google Scholar] [CrossRef]
  40. Bos, F.P.; Menna, C.; Pradena, M.; Kreiger, E.; da Silva, W.L.; Rehman, A.; Weger, D.; Wolfs, R.; Zhang, Y.; Ferrara, L.; et al. The realities of additively manufactured concrete structures in practice. Cem. Concr. Res. 2022, 156, 106746. [Google Scholar] [CrossRef]
  41. Panda, B.; Paul, S.C.; Mohamed, N.A.N.; Tay, Y.W.D.; Tan, M.J. Measurement of tensile bond strength of 3D printed geopolymer mortar. Measurement 2018, 113, 108–116. [Google Scholar] [CrossRef]
  42. Tay, Y.W.D.; Ting, G.H.A.; Qian, Y.; Panda, B.; He, L.W.; Tan, M.J. Time gap effect on bond strength of 3d printed concrete. Virtual Phys. Prototyp. 2019, 14, 104–113. [Google Scholar] [CrossRef]
  43. Ashrafi, N.; Nazarian, S.; Meisel, N.A.; Duarte, J.P. Experimental prediction of material deformation in large-scale additive manufacturing of concrete. Addit. Manuf. 2021, 37, 101656. [Google Scholar] [CrossRef]
  44. Yao, H.; Xie, Z.; Li, Z.; Huang, C.; Yuan, Q.; Zheng, X. The relationship between the rheological behavior and interlayer bonding properties of 3D printing cementitious materials with the addition of attapulgite. Constr. Build. Mater. 2022, 316, 125809. [Google Scholar] [CrossRef]
  45. Slavcheva, G.S. Drying and shrinkage of cement paste for 3D printable concrete. IOP Conf. Ser. Mater. Sci. Eng. 2019, 481, 012043. [Google Scholar] [CrossRef]
  46. Lu, B.; Qian, Y.; Li, M.; Weng, Y.; Leong, K.F.; Tan, M.-J.; Qian, S.; Lu, B.; Qian, Y.; Li, M.; et al. Designing spray-based 3D printable cementitious materials with fly ash cenosphere and air entraining agent. Constr. Build. Mater. 2019, 211, 1073–1084. [Google Scholar] [CrossRef]
  47. Ma, G.; Zhang, J.; Wang, L.; Li, Z.; Sun, J. Mechanical characterization of 3D printed anisotropic cementitious material by the electromechanical transducer. Smart Mater. Struct. 2018, 27, 075036. [Google Scholar] [CrossRef]
  48. Yu, S.; Xia, M.; Sanjayan, J.; Yang, L.; Xiao, J.; Du, H. Microstructural characterization of 3D printed concrete. J. Build. Eng. 2021, 44, 102948. [Google Scholar] [CrossRef]
  49. Anleu, P.C.B. Quantitative Micro XRF Mapping of Chlorides: Possibilities, Limitations, and Applications, from Cement to Digital Concrete. Ph.D. Thesis, ETH Zurich, Zürich, Switzerland, March 2019. [Google Scholar] [CrossRef]
  50. van der Putten, J.; Azima, M.; Heede, P.V.D.; Van Mullem, T.; Snoeck, D.; Carminati, C.; Hovind, J.; Trtik, P.; De Schutter, G.; Van Tittelboom, K. Neutron radiography to study the water ingress via the interlayer of 3D printed cementitious materials for continuous layering. Constr. Build. Mater. 2020, 258, 119587. [Google Scholar] [CrossRef]
  51. Wang, L.; Tian, Z.; Ma, G.; Zhang, M. Interlayer bonding improvement of 3D printed concrete with polymer modified mortar: Experiments and molecular dynamics studies. Cem. Concr. Compos. 2020, 110, 103571. [Google Scholar] [CrossRef]
  52. Hosseini, E.; Zakertabrizi, M.; Korayem, A.H.; Xu, G. A novel method to enhance the interlayer bonding of 3D printing concrete: An experimental and computational investigation. Cem. Concr. Compos. 2019, 99, 112–119. [Google Scholar] [CrossRef]
  53. Sanjayan, J.G.; Nematollahi, B.; Xia, M.; Marchment, T. Effect of surface moisture on inter-layer strength of 3D printed concrete. Constr. Build. Mater. 2018, 172, 468–475. [Google Scholar] [CrossRef]
  54. Moelich, G.M.; Kruger, P.J.; Combrinck, R. A plastic shrinkage cracking risk model for 3D printed concrete exposed to different environments. Cem. Concr. Compos. 2022, 130, 104516. [Google Scholar] [CrossRef]
  55. Alchaar, A.S.; Al-Tamimi, A.K. Mechanical properties of 3D printed concrete in hot temperatures. Constr. Build. Mater. 2021, 266, 120991. [Google Scholar] [CrossRef]
  56. Gonen, T.; Yazicioglu, S.; Demirel, B. The influence of freezing-thawing cycles on the capillary water absorption and porosity of concrete with mineral admixture. KSCE J. Civ. Eng. 2015, 19, 667–671. [Google Scholar] [CrossRef]
  57. Salet, T.A.M.; Ahmed, Z.Y.; Bos, F.P.; Laagland, H.L.M. 3D Concrete Printing: A Systematic Review of Rheology, Mix Designs, Mechanical, Microstructural, and Durability Characteristics. Materials 2021, 14, 3800. [Google Scholar] [CrossRef]
  58. Marchment, T.; Sanjayan, J.; Xia, M. Method of enhancing interlayer bond strength in construction scale 3D printing with mortar by effective bond area amplification. Mater. Des. 2019, 169, 107684. [Google Scholar] [CrossRef]
  59. Wolfs, R.J.M.; Bos, F.P.; Salet, T.A.M. Hardened properties of 3D printed concrete: The influence of process parameters on interlayer adhesion. Cem. Concr. Res. 2019, 119, 132–140. [Google Scholar] [CrossRef]
  60. Tsivilis, S.; Tsantilas, J.; Kakali, G.; Chaniotakis, E.; Sakellariou, A. The permeability of Portland limestone cement concrete. Cem. Concr. Res. 2003, 33, 1465–1471. [Google Scholar] [CrossRef]
  61. Tatsuhiko, S. “EFFECT OF CARBONATION ON CHLORIDE PENETRATION IN CONCRETE,” RILEM, Bagneux, Franc. 2005. Available online: https://www.rilem.net/images/publis/pro038-025.pdf (accessed on 20 February 2023).
  62. Ye, H.; Jin, X.; Fu, C.; Jin, N.; Xu, Y.; Huang, T. Chloride penetration in concrete exposed to cyclic drying-wetting and carbonation. Constr. Build. Mater. 2016, 112, 457–463. [Google Scholar] [CrossRef]
  63. Liu, B.; Shi, J.; Zhou, F.; Shen, S.; Ding, Y.; Qin, J. Effects of steam curing regimes on the capillary water absorption of concrete: Prediction using multivariable regression models. Constr. Build. Mater. 2020, 256, 119426. [Google Scholar] [CrossRef]
  64. Abyaneh, S.D.; Wong, H.S.; Buenfeld, N.R. Computational investigation of capillary absorption in concrete using a three-dimensional mesoscale approach. Comput. Mater. Sci. 2014, 87, 54–64. [Google Scholar] [CrossRef] [Green Version]
  65. Abyaneh, S.D.; Wong, H.S.; Buenfeld, N.R. Simulating the effect of microcracks on the diffusivity and permeability of concrete using a three-dimensional model. Comput. Mater. Sci. 2016, 119, 130–143. [Google Scholar] [CrossRef]
  66. Akhavan, A.; Shafaatian, S.M.H.; Rajabipour, F. Quantifying the effects of crack width, tortuosity, and roughness on water permeability of cracked mortars. Cem. Concr. Res. 2012, 42, 313–320. [Google Scholar] [CrossRef]
  67. Basheer, L.; Kropp, J.; Cleland, D.J. Assessment of the durability of concrete from its permeation properties: A review. Constr. Build. Mater. 2001, 15, 93–103. [Google Scholar] [CrossRef]
  68. Gardner, D.; Jefferson, A.; Hoffman, A. Investigation of capillary flow in discrete cracks in cementitious materials. Cem. Concr. Res. 2012, 42, 972–981. [Google Scholar] [CrossRef]
  69. Nguyen-Van, V.; Nguyen-Xuan, H.; Panda, B.; Tran, P. 3D concrete printing modelling of thin-walled structures. Structures 2022, 39, 496–511. [Google Scholar] [CrossRef]
  70. Kruger, J.; Zeranka, S.; van Zijl, G. 3D concrete printing: A lower bound analytical model for buildability performance quantification. Autom. Constr. 2019, 106, 102904. [Google Scholar] [CrossRef]
  71. Lee, J.H.; Kim, J.H. Matric suction of fine sand and its effect on the shape stability of 3D printed cement mortar. Constr. Build. Mater. 2022, 341, 127618. [Google Scholar] [CrossRef]
  72. Muthukrishnan, S.; Ramakrishnan, S.; Sanjayan, J. Set on demand geopolymer using print head mixing for 3D concrete printing. Cem. Concr. Compos. 2022, 128, 104451. [Google Scholar] [CrossRef]
  73. Muthukrishnan, S.; Ramakrishnan, S.; Sanjayan, J. Effect of microwave heating on interlayer bonding and buildability of geopolymer 3D concrete printing. Constr. Build. Mater. 2020, 265, 120786. [Google Scholar] [CrossRef]
  74. Muthukrishnan, S.; Ramakrishnan, S.; Sanjayan, J. In-line activation of geopolymer slurry for concrete 3D printing. Cem. Concr. Res. 2022, 162, 107008. [Google Scholar] [CrossRef]
  75. Pham, L.; Tran, P.; Sanjayan, J. Steel fibres reinforced 3D printed concrete: Influence of fibre sizes on mechanical performance. Constr. Build. Mater. 2020, 250, 118785. [Google Scholar] [CrossRef]
  76. Nematollahi, B.; Vijay, P.; Sanjayan, J.; Nazari, A.; Xia, M.; Nerella, V.N.; Mechtcherine, V. Effect of Polypropylene Fibre Addition on Properties of Geopolymers Made by 3D Printing for Digital Construction. Materials 2018, 11, 2352. [Google Scholar] [CrossRef] [PubMed] [Green Version]
  77. Weng, Y.; Li, M.; Liu, Z.; Lao, W.; Lu, B.; Zhang, D.; Tan, M.J. Printability and fire performance of a developed 3D printable fibre reinforced cementitious composites under elevated temperatures. Virtual Phys. Prototyp. 2019, 14, 284–292. [Google Scholar] [CrossRef]
  78. Zheng, W.; Luo, B.; Wang, Y. Microstructure and mechanical properties of RPC containing PP fibres at elevated temperatures. Mag. Concr. Res. 2015, 66, 397–408. [Google Scholar] [CrossRef]
  79. Christ, S.; Schnabel, M.; Vorndran, E.; Groll, J.; Gbureck, U. Fiber reinforcement during 3D printing. Mater. Lett. 2015, 139, 165–168. [Google Scholar] [CrossRef]
  80. Panda, B.; Paul, S.C.; Tan, M.J. Anisotropic mechanical performance of 3D printed fiber reinforced sustainable construction material. Mater. Lett. 2017, 209, 146–149. [Google Scholar] [CrossRef]
  81. Li, L.G.; Xiao, B.F.; Fang, Z.Q.; Xiong, Z.; Chu, S.H.; Kwan, A.K.H. Feasibility of glass/basalt fiber reinforced seawater coral sand mortar for 3D printing. Addit. Manuf. 2021, 37, 101684. [Google Scholar] [CrossRef]
  82. Shakor, P.; Nejadi, S.; Paul, G.; Gowripalan, N. Effects of Different Orientation Angle, Size, Surface Roughness, and Heat Curing on Mechanical Behavior of 3D Printed Cement Mortar with/without Glass Fiber in Powder-Based 3DP. 3D Print Addit. Manuf. 2021, 0, 1–10. [Google Scholar] [CrossRef]
  83. Lv, C.; Shen, H.; Liu, J.; Wu, D.; Qu, E.; Liu, S. Properties of 3D Printing Fiber-Reinforced Geopolymers Based on Interlayer Bonding and Anisotropy. Materials 2022, 15, 8032. [Google Scholar] [CrossRef] [PubMed]
  84. Kong, X.; Dai, L.; Wang, Y.; Qiao, D.; Hou, S.; Wang, S. Influence of kenaf stalk on printability and performance of 3D printed industrial tailings based geopolymer. Constr. Build. Mater. 2022, 315, 125787. [Google Scholar] [CrossRef]
  85. Long, W.J.; Tao, J.-L.; Lin, C.; Gu, Y.-C.; Mei, L.; Duan, H.-B.; Xing, F. Rheology and buildability of sustainable cement-based composites containing micro-crystalline cellulose for 3D-printing. J. Clean. Prod. 2019, 239, 118054. [Google Scholar] [CrossRef]
  86. Sinka, M.; Zorica, J.; Bajare, D.; Sahmenko, G.; Korjakins, A. Fast Setting Binders for Application in 3D Printing of Bio-Based Building Materials. Sustainability 2020, 12, 8838. [Google Scholar] [CrossRef]
  87. Nam, Y.J.; Hwang, Y.K.; Park, J.W.; Lim, Y.M. Fiber-Reinforced Cementitious Composite Design with Controlled Distribution and Orientation of Fibers Using Three-Dimensional Printing Technology. In 3D Concrete Printing Technology; Elsevier: Amsterdam, The Netherlands, 2019; pp. 59–72. [Google Scholar] [CrossRef]
  88. Hambach, M.; Volkmer, D. Properties of 3D-printed fiber-reinforced Portland cement paste. Cem. Concr. Compos. 2017, 79, 62–70. [Google Scholar] [CrossRef]
  89. Nematollahi, B.; Xia, M.; Sanjayan, J.; Vijay, P. Effect of Type of Fiber on Inter-Layer Bond and Flexural Strengths of Extrusion-Based 3D Printed Geopolymer. Mater. Sci. Forum 2018, 939, 155–162. [Google Scholar] [CrossRef]
  90. Lesovik, V.; Fediuk, R.; Amran, M.; Alaskhanov, A.; Volodchenko, A.; Murali, G.; Uvarov, V.; Elistratkin, M. 3D-Printed Mortars with Combined Steel and Polypropylene Fibers. Fibers 2021, 9, 79. [Google Scholar] [CrossRef]
  91. Moustafa, A.; Elgawady, M.A. Mechanical properties of high strength concrete with scrap tire rubber. Constr. Build. Mater. 2015, 93, 249–256. [Google Scholar] [CrossRef]
  92. Ghabezi, P.; Flanagan, T.; Harrison, N. Short basalt fibre reinforced recycled polypropylene filaments for 3D printing. Mater. Lett. 2022, 326, 132942. [Google Scholar] [CrossRef]
  93. Ting, G.H.A.; Quah, T.K.N.; Lim, J.H.; Tay, Y.W.D.; Tan, M.J. Extrudable region parametrical study of 3D printable concrete using recycled glass concrete. J. Build. Eng. 2022, 50, 104091. [Google Scholar] [CrossRef]
  94. Bai, G.; Wang, L.; Ma, G.; Sanjayan, J.; Bai, M. 3D printing eco-friendly concrete containing under-utilised and waste solids as aggregates. Cem. Concr. Compos. 2021, 120, 104037. [Google Scholar] [CrossRef]
  95. Ting, G.H.A.; Tay, Y.W.D.; Qian, Y.; Tan, M.J. Utilization of recycled glass for 3D concrete printing: Rheological and mechanical properties. J. Mater. Cycles Waste Manag. 2019, 21, 994–1003. [Google Scholar] [CrossRef]
  96. Li, Z.; Wang, L.; Ma, G. Mechanical improvement of continuous steel microcable reinforced geopolymer composites for 3D printing subjected to different loading conditions. Compos. B Eng. 2020, 187, 107796. [Google Scholar] [CrossRef]
  97. Bos, F.; Ahmed, Z.; Jutinov, E.; Salet, T. Experimental Exploration of Metal Cable as Reinforcement in 3D Printed Concrete. Materials 2017, 10, 1314. [Google Scholar] [CrossRef] [PubMed] [Green Version]
  98. Hojati, M.; Memari, A.M.; Zahabi, M.; Wu, Z.; Li, Z.; Park, K.; Nazarian, S.; Duarte, J.P. Barbed-wire reinforcement for 3D concrete printing. Autom. Constr. 2022, 141, 104438. [Google Scholar] [CrossRef]
  99. Xiao, J.; Chen, Z.; Ding, T.; Zou, S. Bending behaviour of steel cable reinforced 3D printed concrete in the direction perpendicular to the interfaces. Cem. Concr. Compos. 2022, 125, 104313. [Google Scholar] [CrossRef]
  100. Austin, S.; Buswell, R.; Le, T.; Wackrow, R.; Austin, S.; Gibb, A.; Thorpe, T. Development of a viable concrete printing process. In Proceedings of the 28th International Symposium on Automation and Robotics in Construction (ISARC 2011), Seoul, Republic of Korea, 29 June–2 July 2011; pp. 665–670. [Google Scholar] [CrossRef] [Green Version]
  101. Wang, L.; Ma, G.; Liu, T.; Buswell, R.; Li, Z. Interlayer reinforcement of 3D printed concrete by the in-process deposition of U-nails. Cem. Concr. Res. 2021, 148, 106535. [Google Scholar] [CrossRef]
  102. Asprone, D.; Auricchio, F.; Menna, C.; Mercuri, V. 3D printing of reinforced concrete elements: Technology and design approach. Constr. Build. Mater. 2018, 165, 218–231. [Google Scholar] [CrossRef]
  103. Salet, T.A.M.; Ahmed, Z.Y.; Bos, F.P.; Laagland, H.L.M. Design of a 3D printed concrete bridge by testing. Virtual Phys. Prototyp. 2018, 13, 222–236. [Google Scholar] [CrossRef] [Green Version]
  104. Marchment, T.; Sanjayan, J. Mesh reinforcing method for 3D Concrete Printing. Autom. Constr. 2020, 109, 102992. [Google Scholar] [CrossRef]
  105. Liu, M.; Wang, L.; Ma, G.; Li, W.; Zhou, Y. U-type steel wire mesh for the flexural performance enhancement of 3D printed concrete: A novel reinforcing approach. Mater. Lett. 2023, 331, 133429. [Google Scholar] [CrossRef]
  106. Kruger, J.; Cho, S.; Zeranka, S.; Viljoen, C.; van Zijl, G. 3D concrete printer parameter optimisation for high rate digital construction avoiding plastic collapse. Compos. B Eng. 2020, 183, 107660. [Google Scholar] [CrossRef]
  107. Tripathi, A.; Nair, S.A.O.; Neithalath, N. A comprehensive analysis of buildability of 3D-printed concrete and the use of bi-linear stress-strain criterion-based failure curves towards their prediction. Cem. Concr. Compos. 2022, 128, 104424. [Google Scholar] [CrossRef]
  108. Liu, Z.; Li, M.; Wong, T.N.; Tan, M.J. Towards additive manufacturing: Pumping flow rate with time-dependent material rheology in 3d cementitious material printing. Mater. Sci. Forum 2018, 941, 2131–2136. [Google Scholar] [CrossRef]
  109. Tay, Y.W.D.; Li, M.Y.; Tan, M.J. Effect of printing parameters in 3D concrete printing: Printing region and support structures. J. Mater. Process. Technol. 2019, 271, 261–270. [Google Scholar] [CrossRef]
  110. Tay, Y.W.D.; Qian, Y.; Tan, M.J. Printability region for 3D concrete printing using slump and slump flow test. Compos. B Eng. 2019, 174, 106968. [Google Scholar] [CrossRef]
  111. el Cheikh, K.; Rémond, S.; Khalil, N.; Aouad, G. Numerical and experimental studies of aggregate blocking in mortar extrusion. Constr. Build. Mater. 2017, 145, 452–463. [Google Scholar] [CrossRef]
  112. Khalil, N.; Aouad, G.; el Cheikh, K.; Rémond, S. Use of calcium sulfoaluminate cements for setting control of 3D-printing mortars. Constr. Build. Mater. 2017, 157, 382–391. [Google Scholar] [CrossRef]
  113. Zuriguel, I.; Garcimartín, A.; Maza, D.; Pugnaloni, L.A.; Pastor, J.M. Jamming during the discharge of granular matter from a silo. Phys. Rev. E 2005, 71, 051303. Available online: https://www.academia.edu/16258758/Jamming_during_the_discharge_of_granular_matter_from_a_silo (accessed on 27 November 2022). [CrossRef] [PubMed] [Green Version]
  114. Perrot, A.; Lanos, C.; Melinge, Y.; Estellé, P. Mortar physical properties evolution in extrusion flow. Rheol. Acta 2007, 46, 1065–1073. [Google Scholar] [CrossRef] [Green Version]
  115. Jayathilakage, R.; Rajeev, P.; Sanjayan, J. Rheometry for Concrete 3D Printing: A Review and an Experimental Comparison. Buildings 2022, 12, 1190. [Google Scholar] [CrossRef]
  116. Liu, Z.; Li, M.; Weng, Y.; Qian, Y.; Wong, T.N.; Tan, M.J. Modelling and parameter optimization for filament deformation in 3D cementitious material printing using support vector machine. Compos. B Eng. 2020, 193, 108018. [Google Scholar] [CrossRef]
  117. Liu, Z.; Li, M.; Tay, Y.W.D.; Weng, Y.; Wong, T.N.; Tan, M.J. Rotation nozzle and numerical simulation of mass distribution at corners in 3D cementitious material printing. Addit. Manuf. 2020, 34, 101190. [Google Scholar] [CrossRef]
  118. Ahmed, Z.Y.; Bos, F.P.; Wolfs, R.J.M.; Salet, T.A.M. Design considerations due to scale effects in 3D concrete printing. In Proceedings of the 8th International Conference of the Arab Society for Computer Aided Architectural Design (ASCAAD 2016), London, UK, 7–8 November 2016. [Google Scholar]
  119. Ma, G.; Li, Z.; Wang, L. Printable properties of cementitious material containing copper tailings for extrusion based 3D printing. Constr. Build. Mater. 2018, 162, 613–627. [Google Scholar] [CrossRef]
  120. Nair, S.A.O.; Panda, S.; Santhanam, M.; Sant, G.; Neithalath, N. A critical examination of the influence of material characteristics and extruder geometry on 3D printing of cementitious binders. Cem. Concr. Compos. 2020, 112, 103671. [Google Scholar] [CrossRef]
  121. Kaplan, D.; de Larrard, F.; Sedran, T. Design of Concrete Pumping Circuit. Mater. J. 2005, 102, 110–117. [Google Scholar] [CrossRef]
  122. Perrot, A.; Mélinge, Y.; Estellé, P.; Lanos, C. Vibro-extrusion: A new forming process for cement-based materials. Adv. Cem. Res. 2009, 21, 125–133. [Google Scholar] [CrossRef]
  123. Mohan, M.K.; Rahul, A.V.; van Tittelboom, K.; de Schutter, G. Rheological and pumping behaviour of 3D printable cementitious materials with varying aggregate content. Cem. Concr. Res. 2021, 139, 106258. [Google Scholar] [CrossRef]
  124. de Schutter, G.; Feys, D. Pumping of Fresh Concrete: Insights and Challenges. RILEM Tech. Lett. 2016, 1, 76–80. [Google Scholar] [CrossRef] [Green Version]
  125. Le, H.D.; Kadri, E.H.; Aggoun, S.; Vierendeels, J.; Troch, P.; de Schutter, G. Effect of lubrication layer on velocity profile of concrete in a pumping pipe. Mater. Struct. Mater. Constr. 2015, 48, 3991–4003. [Google Scholar] [CrossRef]
  126. Mechtcherine, V.; Bos, F.; Perrot, A.; da Silva, W.L.; Nerella, V.; Fataei, S.; Wolfs, R.; Sonebi, M.; Roussel, N. Extrusion-based additive manufacturing with cement-based materials—Production steps, processes, and their underlying physics: A review. Cem. Concr. Res. 2020, 132, 106037. [Google Scholar] [CrossRef]
  127. Roussel, N. Rheological requirements for printable concretes. Cem. Concr. Res. 2018, 112, 76–85. [Google Scholar] [CrossRef]
  128. Srinivasan, R.; DeFord, D.; Shah, S. The use of extrusion rheometry in the development of extruded fiber-reinforced cement composites. Concr. Sci. Eng. 1999, 1, 26–36. [Google Scholar]
  129. Kuder, K.G.; Shah, S.P. Rheology of Extruded Cement-Based Materials. Mater. J. 2007, 104, 283–290. [Google Scholar] [CrossRef]
  130. Menna, C.; Mata-Falcón, J.; Bos, F.P.; Vantyghem, G.; Ferrara, L.; Asprone, D.; Salet, T.; Kaufmann, W. Opportunities and challenges for structural engineering of digitally fabricated concrete. Cem. Concr. Res. 2020, 133, 106079. [Google Scholar] [CrossRef]
  131. Rahul, A.V.; Narayan, S.P.A.; Neithalath, N.; Santhanam, M. A thermodynamic framework for modelling thixotropic yield stress fluids: Application to cement pastes. J. Non Newton. Fluid Mech. 2020, 281, 104318. [Google Scholar] [CrossRef]
  132. Jiang, Q. Effects of air entrainment on rheology. Mater. J. 2004, 101, 448–456. Available online: https://www.researchgate.net/publication/288569745 (accessed on 20 February 2023).
  133. Qian, Y.; de Schutter, G. Enhancing thixotropy of fresh cement pastes with nanoclay in presence of polycarboxylate ether superplasticizer (PCE). Cem. Concr. Res. 2018, 111, 15–22. [Google Scholar] [CrossRef]
  134. Qian, Y.; Ma, S.; Kawashima, S.; de Schutter, G. Rheological characterization of the viscoelastic solid-like properties of fresh cement pastes with nanoclay addition. Theor. Appl. Fract. Mech. 2019, 103, 102262. [Google Scholar] [CrossRef]
  135. Wolfs, R.J.M.; Bos, F.P.; van Strien, E.C.F.; Salet, T.A.M. A real-time height measurement and feedback system for 3D concrete printing. In High Tech Concrete: Where Technology and Engineering Meet: Proceedings of the 2017 fib Symposium, Held in Maastricht, The Netherlands, 12–14 June 2017; Springer International Publishing: Berlin/Heidelberg, Germany, 2017; pp. 2474–2483. [Google Scholar] [CrossRef]
  136. Rill-García, R.; Dokladalova, E.; Dokládal, P.; Caron, J.-F.; Mesnil, R.; Margerit, P.; Charrier, M. Inline monitoring of 3D concrete printing using computer vision. Addit. Manuf. 2022, 60, 103175. [Google Scholar] [CrossRef]
  137. Dong, C.-Z.; Catbas, F.N. A review of computer vision–based structural health monitoring at local and global levels. Struct. Health Monit. 2021, 20, 692–743. [Google Scholar] [CrossRef]
  138. Nor, N.M.; Hussain, M.A.; Hassan, C.R.C. Fault diagnosis and classification framework using multi-scale classification based on kernel Fisher discriminant analysis for chemical process system. Appl. Soft Comput. 2017, 61, 959–972. [Google Scholar] [CrossRef]
  139. Burdzik, R. A comprehensive diagnostic system for vehicle suspensions based on a neural classifier and wavelet resonance estimators. Measurement 2022, 200, 111602. [Google Scholar] [CrossRef]
  140. Kang, Z.; Catal, C.; Tekinerdogan, B. Product failure detection for production lines using a data-driven model. Expert Syst. Appl. 2022, 202, 117398. [Google Scholar] [CrossRef]
  141. Image Pre-Processing. Available online: https://www.embedded-vision.com/sites/default/files/apress/computervisionmetrics/chapter2/9781430259299_Ch02.pdf (accessed on 11 January 2023).
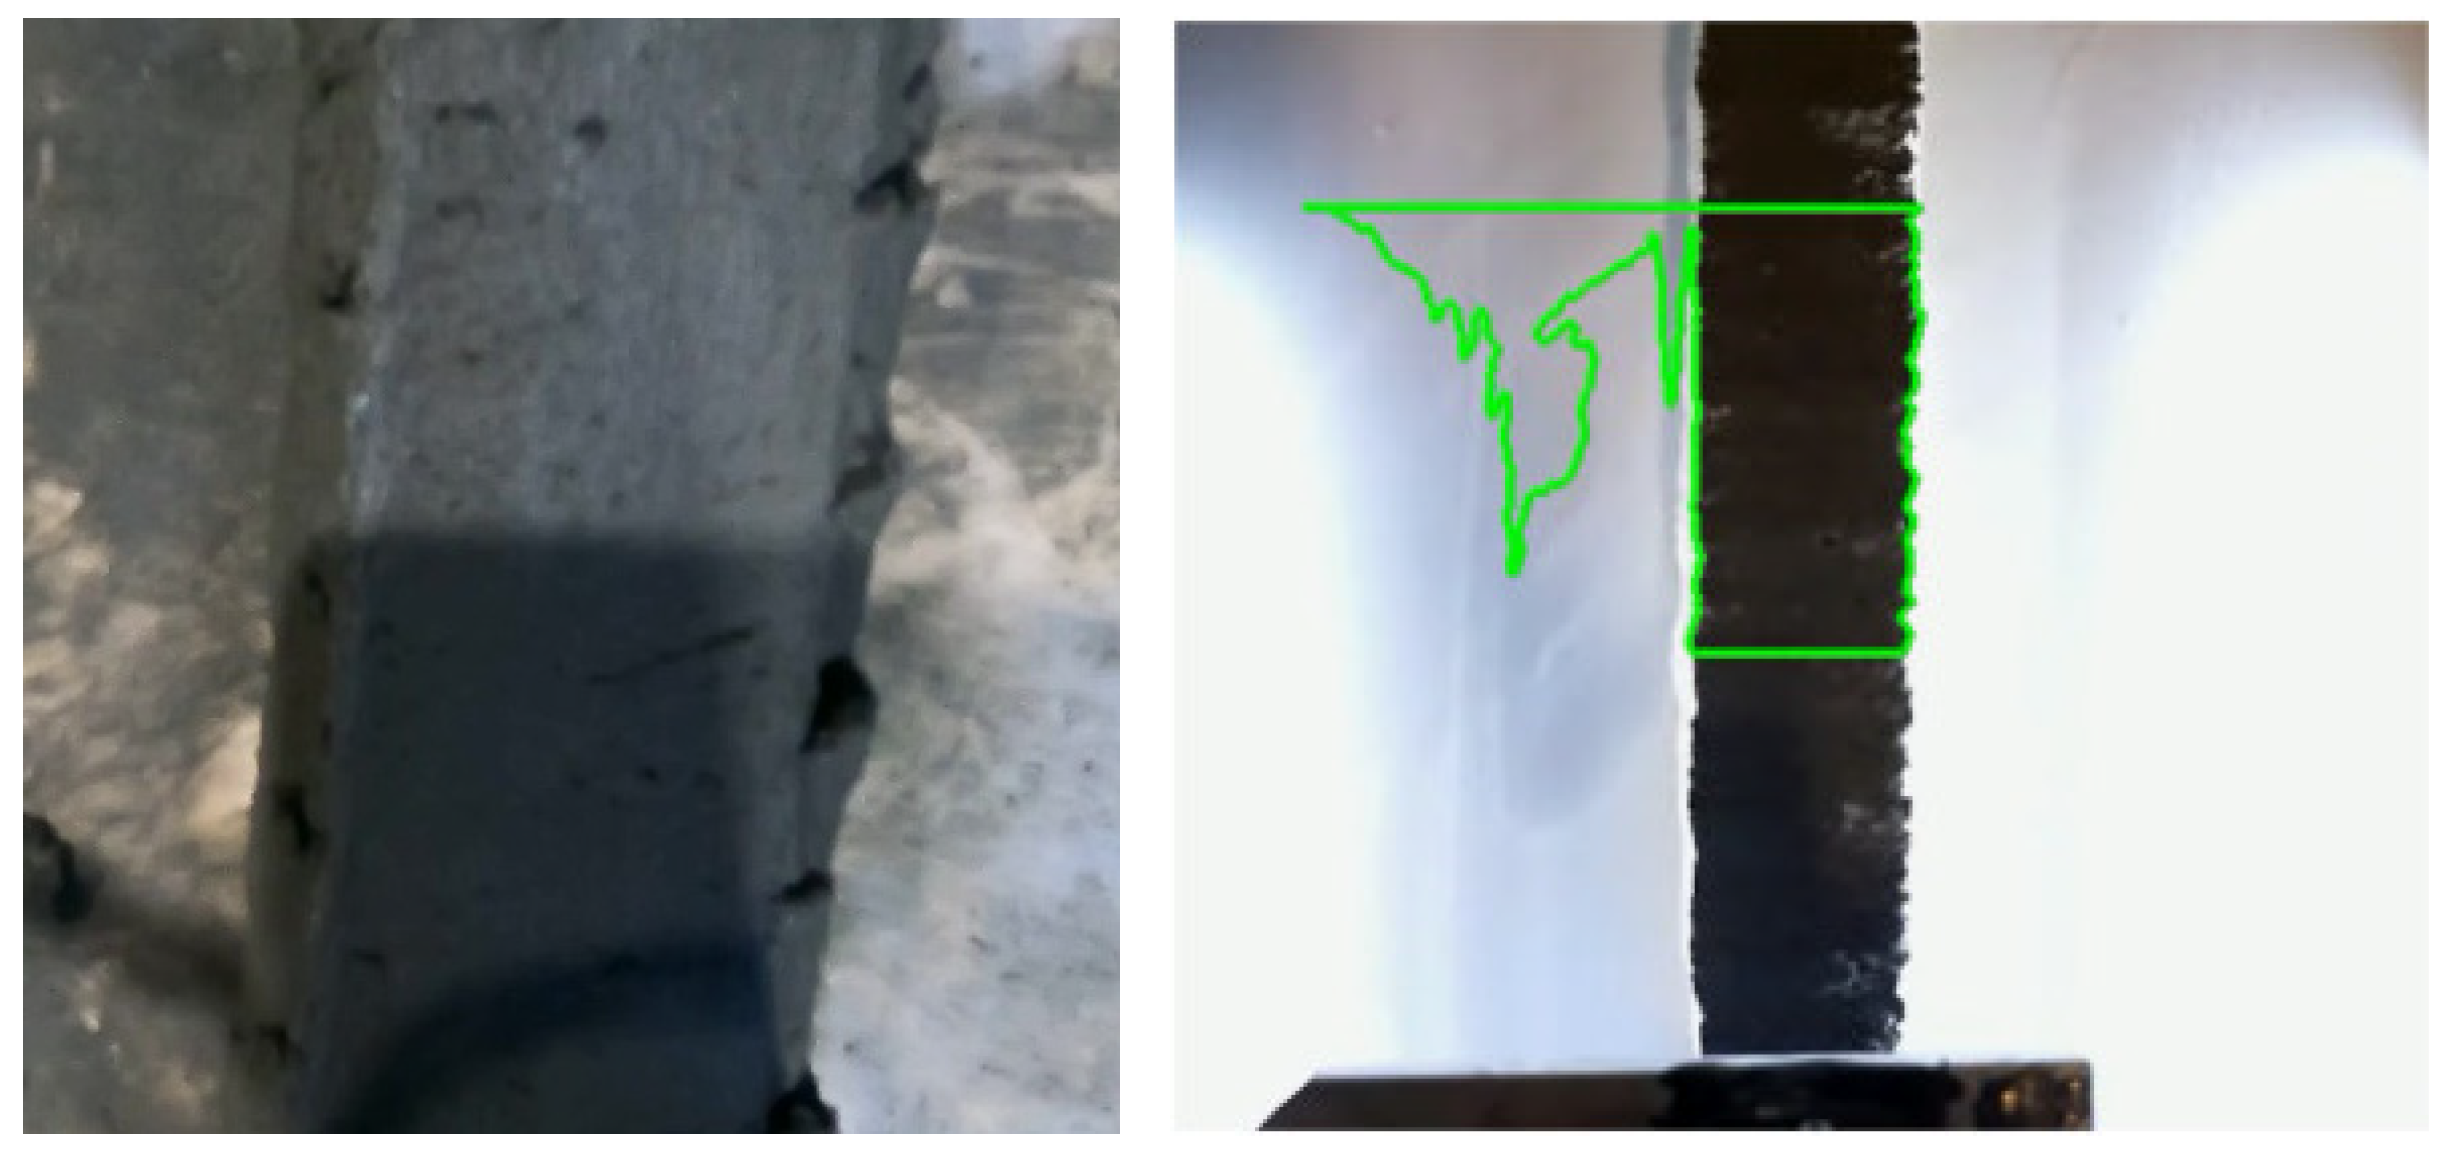
  142. Nair, S.A.O.; Sant, G.; Neithalath, N. Mathematical morphology-based point cloud analysis techniques for geometry assessment of 3D printed concrete elements. Addit. Manuf. 2022, 49, 102499. [Google Scholar] [CrossRef]
  143. Mneymneh, B.E.; Abbas, M.; Khoury, H. Vision-Based Framework for Intelligent Monitoring of Hardhat Wearing on Construction Sites. J. Comput. Civ. Eng. 2018, 33, 04018066. [Google Scholar] [CrossRef]
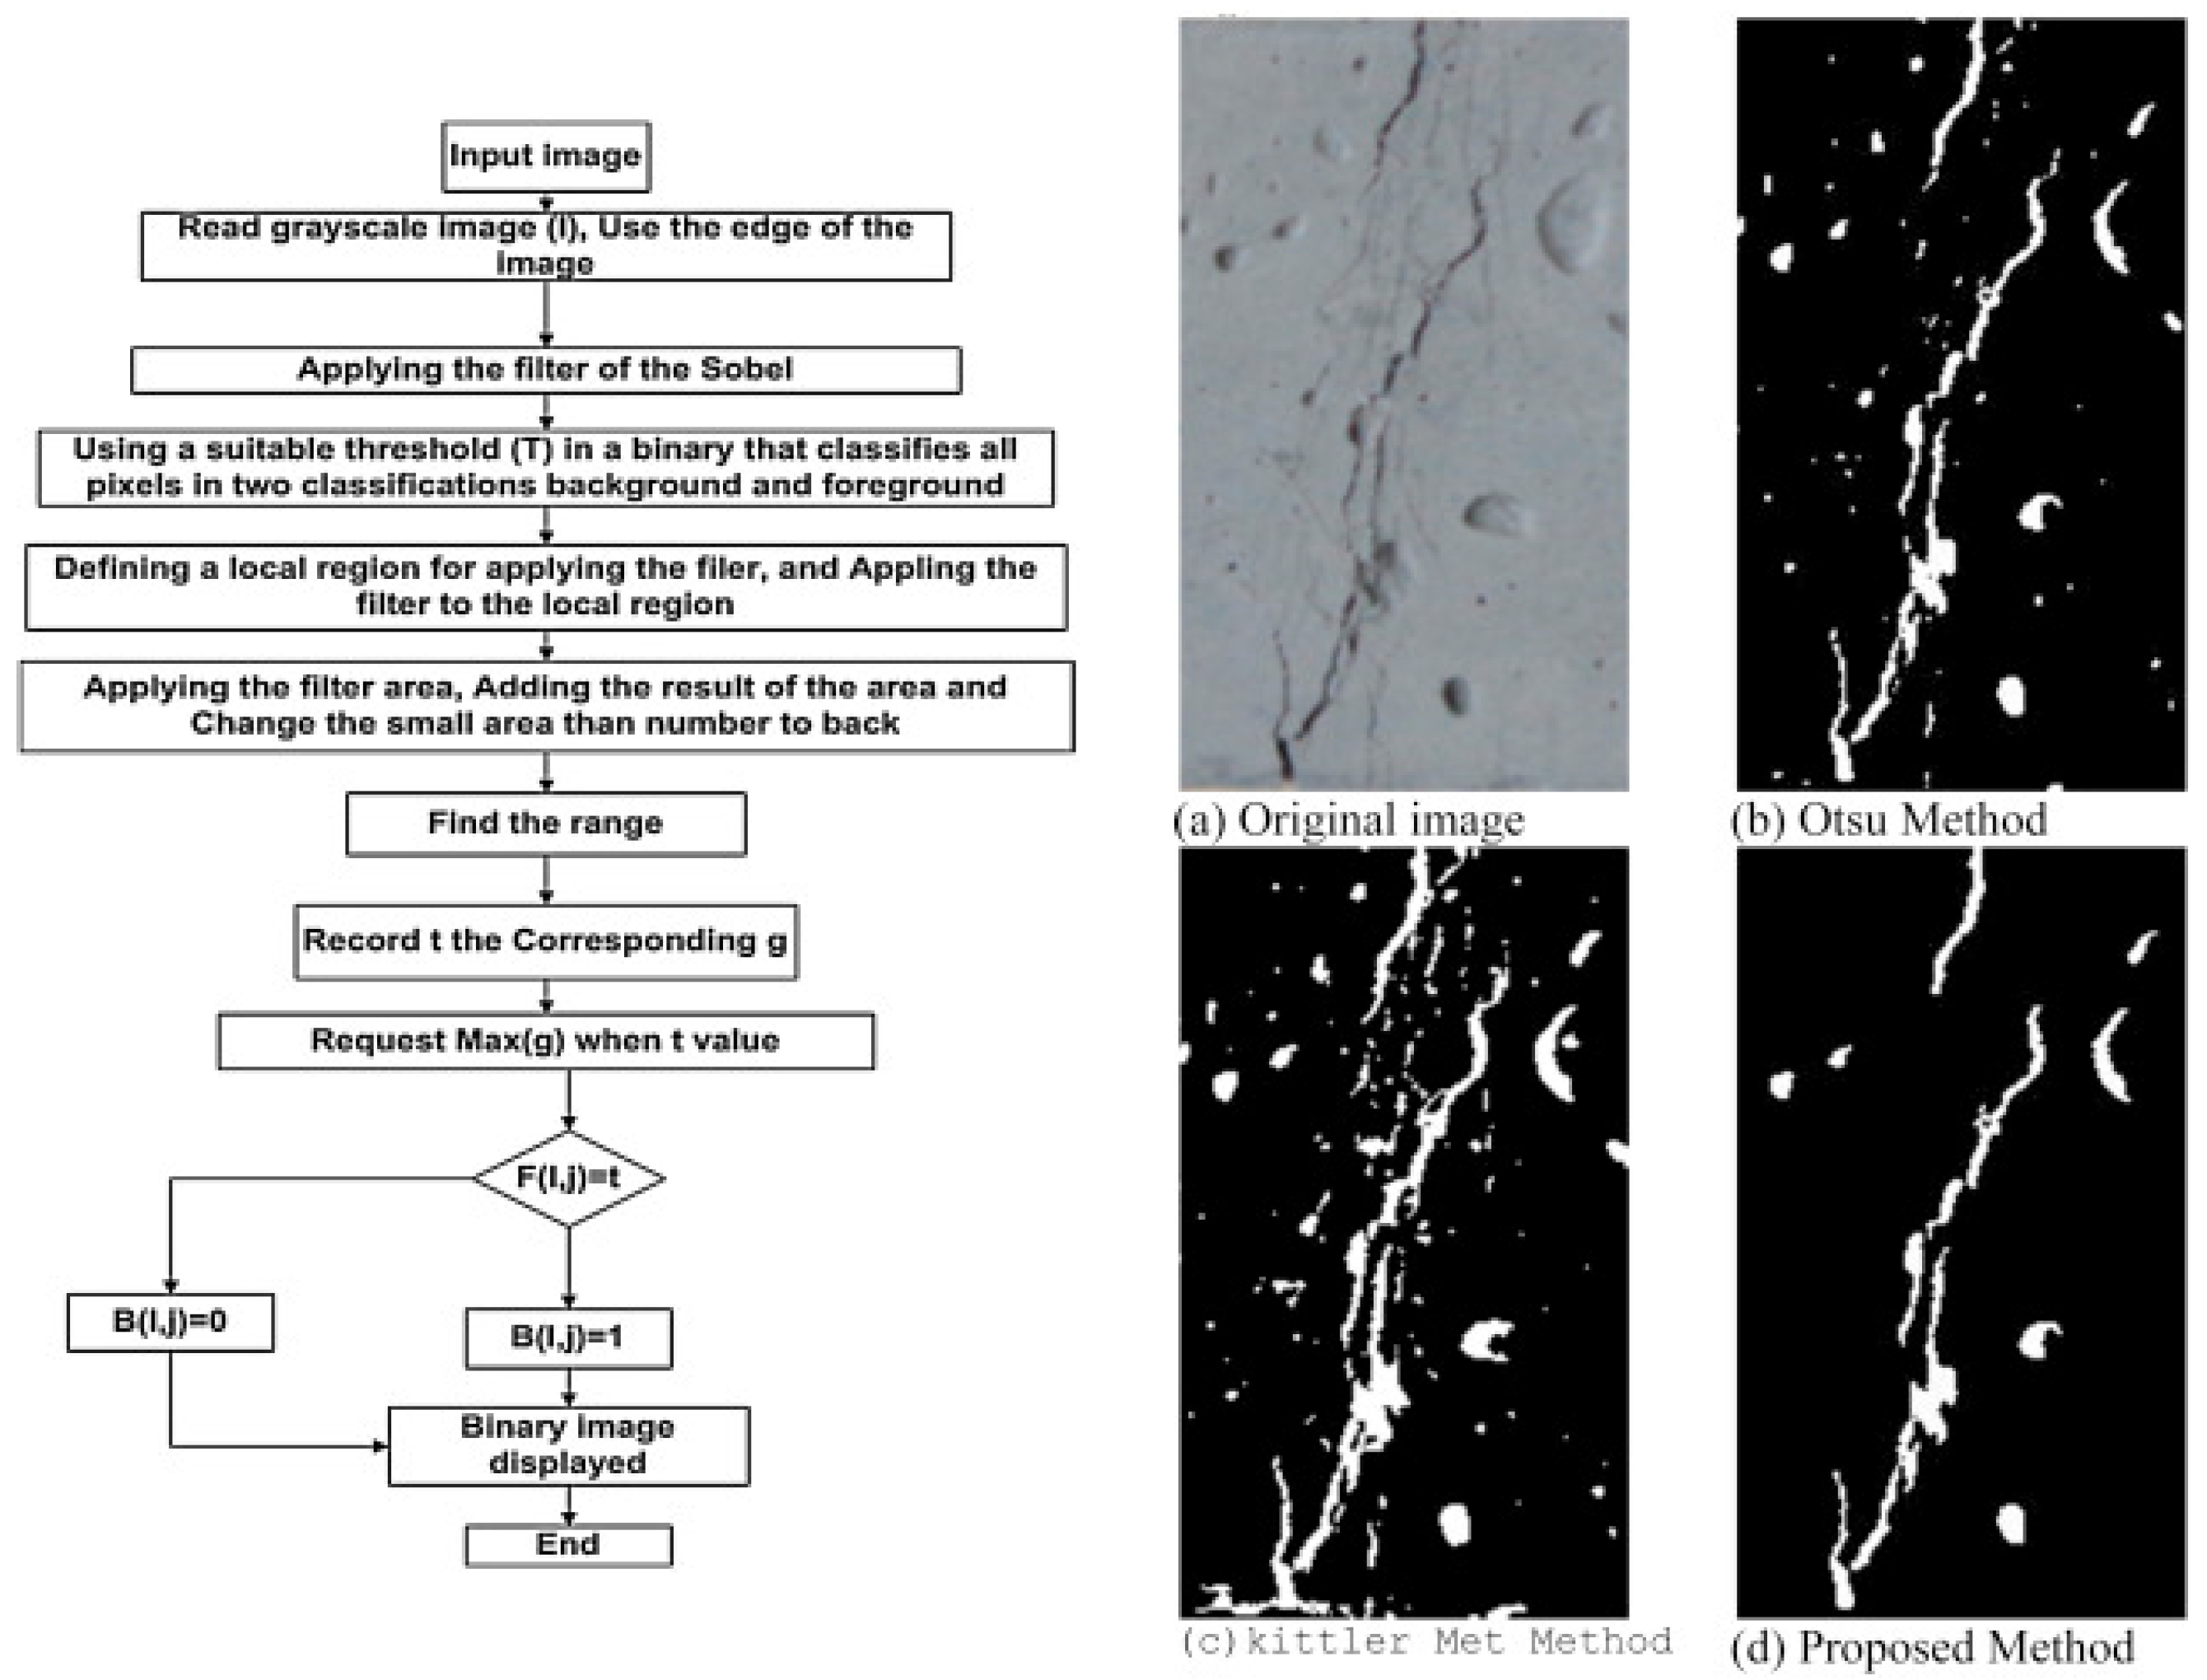
  144. Talab, A.M.A.; Huang, Z.; Xi, F.; HaiMing, L. Detection crack in image using Otsu method and multiple filtering in image processing techniques. Optik 2016, 127, 1030–1033. [Google Scholar] [CrossRef]
  145. Garfo, S.; Muktadir, M.A.; Yi, S. Defect Detection on 3D Print Products and in Concrete Structures Using Image Processing and Convolution Neural Network. J. Mechatron. Robot. 2020, 4, 74–84. [Google Scholar] [CrossRef]
  146. Davtalab, O.; Kazemian, A.; Yuan, X.; Khoshnevis, B. Automated inspection in robotic additive manufacturing using deep learning for layer deformation detection. J. Intell. Manuf. 2022, 33, 771–784. [Google Scholar] [CrossRef]
  147. Martinez, J.G.; Albeaino, G.; Gheisari, M.; Issa, R.R.A.; Alarcón, L.F. iSafeUAS: An unmanned aerial system for construction safety inspection. Autom. Constr. 2021, 125, 103595. [Google Scholar] [CrossRef]
  148. Omar, H.; Mahdjoubi, L.; Kheder, G. Towards an automated photogrammetry-based approach for monitoring and controlling construction site activities. Comput. Ind. 2018, 98, 172–182. [Google Scholar] [CrossRef]
  149. Bayrak, T.; Kaka, A. Evaluation of digital photogrammetry and 3D CAD modelling applications in construction management. In Proceedings of the 20th Annual ARCOM Conference, Edinburgh, UK, 1–3 September 2004. [Google Scholar]
  150. Aldao, E.; González-Jorge, H.; Pérez, J.A. Metrological comparison of LiDAR and photogrammetric systems for deformation monitoring of aerospace parts. Measurement 2021, 174, 109037. [Google Scholar] [CrossRef]
  151. Cucci, D.A.; Rehak, M.; Skaloud, J. Bundle adjustment with raw inertial observations in UAV applications. ISPRS J. Photogramm. Remote Sens. 2017, 130, 1–12. [Google Scholar] [CrossRef]
  152. Kume, H.; Sato, T.; Yokoya, N. Bundle adjustment using aerial images with two-stage geometric verification. Comput. Vis. Image Underst. 2015, 138, 74–84. [Google Scholar] [CrossRef] [Green Version]
  153. Marschner, S. Light Reflection and Illumination, CS 4620 Lecture 23 Cornell CS4620. 2014. Available online: https://www.cs.cornell.edu/courses/cs4620/2014fa/lectures/23reflection.pdf (accessed on 20 February 2023).
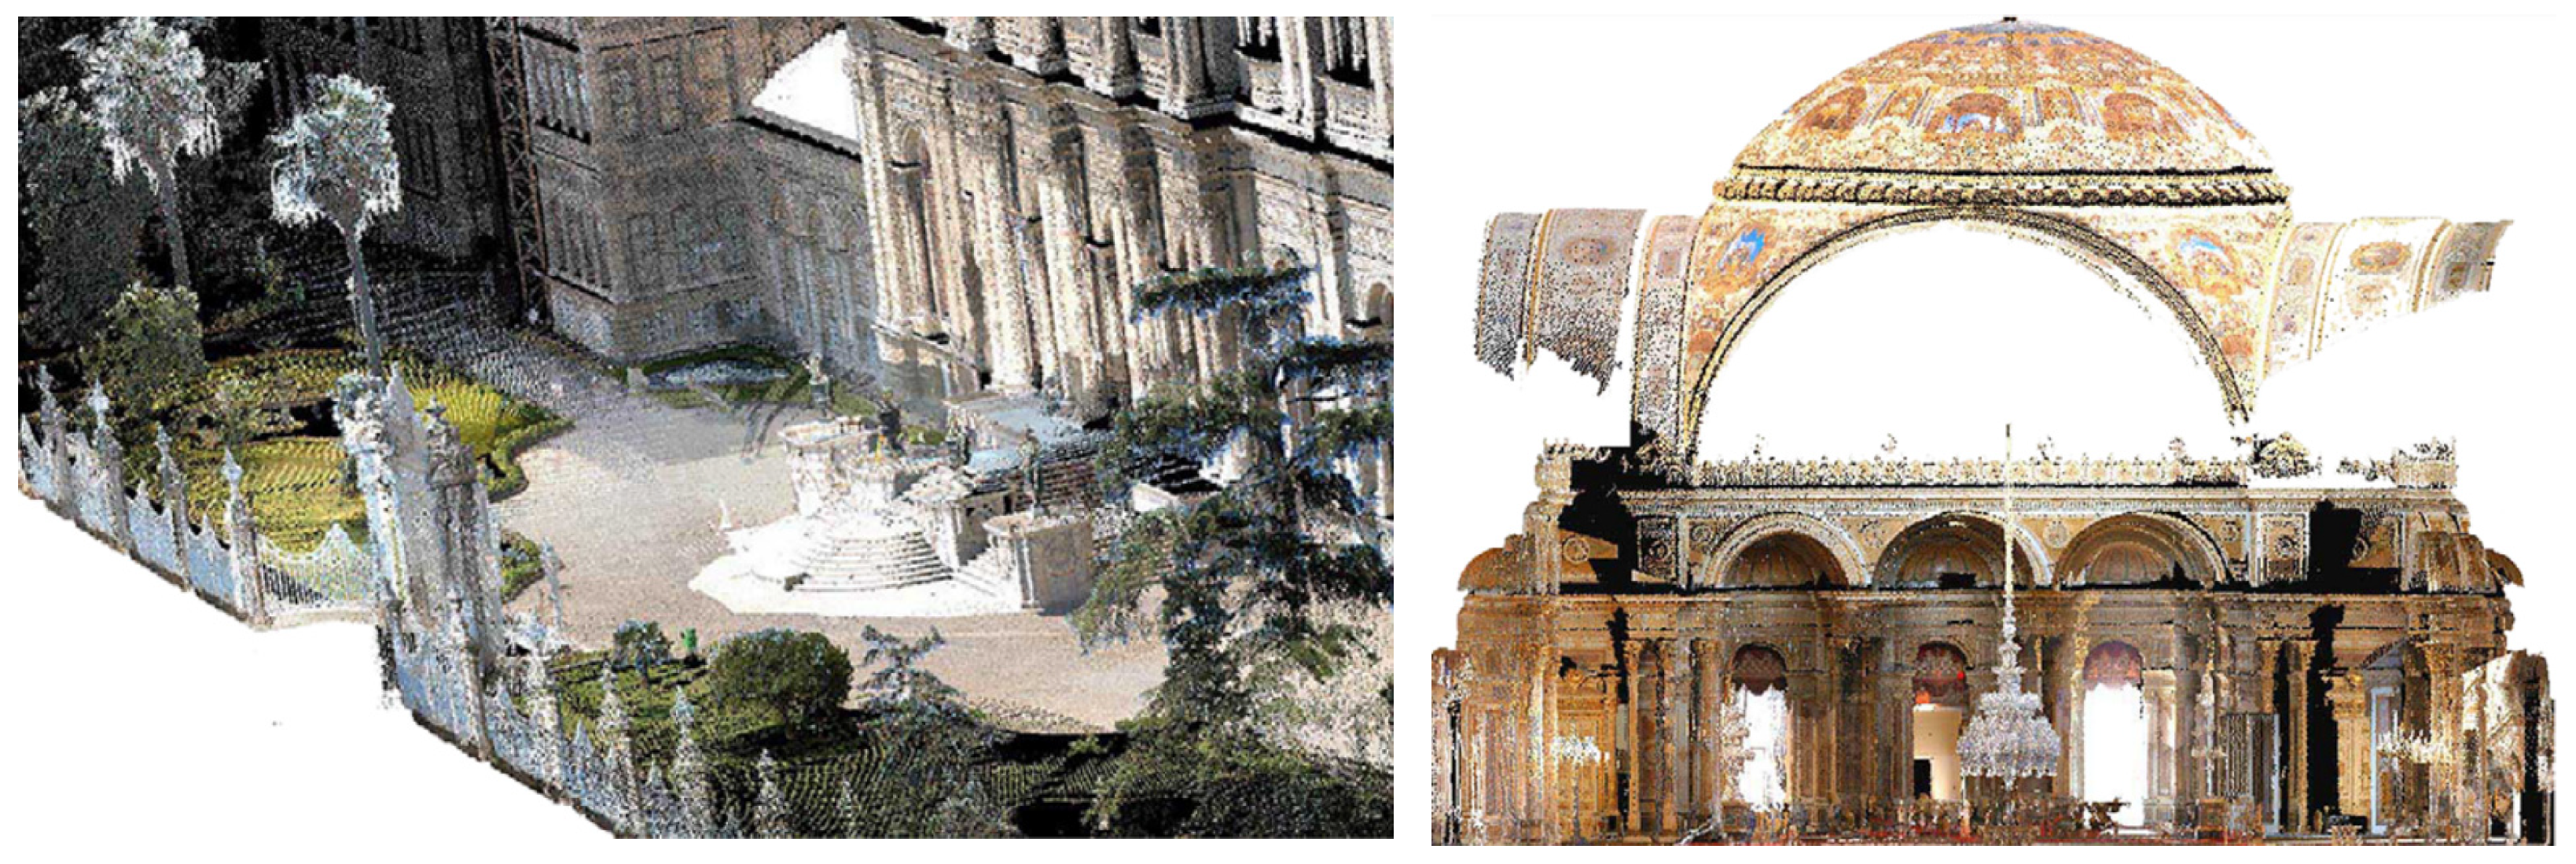
  154. Aicardi, I.; Chiabrando, F.; Lingua, A.M.; Noardo, F. Recent trends in cultural heritage 3D survey: The photogrammetric computer vision approach. J. Cult. Herit. 2018, 32, 257–266. [Google Scholar] [CrossRef]
  155. Fang, W.; Ma, L.; Love, P.E.D.; Luo, H.; Ding, L.; Zhou, A. Knowledge graph for identifying hazards on construction sites: Integrating computer vision with ontology. Autom. Constr. 2020, 119, 103310. [Google Scholar] [CrossRef]
  156. Golnabi, H.; Asadpour, A. Design and application of industrial machine vision systems. Robot. Comput. Integr. Manuf. 2007, 23, 630–637. [Google Scholar] [CrossRef]
  157. Lao, W.; Li, M.; Tjahjowidodo, T. Variable-geometry nozzle for surface quality enhancement in 3D concrete printing. Addit. Manuf. 2021, 37, 101638. [Google Scholar] [CrossRef]
  158. Zhang, X.; Li, M.; Lim, J.H.; Weng, Y.; Tay, Y.W.D.; Pham, H.; Pham, Q.-C. Large-scale 3D printing by a team of mobile robots. Autom. Constr. 2018, 95, 98–106. [Google Scholar] [CrossRef]
  159. Printing-While-Moving: A New Paradigm for Large-Scale Robotic 3D Printing. Available online: https://www.researchgate.net/publication/327835498_Printing-while-moving_a_new_paradigm_for_large-scale_robotic_3D_Printing (accessed on 17 April 2021).
  160. Senthilnathan, S.; Raphael, B. Using Computer Vision for Monitoring the Quality of 3D-Printed Concrete Structures. Sustainability 2022, 14, 15682. [Google Scholar] [CrossRef]
  161. Buswell, R.; Kinnell, P.; Xu, J.; Hack, N.; Kloft, H.; Maboudi, M.; Gerke, M.; Massin, P.; Grasser, G.; Wolfs, R.; et al. Inspection Methods for 3D Concrete Printing. In Second RILEM International Conference on Concrete and Digital Fabrication: Digital Concrete; Springer International Publishing: Berlin/Heidelberg, Germany, 2020; Volume 28, pp. 790–803. [Google Scholar] [CrossRef]
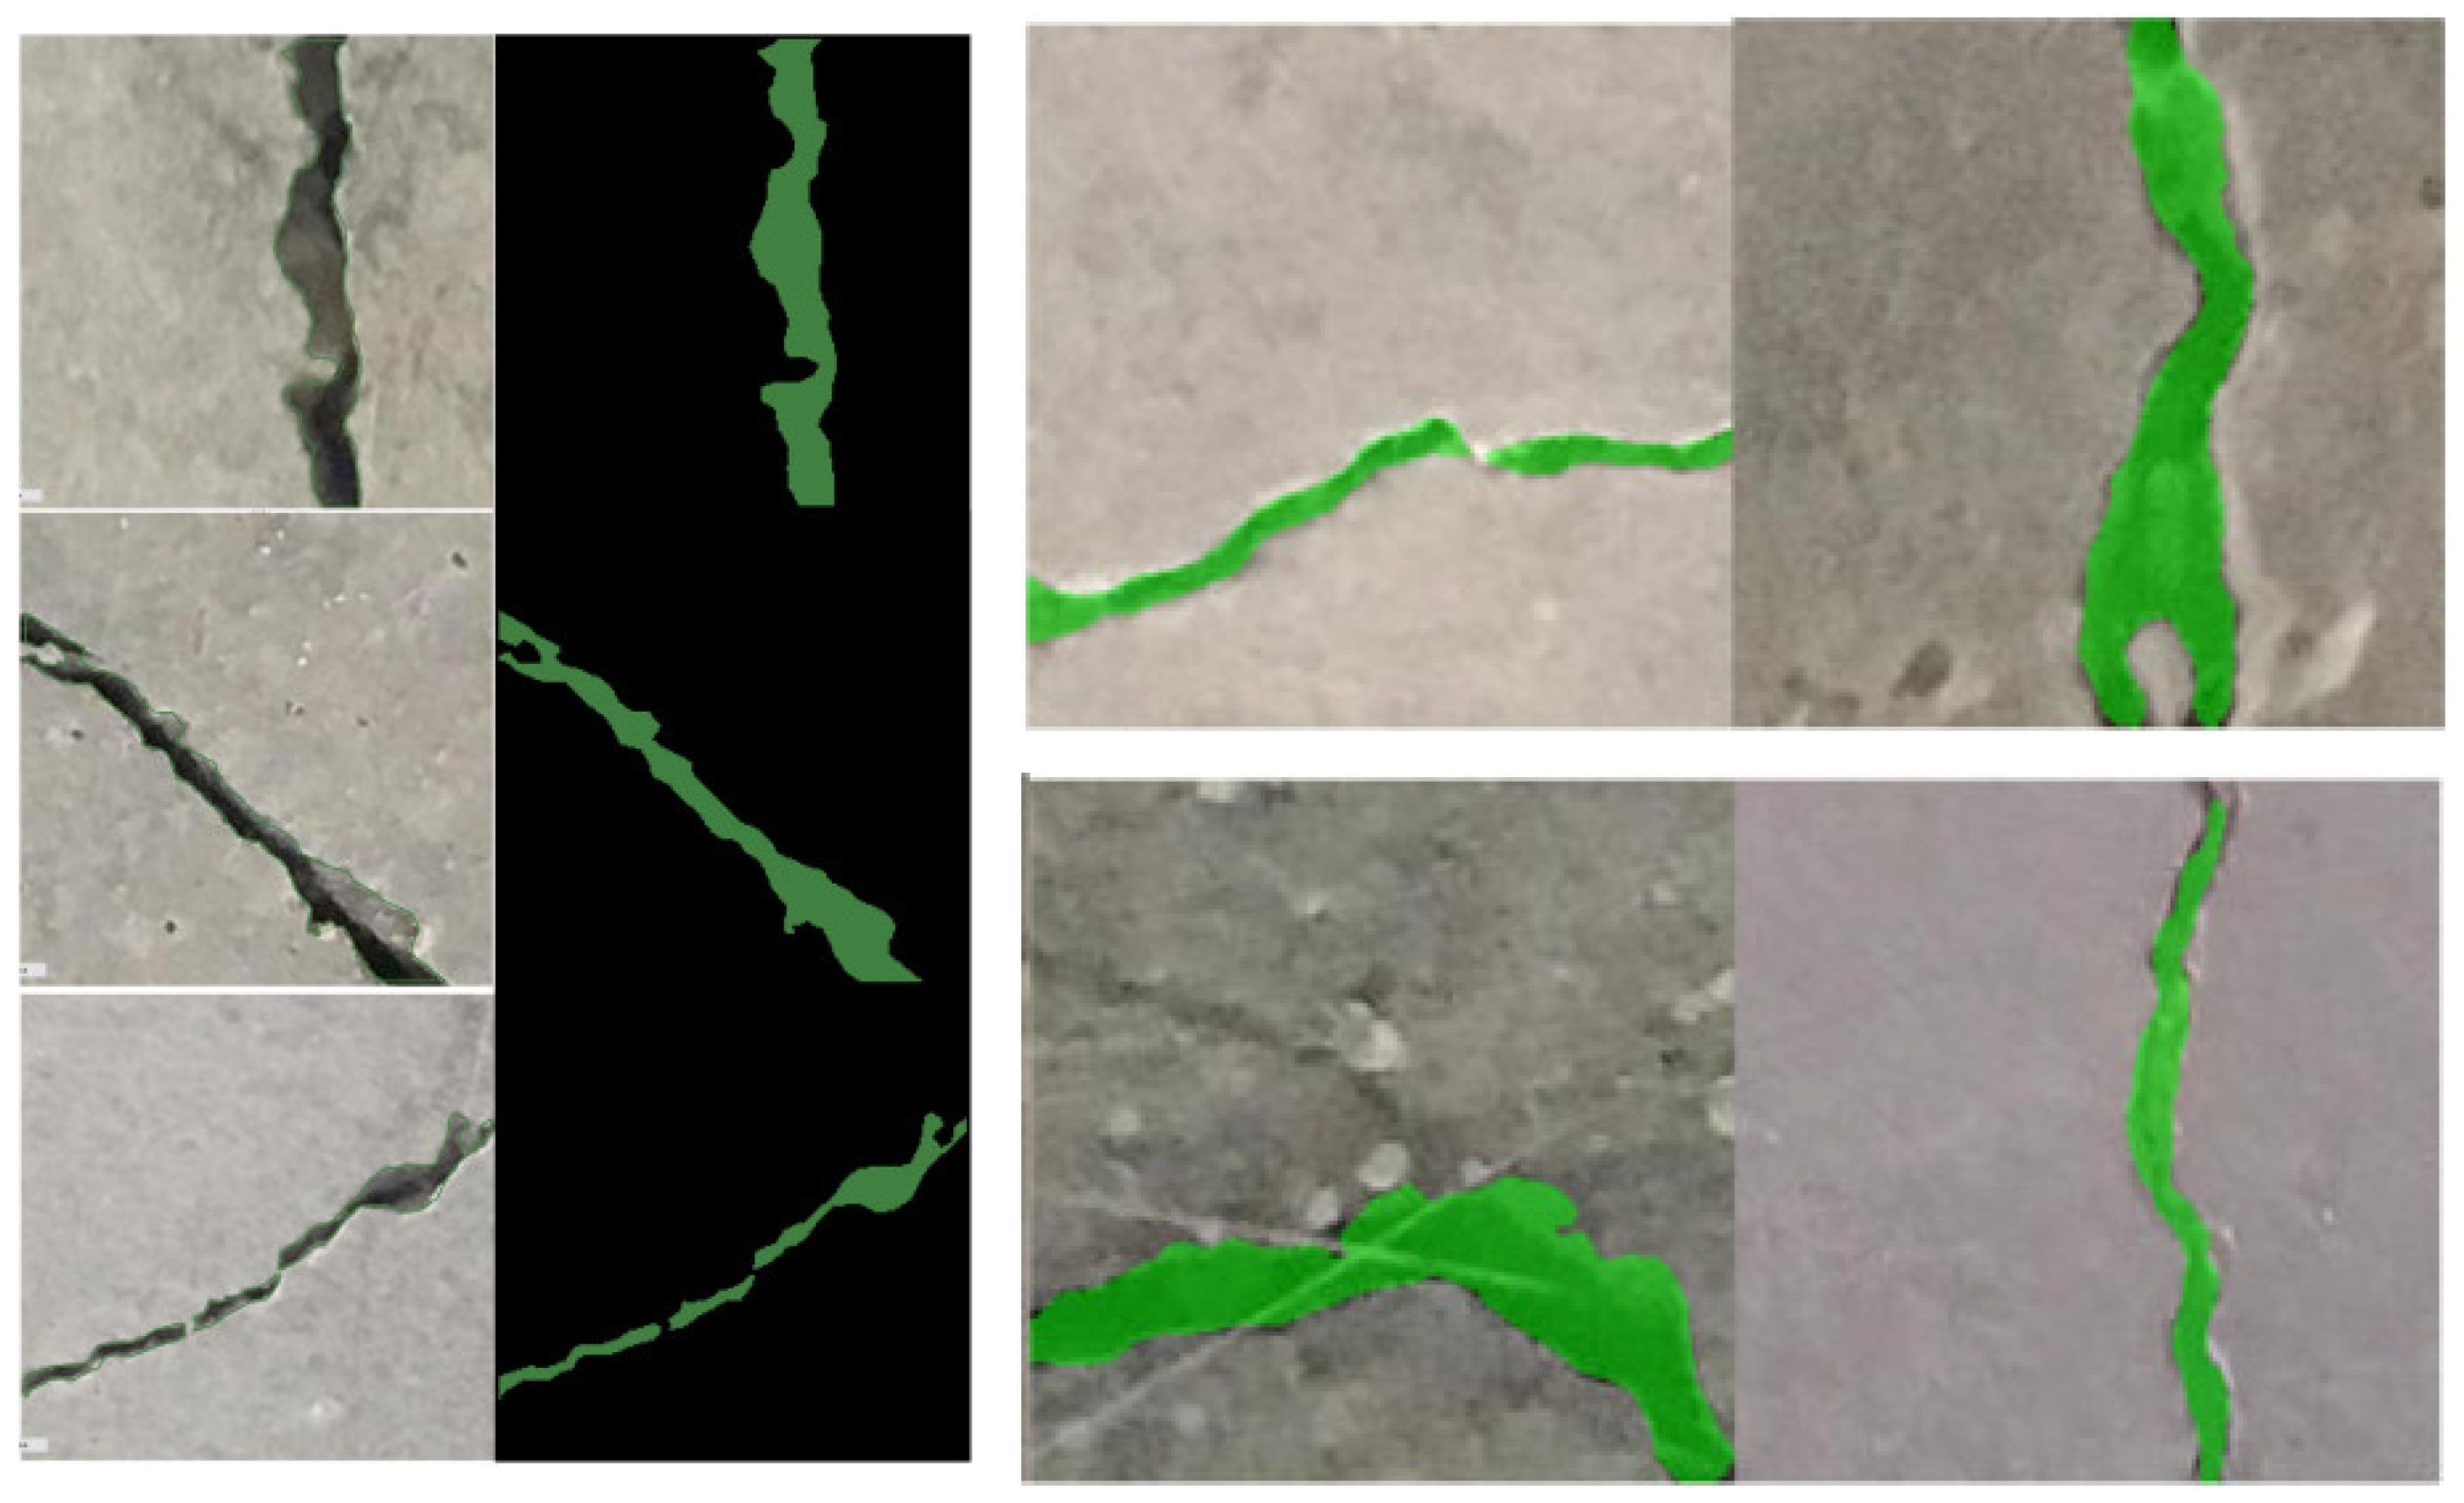
  162. Dung, C.V.; Anh, L.D. Autonomous concrete crack detection using deep fully convolutional neural network. Autom. Constr. 2019, 99, 52–58. [Google Scholar] [CrossRef]
  163. Lei, F.; Ma, X.; Dong, X. Automatic Identification of Construction Dust Based on Improved K-Means Algorithm Automatic Identification of Construction Dust Based on Improved K-Means Algorithm. IOP Conf. Ser. Earth Environ. Sci. 2021, 647, 012017. [Google Scholar] [CrossRef]
  164. Baumgartl, H.; Tomas, J.; Buettner, R.; Merkel, M. A deep learning-based model for defect detection in laser-powder bed fusion using in-situ thermographic monitoring. Prog. Addit. Manuf. 2020, 5, 277–285. [Google Scholar] [CrossRef] [Green Version]
  165. Land, W.S.; Zhang, B.; Ziegert, J.; Davies, A. In-Situ Metrology System for Laser Powder Bed Fusion Additive Process. Procedia Manuf. 2015, 1, 393–403. [Google Scholar] [CrossRef] [Green Version]
  166. Zhang, B.; Ziegert, J.C.; Ii, W.S.L.; Ziegert, J.; Davies, A. In Situ Monitoring of Laser Powder Bed Fusion Additive Manufacturing Using Digital Fringe Projection Technique. 2015. Available online: https://www.researchgate.net/publication/283097423 (accessed on 29 March 2021).
  167. Altenburg, S.J.; Straße, A.; Gumenyuk, A.; Maierhofer, C. In-situ monitoring of a laser metal deposition (LMD) process: Comparison of MWIR, SWIR and high-speed NIR thermography. Quant. InfraRed Thermogr. J. 2022, 19, 97–114. [Google Scholar] [CrossRef]
  168. Azar, E.R.; McCabe, B. Automated Visual Recognition of Dump Trucks in Construction Videos. J. Comput. Civ. Eng. 2011, 26, 769–781. [Google Scholar] [CrossRef]
  169. LED Lighting Vendors Diversify Their Product Offerings. Vision Systems Design. Available online: https://www.vision-systems.com/cameras-accessories/article/16739336/led-lighting-vendors-diversify-their-product-offerings (accessed on 29 March 2021).
  170. Zhang, Y.; Fuh, J.Y.H.; Ye, D.; Hong, G.S. In-situ monitoring of laser-based PBF via off-axis vision and image processing approaches. Addit. Manuf. 2019, 25, 263–274. [Google Scholar] [CrossRef]
  171. Nassar, A.R.; Starr, B.; Reutzel, E.W. Process monitoring of directed-energy deposition of Inconel-718 via plume imaging. In 2014 International Solid Freeform Fabrication Symposium; University of Texas at Austin: Austin, TX, USA, 2015. [Google Scholar]
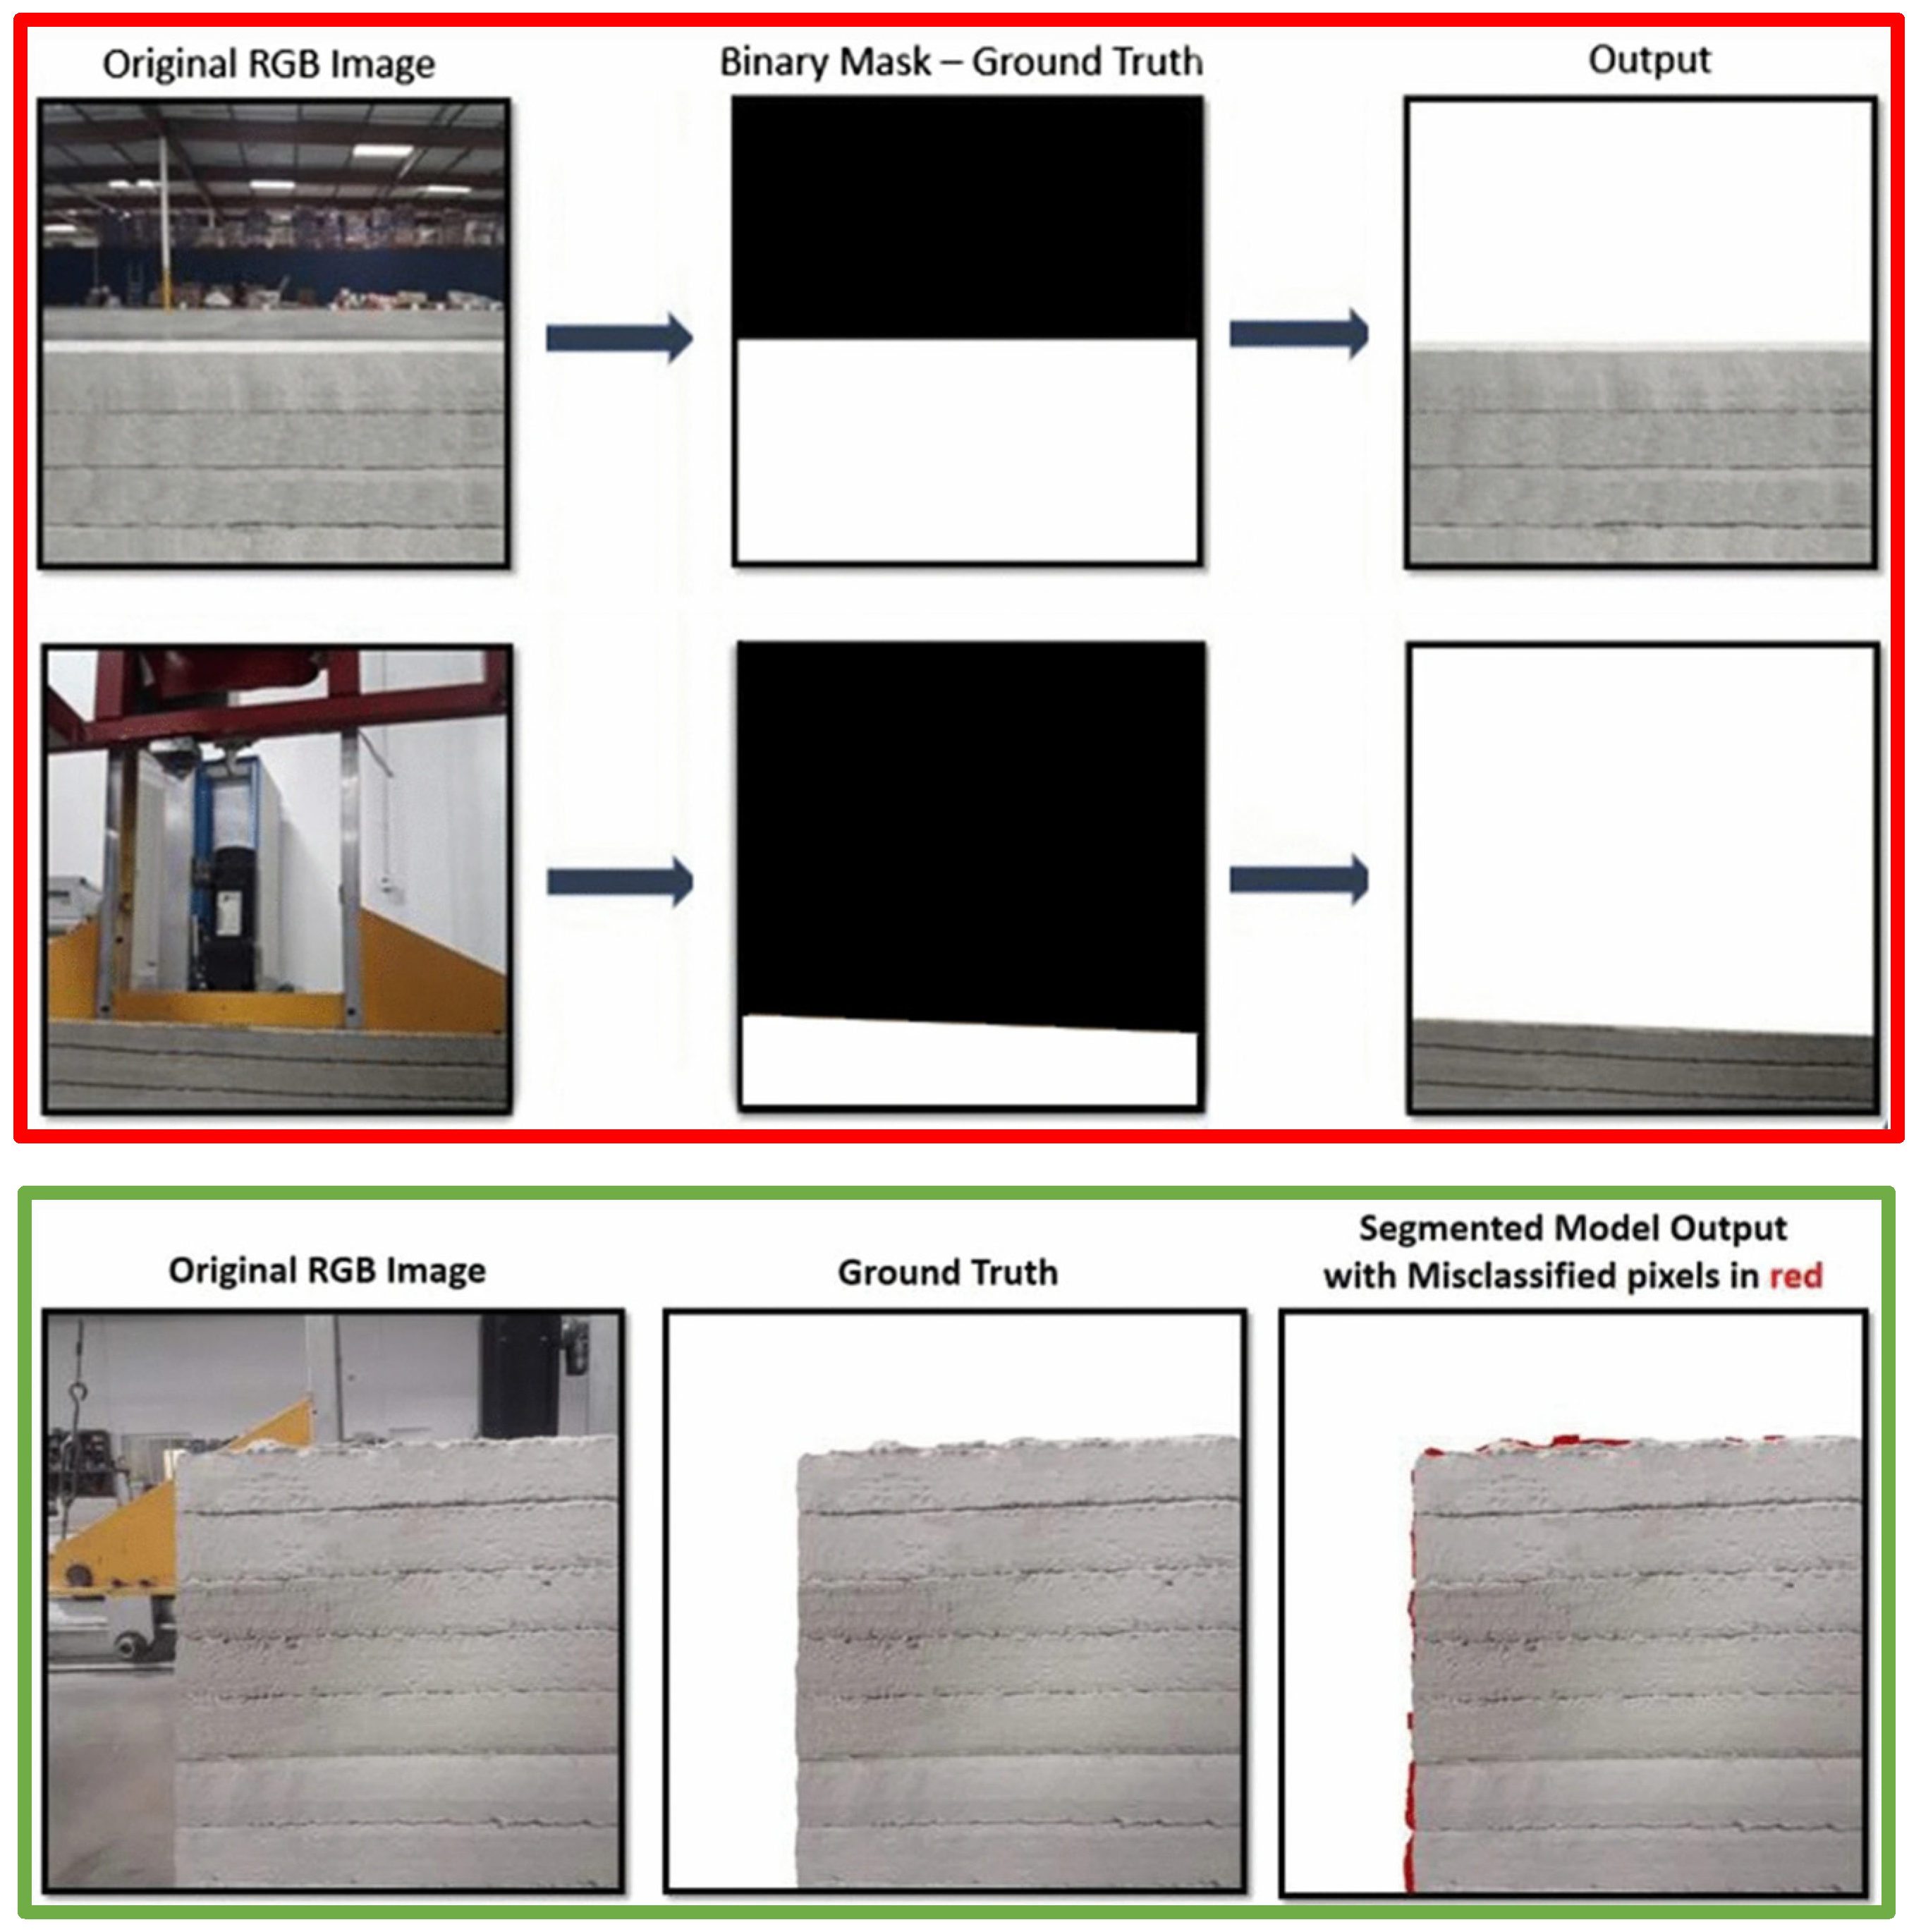
  172. Nefs, K.; Menkovski, V.; Bos, F.P.; Suiker, A.S.J.; Salet, T.A.M. Automated image segmentation of 3D printed fibrous composite micro-structures using a neural network. Constr. Build. Mater. 2023, 365, 130099. [Google Scholar] [CrossRef]
  173. Wang, J.; Tang, Y.; Zhang, J.; Yue, M.; Feng, X. Convolutional neural network-based image denoising for synchronous measurement of temperature and deformation at elevated temperature. Optik 2021, 241, 166977. [Google Scholar] [CrossRef]
  174. Goh, G.D.; Sing, S.L.; Yeong, W.Y. A review on machine learning in 3D printing: Applications, potential, and challenges. Artif. Intell. Rev. 2021, 54, 63–94. [Google Scholar] [CrossRef]
  175. Manda, M.P.; Kim, H.S. A fast image thresholding algorithm for infrared images based on histogram approximation and circuit theory. Algorithms 2020, 13, 207. [Google Scholar] [CrossRef]
  176. Lee, Y.S.; Vuong, N.; Adrian, N.; Pham, Q.C. Integrating Force-based Manipulation Primitives with Deep Learning-based Visual Servoing for Robotic Assembly. Available online: https://openreview.net/forum?id=01lfX8qrh1O (accessed on 20 February 2023).
  177. Vuong, N.; Pham, H.; Pham, Q.C. Learning Sequences of Manipulation Primitives for Robotic Assembly. In Proceedings of the 2021 IEEE International Conference on Robotics and Automation, Xi’an, China, 30 May–5 June 2021; pp. 4086–4092. [Google Scholar] [CrossRef]
  178. Murcia-Gómez, D.; Rojas-Valenzuela, I.; Valenzuela, O. Impact of Image Preprocessing Methods and Deep Learning Models for Classifying Histopathological Breast Cancer Images. Appl. Sci. 2022, 12, 11375. [Google Scholar] [CrossRef]
  179. Duff, M.J.B.; Levialdi, S. An Analysis of Computational Cost in Image Processing: A Case Study. IEEE Trans. Comput. 1978, 27, 904–910. [Google Scholar] [CrossRef]
  180. Hua, X.; Wang, X.; Rui, T.; Shao, F.; Wang, D. Cascaded panoptic segmentation method for high resolution remote sensing image. Appl. Soft Comput. 2021, 109, 107515. [Google Scholar] [CrossRef]
  181. Tao, C.; He, H.; Xu, F.; Cao, J. Stereo priori RCNN based car detection on point level for autonomous driving. Knowl. Based Syst. 2021, 229, 107346. [Google Scholar] [CrossRef]
  182. Yang, Z.; Sun, Y.; Liu, S.; Jia, J. 3DSSD: Point-based 3D Single Stage Object Detector. In Proceedings of the IEEE Computer Society Conference on Computer Vision and Pattern Recognition, Seattle, WA, USA, 13–19 June 2020; pp. 11037–11045. Available online: https://arxiv.org/abs/2002.10187v1 (accessed on 31 July 2021).
  183. Zhou, Y.; Tuzel, O. VoxelNet: End-to-End Learning for Point Cloud Based 3D Object Detection. In Proceedings of the IEEE Conference on Computer Vision and Pattern Recognition, Salt Lake City, UT, USA, 18–22 June 2018. [Google Scholar]
  184. Sun, J.; Chen, L.; Xie, Y.; Zhang, S.; Jiang, Q.; Zhou, X.; Bao, H. Disp R-CNN: Stereo 3D Object Detection via Shape Prior Guided Instance Disparity Estimation. In Proceedings of the IEEE Computer Society Conference on Computer Vision and Pattern Recognition, Seattle, WA, USA, 13–19 June 2020; pp. 10545–10554. Available online: https://arxiv.org/abs/2004.03572v1 (accessed on 31 July 2021).
  185. Redmon, J.; Farhadi, A. YOLOv3: An Incremental Improvement. 2018. Available online: https://arxiv.org/abs/1804.02767v1 (accessed on 31 July 2021).
  186. Bochkovskiy, A.; Wang, C.-Y.; Liao, H.-Y.M. YOLOv4: Optimal Speed and Accuracy of Object Detection. 2020. Available online: https://arxiv.org/abs/2004.10934v1 (accessed on 31 July 2021).
  187. Venkatasubramanian, V.; Rengaswamy, R.; Yin, K.; Kavuri, S.N. A review of process fault detection and diagnosis: Part I: Quantitative model-based methods. Comput. Chem. Eng. 2003, 27, 293–311. [Google Scholar] [CrossRef]
  188. Seifried, P. Fault Detection and Diagnosis in Chemical and Petrochemical Processes, Bd. 8 der Serie “Chemical Engineering Monographs”. Von D. M. Himmelblau, herausgegeben von S. W. Churchill, Elsevier Scientific Publishing Company, Amsterdam—New York 1978. 1. Aufl., X, 414 S., 137 Abb., 66 Tab., DM 145,-. Chem. Ing. Tech. 1979, 51, 766. [Google Scholar] [CrossRef]
  189. Amherst, S.; Collingwood, L.; Wilkerson, J. Tradeoffs in Accuracy and Efficiency in Supervised Learning Methods. Available online: https://scholarworks.umass.edu/jitpc2011/4/ (accessed on 24 January 2023).
  190. Hassan, N.M.H.; Elshoky, B.; Hassan, N.M.H.; Elshoky, B.R.G.; Mabrouk, A.M. Quality of performance evaluation of ten machine learning algorithms in classifying thirteen types of apple fruits. Indones. J. Electr. Eng. Comput. Sci. 2023, 30, 102–109. [Google Scholar] [CrossRef]
  191. Yaacob, M.R.; Fahmi, F. Study on speed and accuracy in measuring people flow rate using computer vision. In Proceedings of the Mechanical Engineering Research Day 2022, Moratuwa, Sri Lanka, 27–29 July 2022; pp. 143–144. Available online: https://youtu.be/Xc625PpsGrU (accessed on 23 January 2023).
  192. Colbrook, M.J.; Antun, V.; Hansen, A.C. The difficulty of computing stable and accurate neural networks: On the barriers of deep learning and Smale’s 18th problem. Proc. Natl. Acad. Sci. USA 2022, 119, e2107151119. [Google Scholar] [CrossRef] [PubMed]
  193. Ilyas, A.; Santurkar, S.; Tsipras, D.; Engstrom, L.; Tran, B.; Madry, A. Adversarial Examples Are Not Bugs, They Are Features. Adv. Neural Inf. Process. Syst. 2019, 32, 1–12. [Google Scholar] [CrossRef]
  194. Moosavi-Dezfooli, S.-M.; Fawzi, A.; Frossard’, P.F.; Polytechnique, F.; de Lausanne, F. DeepFool: A Simple and Accurate Method to Fool Deep Neural Networks. In Proceedings of the IEEE Conference on Computer Vision and Pattern Recognition 2016, Las Vegas, NV, USA, 27–30 June 2016; pp. 2574–2582. Available online: http://github.com/lts4/deepfool (accessed on 17 February 2023).
  195. Szegedy, C.; Zaremba, W.; Sutskever, I.; Bruna, J.; Erhan, D.; Goodfellow, I.; Fergus, R. Intriguing properties of neural networks. arXiv 2013, arXiv:1312.6199. [Google Scholar]
  196. Su, J.; Vargas, D.V.; Sakurai, K. One Pixel Attack for Fooling Deep Neural Networks. IEEE Trans. Evol. Comput. 2019, 23, 828–841. [Google Scholar] [CrossRef] [Green Version]
  197. He, L.; Li, H.; Chow, W.T.; Zeng, B.; Qian, Y. Increasing the interlayer strength of 3D printed concrete with tooth-like interface: An experimental and theoretical investigation. Mater. Des. 2022, 223, 111117. [Google Scholar] [CrossRef]
  198. Kulkarni, A.; Chong, D.; Batarseh, F.A. Foundations of data imbalance and solutions for a data democracy. In Data Democracy: At the Nexus of Artificial Intelligence, Software Development, and Knowledge Engineering; Academic Press: Cambridge, MA, USA, 2020; pp. 83–106. [Google Scholar] [CrossRef]
  199. Grandini, M.; Bagli, E.; Visani, G. Metrics for Multi-Class Classification: An Overview. arXiv 2020, arXiv:2008.05756. [Google Scholar] [CrossRef]
  200. Boughorbel, S.; Jarray, F.; El-Anbari, M. Optimal classifier for imbalanced data using Matthews Correlation Coefficient metric. PLoS ONE 2017, 12, e0177678. [Google Scholar] [CrossRef]
  201. Daskalaki, S.; Kopanas, I.; Avouris, N. Evaluation of classifiers for an uneven class distribution problem. Appl. Artif. Intell. 2006, 20, 381–417. [Google Scholar] [CrossRef]
  202. Clark, A.F.; Clark, C. Performance Characterization in Computer Vision. Available online: http://peipa.essex.ac.uk/benchmark/ (accessed on 18 February 2023).
  203. Chai, J.; Zeng, H.; Li, A.; Ngai, E.W.T. Deep learning in computer vision: A critical review of emerging techniques and application scenarios. Mach. Learn. Appl. 2021, 6, 100134. [Google Scholar] [CrossRef]
  204. Galarreta, J.F.; Kerle, N.; Gerke, M. UAV-based urban structural damage assessment using object-based image analysis and semantic reasoning. Nat. Hazards Earth Syst. Sci. 2015, 15, 1087–1101. [Google Scholar] [CrossRef] [Green Version]
  205. Sapirstein, P. Accurate measurement with photogrammetry at large sites. J. Archaeol. Sci. 2016, 66, 137–145. [Google Scholar] [CrossRef]
  206. Yastikli, N. Documentation of cultural heritage using digital photogrammetry and laser scanning. J. Cult. Herit. 2007, 8, 423–427. [Google Scholar] [CrossRef]
  207. Braun, A.; Borrmann, A. Combining inverse photogrammetry and BIM for automated labeling of construction site images for machine learning. Autom. Constr. 2019, 106, 102879. [Google Scholar] [CrossRef]
  208. Qi, C.; Weiss, J.; Olek, J. Characterization of plastic shrinkage cracking in fiber reinforced concrete using image analysis and a modified Weibull function. Mater. Struct. 2003, 36, 386–395. [Google Scholar] [CrossRef]
  209. Ma, Y.; Tan, M.; Wu, K. Effect of different geometric polypropylene fibers on plastic shrinkage cracking of cement mortars. Mater. Struct. 2002, 35, 165–169. [Google Scholar] [CrossRef]
  210. Wang, W.-C.; Chen, L.-B.; Chang, W.-J. A Machine Vision Based Automatic Optical Inspection System for Measuring Drilling Quality of Printed Circuit Boards. 2017. Available online: https://www.researchgate.net/publication/317843301_A_Machine_Vision_Based_Automatic_Optical_Inspection_System_for_Measuring_Drilling_Quality_of_Printed_Circuit_Boards (accessed on 30 March 2021).
  211. Nemati, K.M.; Stroeven, P. Stereological analysis of micromechanical behavior of concrete. Mater. Struct. 2001, 34, 486–494. [Google Scholar] [CrossRef]
  212. Elzafraney, M.; Soroushian, P. Assessment of microcrack development in concrete materials of different strengths. Mater. Struct. 2004, 37, 724–731. [Google Scholar] [CrossRef]
  213. Maraveas, C.; Bartzanas, T. Sensors for Structural Health Monitoring of Agricultural Structures. Sensors 2021, 21, 314. [Google Scholar] [CrossRef]
  214. Roopa, A.K.; Hunashyal, A.M.; Venkaraddiyavar, P.; Ganachari, S.V. Smart hybrid nano composite concrete embedded sensors for structural health monitoring. Mater. Today Proc. 2020, 27, 603–609. [Google Scholar] [CrossRef]
  215. Merzbacher, C.I.; Kersey, A.D.; Friebele, E.J. Fiber optic sensors in concrete structures: A review. Smart Mater. Struct. 1996, 5, 196. [Google Scholar] [CrossRef]
  216. Strangfeld, C.; Johann, S.; Bartholmai, M. Smart RFID Sensors Embedded in Building Structures for Early Damage Detection and Long-Term Monitoring. Sensors 2019, 19, 5514. [Google Scholar] [CrossRef] [Green Version]
  217. Dong, W.; Li, W.; Tao, Z.; Wang, K. Piezoresistive properties of cement-based sensors: Review and perspective. Constr. Build. Mater. 2019, 203, 146–163. [Google Scholar] [CrossRef]
  218. Sam-Daliri, O.; Faller, L.M.; Farahani, M.; Zangl, H. Structural health monitoring of adhesive joints under pure mode I loading using the electrical impedance measurement. Eng. Fract. Mech. 2021, 245, 107585. [Google Scholar] [CrossRef]
  219. Dong, W.; Li, W.; Shen, L.; Sheng, D. Piezoresistive behaviours of carbon black cement-based sensors with layer-distributed conductive rubber fibres. Mater. Des. 2019, 182, 108012. [Google Scholar] [CrossRef]
  220. Ubertini, F.; D’Alessandro, A. Concrete with self-sensing properties. In Eco-Efficient Repair and Rehabilitation of Concrete Infrastructures; Woodhead Publishing: Cambridge, MA, USA, 2018; pp. 501–530. [Google Scholar] [CrossRef]
  221. Han, B.; Zhang, L.; Ou, J. Smart and Multifunctional Concrete Toward Sustainable Infrastructures; Springer: Singapore, 2017. [Google Scholar] [CrossRef]
  222. Konsta-Gdoutos, M.S.; Aza, C.A. Self sensing carbon nanotube (CNT) and nanofiber (CNF) cementitious composites for real time damage assessment in smart structures. Cem. Concr. Compos. 2014, 53, 162–169. [Google Scholar] [CrossRef]
  223. Ai, D.; Zhu, H.; Luo, H.; Wang, C. Mechanical impedance based embedded piezoelectric transducer for reinforced concrete structural impact damage detection: A comparative study. Constr. Build. Mater. 2018, 165, 472–483. [Google Scholar] [CrossRef]
  224. Embedded Piezoelectric Sensors for Health Monitoring of Concrete Structures. Available online: https://www.researchgate.net/publication/279570765_Embedded_Piezoelectric_Sensors_for_Health_Monitoring_of_Concrete_Structures (accessed on 9 June 2021).
  225. Park, G.; Sohn, H.; Farrar, C.R.; Inman, D.J. Overview of Piezoelectric Impedance-Based Health Monitoring and Path Forward. Shock. Vib. Dig. 2003, 35, 451–464. [Google Scholar] [CrossRef] [Green Version]
  226. Ma, G.; Li, Y.; Wang, L.; Zhang, J.; Li, Z. Real-time quantification of fresh and hardened mechanical property for 3D printing material by intellectualization with piezoelectric transducers. Constr. Build. Mater. 2020, 241, 117982. [Google Scholar] [CrossRef]
  227. Xi, X.; Chung, D.D.L. Effect of nickel coating on the stress-dependent electric permittivity, piezoelectricity and piezoresistivity of carbon fiber, with relevance to stress self-sensing. Carbon 2019, 145, 401–410. [Google Scholar] [CrossRef]
  228. Wen, S.; Chung, D.D.L. Electromagnetic interference shielding reaching 70 dB in steel fiber cement. Cem. Concr. Res. 2004, 34, 329–332. [Google Scholar] [CrossRef]
  229. Ozturk, M.; Chung, D.D.L. Enhancing the electromagnetic interference shielding effectiveness of carbon-fiber reinforced cement paste by coating the carbon fiber with nickel. J. Build. Eng. 2021, 41, 102757. [Google Scholar] [CrossRef]
  230. Hu, J.Y.; Zhang, S.S.; Chen, E.; Li, W.G. A review on corrosion detection and protection of existing reinforced concrete (RC) structures. Constr. Build. Mater. 2022, 325, 126718. [Google Scholar] [CrossRef]
  231. Živica, V. Utilisation of electrical resistance method for the evaluation of the state of steel reinforcement in concrete and the rate of its corrosion. Constr. Build. Mater. 2000, 14, 351–358. [Google Scholar] [CrossRef]
  232. García, A.; Bueno, M.; Norambuena-Contreras, J.; Partl, M.N. Induction healing of dense asphalt concrete. Constr. Build. Mater. 2013, 49, 1–7. [Google Scholar] [CrossRef]
  233. Sengupta, D.; Huang, Y.; Davidson, C.I.; Edgar, T.F.; Edene, M.R.; El-Halwagi, M.M. Sustainable Manufacturing Education Modules for Senior Undergraduate or Graduate Engineering Curriculum. Comput. Aided Chem. Eng. 2018, 44, 1657–1662. [Google Scholar] [CrossRef]
  234. IEA. 2019 Global Status Report for Buildings and Construction. 2019. Available online: https://iea.blob.core.windows.net/assets/3da9daf9-ef75-4a37-b3da-a09224e299dc/2019_Global_Status_Report_for_Buildings_and_Construction.pdf (accessed on 20 February 2023).
  235. Additive Manufacturing as an Opportunity for Supporting Sustainability through Implementation of Circular Economies. Available online: https://www.researchgate.net/publication/312626449_Additive_Manufacturing_as_an_opportunity_for_supporting_sustainability_through_implementation_of_circular_economies (accessed on 20 February 2023).
  236. de Schutter, G.; Lesage, K.; Mechtcherine, V.; Nerella, V.N.; Habert, G.; Agusti-Juan, I. Vision of 3D printing with concrete—Technical, economic and environmental potentials. Cem. Concr. Res. 2018, 112, 25–36. [Google Scholar] [CrossRef]
  237. W. Commission on Environment, Report of the World Commission on Environment and Development: Our Common Future towards Sustainable Development 2. Part II. Common Challenges Population and Human Resources 4. Available online: https://sustainabledevelopment.un.org/content/documents/5987our-common-future.pdf (accessed on 1 March 2022).
  238. Tuladhar, R.; Yin, S. Sustainability of using recycled plastic fiber in concrete. In Use of Recycled Plastics in Eco-Efficient Concrete; Elsevier: Amsterdam, The Netherlands, 2019; pp. 441–460. [Google Scholar] [CrossRef]
  239. Dey, D.; Srinivas, D.; Panda, B.; Suraneni, P.; Sitharam, T.G. Use of industrial waste materials for 3D printing of sustainable concrete: A review. J. Clean. Prod. 2022, 340, 130749. [Google Scholar] [CrossRef]
  240. Cesaretti, G.; Dini, E.; de Kestelier, X.; Colla, V.; Pambaguian, L. Building components for an outpost on the Lunar soil by means of a novel 3D printing technology. Acta Astronaut. 2014, 93, 430–450. [Google Scholar] [CrossRef]
  241. Ries, R.; Bilec, M.M.; Gokhan, N.M.; Needy, K.L. The economic benefits of green buildings: A comprehensive case study. Eng. Econ. 2006, 51, 259–295. [Google Scholar] [CrossRef]
  242. Colorado, H.A.; Velásquez, E.I.G.; Monteiro, S.N. Sustainability of additive manufacturing: The circular economy of materials and environmental perspectives. J. Mater. Res. Technol. 2020, 9, 8221–8234. [Google Scholar] [CrossRef]
  243. Pan, M.; Linner, T.; Pan, W.; Cheng, H.; Bock, T. A framework of indicators for assessing construction automation and robotics in the sustainability context. J. Clean. Prod. 2018, 182, 82–95. [Google Scholar] [CrossRef] [Green Version]
Figure 1. Venn Diagram of Parameters in Concrete 3D Printing.
Mathematics 11 01499 g001
Figure 2. Qualitative Observation of Interlayer Bond with Varying Printing Speeds: (a) 1-min time-gap, (b) 5 min time-gap, (c) 10-min time-gap and (d) 20-min time-gap [42].
Mathematics 11 01499 g002
Figure 3. Layer-wise Deformation Illustration by Ashrafi et al. [43].
Mathematics 11 01499 g003
Figure 4. Meshed wires or cable implementation to C3DP bridge structures [102,103].
Mathematics 11 01499 g004
Figure 5. A pre-configured wire mesh approach, for concrete deposition around existing mesh layout [104,105]. (ac) shows the process flow for a pre-configured wire mesh approach with an inclined angle deposition.
Mathematics 11 01499 g005
Figure 6. Relationship between pump flow rate and nozzle travel speed in quality control. (Image by Tay et al. [109]). (AD) represents the regions when optimization between the two parameters are imbalanced, (A) high flow rate and low travel speed, (B) high flow rate and travel speed, (C) low flow rate and travel speed, (D) high travel speed and low flow rate.
Mathematics 11 01499 g006
Figure 7. Categorization of computer vision methods and a non-exhaustive list of methods for pre-processing, feature extraction and classification [141].
Mathematics 11 01499 g007
Figure 8. Illustration of Data Acquisition Sensor Layouts in C3DP.
Mathematics 11 01499 g008
Figure 9. Examples of Illumination Strategies for Image Acquisition.
Mathematics 11 01499 g009
Figure 10. Left: Image sample by SC3DP taken by a camera attached to the nozzle, displaying background noise (splatters and residuals of concrete). Right: Error in feature extraction where background features were highlighted with a green outline (inclusive of the concrete filament), resulting in a discarded image (Image from Kazemian et al. [18]).
Mathematics 11 01499 g010
Figure 11. In red: pre-processing methods utilising thresholding and binarization for training dataset. In green: training data fed into a pixel-wise segmentation via DNN model to remove background noise [146].
Mathematics 11 01499 g011
Figure 12. Categorized List of Machine Learning Techniques [174].
Mathematics 11 01499 g012
Figure 13. One Pixel Attacks Evaluated by Su et al. [196]. Images Labelling Format: Correct Label (Predicted Label).
Mathematics 11 01499 g013
Figure 14. Wire Mesh Diagram with Cracks (in red) and Holes/Indentations (in Yellow), extracted in Object-Based Image Anaylsis [204].
Mathematics 11 01499 g014
Figure 15. An example of Workplace Safety Inspection with UAS [147].
Mathematics 11 01499 g015
Figure 16. High Dust Concentration (Left) and Low Dust Concentration (Right) [163].
Mathematics 11 01499 g016
Figure 17. 3D point clouds of the Dolmabahce Palace. (Reprinted/adapted with permission. 2023, Yastikli) [206].
Mathematics 11 01499 g017
Figure 18. BIM viewer with detection states and point cloud from observations [207].
Mathematics 11 01499 g018
Figure 19. Process Flow (Left) of the Proposed Method Used by Talab et al. [144].
Mathematics 11 01499 g019
Figure 20. Actual and Annotated Crack Images (Left), Segmentation Results for Test Images (Right) [162].
Mathematics 11 01499 g020
Figure 21. (a) Construction onsite progress. (b) Generation of 3D model with AutoCAD [149].
Mathematics 11 01499 g021
Table 1. List of Parameters Sorted into Respective Categories [6,13,15,16,17,18,19,20,21,22,23,24].
Process ParameterNozzle Travel Speed, Material Extrusion Rate
Layer Height, Layer Width, Nozzle Diameter, Corner Travel Radius, Nozzle Shape/Geometry
Extrusion Pressure/Force, Layer Cycle Time
Environmental ParameterTemperature, Humidity, Winds, Freeze-Thaw Cycles
Material ParameterYield Stress (Static, Dynamic), Structuration Rate, Curing Rate, Density, Plastic Viscosity, Slump Ratio, Aggregate Size, Compressive Strength, Thixotropy, Open Time, Setting Time, Structural Build Up, Water-to-cement ratio, Hydration Rate
Table 2. Parameters Involved in Poor Interlayer Bond Strength.
Process ParameterPrinting Time Gap, Nozzle Travel Speed, Nozzle Standoff Distance, Mixing, deposition method, Air Entrapment, Surface-to-Volume Ratio[23,27,28,29,30,31,41,42,44,45,46,47,48,49,50]
Environmental ParameterTemperature, Humidity, Hydration Rate, Saltwater Penetration, Freeze-Thaw Cycles[23,24,30,34,35,36,37,38,39,44,45,51,52,53,54,55,56,57]
Material ParameterAggregate-to-Binder Ratio, Additives, Void distribution, Permeability, Drying Shrinkage, Plastic Shrinkage, Moisture,[32,34,44,54,58,59,60,61,62,63,64,65,66,67,68]
Table 3. Parameters Involved in Buildability.
Process ParameterPrinting Time Gap, Nozzle Travel Speed, Nozzle Standoff Distance, Filament Width, Structure Height, Nozzle Width, Vertical Building Rate, Total Construction Time, Nozzle Geometry, Peripheral Parameters (Activator Feed Rate)[6,12,13,14,43,69,70,71,104,105,106]
Environmental Parameter
Material ParameterAggregate-to-Binder Ratio, Curing Rate, Additives, Accelerator Ratio, Static & Dynamic Yield Stress, Open Time, Setting Time, Structural Build Up, Hydration Rate, Ductility,[13,14,69,72,73,74,96,106]
Table 4. Parameters Involved in Extrudability.
Process ParameterCorner Radius, Nozzle Travel Speed, Material Flow Rate, Extrusion Pressure, Nozzle Geometry (Diameter Ratio), Peripheral Parameters (Vibration at nozzle, etc)[109,111,112,113,116,117,118,120,121,122,123]
Environmental Parameter
Material ParameterSand-to-Cement Ratio, Curing Rate, Static & Dynamic Yield Stress, Plastic Viscosity, Lubrication Layer, Storage Modulus, Open Time, Setting Time, Structural Build Up, Hydration Rate, Aggregate Size[10,120,123,124,125,126,127,128,129,130,131,132,133,134]
Table 5. Latest Applications for Machine Vision in C3DP separated by pre-process, in-process, and post-process factors (red indicates feedback application is successful, blue indicates intentions to implement a feedback system, black does not indicate intentions for feedback implementation).
MonitoringConfigParameter/AnalysisPublication(s)Sensor/MethodComments
In-processIn-SituNozzle Height[135]1D ToF Distance Sensor/Direct MeasurementFeedback with sensor for Proof of Concept.
In-SituFlow Rate, Width[18]Camera Sensor/
Binarization
Material flow for over and under extrusion.
Ex-SituSurface Quality, Layer Width[157]Camera Sensor/
Gaussian Filter
Imaging Techniques to measure surface smoothness from side profile.
In-SituRobot Collision[158,159]Camera Sensor, ArUco markersRobot collision with 2 vision feedback methods for estimation and precision.
Post-ProcessIn-SituLayer Deformation[146]Camera Sensor/
Semantic Segmentation
Slump Inspection.
In-SituExtrusion Quality[136]Camera Sensor/
U-VGG19
Side profile evaluation of layer quality to observe qualitatively.
In-SituTexture Quality[160]Camera Sensor/
Thresholding
Entropy variation analysis to assess layer quality from a side profile.
Ex-SituGeometric Inspection in C3DP Assembly[161]3D Laser Scanner/ PhotogrammetryCase Study Inspection
Table 6. List of innovations in computer vision that can be used in C3DP.
Work ConductedPublication(s)MethodAuthor(s)Potential Relevance to C3DP
High-temperature measurement[173]Denoising Convolutional Neural NetworkWang J. et al.Denoising can be useful in removing splatters from nozzle during printing.
Occlusion and illumination[180]Panoptic SegmentationHua X. et al.Illumination and occlusions may occur during construction especially with a camera setup positioned to observe the overview of the site.
3D Detection[181]Mask R-CNN + RPN OptimizationTao C. et al.3D detection could have useful applications in depth detection for depth of printed filament, elastic buckling and plastic collapse etc.
Additionally, depth perception can allow better control for machine control.
Point-based Single Stage Methods[182]3D Single Stage Object DetectorYang Z. et al.
LiDAR 3D Point Cloud Detection[183]VoxelNetZhou Y. et al.
3D Detection with Stereo Images[184]Disp R-CNN
Accuracy and Speed improvements[185,186]YOLOv3, YOLOv4Redmon J. et al.
Bochkovskiy A. et al.
Application for optimized real time detection for C3DP features.
Table 7. Example of Formula Used for Machine Learning Assessment.
T P = G T × S
F P = ( G T + S ) G T
F N = ( G T + S ) S
P r e c i s i o n = T P T P + F P
R e c a l l = T P T P + F N
m A P = 1 11 R e c a l l i P r e s i c i o n ( R e c a l l )
I o U = T P ( T P + F P + F N )
F S c o r e = P r e c i s i o n × R e c a l l P r e c i s i o n + R e c a l l     = T P T P + 1 2 ( F P + F N )
Disclaimer/Publisher’s Note: The statements, opinions and data contained in all publications are solely those of the individual author(s) and contributor(s) and not of MDPI and/or the editor(s). MDPI and/or the editor(s) disclaim responsibility for any injury to people or property resulting from any ideas, methods, instructions or products referred to in the content.

