Article

Do Statistics Show Differences between Distance Estimations of 3D Objects in the Traffic Environment Using Glances, Side View Mirrors, and Camera Display?

by
Aleksandar Trifunović
1,*,
Tijana Ivanišević
2,
Svetlana Čičević
2,
Sreten Simović
3,
Vedran Vukšić
4 and
Živana Slović
5
1
Faculty of Transport and Traffic Engineering, University of Belgrade, 11000 Belgrade, Serbia
2
Academy of Professional Studies Sumadija, 34000 Kragujevac, Serbia
3
Faculty of Mechanical Engineering, University of Montenegro, 81000 Podgorica, Montenegro
4
P.E. GSP Belgrade, Knjeginje Ljubice 29, 11000 Belgrade, Serbia
5
Faculty of Medical Sciences, Department of Forensic Medicine, University of Kragujevac, 34000 Kragujevac, Serbia
*
Author to whom correspondence should be addressed.
Mathematics 2023, 11(5), 1258; https://doi.org/10.3390/math11051258
Submission received: 11 February 2023 / Revised: 27 February 2023 / Accepted: 3 March 2023 / Published: 5 March 2023

Abstract

:
The driver’s task in traffic is to evaluate traffic situations and act in accordance with the estimate. One of the most common causes of road crashes is “incorrect estimated of the traffic situation”. Correct perception of surroundings is one of the prerequisites for safe and successful driving. To investigate the mentioned issue, the authors of this paper conducted an experimental study with the aim of determining what affects the estimation of the object distance. In contrast to previous studies known from the available literature, our study presents experimental research of the estimated distance of 3D stimuli in three environments by direct observation, a rear-view mirror, and a camera display in a vehicle. One-hundred-and-sixty-four participants participated in the experiment. The research results show statistically significant differences in the estimation of the distance of 3D objects for different colors. Participants, for the largest number of stimuli, best estimate the distance from direct observation than through the rear-view mirror, while they make the most mistakes when estimating the distance of 3D objects using the camera display in a vehicle. On the other hand, in all described conditions, the respondents estimated the distance to the blue and green objects with the most significant errors.
MSC:
97M50; 97M70; 62P30

1. Introduction

Drivers perceive objects outside the vehicle, but also information inside the vehicle itself. The goal of perception is to take in information about the environment. The abilities of visual perception can be categorized theoretically into six types: spatial relationships that enable perception of the relative position of objects; visual discrimination that enables the discrimination between the features of different objects, such as position, color and shape; figure–ground that distinguishes an object from surrounding or background objects; visual closure that identifies a whole figure when only fragments of the figure are presented; visual memory that recognizes a stimulus item following a brief interval; and form constancy that constitutes the ability to recognize the dominant features of objects when they appear in different sizes, shadings, and/or textures [1].
The driver collects the largest amount of information from the external environment visually while driving. More than 80% of all information the driver receives while driving is through the sense of sight [2], while over 80% of the conclusions the driver makes are based on perceived colors [2]. The driver perceives objects in 3D and 2D space while driving. The eye recognizes the color yellow, followed by green, red, blue, and violet, best [3]. Colors provide important information in everyday life and “stimulate memory, engage participation, attract attention, transmit messages and create feelings” [2]. Cases of partial color blindness, and the inability to distinguish between red and green colors, are common, and complete color blindness is rare [3]. About 8% of people have congenital disabilities in recognizing colors, and this is mostly the case in men [3]. When it comes to rear-view mirrors, the question is how big the blind spot problem in a vehicle is when using rear-view mirrors [4,5,6]. The blind spot problem is much more pronounced in trucks than in passenger vehicles. The results of certain studies indicate that around 500 people die annually because of the impossibility of spotting vulnerable road users [6]. For this reason, different types of rear-view mirrors, as well as cameras and sensors on vehicles, have been introduced.
Distance estimation is especially necessary and important when overtaking, passing other vehicles, parking, and in other similar situations [3]. In estimating distances greater than 5 m, among other things, the body position of the person estimating the distance also plays an important role [7]. Distance estimation while driving can be performed by direct or indirect observations. Indirectly, the space is estimated using the mirror in the vehicle or on the monitor via the camera. There is a large number of studies that examine distance estimation using a rear-view mirror or a camera [8,9,10,11].
A study by Bernhard and Hecht examined distance estimation using rear-view mirrors and a camera depending on different driver and camera positions [8]. In the conclusion of the study, it is stated that Lower camera positions led to distance overestimation, and, on the other hand, higher positions led to underestimation. Hahnel and Hecht, in their study, examined distance estimation using vehicle rear mirrors, depending on the position of the mirror [10]. Variations in the rear-mirror position have a negligible effect on distance estimation, according to the results of the aforementioned study. There is a dilemma about the type of mirrors used in a vehicle. The use of convex rear-view mirrors in vehicles, instead of planar mirrors, is increasing. However, the results of individual studies do not confirm the practical benefits of convex mirrors [11]. Regulations covering the standardization of rear-view mirrors in vehicles vary between countries. For example, European Union standards define the use of convex mirrors on the driver’s side. On the other hand, standards in America only allow it on the passenger side [10].
For the above-mentioned reasons, an experimental study was conducted on how drivers estimate the distance of objects using the rear-view mirror in the vehicle in three analyzed conditions: direct perception, using the rear-view mirror, and using the camera.

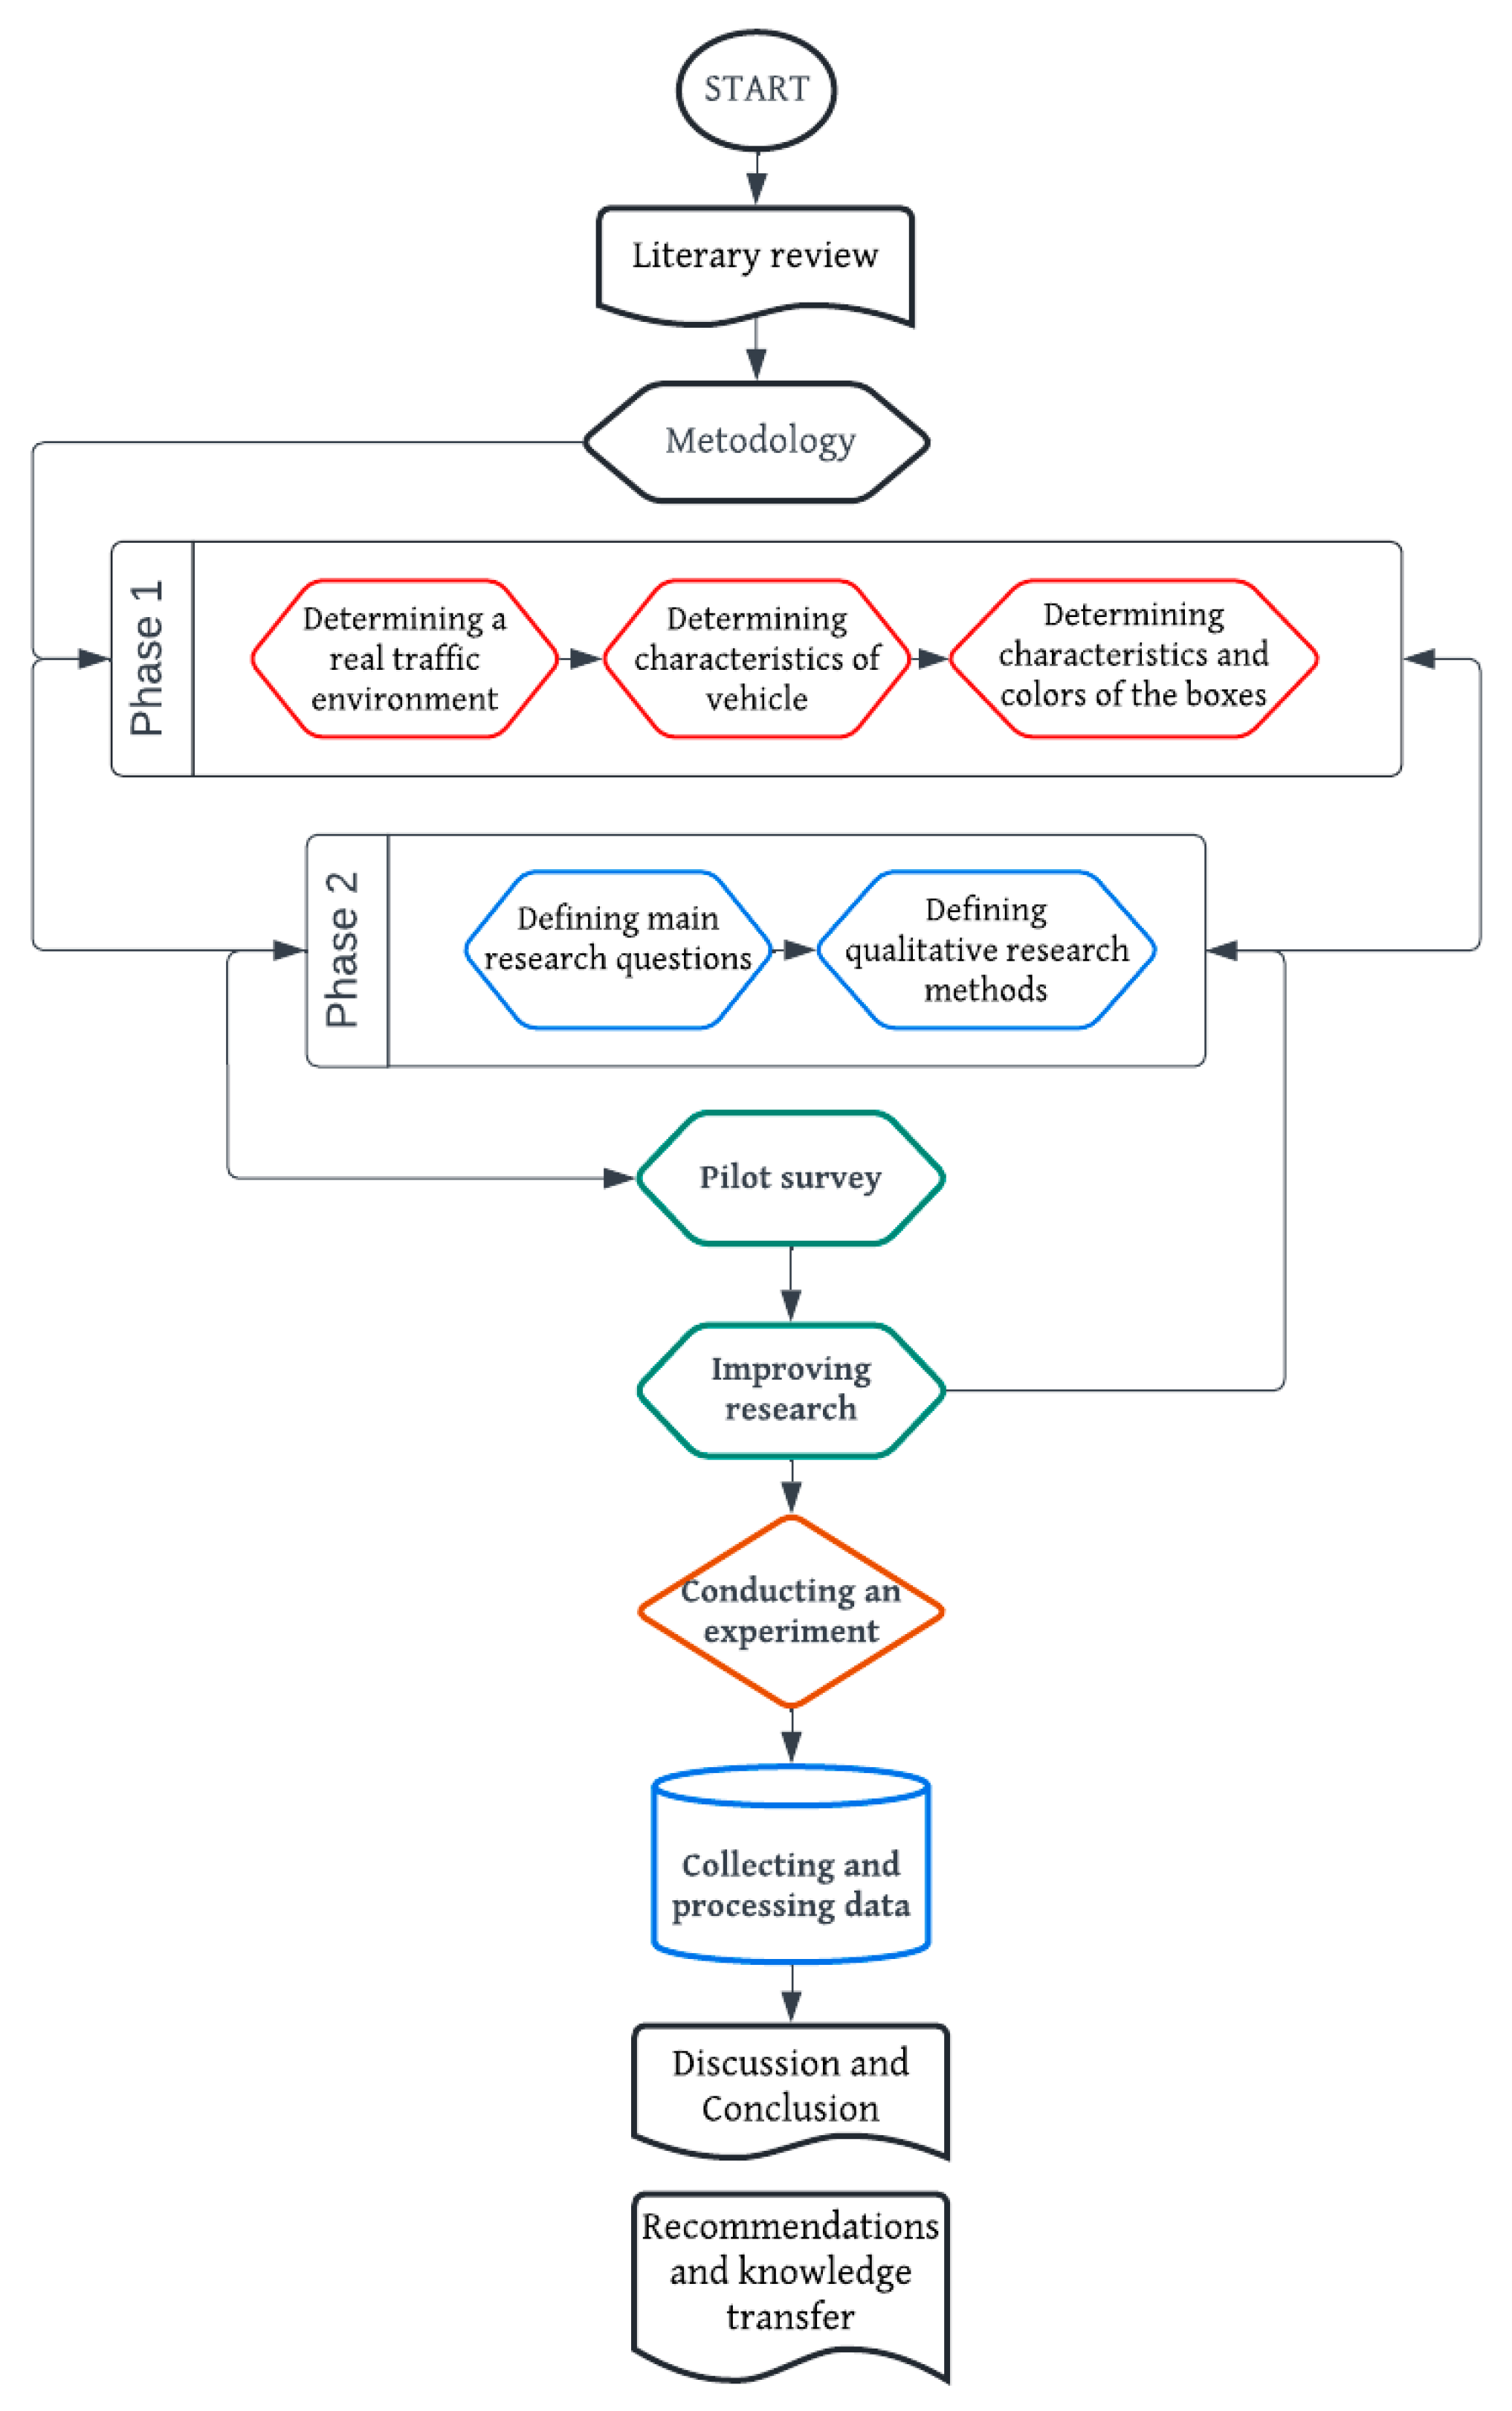
2. Materials and Methods

For the purpose of this research, an experiment was conducted to examine the differences in the estimation of the distance to objects of different colors, in situations when the driver observes the object by looking over the driver’s shoulder, looking in the side-view mirrors and looking at the camera display.

2.1. Procedure

For the purposes of this experiment, participants were presented with 12 different situations of distance estimation at the training ground: 4 situations in which participants had the task of estimating the distance to the object by looking over the driver’s shoulder, from the driver’s seat; 4 situations of distance estimation by looking in the side-view mirrors; and 4 situations by looking at the camera display. In all described situations, the participants estimated the distance to the box of red, yellow, green, and blue colors. There was no horizontal or vertical signaling on the training ground. The experiment was conducted in a real traffic environment so that the respondents would have the same feeling as if they were driving in real environment conditions [12,13]. The task for the respondents was to estimate the distance of objects in three different situations (direct observation, rear-view mirror, camera).
Respondents pronounced the estimated values orally while the assistant wrote the answer in the survey. In addition to the above questions, the survey also included demographic questions about the respondent [14].

2.2. Experimental Design and Protocol

The research was conducted at the end of 2022. The respondents voluntarily participated in the research. The order of estimated distances was chosen in a random order [14]. The participants estimated the distance to the objects (red, yellow, green, and blue) for all three conditions:
  • Looking over the driver’s shoulder;
  • Looking in the side-view mirrors;
  • Looking at the camera display.
Participants were not offered answers but reported the estimated values themselves [12]. The flowchart of the research methodology is shown in Figure 1.

2.3. Stimuli

2.3.1. Characteristics of Vehicle

The vehicle used in the experiment was a “Skoda” of the “Kamiq” type. The dimensions of the vehicle are 4241 mm in length, 1793 mm in width and 1531 mm in height.

2.3.2. Description of Objects Used in the Experiment

For the purposes of this research, four boxes were used (height 25 cm, 36 cm in length and 26 cm in width). The objects were wrapped in different colors:
Object 1: red, without reflection;
Object 2: yellow, reflective foil;
Object 3: green, without reflection;
Object 4: blue, reflective foil.
The chosen colors of the stimuli used in the experiment are based on the colors used for traffic signals. For example, red, yellow and green colors are used on traffic lights. All traffic warning signs (e.g., Figure 2) (and some signs of explicit orders) are also lined with red colors.
On the other hand, some traffic signs of information and explicit orders are blue (e.g., Figure 3 and Figure 4).
The fourth color used in the research is yellow. The specified color is used for temporary traffic signals in the road works zone (e.g., Figure 5).
The first (red) object was at a distance of 4.5 m, the second (yellow) object was at a distance of 5.5 m, the third (green) object was at a distance of 6.0 m, and the fourth (blue) object was at a distance of 7 m from the rear of the vehicle.

2.4. Collecting and Processing Data

For the purposes of this paper, the data were processed in the SPSS v.22 software package. Parametric methods were used for the analysis. An independent samples t-test, a paired samples t-test, and a one-way ANOVA were used. The threshold for statistical significance (a) was set at 5%.
  • Null and alternative hypotheses were established. Hypothesis (H0): There is no statistically significant difference between the estimation of the distance to the object of different colors.
  • Alternative hypotheses were that there are statistically significant differences in the estimation of the distance to the object of different colors depending on:
  • Hypothesis 1 (H1): all examined conditions;
  • Hypothesis 2 (H2): gender;
  • Hypothesis 3 (H3): category of driver’s license;
  • Hypothesis 4 (H4): driving experience;
  • Hypothesis 5 (H5): frequency of driving;
  • Hypothesis 6 (H6): use of glasses while driving;
  • Hypothesis 7 (H7): dominant lateralization.

3. Results

3.1. Descriptive Statistics

One-hundred-and-sixty-four subjects, with an average age of 20.17, participated in the research. A total of 31.7% of female and 68.3% of male respondents participated in the experiment. The highest percentage of participants, 81.7%, had a driver’s license for a passenger car, 7.3% for a passenger car and a goods vehicle, and 3.7% for a passenger car and a motorcycle, while 7.3% of the participants stated that they do not have driver’s license. A total of 85.4% of participants had a driver’s license for 1 to 3 years, which indicated that they were young road users. Between 3 and 5 years, 6.1% of participants had a driver’s license, and for less than a year for 2.4% of participants. A total of 68.3% of participants indicated that they do not use glasses or contact lenses, while 31.7% of participants indicated that they do. A total of 95.1% of the participants indicated that they were right handed, while 4.9% indicated that they were left handed.

3.2. Estimation of Distance to the Object

Figure 6 shows the descriptive statistics of the estimation of the distance to the object for all conditions and all colors. The arithmetic mean of the results shows that errors in distance estimation differ depending on the color of the object, as well as depending on the conditions of conducting the experiment. Participants with the smallest error estimated the distance to the red object better, in the conditions when the driver was sitting and looking at the camera display (M = 3.934; SD = 1.927), while the participants, in the situation when the driver was sitting and looking in the side-view mirror (M = 4.957; SD = 1.667) and in the situation when the driver was sitting and looking over his shoulder (M = 5.065; SD = 1.401), estimated the distance to the yellow object with the smallest error (Table 1 and Table 2; Figure 7).
The participants estimated the distance to the blue and green objects with the highest error in all described conditions.

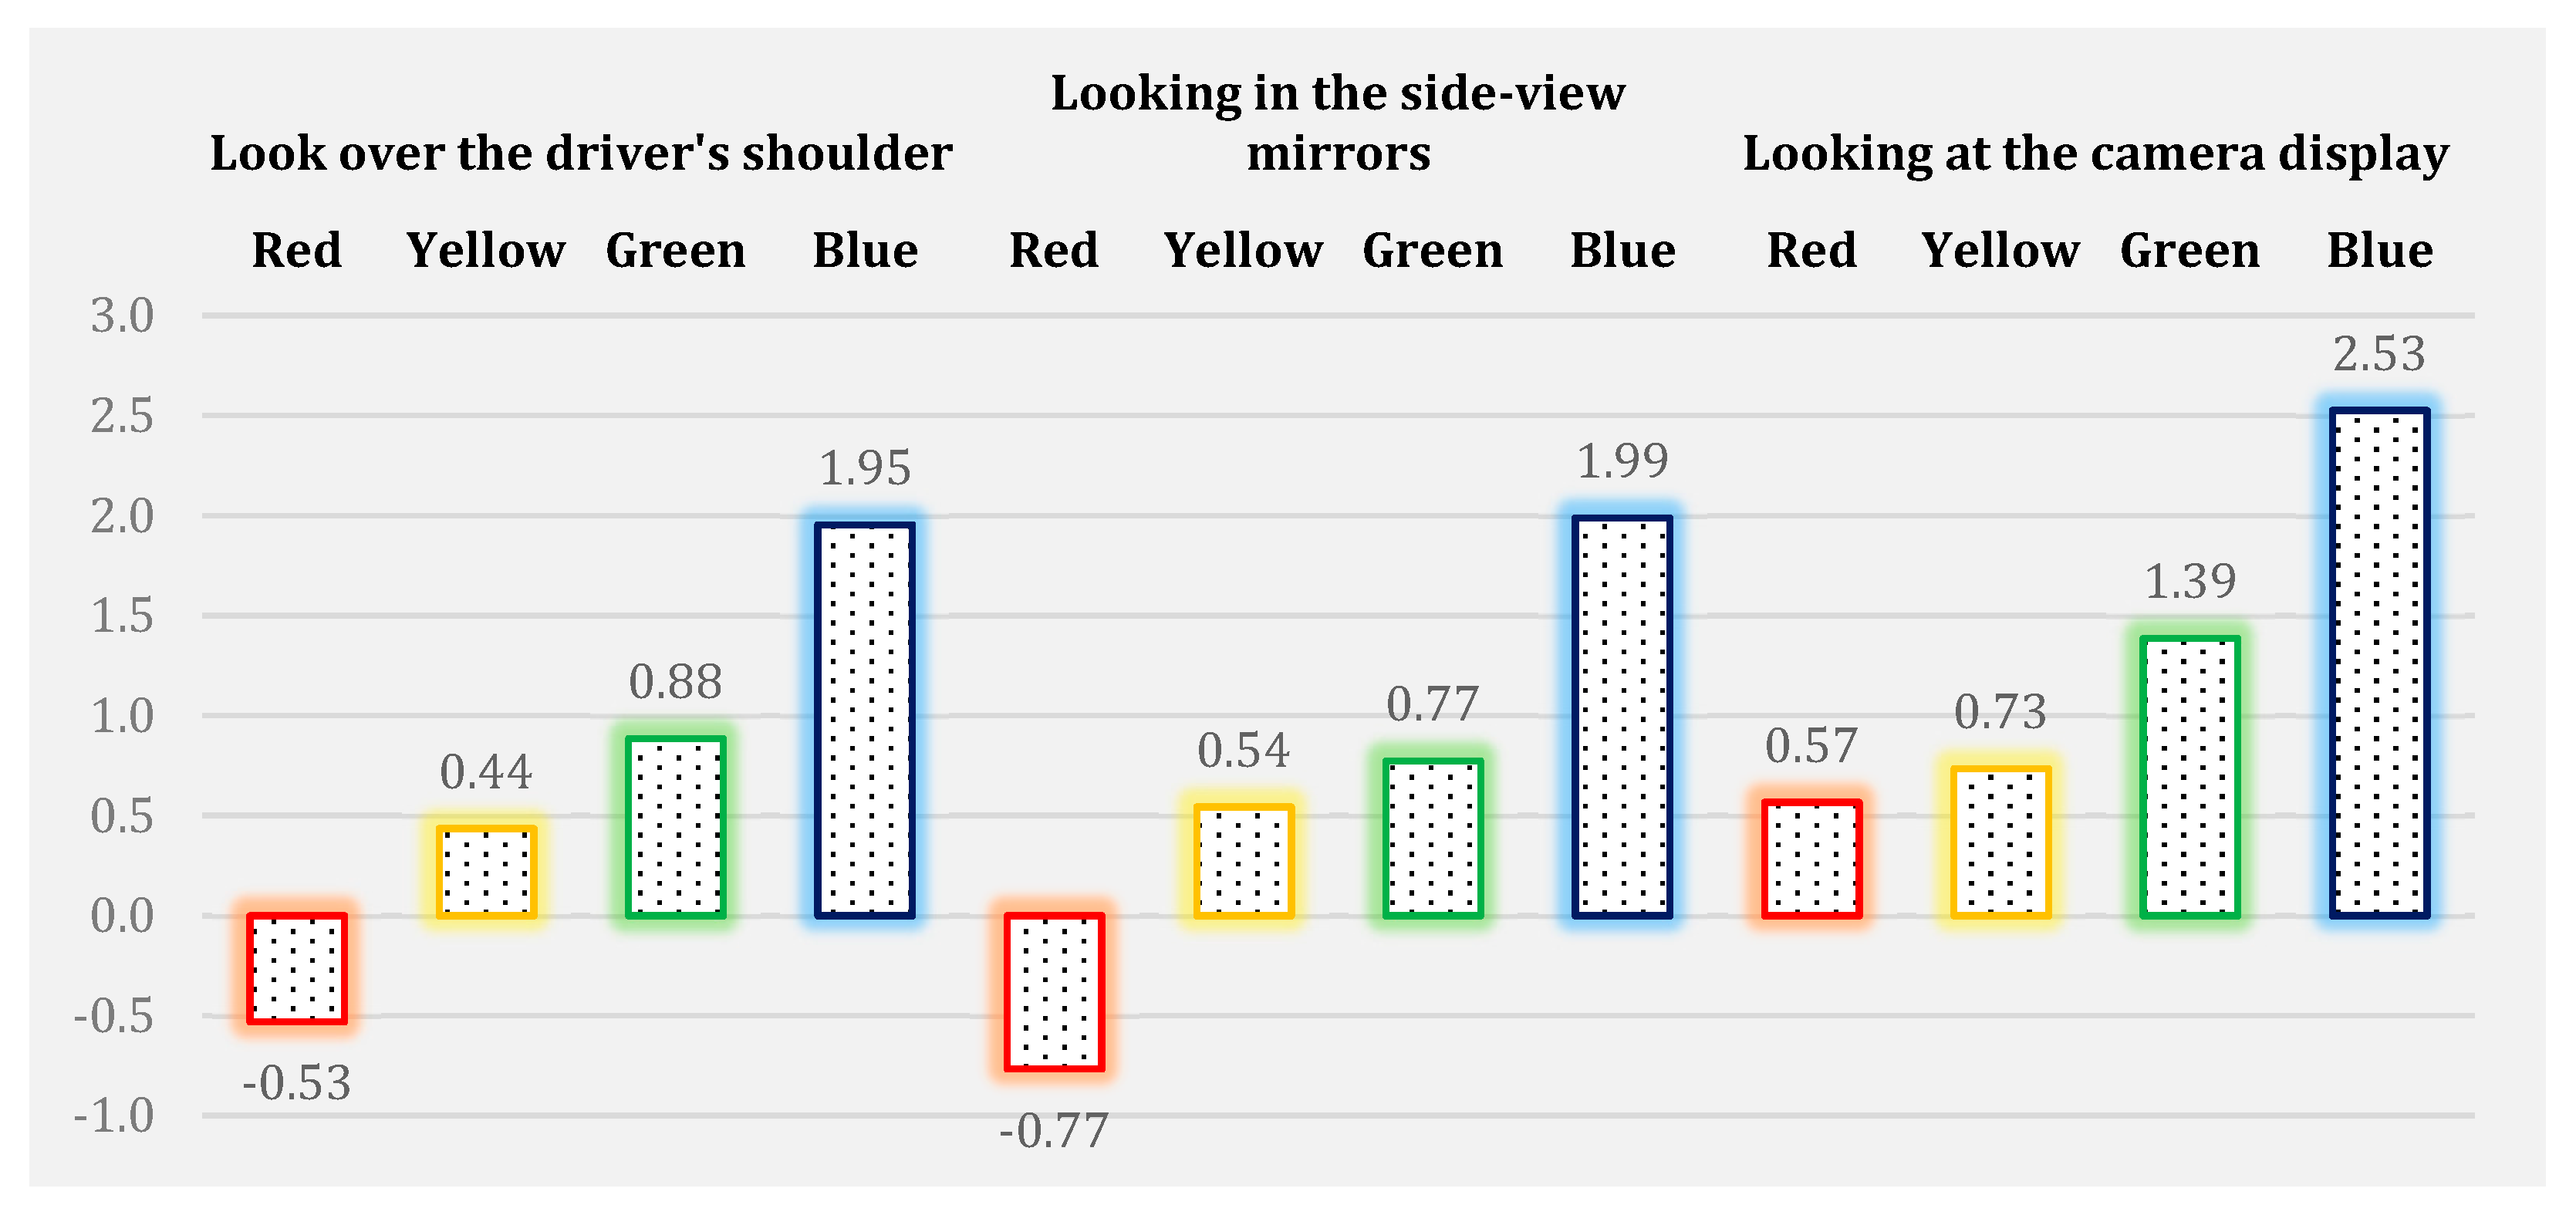
3.3. The Relationship between the Estimation of Distance and Colors of the Object

In this part of the paper, using a paired-samples t-test, the potential connection between the estimation of the object’s distance by the participant, in all described conditions, and the color of the observed object was analyzed. According to the results, it can be concluded that there are were no significant statistical differences for the object of blue color (t = −0.480; p = 0.632), green color (t = 1.327; p = 0.186), and yellow color (t = −1.468; p = 0.144) in conditions when the driver estimated the distance of the object by looking at the object over his shoulder and by looking in the rear-view mirror of the vehicle. In all other described conditions and with all tested colors there were significant statistical differences. The relationship between the estimation of the distance of the object by the participant, in all described conditions, and the color of the observed object are shown in Table 3.

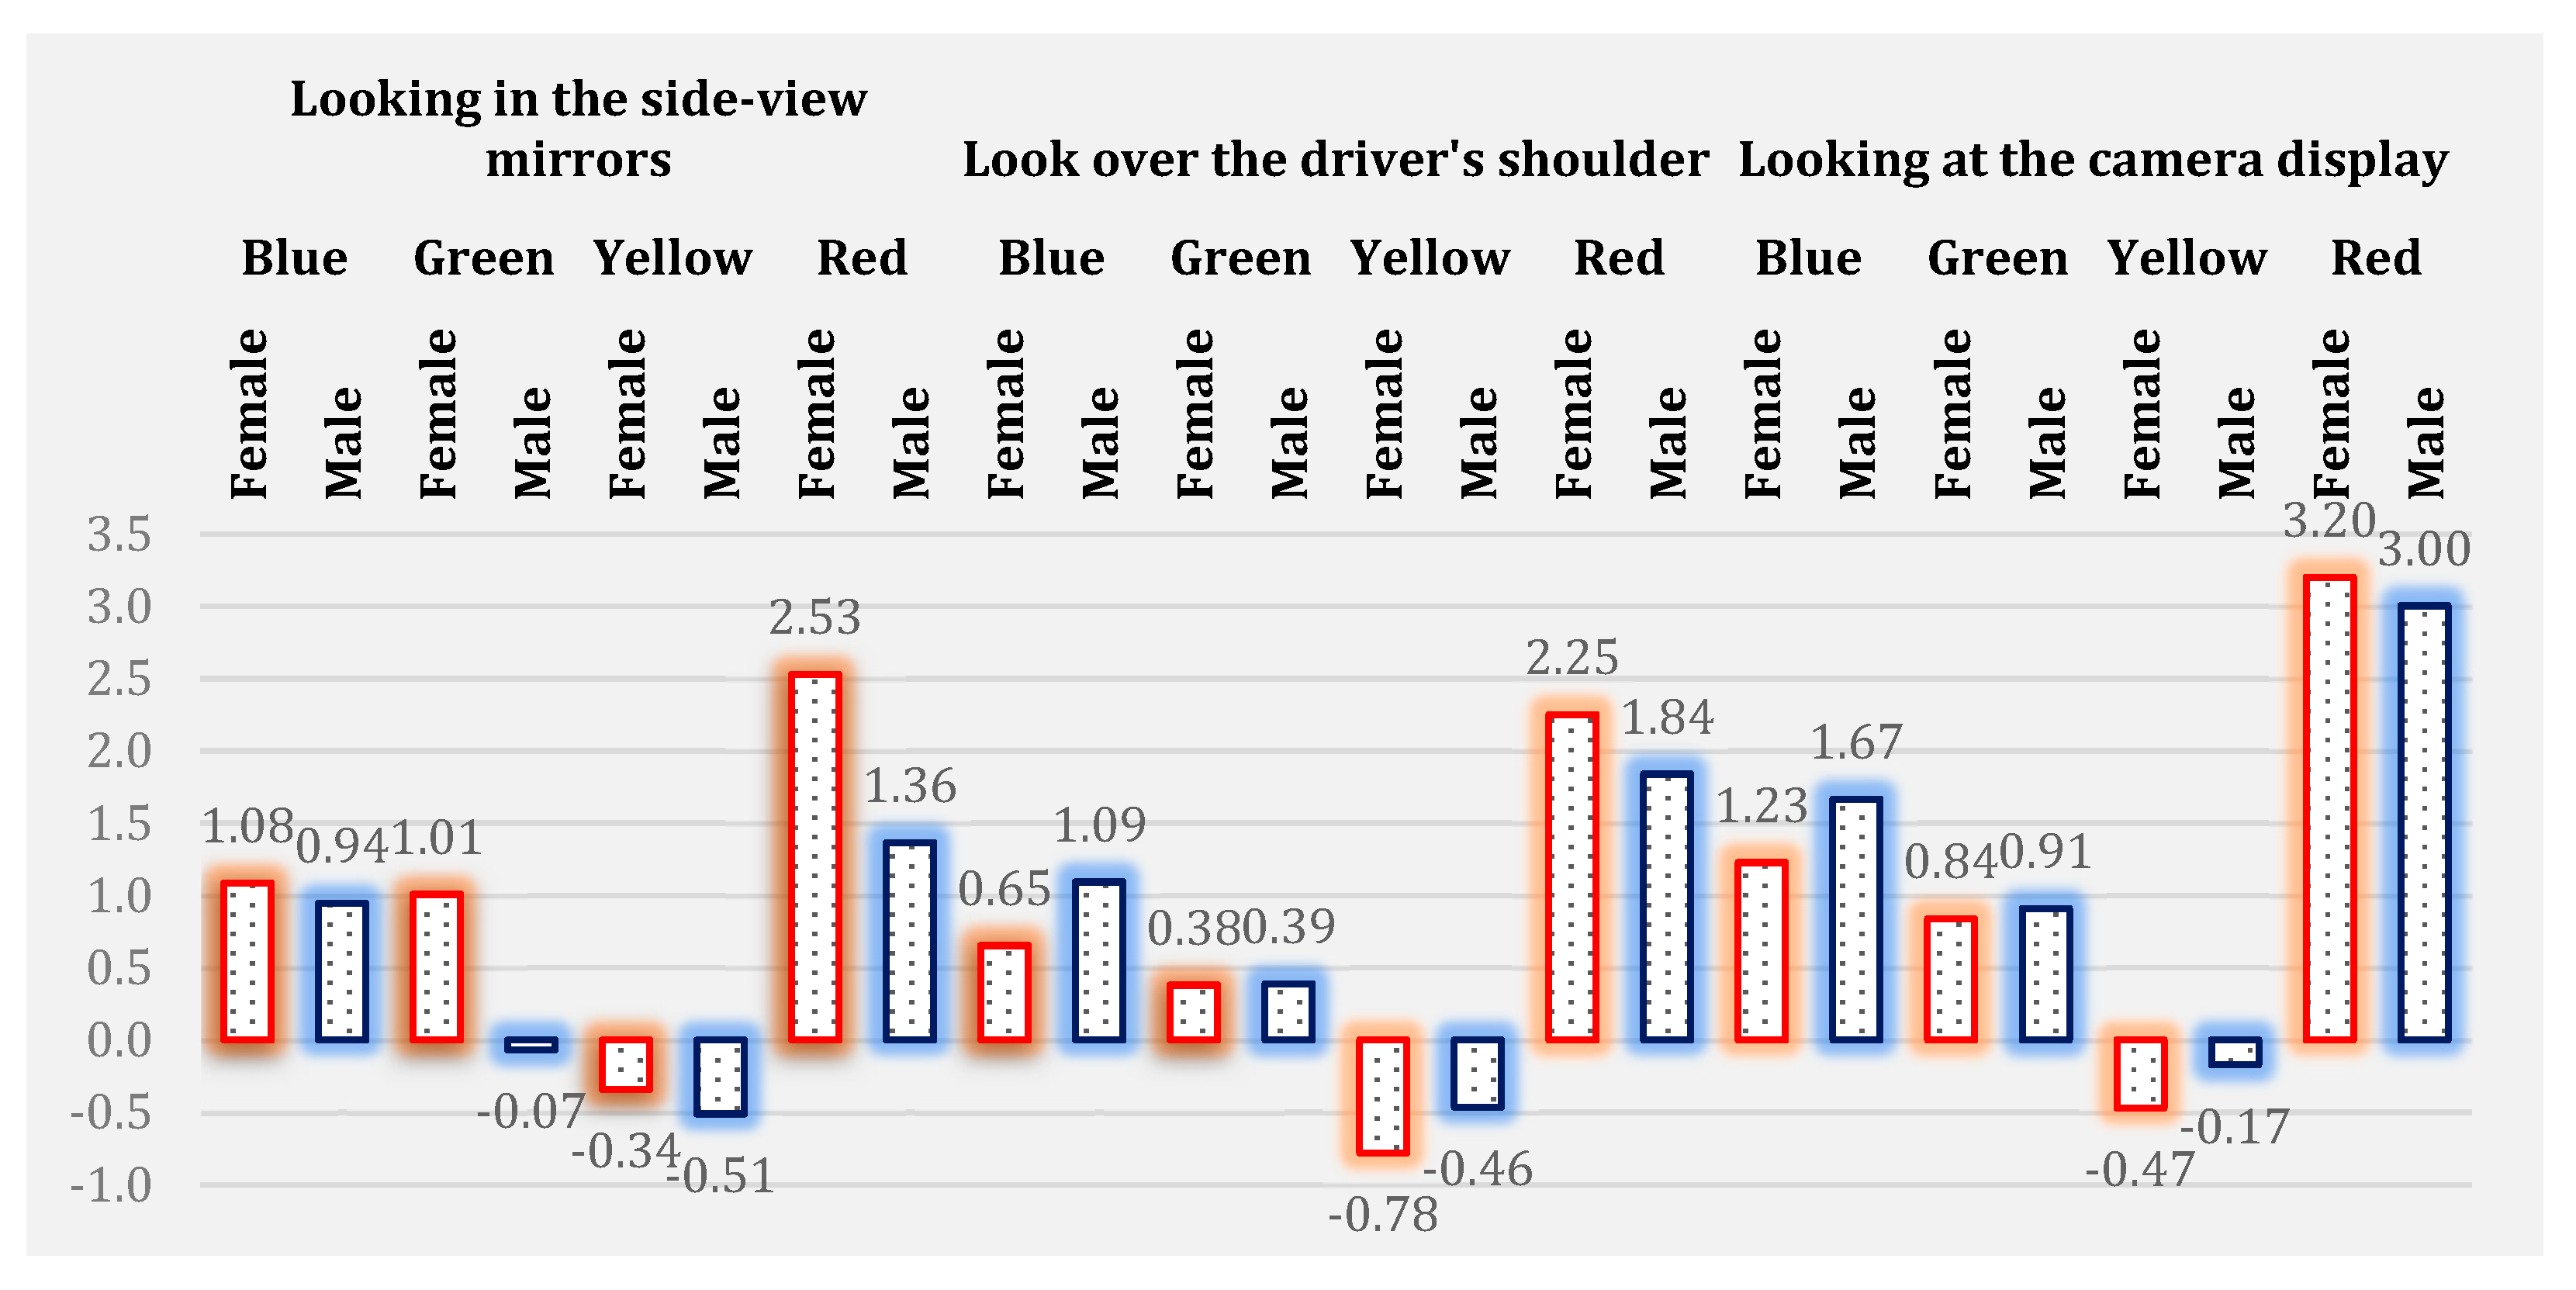
3.4. Gender Differences

Using an independent samples t-test, the estimation of the distance of the object depending on the participant’s gender was analyzed for all described conditions and colors of the object (Figure 8). The results showed statistically significant gender differences in men (M = 5.568; SD = 1.864) and women (M = 4.492; SD = 1.796) for estimating the distance of the green object (t = −3.525; p = 0.001), in men (M = 5.636; SD = 2.108) and women (M = 4.473; SD = 1.561) for estimating the distance of a red object (t = −3.951; p = 0.000) in the situation when the driver estimated the distance by looking in the side-view mirrors, in men (M = 4.906; SD = 1.371) and women (M = 5.346; SD = 1.289) for estimating the distance of the blue object (t = 1.992; p = 0.049) in the situation when the driver estimated the distance by looking over the driver’s shoulder, as well as in men (M = 4.335; SD = 1.437) and women (M = 4.773; SD = 1.203) for estimating the distance of the blue object (t = 2.037; p = 0.044) in the situation when the driver estimated the distance by looking at the camera display.
Women estimated the distance of a blue and green object with the smallest error, while men estimated the distance of a yellow and red object in a situation where the driver was looking at the object over driver’s shoulder and through the camera display. When the participants estimated the distance by observing the objects using the side-view mirrors, men estimated the distance to blue, green, and red objects with the smallest error, while women estimated the distance to the yellow object with the smallest error.

3.5. Driving License Category and Estimation of the Distance to the Object

One-way ANOVA was used to examine the differences in the estimation of the distance to objects for all tested conditions and all tested colors of objects, depending on the category of driver’s license. There was no significant difference in the results for the estimation of the distance to the object, depending on the category of driver’s license, for all tested conditions and for all tested colors.

3.6. The Influence of the Driver’s Experience on the Estimation of the Distance to the Object

The estimation of the distance to the object was separately analyzed for all tested conditions and for all tested colors, by drivers with different driving experience (drivers who have had a driver’s license for less than a year, between 1 and 3 years, between 3 and 5 years, and drivers who did not have a driver’s license). The results show a significant statistical difference between drivers with different driving experiences for the estimated distance to the green object in all tested cases (looking in the side-view mirrors (F = 2.658; p = 0.050), looking over the driver’s shoulder (F = 3.811; p = 0.011), and looking at the camera display (F = 3.825; p = 0.011)). The best estimate, i.e., the smallest error for estimating the distance to the green object, in all tested cases, was made by participants with 1 to 3 years of driving experience (looking in the side-view mirrors (M = 5.366; SD = 1.935), looking over the driver’s shoulder (M = 5.226; SD = 1.508), and looking at the camera display (M = 4.716; SD = 1.531)).

3.7. The Influence of the Frequency of Driving on the Estimation of the Distance to the Object

A separate section is dedicated to the analysis of the distance to the object estimation for all tested conditions and for all tested colors by drivers with different frequencies of driving. The results show a significant statistical difference between drivers with different frequencies of driving on the estimation of the distance to a blue object (F = 3.001; p = 0.013), a green object (F = 2.646; p = 0.025 ), and a yellow object (F = 2.746; p = 0.021) in a situation where the driver was looking in the side-view mirrors to the blue object (F = 2.350; p = 0.043), over the driver’s shoulder to the red object (F = 3.272; p = 0.008), and by looking at the camera display.
Drivers who participated in traffic between 3 and 5 times a week estimated the distance to the blue (M = 5.644; SD = 2.060) and green (M = 5.122; SD = 1.173) objects with the smallest error in the situation when the driver was looking in the side-view mirrors, as well as to a red object (M = 4.722; SD = 1.476) in the situation when the driver observed the object by looking at the camera display. Drivers who participated in traffic less than 3 times a week have the smallest error when estimating the distance to the yellow object, in the situation when the driver was looking in the side-view mirrors, while the most accurate estimate to the blue object, in the situation when the driver was looking over the driver’s shoulder, had drivers who participate less than 3 times a month.

3.8. The Influence of Wearing Glasses on the Estimation of the Distance to the Object

Using the independent samples t-test, object distance estimates were analyzed, and observed according to participants who wore or did not wear glasses for all described conditions and colors of objects. The results of the independent samples t-test showed statistically significant differences in participants who wore glasses (M = 4.531; SD = 1.777) and in participants who did not wear glasses (M = 3.657; SD = 1.939) for estimating the distance of the red object (t = −2.845; p = 0.005) in a situation where the driver estimated the distance to the object by looking at the camera display.

3.9. The Influence of Dominant Lateralization on the Estimation of the Distance to the Object

Using the independent samples t-test, object distance estimates were analyzed and observed according to the dominant lateralization of the participants for all described conditions and object colors. The results showed statistically significant differences in participants who were right handed (M = 5.094; SD = 1.426) and in participants who were left handed (M = 4.500; SD = 0.535) for estimating the distance of the yellow object (t = 2.689; p = 0.019) in the situation when the driver estimated the distance to the object by looking over the driver’s shoulder. Additionally, statistically, significant differences were observed in participants who were right handed (M = 4.794; SD = 1.435) and in participants who are left handed (M = 4.225; SD = 0.515) for the estimation of the distance to the yellow object (t = 2.642; p = 0.020), in a situation where the driver estimated the distance to the object by looking at the camera display.

4. Discussion

Sight is the most dominant form of sensory perception. From the literature, it can be concluded that more than 80% of all information the driver receives while driving is through the sense of sight, while over 80% of the decisions the driver makes are based on the perceived colors [2]. The perception of surroundings is one of the prerequisites for safe and successful driving [3]. Each driver’s perception is accompanied by an opinion and conclusion [3], based on which drivers behave in traffic. One of the factors that influence the occurrence of road crashes is a wrong perception, i.e., the formation of a wrong opinion and conclusion.
Research shows that a change in body position affects the difference in distance perception at a distance greater than 1 m, i.e., at 3 and 5 m [7]. The eye recognizes yellow, followed by green, red, blue, and violet color best [3]. Bearing the above in mind, the choice of objects in this research was based on colors, which are predominantly used in traffic signs.
The position of the body, head, and eyes affects the accurate estimation of distance; thus, the position of the driver can also have a great influence on the estimation of the distance using the rear-view mirror and the camera.
The results obtained and presented in this paper, from the aspect of traffic safety, but also vehicle design can be very worrying. The alternative hypotheses H1, H2, H4, H5, H6 and H7, are accepted, while the alternative hypothesis H3 is rejected. The above-mentioned results can have an impact on increasing the safety of all road users, on the one hand, and, on the other hand, the results can be used in the automotive industry for the creation and improvement of on-board cameras, but also in other areas (e.g., psychology).
The results show that the respondents for the largest number of stimuli best estimated the distance as direct observation, then through the rear-view mirror, while they make the most mistakes when estimating the distance of 3D objects using the camera display in a vehicle. These results are similar to the results of a study in which the use of mirrors and cameras was analyzed for tracking agricultural machinery on the back of a tractor [15]. A similar conclusion was reached in a study in which the influence of the distance and curvature of the rear-view mirror was examined on the estimation of the distance and the time until the vehicle came into contact with the object [10]. Additionally, in this study, it is stated that the rear-view mirror is not ideal for the perception of space and that people do not perceive the distance through the rear-view mirror, as in direct perception. In addition to the above, there are also studies that analyze injuries caused by rear-view mirror glass, as a result of a road crash, which suggest the necessity of additional protections for breaking glass on the rear-view mirror [16,17].
Standards related to the construction of rear-view mirrors in vehicles vary significantly around the world. For example, standards in the European Union define the use of convex rear-view mirrors on the driver’s side, while standards in the United States of America only allow for the passenger side. [10]. In addition to the above, a study that examined distance estimation by direct perception and convex rear-view mirrors showed that respondents make more significant errors in distance estimation when using convex mirrors [11].
On the other hand, some recent studies highlighted the advantages of using cameras in the vehicle instead of rear-view mirrors [8,9], such as improved aerodynamics and enlarged fields-of-view [8].

5. Conclusions

The most important results of this paper are highlighted below:
  • Participants with the smallest error estimated the distance to the red object better in the conditions when the driver was sitting and looking at the camera display (M = 3.934; SD = 1.927), while for the participants, in the situation when the driver was sitting and looking in the side-view mirror (M = 4.957; SD = 1.667) and in the situation when the driver was sitting and looking over his shoulder (M = 5.065; SD = 1.401), they estimated the distance to the yellow object with the smallest error;
  • The participants estimated the distance to the blue and green objects with the highest error in all described conditions;
  • There are differences for the color red in the situation when the driver estimated the distance of the object by looking at the object through the rear-view mirror and over the shoulder;
  • There are differences for blue, green, yellow, and red colors in a situation when the driver estimated the distance of the object by looking at the object over driver’s shoulder and at the camera display;
  • There are differences for blue, green, yellow, and red colors in a situation when the driver estimates the distance of the object by looking at the object through the rear-view mirror and in the camera display;
  • Women estimated the distance of blue and green objects with the smallest error, while men estimated the distance of yellow and red objects with the smallest error, in a situation where the driver was looking at the object over his shoulder and through the camera display;
  • When the participants estimated the distance by observing the objects using the side-view mirrors, men estimated the distance to blue, green, and red objects with the smallest error, while women estimated the distance to the yellow object with the smallest error;
  • There was no significant difference in the results for the estimation of the distance to the object, depending on the category of driver’s license, for all tested conditions and for all tested colors;
  • The results show a significant statistical difference between drivers with different driving experiences for the estimated distance to the green object in all tested conditions (looking in the side-view mirrors (F = 2.658; p = 0.050), looking over the driver’s shoulder (F = 3.811; p = 0.011), looking at the camera display (F = 3.825; p = 0.011)). The best estimate, i.e., the smallest error for estimating the distance to the green object in all tested conditions, was made by participants with 1 to 3 years of driving experience (looking in the side-view mirrors (M = 5.366; SD = 1.935), looking over the driver’s shoulder (M = 5.226; SD = 1.508), looking at the camera display (M = 4.716; SD = 1.531));
  • The results show a significant statistical difference between drivers with different frequencies of driving on the estimation of the distance to a blue object (F = 3.001; p = 0.013), a green object (F = 2.646; p = 0.025), and a yellow object (F = 2.746; p = 0.021) in the situation when the driver was looking in the side-view mirrors, to the blue object (F = 2.350; p = 0.043) in the situation when the driver was looking over the driver’s shoulder, and to the red object (F = 3.272; p = 0.008) in the situation when the driver observed the object by looking at the camera display;
  • The results showed statistically significant differences in participants who wore glasses (M = 4.531; SD = 1.777) and in participants who did not wear glasses (M = 3.657; SD = 1.939) for estimating the distance of the red object (t = −2.845; p = 0.005), in a situation where the driver estimated the distance to the object by looking at the camera display;
  • The results showed statistically significant differences in subjects who were right handed (M = 5.094; SD = 1.426) and in subjects who were left handed (M = 4.500; SD = 0.535) for estimating the distance of the yellow object (t = 2.689; p = 0.019), in a situation where the driver estimated the distance to the object by looking over the driver’s shoulder. Additionally, statistically significant differences were observed in participants who were right handed (M = 4.794; SD = 1.435) and in participants who were left handed (M = 4.225; SD = 0.515) for the estimation of the distance to the yellow object (t = 2.642; p = 0.020), in a situation where the driver estimated the distance to the object by looking at the camera display.
  • Recommendations
  • The above results can be used to improve the display of information to the driver in the cockpit of the vehicle. Using modern mathematical tools [18,19], modeled objects from the real environment can be displayed in the vehicle in 3D. Certainly, it is necessary to examine the appearance and position of the screen in the vehicle from an ergonomic point of view due to a better perception of the driver and less distraction. In this way, it would be easier for the driver to assess information from the external environment. Apart from the application in the automobile and truck industry, a large application can also be achieved with tractors because it is of great importance for tractors to precisely monitor the movement of the attachment device on the rear side of the tractor. However, users’ acceptability to switch to modern technologies remains an open question.
The experimentally obtained data presented in the paper have a significant impact on road safety. Namely, in the paper, it was proven that different colors were perceived differently under all tested conditions and box colors, which can be used primarily for the analysis of road crashes that occurred when the vehicle was moving backward. Additionally, the results can be used for the purpose of conducting campaigns and education for young drivers, as well as for the purpose of developing new systems that would enable drivers to have a more accurate and reliable perception of the distance to the object. In addition to the above, the results can be used to design driveway/traffic mirrors and even transition to digital roadside mirrors.

5.1. Limitations

One of the limitations of the study may be the sample size and the age structure of the respondents (youth). Additionally, only one vehicle was used in the experiment, and they all stimulated in the form of a square.

5.2. Future Research

The directions of future research should be directed toward increasing the different distances of the stimulus from the vehicle, introducing new objects, a greater number of colors, sizes, and shapes of stimuli, and conducting experiments under different conditions of visibility (morning, noon, evening, night, in conditions of reduced visibility), etc. On the other hand, it is necessary to collect more demographic data from the respondents, as well as information about personality characteristics, which can influence this topic, but also to increase the sample. Additionally, in the following studies, it is necessary to use more advanced methods in the form of artificial intelligence, fuzzy logic, as well as other modern mathematical methods (e.g., the measure for solving the 3D object detection [20], Jensen–Shannon distance [21], etc.)

Author Contributions

Conceptualization, S.Č., T.I. and A.T. methodology, S.S. and A.T.; software, T.I. and V.V.; validation, T.I., A.T., Ž.S. and S.S.; formal analysis, T.I. and S.Č.; investigation Ž.S. and S.S.; resources, S.Č. and A.T.; data curation, T.I. and V.V.; writing—original draft preparation, S.Č., T.I. and A.T.; writing—review and editing, A.T.; visualization, T.I. and Ž.S.; supervision, T.I. and S.Č.; project administration, T.I. and A.T.; funding acquisition, Ž.S. and S.S. All authors have read and agreed to the published version of the manuscript.

Funding

This research received no external funding.

Institutional Review Board Statement

Not applicable.

Informed Consent Statement

Not applicable.

Data Availability Statement

Not applicable.

Acknowledgments

The authors acknowledge the constructive comments of the three reviewers, which have helped to improve this paper significantly.

Conflicts of Interest

The authors declare no conflict of interest.

References

  1. Frostig, M.; Lefever, D.W.; Whittlesey, J.R. A developmental test of visual perception for evaluating normal and neurologically handicapped children. Percept. Mot. Ski. 1961, 12, 383–394. [Google Scholar] [CrossRef]
  2. Grandi, B.; Cardinali, M.G. Colours and Price Offers: How Different Price Communications Can Affect Sales and Customers’ Perceptions. SSRN Electron. J. 2022, 68, 103073. [Google Scholar] [CrossRef]
  3. Milić, A. Traffic Psychology; Faculty of Transport and Traffic Engineering: Belgrade, Serbia, 2007. [Google Scholar]
  4. Chun, J.; Lee, I.; Park, G.; Seo, J.; Choi, S.; Han, S.H. Efficacy of haptic blind spot warnings applied through a steering wheel or a seatbelt. Transp. Res. Part F Traffic Psychol. Behav. 2013, 21, 231–241. [Google Scholar] [CrossRef]
  5. Vincent, D.S.; Pitchipoo, P.; Rajakarunakaran, S. Elimination of blind spots for heavy transport vehicles by driver seat design. In Proceedings of the Second International Conference on Advanced Manufacturing and Automation, Krishnankoil, India, 28–30 March 2013. [Google Scholar]
  6. Pitchipoo, P.; Vincent, D.S.; Rajini, N.; Rajakarunakaran, S. COPRAS Decision Model to Optimize Blind Spot in Heavy Vehicles: A Comparative Perspective. Procedia Eng. 2014, 97, 1049–1059. [Google Scholar] [CrossRef] [Green Version]
  7. Gudzulić, V.; Baroš, M. Upside-Down World – The Importance of Vestibular Information for Percieved Distance. J. Psychol. 2008, 455–461. [Google Scholar]
  8. Bernhard, C.; Hecht, H. The Ups and Downs of Camera-Monitor Systems: The Effect of Camera Position on Rearward Distance Perception. Hum. Factors J. Hum. Factors Ergon. Soc. 2020, 63, 415–432. [Google Scholar] [CrossRef] [PubMed]
  9. Bernhard, C.; Klem, A.; Altuntas, E.C.; Hecht, H. Wider is better but sharper is not: Optimizing the image of camera-monitor systems. Ergonomics 2022, 65, 899–914. [Google Scholar] [CrossRef] [PubMed]
  10. Hahnel, U.J.; Hecht, H. The impact of rear-view mirror distance and curvature on judgements relevant to road safety. Ergonomics 2011, 55, 23–36. [Google Scholar] [CrossRef] [PubMed]
  11. Hecht, H.; Brauer, J. Convex rear view mirrors compromise distance and time-to-contact judgements. Ergonomics 2007, 50, 601–614. [Google Scholar] [CrossRef] [PubMed]
  12. Ivanišević, T.; Ivković, I.; Čičević, S.; Trifunović, A.; Pešić, D.; Vukšić, V.; Simović, S. The impact of daytime running (LED) lights on motorcycles speed estimation: A driving simulator study. Transp. Res. Part F Traffic Psychol. Behav. 2022, 90, 47–57. [Google Scholar] [CrossRef]
  13. Simović, S.; Ivanišević, T.; Trifunović, A.; Čičević, S.; Taranović, D. What Affects the E-Bicycle Speed Perception in the Era of Eco-Sustainable Mobility: A Driving Simulator Study. Sustainability 2021, 13, 5252. [Google Scholar] [CrossRef]
  14. Pešić, D.; Trifunović, A.; Ivković, I.; Čičević, S.; Žunjić, A. Evaluation of the effects of daytime running lights for passenger cars. Transp. Res. Part F Traffic Psychol. Behav. 2019, 66, 252–261. [Google Scholar] [CrossRef]
  15. Ehlers, S.G.; Field, W.E. Determining the Effectiveness of Mirrors and Camera Systems in Monitoring the Rearward Visibility of Self-Propelled Agricultural Machinery. J. Agric. Saf. Health 2017, 23, 183–201. [Google Scholar] [CrossRef] [PubMed]
  16. Jin, S.X.; Panvini, A.R.; Chuck, R.S. Penetrating ocular injury from motor vehicle rear-view side-mirror. Am. J. Ophthalmol. Case Rep. 2020, 20, 100863. [Google Scholar] [CrossRef] [PubMed]
  17. Slović, Ž.S.; Vitošević, K.; Mihajlović, F.; Trifunović, A.; Todorović, M. Abdominal injuries in road traffic accidents-autopsy study. Vojnosanit. Pregl. 2022, 42. [Google Scholar] [CrossRef]
  18. Markova, K.T.; Dovramadjiev, T.A.; Jecheva, G.V. Computer parametric designing in Blender software for creating 3D paper models. Annu. J. Tech. Univ. Varna Bulg. 2017, 1, 77–84. [Google Scholar] [CrossRef]
  19. Wiegand, G.; Mai, C.; Holländer, K.; Hussmann, H. Incarar: A design space towards 3d augmented reality applications in vehicles. In Proceedings of the 11th International Conference on Automotive User Interfaces and Interactive Vehicular Applications, Utrecht, The Netherlands, 21–25 September 2019; pp. 1–13. [Google Scholar]
  20. Zeng, S.; Geng, G.; Zhou, M. Automatic Representative View Selection of a 3D Cultural Relic Using Depth Variation Entropy and Depth Distribution Entropy. Entropy 2021, 23, 1561. [Google Scholar] [CrossRef] [PubMed]
  21. Contreras-Reyes, J.E. Analyzing Fish Condition Factor Index Through Skew-Gaussian Information Theory Quantifiers. Fluct. Noise Lett. 2016, 15, 1650013. [Google Scholar] [CrossRef]
Figure 1. Flowchart research method diagram.
Mathematics 11 01258 g001
Figure 2. Traffic sign “No pedestrians” (II-17).
Mathematics 11 01258 g002
Figure 3. The traffic sign “Pedestrian crossing” (III-6).
Mathematics 11 01258 g003
Figure 4. The traffic sign “Walking trail” (II-41).
Mathematics 11 01258 g004
Figure 5. The traffic sign “Road works ahead” (I-19).
Mathematics 11 01258 g005
Figure 6. The estimation of the distance to the object for all conditions and all colors.
Mathematics 11 01258 g006
Figure 7. The mean error of the estimation of distance to the object for all conditions and all colors.
Mathematics 11 01258 g007
Figure 8. Mean error of estimation of the distance to the object for all conditions and all colors, observed by gender.
Mathematics 11 01258 g008
Table 1. Descriptive statistics of the estimation of the distance to the object.
Conditions Look over the Driver’s ShoulderLooking in the Side-View MirrorsLooking at the Camera Display
Distance RedYellowGreenBlueRedYellowGreenBlueRedYellowGreenBlue
Mean5.0305.0655.1155.0465.2674.9575.2275.0113.9344.7664.6144.474
Standard Deviation1.5861.4011.4961.3582.0211.6771.9051.5441.9271.4091.5091.379
Table 2. The mean error of the estimation of the distance to the object.
Conditions/ColorRedYellowGreenBlue
Look over the driver’s shoulder−0.530.440.881.95
Looking in the side-view mirrors−0.770.540.771.99
Looking at the camera display0.570.731.392.53
Table 3. Differences in the estimation of the distance to the object for all conditions and all colors.
ColorsConditionsMeanStr. DeviationtpEta SquareMagnitude of Impacts
BlueLooking in the side-view mirrors−0.0340.928−0.4800.632--
Look over the driver’s shoulder
Looking at the camera display0.5720.33222.0350.0000.749Large
Look over the driver’s shoulder
Looking in the side-view mirrors0.5370.9427.3060.0000.247Large
Looking at the camera display
GreenLooking in the side-view mirrors0.1121.0761.3270.186--
Look over the driver’s shoulder
Looking at the camera display0.5010.21629.7660.0000.845Large
Look over the driver’s shoulder
Looking in the side-view mirrors0.6131.0757.2980.0000.246Large
Looking at the camera display
YellowLooking in the side-view mirrors−0.1070.936−1.4680.144--
Look over the driver’s shoulder
Looking at the camera display0.2990.08246.5820.0000.930Large
Look over the driver’s shoulder
Looking in the side-view mirrors0.1910.9472.5890.0100.039Moderate
Looking at the camera display
RedLooking in the side-view mirrors0.2371.2902.3480.0200.032Moderate
Look over the driver’s shoulder
Looking at the camera display1.0961.9797.0960.0000.236Large
Look over the driver’s shoulder
Looking in the side-view mirrors1.3332.3107.3900.0000.251Large
Looking at the camera display
Disclaimer/Publisher’s Note: The statements, opinions and data contained in all publications are solely those of the individual author(s) and contributor(s) and not of MDPI and/or the editor(s). MDPI and/or the editor(s) disclaim responsibility for any injury to people or property resulting from any ideas, methods, instructions or products referred to in the content.

