Article

A Novel Fuzzy Unsupervised Quadratic Surface Support Vector Machine Based on DC Programming: An Application to Credit Risk Management

1
School of Mathematics, Harbin Institute of Technology, Harbin 150001, China
2
Department of Mathematics, Southern University of Science and Technology, Shenzhen 518055, China
3
College of Business, Southern University of Science and Technology, Shenzhen 518055, China
4
National Center for Applied Mathematics Shenzhen, Southern University of Science and Technology, Shenzhen 518055, China
*
Author to whom correspondence should be addressed.
Mathematics 2023, 11(22), 4661; https://doi.org/10.3390/math11224661
Submission received: 14 October 2023 / Revised: 10 November 2023 / Accepted: 13 November 2023 / Published: 16 November 2023
(This article belongs to the Special Issue Mathematical Methods and Models of FinTech)

Abstract

:
Unsupervised classification is used in credit risk assessment to reduce human resource costs and make informed decisions in the shortest possible time. Although several studies show that support vector machine-based methods have better performance in unlabeled datasets, several factors still negatively affect these models, such as unstable results due to random initialization, reduced effectiveness due to kernel dependencies, and noise points and outliers. This paper introduces an unsupervised classification method based on a fuzzy unsupervised quadratic surface support vector machine without a kernel to avoid selecting related kernel parameters for credit risk assessment. In addition, we propose an innovative fuzzy membership function for reducing noise points and outliers in line with the direction of sample density variation. Fuzzy Unsupervised QSSVM (FUS-QSSVM) outperforms well-known SVM-based methods based on numerical tests on public benchmark credit data. In some real-world applications, the proposed method has significant potential as well as being effective, efficient, and robust. The algorithm can therefore increase the number of potential customers of financial institutions as well as increase profitability.

1. Introduction

With the rapid growth of data mining, classification, also called clustering, has become an important task for extracting information from the data in machine learning methods. The support vector machine (SVM) is a well-known supervised classification technique that introduces an optimal hyperplane to maximize the margin between two labeled classes [1]. In many fields, including credit risk assessment, credit card fraud detection, stock prediction and disease diagnosis, the SVM has demonstrated exceptional performance [2,3,4,5]. The SVM allows us to classify an arbitrary number of end states without making assumptions about the distribution of input factors or the target category. Due to this advantage, the SVM algorithm is widely used in the field of credit risk management [6]. The purpose of credit risk management is to predict the relative risk of default among borrowers [7]. Financial institutions can reduce human resource costs and make appropriate decisions within a short period of time using machine learning.
Although these SVM-based methods are effective on labeled credit datasets, they cannot solve unsupervised learning problems without labels. Typically, labeling data points in real-world applications is time-consuming and labor-intensive, while obtaining large numbers of unlabeled data points is relatively easy [8]. In addition, a significant number of small and micro enterprises lack credit histories and have insufficient funding. In order to increase business opportunities for financial institutions, credit risk management should be extended to unlabeled datasets. The one-class SVM is a clustering method based on a single type of label [9]. The algorithm reduces reliance on dataset labels. The weight one-class SVM and fuzzy one-class SVM further improve the efficiency and accuracy of the OC-SVM [10,11]. However, OC-SVM-based methods rely heavily on the initial labeled data points. To overcome this drawback, an unsupervised absolute value inequality classifier (UAVIC) was proposed, which considers constructing hyperplanes containing data points [12]. With this unsupervised linear algorithm, dependence on dataset labels can be completely eliminated. In terms of linearly indivisible datasets, the unsupervised quadratic surface support vector machine (US-QSSVM) enhances the performance of the SVM-based unsupervised learning algorithms [8]. However, the classifier directly generated by UAVIC and the US-QSSVM model may suffer from noise points and outliers. This is due to the separation plane being positioned between the two planes, which must contain all samples.
In most supervised and unsupervised classification approaches based on SVM, noise points negatively affect decision plane learning. Fuzzy membership can be applied to each input point of the SVM, fuzzy SVM (FSVM), so that different input points can contribute differently to decision surface learning [13]. Fuzzy membership function based on Fisher Discriminant Analysis (FDA) further improves FSVM performance. In addition, the number of support vectors in fuzzy support vector machines can be reduced using the DC program [14]. It should be noted, however, that all these methods solve the problem of noise points through binary classification problems. The fuzzy one-class quadratic surface support vector machine (FOC-QSSVM) considers minimizing the within-class scatter, which solves the noise problem of OC-SVM [11]. However, fuzzy membership equations do not address the negative impact of noise points and outliers on unsupervised learning decision planes.
Financial institutions have suffered significant losses over the past few years as consumers and corporations default on loans. SVM models have often achieved superior performance among them [15]. However, the effectiveness and efficiency of general SVM-based credit scoring methods are also significantly influenced by the kernel used. Credit risk assessment therefore requires reducing the impact of kernel function selection on the robustness of classification results.
The motivation of this research is to propose an unsupervised learning method based on SVM for classification based on the connection between data points. We present a fuzzy unsupervised quadratic surface support vector machine (FUS-QSSVM) that optimizes the hyperplane by weakening outlier points with weak sample connections. This paper has several main contributions as follows:
  • In this study, we propose a fuzzy unsupervised quadratic surface support vector machine for credit risk assessment. This kernel-free unsupervised learning method can solve classification problems on unlabeled credit datasets. The algorithm was tested on several public credit datasets, and its performance was compared with the previously mentioned unsupervised SVM-based methods. The results showed that the proposed method outperformed unsupervised classification methods in terms of accuracy and robustness;
  • For weakening outlier points, we propose a fuzzy membership method based on Tomek link method. In unlabeled datasets, this method effectively reduces the impact of outliers and noise points on decision-making. With this fuzzy membership function, we can distinguish noise points that belong to different classes in unlabeled samples based on their connections and relationships;
  • After proving its boundness and convergence, a new DC algorithm (DCA) was developed to implement the proposed nonconvex model on numerous artificial and real-world benchmark datasets.
The rest of the paper is organized as follows. In Section 2, we briefly review DC programming and the US-QSSVM algorithm. Our method is presented in Section 3, and then we show its simple reformulation together with the DCA algorithm to solve the FUS-QSSVM model.
In Section 4, the results of numerical experiments on several public benchmark datasets are shown to evaluate the performance of our method. Section 5 summarizes the main findings of this paper and provides suggestions for future work.

2. Review of DC Programming and the Unsupervised Quadratic Surface Support Vector Machine

In this section, we briefly review DC programming and the US-QSSVM algorithm, which is solved by DCA [8].

2.1. DC Programming and DCA

Over the past three decades, non-convex programming and global optimization have seen dramatic developments. There has been considerable research on differential convex function (DC) programming as one of the major nonconvex optimization problems [16]. According to the literature on mathematical programming and real-life applications, DC programming optimization problems can be divided into two types [17].
  • i n f { g ( x ) h ( x ) : x R n } , where g and h are convex functions;
  • i n f { g ( x ) h ( x ) : x C , f 1 ( x ) f 2 ( x ) 0 } , where g , h , f 1 , f 2 and C are convex functions.
Such a function is called a DC function, and g h is a DC decomposition of a DC function, while convex functions g and h are DC components [18]. DC algorithms are based on local optimality conditions and duality in DC programming. This method approximates the second DC component h ( x ) using its affine minorization h k ( x ) : = h ( x k ) + < x x k , y k > , where y k h ( x k ) for each iteration k and minimizes its convexity as a result [18]. DCA converges from any starting point as it is a global convergence descent method without a line search. For a more detailed description, please refer to literature.

2.2. Unsupervised Quadratic Surface Support Vector Machine

Given a dataset of n unlabeled points { x i } , where x i = ( x 1 i , x 2 i , , x m i ) T R m . The quadratic surface is determined by the parameter set ( Q , f , c ) in the US-QSSVM algorithm as follows:
g ( x ) 1 2 x T Q x + f T x + c ,
where Q = ( q i j ) m × m S m , f = ( f i ) m R m and c R . This model tries to include all unlabeled points between two hyperplanes as 1 2 x T Q x + f T x + c = h and 1 2 x T Q x + f T x + c = h as tight as possible. Furthermore, this equates minimizing the distance between the hyperplanes 1 2 x T Q x + f T x + c = h and 1 2 x T Q x + f T x + c = 0 . However, the gradient directions of hyperplane g ( x ) = h are different at different points. Then, the US-QSSVM estimates the distance by calculating the mean geometric margins of all points in the dataset, where the gradient directions are the directions at each point. Overall, the US-QSSVM formulations are as follows:
m i n 1 n i = 1 n h Q x i + f 2 2 + η 1 ¯ i = 1 n ξ i s . t . 1 2 ( x ) T Q x i + f T x i + c h + ξ i , i = 1 , , n , 1 2 ( x ) T Q x i + f T x i + c h ξ i , i = 1 , , n , Q S m , ( f , c ) R m + 1 , h 0 , ξ i 0 , i = 1 , , n .
where the penalty parameter η 1 ¯ > 0 needs to be determined beforehand, and the slack variable ξ i measures the clustering error for x i . The optimal solution ( Q * , f * , c * , h * , ξ 1 * , , ξ n * ) determines the classifier g ( x ) = 0 . There are two main disadvantages to the US-QSSVM model. First, the hyperplane g ( x ) = 0 may not be an appropriate classifier because there may be differences in class distributions. Second, the distance between the two hyperplanes 1 2 x T Q x + f T x + c = h and 1 2 x T Q x + f T x + c = h is influenced by noise points. The results of the algorithm may not be as reliable as expected.

3. Proposed Method

In this section, we first propose a new fuzzy membership function for unsupervised learning and then propose the FUS-QSSVM model.

3.1. Fuzzy Membership Function

It is important to choose a suitable fuzzy membership function, as different fuzzy membership functions may affect the classifier differently. The Euclidean distance between training points and their class centers is the most common membership function in FSVM models [11,19,20]. However, this method is not suitable for unsupervised classification.
In this paper, we propose a fuzzy membership function based on the distance between points, which is derived from the Tomek link method [21]. We define the function d ( x i , x j ) as the Euclidean distance between the points x i and x j . For any i n , we have the distance between x i and x j , where j = 1 , , n and j i . After this, the distances are sorted in ascending order d 1 ( x i ) d 2 ( x i ) d n 1 ( x i ) . The k-nearest neighbor of x i can be written as K n ( x i ) = { x j | d ( x i , x j ) d k ( x i ) , j = 1 , , n , & j i } . Therefore, we can define the k-nearest neighbor link as an indicator function, as follows:
I i j = 1 if x i K n ( x j ) & x j K n ( x i ) , 0 otherwise .
If the indicator function with x i and x j is equal to 1, then we call ( x i , x j ) a k-nearest neighbor link pair. In other words, point x i and point x j are k-nearest neighbors to each other. The point closer to the center of the class has a greater number of star link pairs k-nearest neighbor link pairs.
In this way, we can weaken points that are far from the center of the class by a new fuzzy membership function, as follows:
r i ^ = j = t k d ( x j , x i ) I i j j = t k d ( x j , x i )
where t is the lower limit. Given a lower limit t, the fuzzy membership r i ^ of the noise and outlier points is as close to 0 as possible, where 0 r i ^ 1 . Figure 1 shows that our fuzzy membership function can weaken the outlier and noise points, where k = n 2 and t = n 4 . In essence, fuzzy membership decreases in the direction of sample density reduction. It is an effective way to reduce the effect of outliers and noise points on the resulting analysis. In addition, this method is not dependent on the sample center.

3.2. Fuzzy Unsupervised Quadratic Surface Support Vector Machine

The fuzzy US-QSSVM model also uses the fuzzy membership r ^ i , i = 1 , , n , where 0 r i ^ 1 , to deal with datasets containing outliers and noise.
In addition, sample points should be distributed more evenly on both sides of the separation plane to determine a more suitable hyperplane g ( x ) = 0 . The fuzzy US-QSSVM model can then be used to create a more accurate prediction of the outcome. Therefore, the FUS-QSSVM is as follows:
m i n 1 n i = 1 n h Q x i + f 2 2 + η 3 | i = 1 n ( 1 2 ( x ) T Q x i + f T x i + c ) r i ^ | + η 1 i = 1 n r i ^ ξ i s . t . 1 2 ( x ) T Q x i + f T x i + c h + ξ i , i = 1 , , n , 1 2 ( x ) T Q x i + f T x i + c h ξ i , i = 1 , , n , Q S m , ( f , c ) R m + 1 , h 0 , ξ i 0 , i = 1 , , n .
where ξ i is the slack variable, and the penalty parameters η 1 0 and η 3 ^ 0 need to be chosen beforehand. The term | i = 1 n ( 1 2 ( x ) T Q x i + f T x i + c ) r i ^ | is a penalty function for balancing points on both sides of the separation plane. However, the objective function is one term of a nonlinear fraction that is difficult to solve. In this paper, we follow the literature to solve this issue [8,22]. The term 1 n i = 1 n h Q x i + f 2 2 can be Taylor expanded as h 0 u 0 + 1 u o ( h h 0 ) h 0 u 0 2 ( Q x i + f 2 2 u 0 ) + R 1 , where R 1 = o ( h h 0 ) 2 + ( Q x i + f 2 2 u 0 ) 2 + ( h h 0 ) ( Q x i + f 2 2 u 0 ) is a first-order Taylor remainder. The Taylor remainder R 1 can be omitted since R 0 0 with h h 0 and Q x i + f 2 2 u 0 . Therefore, the term 1 n i = 1 n h Q x i + f 2 2 can be approximated to h 0 u 0 + 1 u o ( h h 0 ) h 0 u 0 2 ( Q x i + f 2 2 u 0 ) . Overall, the objective function can be rewritten as h 0 u 0 + 1 u 0 h h 0 u 0 2 Q x i + f 2 2 + η 3 | i = 1 n ( 1 2 ( x ) T Q x i + f T x i + c ) r i ^ | + η 1 i = 1 n r i ^ ξ i , which can be simplified as h 0 u 0 + 1 u 0 ( h η 2 ^ Q x i + f 2 2 + η 3 ^ | i = 1 n ( 1 2 ( x ) T Q x i + f T x i + c ) r i ^ | + η 1 ^ i = 1 n r i ^ ξ i ) , where η 1 ^ η 1 u 0 , η 2 ^ h 0 n u 0 and η 3 ^ η 3 u 0 . Therefore, the FUS-QSSVM model can be approximated as follows:
m i n h η 2 ^ Q x i + f 2 2 + η 3 ^ | i = 1 n ( 1 2 ( x ) T Q x i + f T x i + c ) r i ^ | + η 1 ^ i = 1 n r i ^ ξ i s . t . 1 2 ( x ) T Q x i + f T x i + c h + ξ i , i = 1 , , n . 1 2 ( x ) T Q x i + f T x i + c h ξ i , i = 1 , , n . Q S m , ( f , c ) R m + 1 , h 0 , ξ i 0 , i = 1 , , n .
The optimal solution ( Q * , f * , h * , c * , ξ 1 * , , ξ n * ) determines the separation plane g ( x ) 1 2 x T Q * x + f * T x + c * = 0 . However, the problem in (6) is still difficult to calculate. Therefore, we can further simplify the problem in (6) by following the literature [8,11]. We create a vector formulation Θ based on the m 2 + m 2 elements of the upper triangle of the matrix Q as follows:
Θ ( q 11 , q 12 , , q 1 m , q 22 , q 23 , , q 2 m , , q m m R m 2 + m 2 )
Furthermore, we can construct an m × m 2 + m 2 matrix M i for the point x i R m for i = 1 , 2 , , n as follows. For all j = 1 , 2 , , n , the pth element in the jth row of M i is assigned equal to x k i if the pth element of Θ is q j k or q k j for some k = 1 , 2 , , m . Otherwise, the element is equal to 0. After this, we let H i ( M i , I m × m ) R m × ( m 2 + m 2 + m ) , where i = 1 , 2 , , n . Then we have
G i = 1 n H i T H i S m 2 + 3 m 2 ,
v ( Θ T , f T ) T R m 2 + 3 m 2 ,
s i ( 1 2 x 1 i x 1 i , , x 1 i x m i , 1 2 x 2 i x 2 i , , x 2 i x m i , , 1 2 x m i x m i , x 1 i , x 2 i , , x m i ) R m 2 + 3 m 2 .
Summarizing this, the FUS-QSSVM model in (6) can be reformulated as
m i n h η 2 ^ v T G v + η 3 ^ | i = 1 n ( s i T v + c ) r i ^ | + η 1 ^ i = 1 n r i ^ ξ i s . t . s i T v + c h + ξ i , i = 1 , , n , s i T v + c h ξ i , i = 1 , , n , G S m 2 + 3 m 2 , v R m 2 + 3 m 2 , c R , | | v | | δ ^ , h 0 , ξ i 0 , i = 1 , , n .
The matrix G is symmetric and positive semi-definite, which is easy to verify. It is worth noting that the constraint | | v | | δ ^ ( δ ^ 0 is a large enough constant) avoids the problem in (11) by becoming unbounded when the term v T G v with | | v | | . However, the FUS-QSSVM model in (11) is not a convex QP problem, making it difficult to solve.

3.3. Decomposition Algorithm

As mentioned earlier, the problem in (11) is not a convex QP problem, but the difference between two convex functions. The DCA algorithm was developed to solve such problems [18,23]. In order to solve the proposed model, a DCA must be designed. At first, we turned the problem into (11) from a constrained problem to an unconstrained problem. We define the function as follows:
S ( v , h , c ) = | s i T v + c | h if | s i T v + c | > h , 0 o t h e r w i s e ,
X { h 0 & c R & | | v | | δ ^ } = 0 if h 0 & c R & | | v | | δ ^ , + o t h e r w i s e ,
g ( v , h , c ) = η 1 ^ i = 1 n r i ^ S i ( v , h , c ) + h + X { h 0 & c R & | | v | | δ ^ } + η 3 ^ | i = 1 n ( s i T v + c ) r i ^ | ,
h ( v , h , c ) = η 2 ^ v T G v .
Hence, the FUS-QSSVM model in (11) can be reformulated as an unconstrained difference convex (DC) program, as follows:
min ( v , h , c ) R m 2 + 3 m 2 + 2 { g ( v , h , c ) h ( v , h , c ) }
We define the conjugate function of g ( v , h , c ) as g * ( v , h , c ) sup ( v , h , c ) { ( v , h , c ) T y g ( x ) } for y R m 2 + 3 m 2 + 2 . Then, we have two constructed sequences, { x k } = { ( v k , h k , c k ) } and { y k } , for the DC algorithm (DCA) as follows:
  • Step 1: Set an initial estimation x 0 = ( v 0 , h 0 , c 0 ) d o m ( g ( x ) h ( x ) ) and k = 0 .
  • Step 2: Calculate y k h ( x k ) , ( i . e . , y k = ( 2 η 2 ^ ( v k ) T G , 0 , 0 ) T ) .
  • Step 3: Calculate x k + 1 = arg min { g ( x ) < x , y k > } .
  • Step 4: If | | x k + 1 x k > ϵ | | , then set k = k + 1 and go to Step 2; otherwise stop and output x k + 1 = ( v k + 1 , h k + 1 , c k + 1 ) as an optimal solution.
DCA can achieve better accuracy while reducing the complexity of calculations needed to solve the model. This makes it an ideal optimization technique for calculating FUS-QSSVM models. The proposed algorithm is shown to converge in the following part.
Theorem 1.
For an optimal problem with the objective min { g ( x ) h ( x ) } , it holds that
1. 
The optimal value of the problem is finite;
2. 
The sequences x k and y k in the algorithm are bounded;
3. 
Each limit optimal point x * of sequence x k is a local optimal solution of the problem in (11).
The Appendix A contains details of the proof.

4. Results

4.1. Experimental Setup

In order to evaluate the performance of the proposed fuzzy unsupervised QSSVM (FUS-QSSVM) method, a number of public benchmark datasets were used. Several unsupervised SVM-based methods, such as Unsupervised Absolute Value Inequality Classifier (UAVIC), Unsupervised Quadratic Surface Support Vector Machine (US-QSSVM), and Unsupervised Quadratic Surface Support Vector Machine with Gold Rule (US-QSSVM-GOLD), were also tested on the same benchmark datasets for fair comparison. To improve the comparability of the results, we also used the well-known unsupervised K-means algorithm. Note that US-QSSVM-GOLD is a technique to optimize plane separation g ( x ) = h p * for the US-QSSVM model.
In order to evaluate the performance of the proposed fuzzy unsupervised QSSVM (FUS-QSSVM) method, a number of public benchmark datasets were used. Several unsupervised SVM-based methods, such as Unsupervised Absolute Value Inequality Classifier (UAVIC), Unsupervised Quadratic Surface Support Vector Machine (US-QSSVM), and Unsupervised Quadratic Surface Support Vector Machine with Gold Rule (US-QSSVM-GOLD), were also tested on the same benchmark datasets for fair comparison. In order to improve the comparability of the results, we also used the well-known unsupervised K-means algorithm. Note that US-QSSVM-GOLD is a technique to optimize plane separation g ( x ) = h p * for the US-QSSVM model. The literature provides details for simplicity of description [8].
To select the best penalty parameters for all the tested methods, the same grid method was used as follows: First, we selected half of the initial dataset for parameter tuning. Then, we evaluated the accuracy of all methods based on the actual labels of the points. To ensure statistical significance, we repeated this process ten times. Ultimately, we choose the most appropriate parameters based on the average of the 10 predicted results. Considering that the research in this paper concerns an unsupervised binary classification problem, the fuzzy membership of noise points and outliers should approach 0. Hence, we used the parameters k = n 2 and t = n 4 for the fuzzy function (4) in all experiments. According to our experience, the ratio of the two hyper-parameters η 1 ^ and η 3 ^ affects the experimental results; therefore, we provide a hyper-parameter in (11) as l o g 2 η 3 ^ = 2 6 . Following the literature, the suitable hyper-parameter η 1 ^ for the US-QSSVM and US-QSSVM-GOLD is l o g 2 η 1 ^ { 16 , 17 , , 30 } [8]. However, the appropriate hyperparameter for the proposed method is l o g 2 η 1 ^ { 1 , 2 , , 10 } . FUS-QSSVM, US-QSSVM, and US-QSSVM-GOLD models were solved by DC algorithm. The UAVIC model was solved by linear programming. In addition, to avoid different initial values, all variables had unit vectors as their initial values. We computed all datasets without labels as training sets and tested them with actual labels as results. All reported results are the average of 20 experiments.
In this paper, five widely used public credit benchmark datasets from the UCI public database, StatLib and Kaggle, were selected for method validation. As far as possible, the datasets selected for this paper were diverse and representative of the algorithms being compared. These five datasets are widely used in many studies [24,25]. The Japanese (which removes missing data), Australian, and Credit approval datasets come from the UCI database. The Bankruptcy dataset comes from StatLib. The Prosper lending platform was founded in 2005 and is the second largest online lending platform in the United States. Kaggle provides the Prosper dataset, and all low-quality samples are removed. Table 1 shows the information for all tested datasets.
Due to the FUS-QSSVM, the US-QSSVM and UAVIC assume that the separation plane must be in the middle of the two separation planes, potentially affecting the accuracy between the two different classes. However, positive and negative samples are not distinguished by accuracy. The losses associated with defaulters’ forecasted errors are far greater than those associated with other types of forecast errors, particularly in credit classification. To assess the classifier’s classification ability for both positive and negative classes, we used four more comprehensive metrics—Accuracy, Recall, Precision, and F1-measure. To explain their definitions, let us first introduce a confusion matrix, as shown in Table 2, which is the accuracy evaluation matrix associated with them.
From Table 2, the following can be observed:
  • TP (True Positive) represents the number of positive class samples that were accurately predicted by the classifier;
  • FN (False Negative) means the number of positive class samples that the classifier mistakenly predicted to belong to the negative class;
  • FP (False Positive) represents instances of the negative class that were incorrectly identified as members of the positive class by the classifier;
  • TN (True Negative) corresponds to the number of negative class samples that were correctly identified by the classifier.
The definitions provided above clarify the interpretation of these three evaluation metrics.
R e c a l l = T P T P + F N
P r e c i s i o n = T P T P + F P
F 1 m e a s u r e = 2 × R e c a l l × P r e c i s i o n R e c a l l + P r e c i s i o n

4.2. Experiment Results

Details of the experimental results are presented in Table 3. We compared our proposed method with several unsupervised algorithms and K-means based on SVM. As shown in Table 3, FUS-QSSVM performs better than other algorithms in accuracy and F1-measure except on the Credit approval dataset. First, the fuzzy membership function weakens the influence of outliers and noise points on the decision plane. Secondly, our objective function (5) is designed to balance the distance between the two types of samples to stabilize the separation plane. In addition, linear classifiers (UAVIC) are less efficient when applied to real-world credit datasets. Due to the linear indivisibility of most real-world credit datasets, it is worth noting that our method still achieves reasonable performance on large credit datasets, namely Prosper. The application of our method to credit risk management demonstrates its practical value.
In all datasets, the recall and accuracy of US-QSSVM, US-QSSVM-GOLD, and UAVIC are significantly smaller than accuracy. In other words, these algorithms are inefficient at classifying minority classes. The reason for this is that the techniques used to construct the nearest hyperplanes to contain data points achieved more flexible and accurate data descriptions in some datasets.
However, there is a significant problem with noisy points and outliers in these techniques. Because even a small number of points can lead the separation plane to a certain class, as shown in Table 3. Moreover, the objective function (5) of our algorithm helps balance the two classes of sample points, which is one reason why our algorithm is efficient when judging minorities.
To demonstrate the robustness of our algorithm, we present the results obtained using the Bankruptcy dataset under different hyperparameters η 1 ^ . The experimental hyperparameters were selected by calculating the experimental results on half of the sample points, following the literature [8]. For all the methods tested in this paper, the same grid method was used to select the best penalty parameters. However, the reported results in Figure 2 are tested in all samples. As a result, we demonstrated that the hyperparameters of FUS-QSSVM, US-QSSVM, and US-QSSVM-GOLD are robust within a suitable range. However, our algorithm is more effective in all hyperparameters than the others.

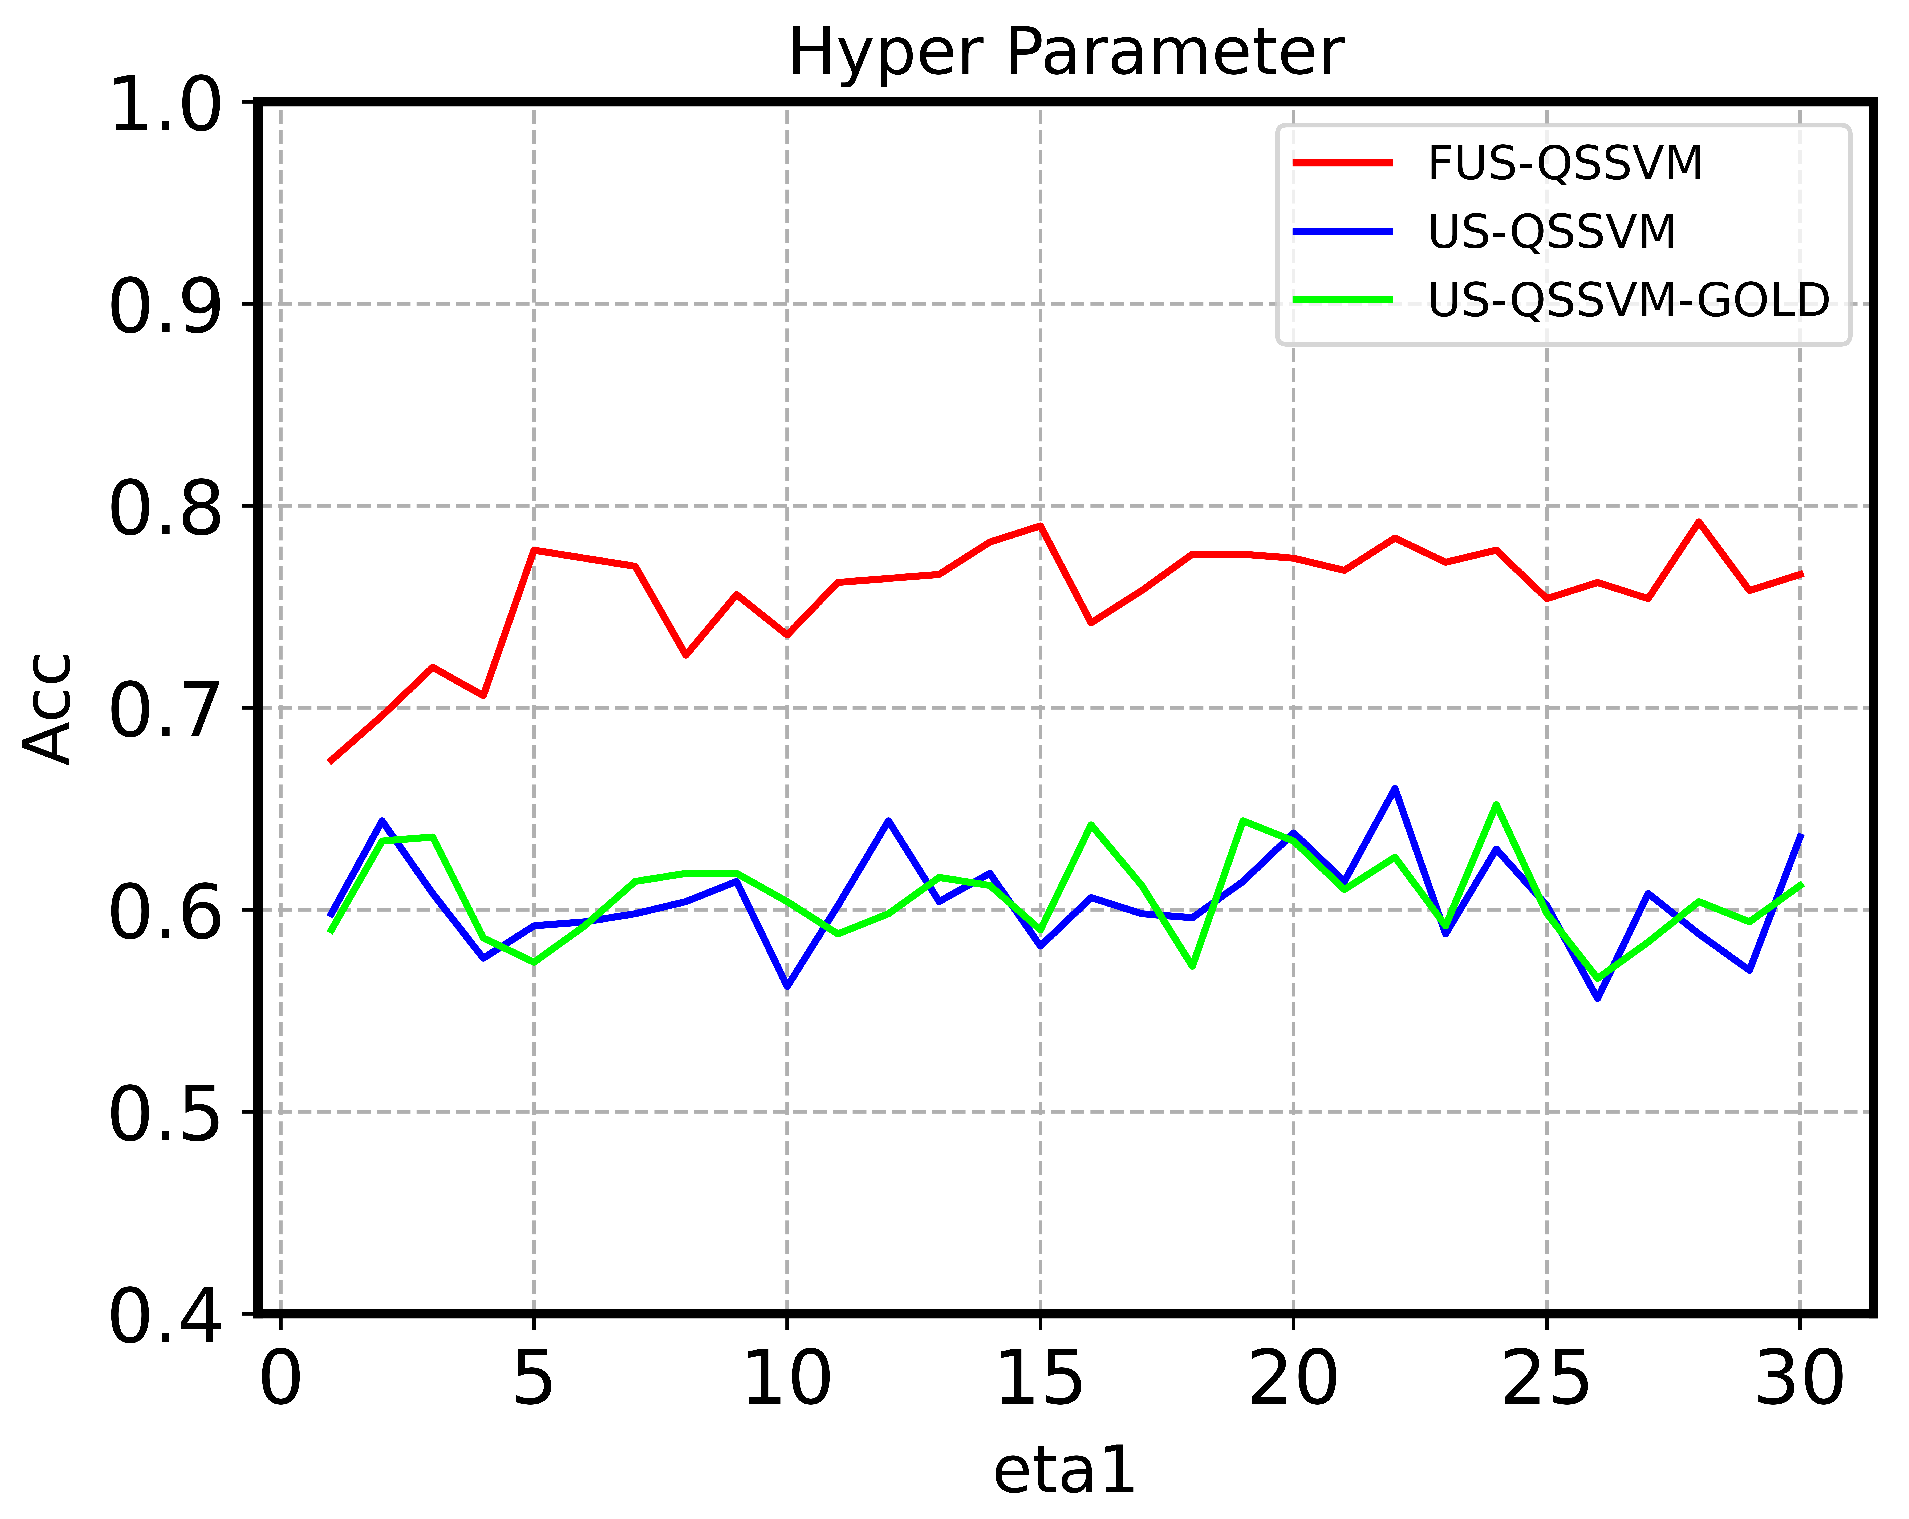
4.3. Fuzzy Membership

To further prove that our fuzzy membership algorithm has favorable results when dealing with outliers and noise points, this paper uses a similar technique to add p % sample points to the Japanese dataset [7]. We assume that the mean and variance of the Japanese dataset are ( μ , σ ) . The new samples generated from a Gaussian distribution are defined by ( 3 μ , σ ) , and the proportion of outliers p is equal to 5 or 10.
As before, the other experimental details remain the same. The results of the experiments are shown in Table 4.
In Table 4, FUS-QSSVM produces good results when applied to artificial noise datasets. However, there is a significant decrease in the performance of other algorithms. Because fuzzy membership functions (4) weaken the noise points and outliers, our proposed method shows a balance between the two classes. This makes the classification more reliable and accurate. In addition, it reduces the risk of misclassification and improves model performance. On the other hand, noisy points and outliers negatively affect the F1-measurement of other algorithms, as shown in Table 4. In this case, our algorithm shows better application prospects in the field of credit risk assessment, especially where classification will result in inconsistent losses.
In addition, the results can be improved by simply adjusting the position of the separation plane, such as in US-QSSVM-GOLD. However, the impact of noise points on US-QSSVM-GOLD is greater than that on US-QSSVM. Moreover, UAVIC is not suitable for datasets with too many noisy samples.

5. Conclusions

In this study, we introduced a novel kernel-free fuzzy unsupervised QSSVM technique designed specifically for the direct classification of unlabeled data that is nonlinearly separable for credit risk assessment. In addition, the novel fuzzy membership function reduces noise points and outliers in line with the direction of variation in sample density. To perform the proposed model efficiently and effectively, we designed a convergent DCA for the FUS-QSSVM model. A number of numerical experiments were carried out to study the performance of the proposed method. Our main findings are summarized below.
  • Drawing on comprehensive numerical findings, the proposed FUS-QSSVM approach is in strong competition with other well-known classification techniques in credit datasets, including three SVM-based methods and K-means. A key advantage of the proposed method is its ability to benefit from the high classification accuracy of SVM models. In addition, it minimizes the shortcomings associated with classification algorithms based on SVMs. These include factors such as unstable results due to random initialization, reduced effectiveness due to kernel dependencies, and noise points and outliers;
  • The fuzzy join function optimizes the hyperplane position and shape by reducing noise points and outliers. Therefore, this enhancement bolsters both the accuracy and robustness of the model. Application of this technique is particularly useful when the dataset contains outliers or uneven distributions between two classes. By minimizing the impact of such data points, the model captures the underlying structure of the data. As a result, more robust predictions of the proposed model can be made about default applicants;
  • As a result of the DCA design, the nonconvex FUS-QSSVM model was significantly more efficient in solving. In addition, this reduces reliance on initial values and tuning parameters, thus improving calculation efficiency.
Despite the fact that our algorithm performs well under fixed initial values, it suffers from the local optimal, which is determined by the initial values. In addition, parameter tuning requires domain-specific knowledge. For future research, we are interested in designing a global convergence of such a classification algorithm. Another area of research is the development of multi-classification models or the extension of this method to feature selection or semi-supervised learning.

Author Contributions

Methodology, T.Y.; Software, X.T.; Data curation, T.Y. and X.T.; Writing—original draft, T.Y.; Writing—review & editing, X.T.; Supervision, W.H.; Funding acquisition, W.H. All authors have read and agreed to the published version of the manuscript.

Funding

The authors would like to acknowledge the partial grant support to the research (Grant ID: 72061127002). This research is also supported by DeFin research center of National Center for Applied Mathematics Shenzhen, Shenzhen Key Research Base in Arts & Social Sciences (Intelligent Management & Innovation Research Center, SUSTech, Shenzhen), and the National Laboratory of Mechanical Manufacture System, XJTU.

Data Availability Statement

Publicly available datasets were analyzed in this study. These data can be found here: UCI, https://archive.ics.uci.edu/, Kaggle, https://www.kaggle.com/ and StatLib, https://lib.stat.cmu.edu/datasets/.

Acknowledgments

The authors would like to thank the editors and anonymous reviewers for their helpful comments and suggestions.

Conflicts of Interest

The authors declare no conflict of interest.

Appendix A

Proof. 
  • By the definition, g ( x ) is non-negative and | | v | | δ ^ . Moreover, there exist a constant κ 1 such that i = 1 n | | H i v | | 2 2 κ 1 | | H i v | | 2 . Therefore, g ( x ) = 1 n v T G v = 1 n i = 1 n | | H i v | | 2 2 κ 1 n i = 1 n | | H i v | | 2 κ 1 n i = 1 n | | H i | | 2 | | v | | 2 κ 1 δ ^ n i = 1 n | | H i | | 2 . Hence, the minimum of g ( x ) h ( x ) is finite.
  • The sequence { x k } = ( v k , h k , c k ) is a solution with arg min { g ( x ) < x , y k 1 > } ; hence, the sequence { v k } is bounded by the constraint | | v | | δ ^ . Furthermore, the sequence { y k } = ( 2 η 2 ^ ( v k ) T G , 0 , 0 ) T is bounded. Then, we can prove that the sequences { h k } and { c k } are bounded. It is simple to verify that the objective value of the problem min { g ( x ) < x , y k 1 > } is finite. There exists a constant κ 2 for all k such that min { g ( x ) < x , y k 1 > } κ 2 . Since | | v | | δ ^ , i = 1 n | | H i v k | | 2 2 κ 1 k | | H i v k | | 2 , ξ i k 0 and 0 r i ^ 1 for all k N , then
    h k η 2 ^ v k T G v k 1 η 3 ^ | i = 1 n ( s i T v k + c k ) r i ^ | η 1 ^ i = 1 n r i ^ ξ i k + κ 2 η 2 ^ v k T G v k 1 + κ 2 η 2 ^ i = 1 n ( H i v k ) T H i v k 1 + κ 2
    η 2 ^ i = 1 n | | ( H i v k ) T | | 2 | | H i v k 1 | | 2 + κ 2 η 2 ^ κ 1 k κ 1 k 1 i = 1 n | | ( H i v k ) T | | | | H i v k 1 | | + κ 2 η 2 ^ κ 1 k κ 1 k 1 i = 1 n | | H i | | | | v k | | | | H i | | | | v k 1 | | + κ 2 η 2 ^ κ 1 k κ 1 k 1 δ ^ 2 i = 1 n | | H i | | 2 + κ 2 .
    Moreover, since s i T v + c h + ξ i and s i T v + c h ξ i for all k N , it is obvious that the sequence c k is bounded. Overall, the sequences x k and y k in the algorithm are bounded.
  • From a result of 1 or 2, the x * = ( v * , h * , c * ) is a local optimal solution in the problem in (11) according the DCA’s convergence properties [18,23].

References

  1. Cortes, C.; Vapnik, V. Support-Vector Networks. Mach. Learn. 1995, 20, 273–297. [Google Scholar] [CrossRef]
  2. Almotairi, S.; Badr, E.; Abdul, S.M.; Ahmed, H. Breast Cancer Diagnosis Using a Novel Parallel Support Vector Machine with Harris Hawks Optimization. Mathematics 2023, 11, 3251. [Google Scholar] [CrossRef]
  3. Jovanovic, D.; Antonijevic, M.; Stankovic, M.; Zivkovic, M.; Tanaskovic, M.; Bacanin, N. Tuning Machine Learning Models Using a Group Search Firefly Algorithm for Credit Card Fraud Detection. Mathematics 2022, 10, 2272. [Google Scholar] [CrossRef]
  4. Shen, F.; Yang, Z.Y.; Zhao, X.Z.; Lan, D. Reject inference in credit scoring using a three-way decision and safe semi-supervised support vector machine. Inf. Sci. 2022, 606, 614–627. [Google Scholar] [CrossRef]
  5. Endri, E.; Kasmir, K.; Syarif, A. Delisting sharia stock prediction model based on financial information: Support Vector Machine. Decis. Sci. Lett. 2020, 9, 207–214. [Google Scholar] [CrossRef]
  6. Harris, T. Quantitative credit risk assessment using support vector machines: Broad versus Narrow default definitions. Expert Syst. Appl. 2013, 40, 4404–4413. [Google Scholar] [CrossRef]
  7. Twala, B. Multiple classifier application to credit risk assessment. Expert Syst. Appl. 2010, 37, 3326–3336. [Google Scholar] [CrossRef]
  8. Luo, J.; Yan, X.; Tian, Y. Unsupervised quadratic surface support vector machine with application to credit risk assessment. Eur. J. Oper. Res. 2020, 280, 1008–1017. [Google Scholar] [CrossRef]
  9. Camastra, F.; Verri, A. A novel kernel method for clustering. IEEE Trans. Pattern Anal. Mach. Intell. 2005, 27, 801–805. [Google Scholar] [CrossRef]
  10. Bicego, M.; Figueiredo, M.A. Soft clustering using weighted one-class support vector machines. Pattern Recognit. 2009, 42, 27–32. [Google Scholar] [CrossRef]
  11. Luo, J.; Tian, Y.; Yan, X. Clustering via fuzzy one-class quadratic surface support vector machine. Soft Comput. 2017, 21, 5859–5865. [Google Scholar] [CrossRef]
  12. Fung, G.M.; Mangasarian, O.L. Unsupervised and semisupervised classification via absolute value inequalities. J. Optim. Theory Appl. 2016, 168, 551–558. [Google Scholar] [CrossRef]
  13. Lin, C.F.; Wang, S.D. Fuzzy support vector machines. IEEE Trans. Neural Netw. 2002, 13, 464–471. [Google Scholar]
  14. Manh, C.N.; Van, T.N. A method for reducing the number of support vectors in fuzzy support vector machine. In Advanced Computational Methods for Knowledge Engineering: Proceedings of the 4th International Conference on Computer Science, Applied Mathematics and Applications, ICCSAMA 2016, Vienna, Austria, 2–3 May 2016; Springer: Berlin/Heidelberg, Germany, 2016; p. 17. [Google Scholar]
  15. Lessmann, S.; Baesens, B.; Seow, H.V.; Thomas, L.C. Benchmarking state-of-the-art classification algorithms for credit scoring: An update of research. Eur. J. Oper. Res. 2015, 247, 124–136. [Google Scholar] [CrossRef]
  16. Hartman, P. On functions representable as a difference of convex functions. Pac. J. Math. 1959, 9, 707–713. [Google Scholar] [CrossRef]
  17. Tao, P.D. Algorithms for solving a class of nonconvex optimization problems. Methods of subgradients. North-Holl. Math. Stud. 1986, 129, 249–271. [Google Scholar]
  18. Le Thi, H.A.; Pham Dinh, T. DC programming and DCA: Thirty years of developments. Math. Program. 2018, 169, 5–68. [Google Scholar] [CrossRef]
  19. Yogendran, D.; Punniyamoorthy, M. Improved bias value and new membership function to enhance the performance of fuzzy support vector Machine. Expert Syst. Appl. 2022, 208, 118003. [Google Scholar]
  20. Luo, J.; Fang, S.C.; Bai, Y.Q.; Deng, Z.B. Fuzzy quadratic surface support vector machine based on fisher discriminant analysis. J. Ind. Manag. Optim. 2017, 12, 357–373. [Google Scholar] [CrossRef]
  21. Tomek, I. Two Modifications of CNN. IEEE Trans. Syst. Man Cybern. 1976, 6, 769–772. [Google Scholar]
  22. Schaible, S.; Shi, J.M. Fractional programming: The sum-of-ratios case. Optim. Methods Softw. 2003, 18, 219–229. [Google Scholar] [CrossRef]
  23. Pham Dinh, T.; Le Thi, H.A. A DC optimization algorithm for solving the trust-region subproblem. SIAM J. Optim. 1998, 8, 476–505. [Google Scholar]
  24. Liu, C.; Xie, J.; Zhao, Q.; Xie, Q.W.; Liu, C.Q. Novel evolutionary multi-objective soft subspace clustering algorithm for credit risk assessment. Expert Syst. Appl. 2019, 138, 112827. [Google Scholar] [CrossRef]
  25. Obermann, L.; Waack, S. Demonstrating non-inferiority of easy interpretable methods for insolvency prediction. Expert Syst. Appl. 2015, 42, 9117–9128. [Google Scholar] [CrossRef]
Figure 1. (a) The results of the fuzzy membership function in a Gaussian simulation dataset. (b) The results of the fuzzy membership function in a real-world dataset, Bankruptcy.
Mathematics 11 04661 g001
Figure 2. The results in different hyper-parameters η 1 ^ .
Mathematics 11 04661 g002
Table 1. Descriptions of the tested datasets.
Dataset#Instances#Negative#Positive#Attributes
Credit approval69038330715
Bankruptcy10050505
Japanese 165135729415
Australian69038330714
Prosper 120,22213,062716049
1 Japanese and Prosper datasets delete missing data.
Table 2. Confusion matrix.
Predicted Label
PositiveNegative
Actual labelPositiveTPFN
NegativeFPTN
Table 3. The results of all the tested datasets.
AccuracyRecallPrecisionF1-Measure
BankruptcyFUS-QSSVM0.77600.75600.78760.7715
US-QSSVM0.58600.52400.63660.5748
US-QSSVM-GOLD0.64800.46000.78010.5787
UAVIC0.60000.56000.60870.5833
K-means0.62700.25401.0000.4051
JapaneseFUS-QSSVM0.67490.64180.64000.6409
US-QSSVM0.57770.53480.53080.5328
US-QSSVM-GOLD0.58410.59450.53620.5638
UAVIC0.61900.82990.55200.6630
K-means0.64100.73770.58090.6500
AustralianFUS-QSSVM0.68910.83130.57540.6801
US-QSSVM0.56750.44420.46750.4556
US-QSSVM-GOLD0.56840.44710.44860.4478
UAVIC0.62550.06400.92860.1197
K-means0.67200.63180.58460.6073
Credit approvalFUS-QSSVM0.55310.53890.49870.5180
US-QSSVM0.54990.50090.49700.4990
US-QSSVM-GOLD0.54280.48600.48850.4860
UAVIC0.55800.005210.0103
K-means0.68140.69080.62750.6576
ProsperFUS-QSSVM0.64630.83220.50030.6250
US-QSSVM0.57160.41690.42820.4225
US-QSSVM-GOLD0.59750.33080.43580.3761
UAVIC0.56080.48240.43990.4602
K-means0.54060.35070.37810.3638
The bolds mean the most effective performance methods in this dataset.
Table 4. The results of the Japanese dataset, which includes outliers and noise points.
AccuracyRecallPrecisionF1-Measure
JapaneseFUS-QSSVM0.67490.64180.64000.6409
US-QSSVM0.57770.53480.53080.5328
US-QSSVM-GOLD0.58410.59450.53620.5638
UAVIC0.61900.82990.55200.6630
K-means0.64100.73770.58090.6500
Japanese-5 1FUS-QSSVM0.69620.68550.65780.6714
US-QSSVM0.55600.43430.51360.4706
US-QSSVM-GOLD0.56470.57270.52140.5458
UAVIC0.58370.39460.55500.4613
K-means0.54530.21120.25910.2327
Japanese-10 2FUS-QSSVM0.68460.70340.63680.6684
US-QSSVM0.57590.53290.45830.4928
US-QSSVM-GOLD0.55360.47190.47880.4753
UAVIC0.61750.35370.63800.4551
K-means0.57160.16680.20530.1840
1 Japanese-5 includes 5 % artificial noise samples; 2 Japanese-10 includes 10 % artificial noise samples. The bolds mean the most effective performance methods in this dataset.
Disclaimer/Publisher’s Note: The statements, opinions and data contained in all publications are solely those of the individual author(s) and contributor(s) and not of MDPI and/or the editor(s). MDPI and/or the editor(s) disclaim responsibility for any injury to people or property resulting from any ideas, methods, instructions or products referred to in the content.

