Article

Optimal Power Dispatch of PV Generators in AC Distribution Networks by Considering Solar, Environmental, and Power Demand Conditions from Colombia

by
Luis Fernando Grisales-Noreña
1,
Oscar Danilo Montoya
2,3,*,
Brandon Cortés-Caicedo
4,
Farhad Zishan
5 and
Javier Rosero-García
6
1
Department of Electrical Engineering, Faculty of Engineering, Universidad de Talca, Curicó 3340000, Chile
2
Grupo de Compatibilidad e Interferencia Electromagnética (GCEM), Facultad de Ingeniería, Universidad Distrital Francisco José de Caldas, Bogotá 110231, Colombia
3
Laboratorio Inteligente de Energía, Universidad Tecnológica de Bolívar, Cartagena 131001, Colombia
4
Departamento de Mecatrónica y Electromecánica, Facultad de Ingeniería, Instituto Tecnológico Metropolitano, Medellín 050036, Colombia
5
Department of Electrical Engineering, Sahand University of Technology, Tabriz 5513351996, Iran
6
Grupo de Investigación Electrical Machines & Drives (EM&D), Departamento de Ingeniería Eléctrica y Electrónica, Facultad de Ingeniería, Universidad Nacional de Colombia, Bogotá 111321, Colombia
*
Author to whom correspondence should be addressed.
Mathematics 2023, 11(2), 484; https://doi.org/10.3390/math11020484
Submission received: 16 December 2022 / Revised: 4 January 2023 / Accepted: 9 January 2023 / Published: 16 January 2023
(This article belongs to the Special Issue Numerical Analysis and Optimization: Methods and Applications)

Abstract

:
This paper deals with the problem regarding the optimal operation of photovoltaic (PV) generation sources in AC distribution networks with a single-phase structure, taking into consideration different objective functions. The problem is formulated as a multi-period optimal power flow applied to AC distribution grids, which generates a nonlinear programming (NLP) model with a non-convex structure. Three different objective functions are considered in the optimization model, each optimized using a single-objective function approach. These objective functions are (i) an operating costs function composed of the energy purchasing costs at the substation bus, added with the PV maintenance costs; (ii) the costs of energy losses; and (iii) the total CO2 emissions at the substation bus. All these functions are minimized while considering a frame of operation of 24 h, i.e., in a day-ahead operation environment. To solve the NLP model representing the studied problem, the General Algebraic Modeling System (GAMS) and its SNOPT solver are used. Two different test feeders are used for all the numerical validations, one of them adapted to the urban operation characteristics in the Metropolitan Area of Medellín, which is composed of 33 nodes, and the other one adapted to isolated rural operating conditions, which has 27 nodes and is located in the department of Chocó, Colombia (municipality of Capurganá). Numerical comparisons with multiple combinatorial optimization methods (particle swarm optimization, the continuous genetic algorithm, the Vortex Search algorithm, and the Ant Lion Optimizer) demonstrate the effectiveness of the GAMS software to reach the optimal day-ahead dispatch of all the PV sources in both distribution grids.

1. Introduction

The massive integration of renewable energy in electrical networks is mandatory for all electricity industry participants nowadays since it is deemed imperative in reducing the harmful effects of global warming [1]. These renewable energy resources, which operate at all voltage levels, will reduce the energy purchasing costs and the multiple pollutants in the atmosphere, mainly produced by coal-, diesel-, or gas-based generation systems [2,3,4]. The most advanced, mature, and accepted technologies regarding renewable power sources are wind and solar generation, as many years of research have allowed for the development of robust generation systems that can be integrated into large-, medium-, and low-scale applications without affecting their efficiency [5,6,7], i.e., they can be connected at any voltage level (transmission, sub-transmission, and distribution levels) [8,9,10,11].
In the case of countries located between the tropics of Cancer and Capricorn, as is the case of Colombia, the most suitable generation technology based on renewables is photovoltaic (PV) generation [12]. This is due to the 11- to 13-h solar incidence in Colombia during the year, which is due to its proximity to the equatorial line [13]. This research focuses on a sub-problem related to PV generation sources in medium-voltage applications [14]. This problem corresponds to the day-ahead operation of these devices, taking into consideration aspects such as the geographical location of the PV sources (rural or urban distribution grids) and the different objective function indicators as a function of the grid operator requirements [15].
In the current literature, the problem regarding the optimal operation of renewable generation sources in distribution networks has been addressed by employing multiple approaches, some of which are discussed below. The authors of [16] presented an optimization model to locate and size PV generators and battery energy storage systems in medium-low voltage microgrids. The location of the PV sources and batteries was carried out using a simulated annealing algorithm. Once these devices are located, their daily operation was determined by using a conic formulation in order to minimize the energy purchasing and operating and maintenance costs of batteries. Numerical results demonstrated the efficiency of the proposed model in comparison to nonlinear programming (NLP) solvers in test feeders with 11, 135, and 230 nodes. In the work by [17], a mixed-integer conic model for locating and sizing PV sources in electrical AC distribution grids was presented while considering two main stages. The first stage defined the nodes where the PV sources were to be located and their expected sizes, considering the operation of the PV sources by tracking the maximum power point. In the second stage, the optimal sizes of the PV sources were refined, considering that the PV sources do not necessarily operate by tracking the maximum power point. The effectiveness of the proposed methodology was tested in the IEEE 33- and 69-bus grids and compared with multiple metaheuristics-based algorithms, which confirmed the effectiveness of the proposed conic formulation to locate and size PV sources in AC distribution grids. The authors of [18] presented a master-slave optimization methodology based on the vortex optimization algorithm and the successive approximations power flow method in order to locate and size PV generators in distribution networks with AC or DC configurations while employing maximum power point tracking. Numerical results in the IEEE 33- and IEEE 69-bus grids demonstrated the effectiveness of the proposed approach in comparison with the discrete-continuous version of the Chu & Beasley genetic algorithm (CBGA) proposed by [13]. The study by [19] proposed an efficient operation dispatch model for multiple distributed energy resources including PV solar panels, micro-turbines, wind turbines, fuel cells, battery energy storage systems, and controllable loads using a virtual power plant formulation. The main idea was to minimize the expected generation costs of the power system under analysis while considering uncertainties in the primary energy resources. The NLP model was solved with a new combinatorial optimizer named beetle antenna search, with better numerical performance when compared to particle swarm optimizers and genetic algorithms.
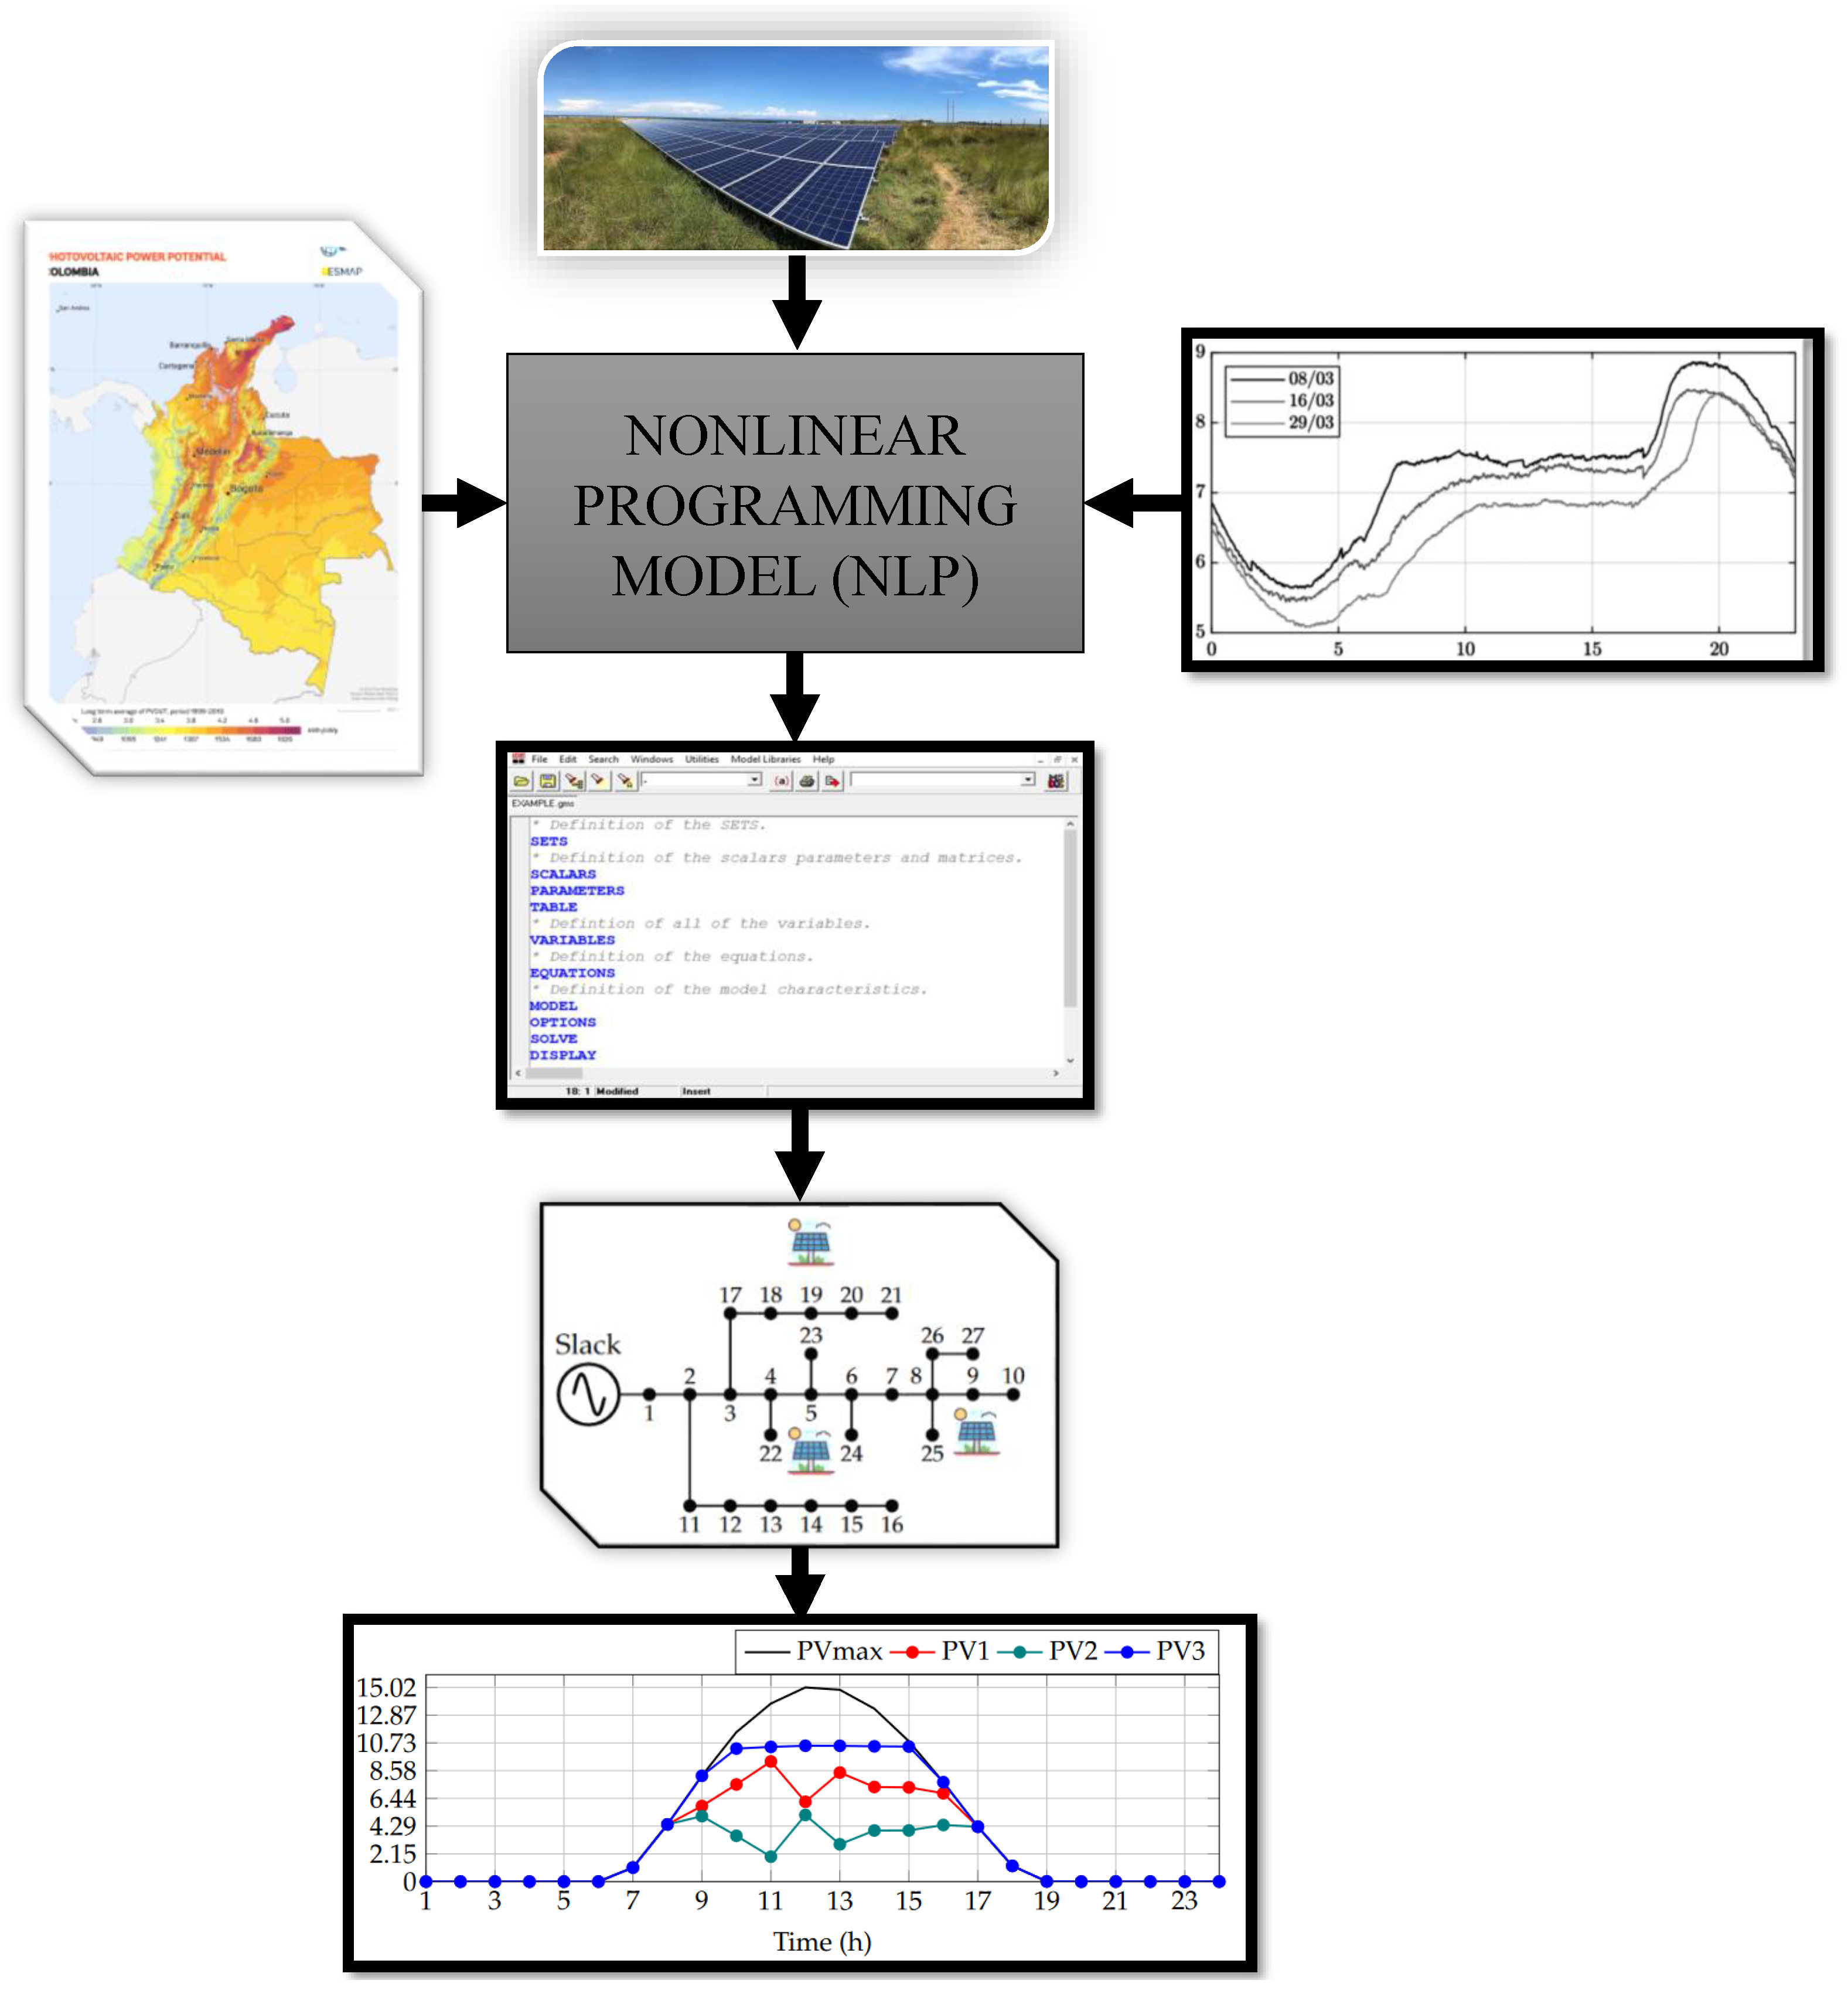
Considering the revision of the state of the art presented, this research article contributes with the following: (i) a general NLP formulation of the day-ahead operation problem for PV generation sources in AC single-phase distribution networks while considering different objective functions; (ii) a comparative analysis between different combinatorial optimization methods (i.e., as particle swarm optimization, the continuous genetic algorithm, the Vortex Search algorithm, and the Ant Lion Optimizer) and the exact solution of the NLP model using the GAMS software; and (iii) the best possible solution reported in the literature for the studied problem since the interior point with logarithmic barrier used in the NLP solution through GAMS ensures the optimum global finding.
It is worth mentioning that within the scope of this research,
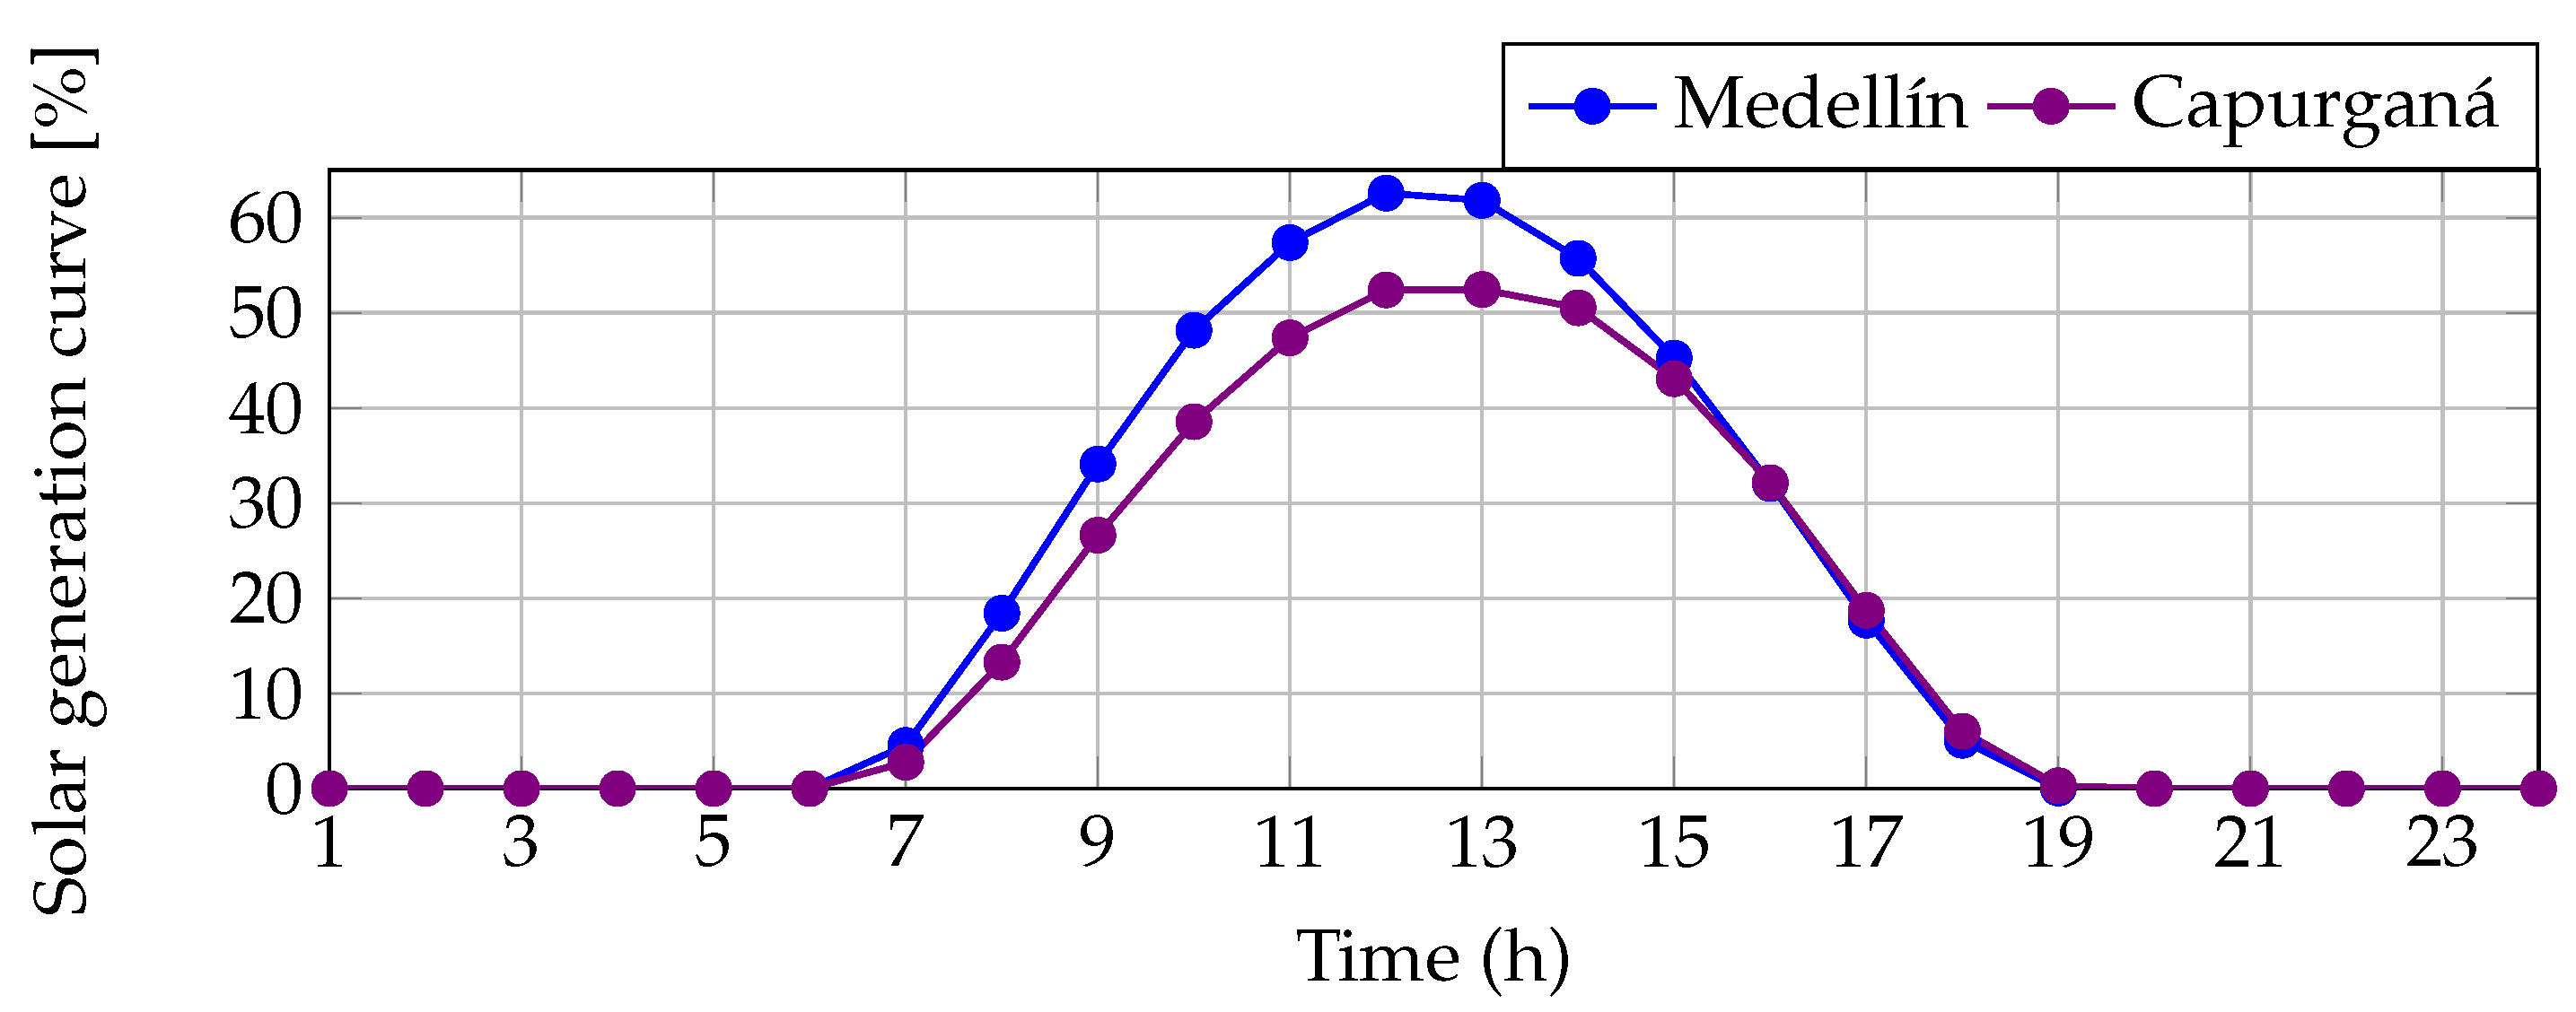
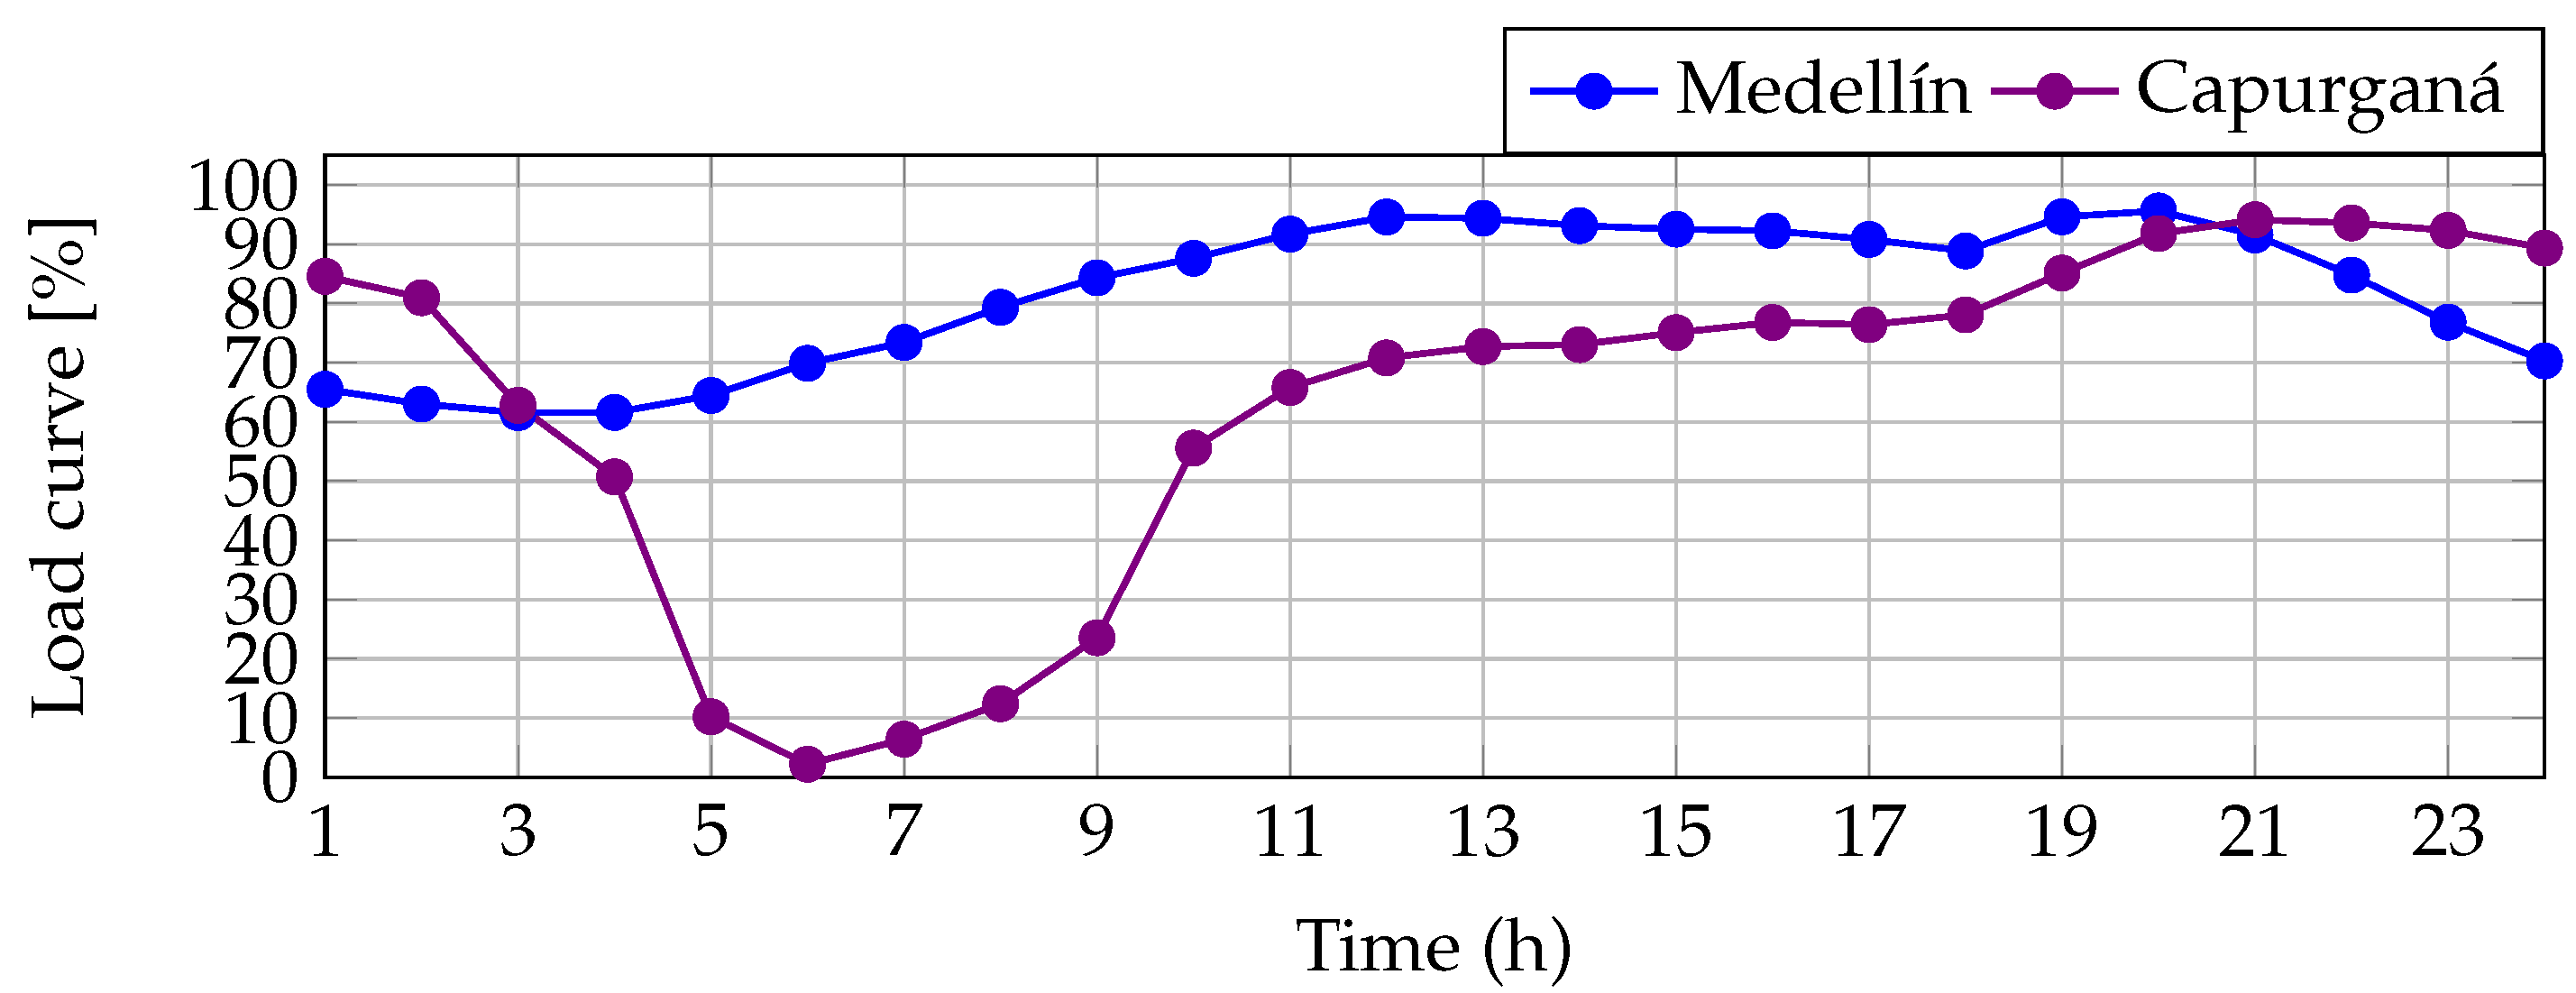
  • the demand and PV generation curves in the regions of interest (the city of Medellín and the municipality of Capurganá) are considered as inputs for the NLP model, i.e., these predictions are assumed as constant values for the optimization model, which implies that no uncertainties regarding generation and demand curves are considered in this research;
  • the internal optimization properties of the SNOPT solver in GAMS, which are based on interior-point methods, are not discussed in this research since the interior-point method is a well-known and strongly supported optimization method to deal with NLP problems; and
  • generation and demands curves for rural and urban areas were obtained from public data [20,21,22], but the information of the test feeders (the IEEE 33- and 27-node systems) was taken from literature reports due to the restrictions imposed by distribution companies in Colombia on the use of real distribution grids.
The remainder of this research article is structured as follows: Section 2 presents the general mathematical formulation of the studied problem, i.e., the three different objective functions considered, as well as the set of constraints that make up its NLP formulation; 
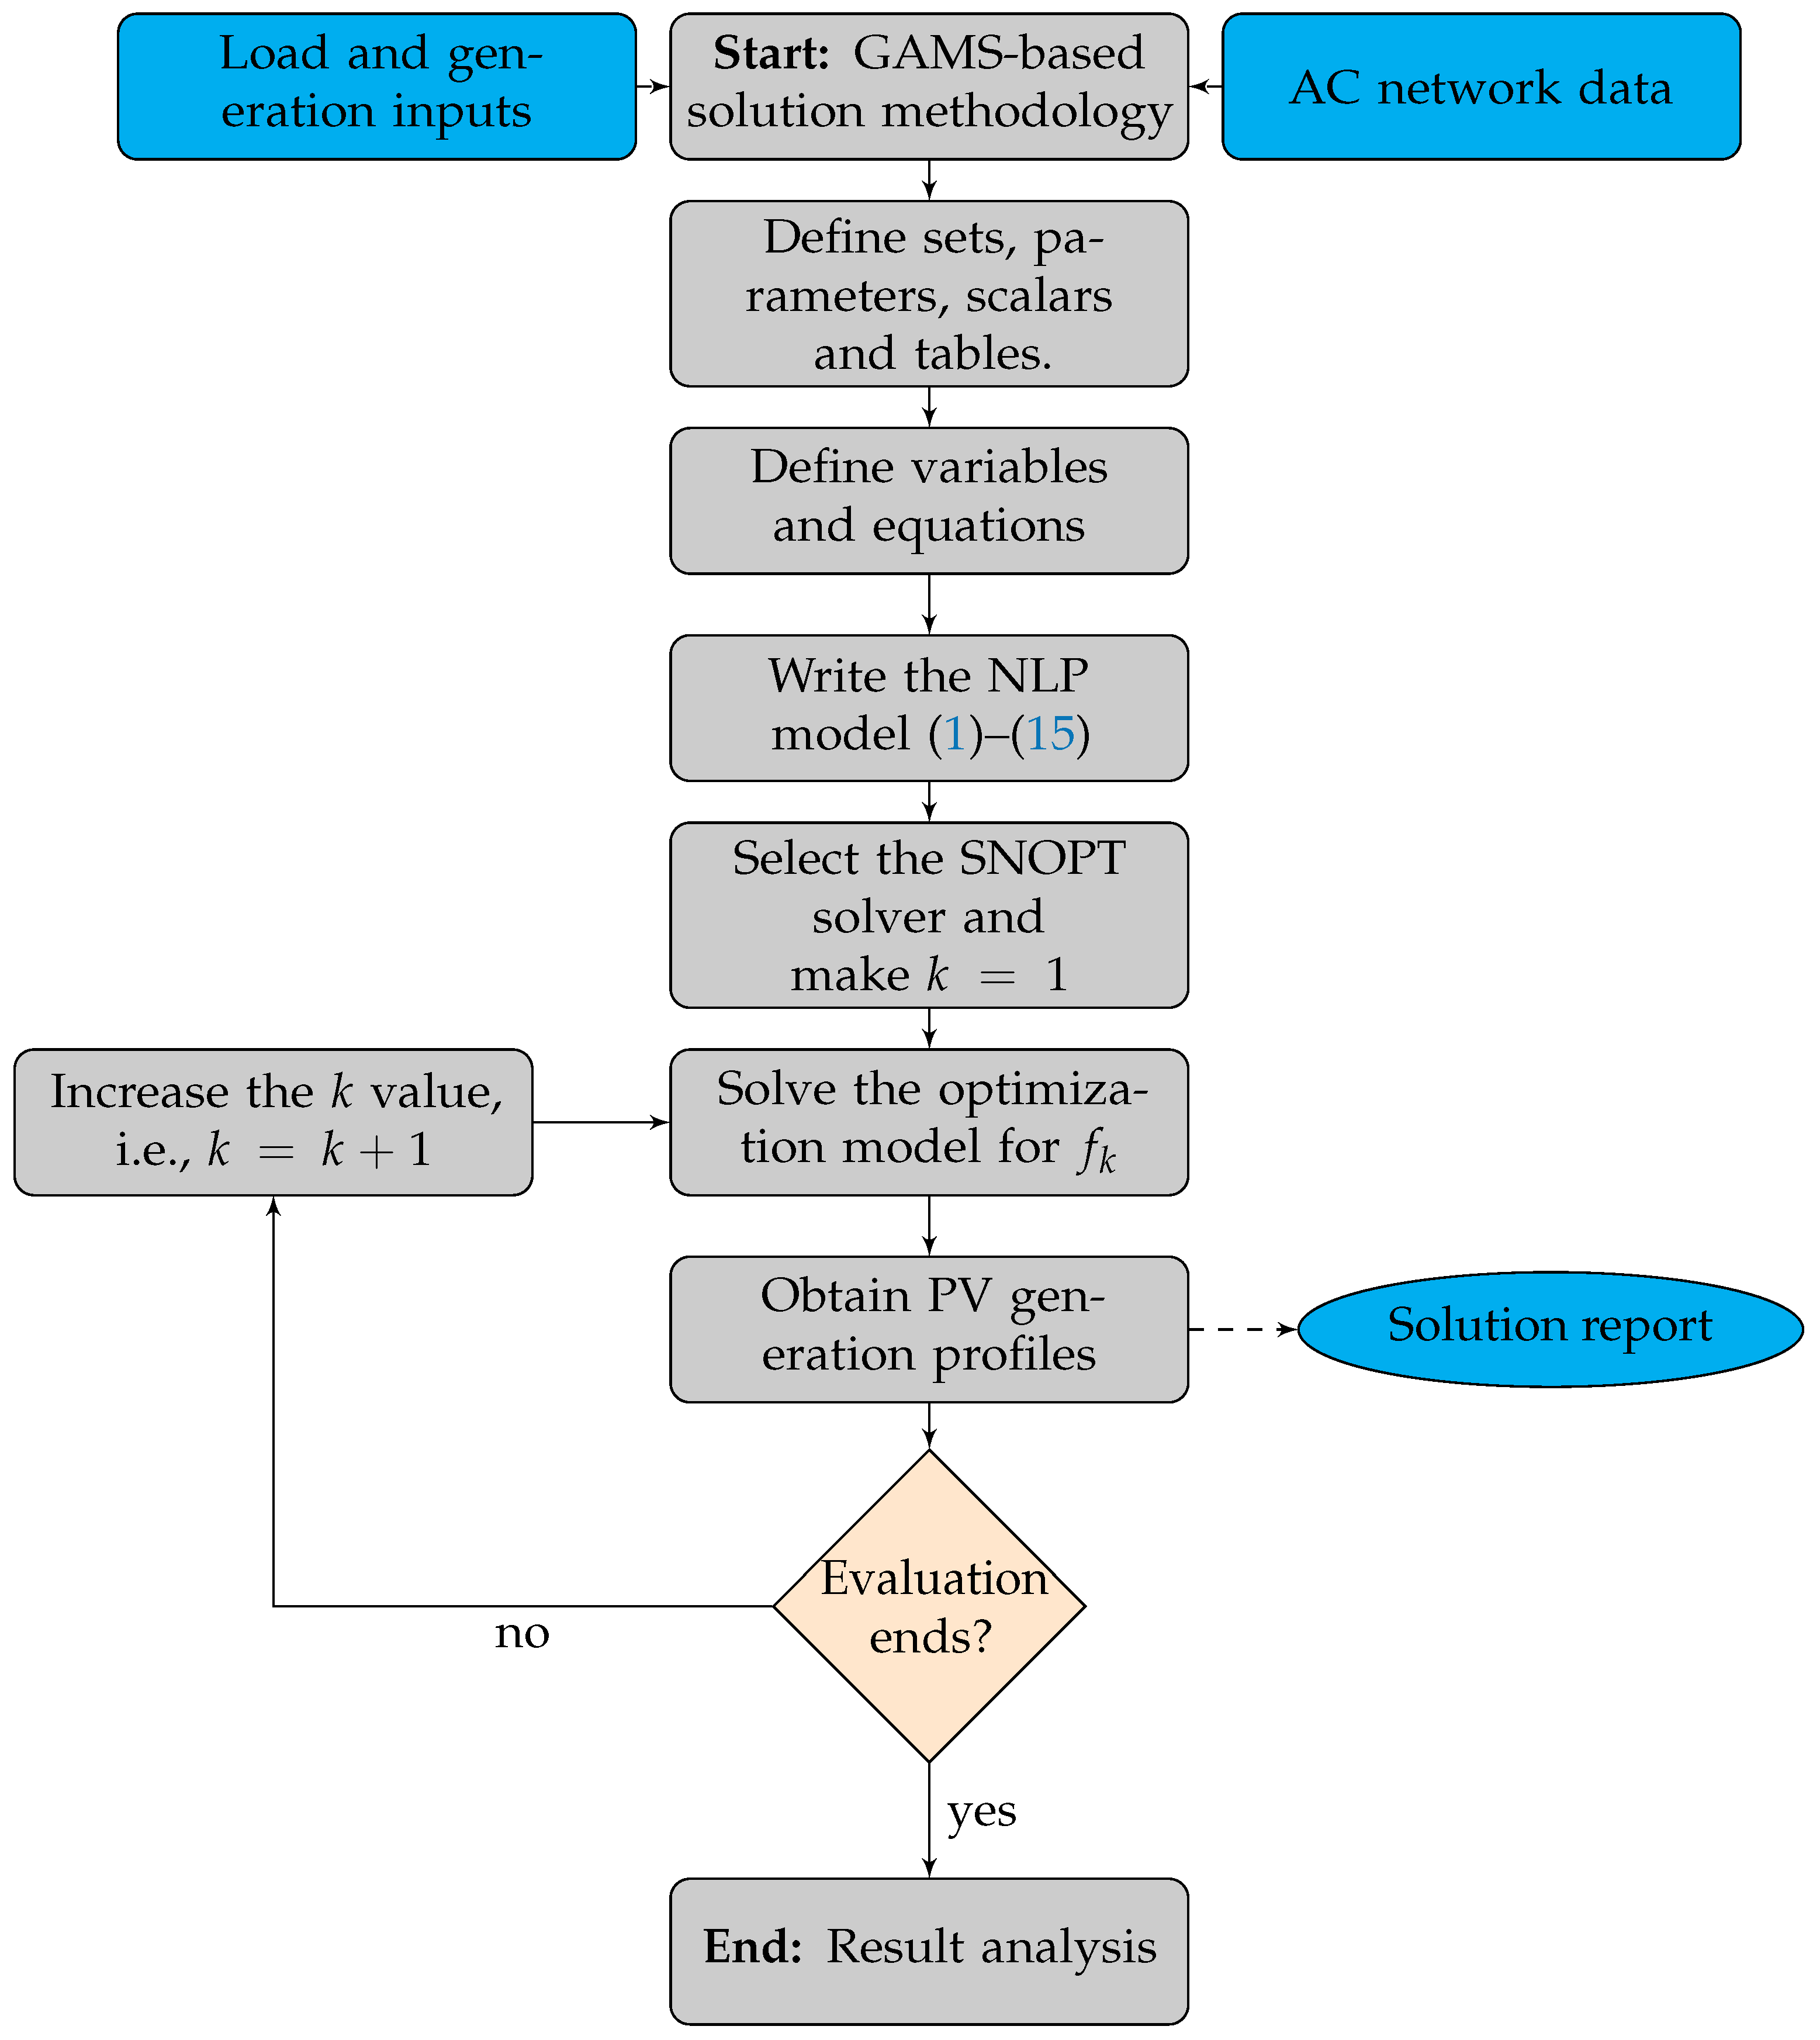
Section 3 describes the general implementation of the NLP model in the GAMS software; 
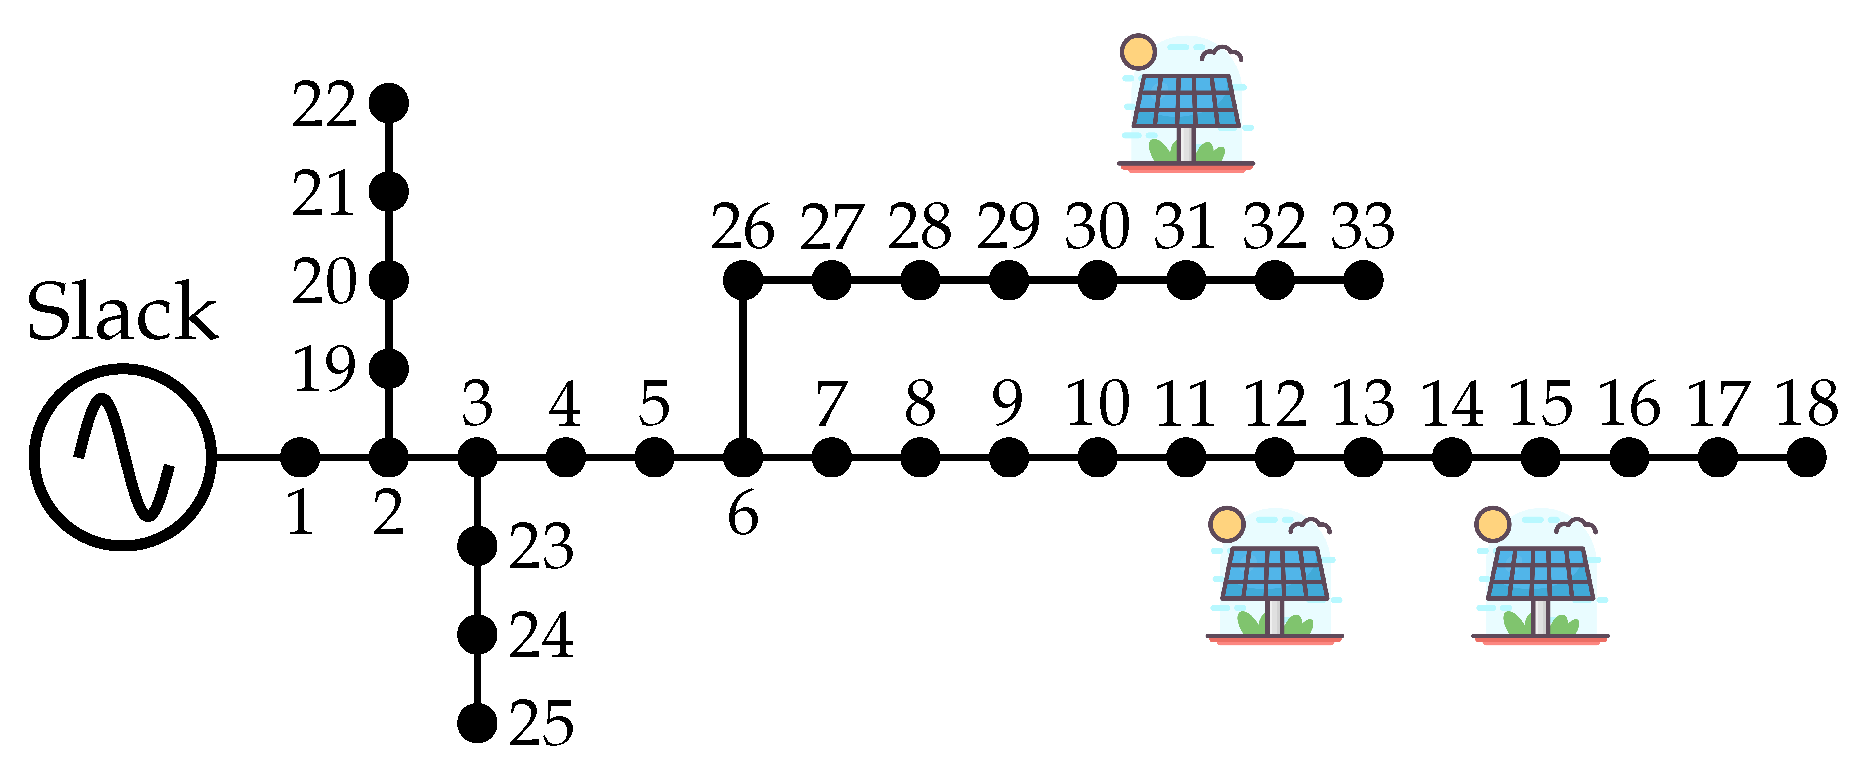
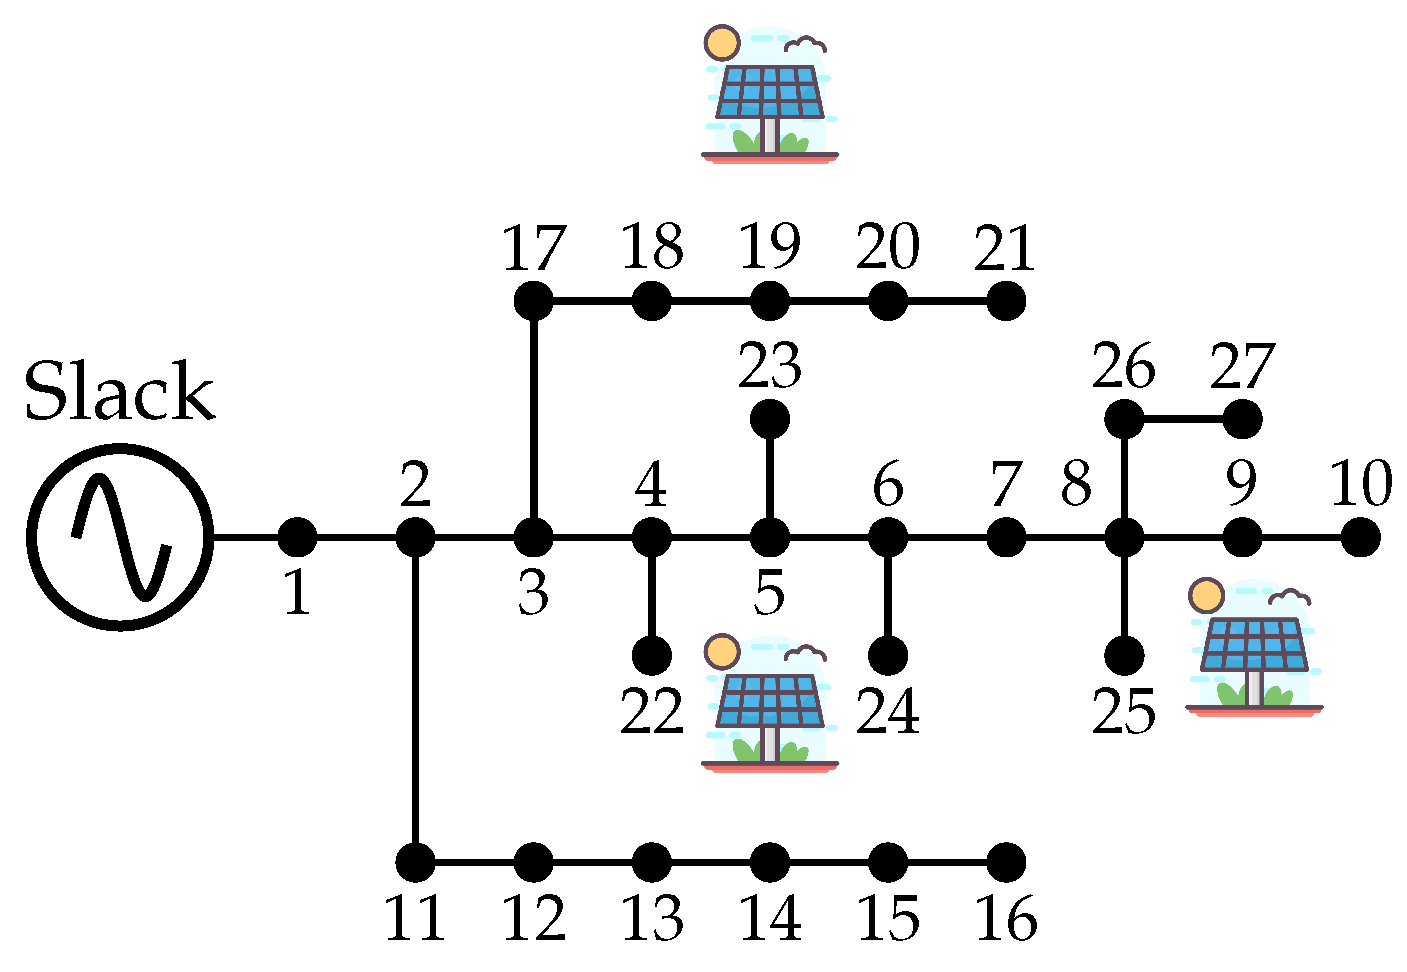
Section 4 describes the main characteristics of the urban distribution grid (IEEE 33-bus grid) and the data obtained for the metropolitan area of Medelleín, as well as the rural distribution grid composed of 27 nodes and inspired by the rural area of Capurganá, Chocó, Colombia; Section 5 presents the main numerical results reached by the GAMS software and the SNOPT solver, as well as a complete comparison with different combinatorial optimization algorithms; and Section 6 presents the main concluding remarks derived from this work, as well as some possible future works.

2. General NLP Formulation

The problem regarding the optimal operation of PV generators in AC distribution networks can be represented as a day-ahead operation problem with different objective function indicators. The selection of each objective function depends on the optimization requirements of the distribution system operator. This study considers an NLP model with three possible objective functions to be minimized to represent the studied problem. The first objective function corresponds to the minimization of the total energy purchasing costs at the terminals of the substation, which is added to the operation and maintenance costs of the PV generation sources. The second objective function is defined as the minimization of the expected costs for the energy losses caused by all the resistive effects in all the branches of the distribution grid. Finally, the third objective function is related to minimizing the expected CO2 emissions at the terminals of the substation bus. Note that all the aforementioned objective functions will be minimized based on a day-ahead operation approach, i.e., operation during a horizon of 24 h. Observe that Figure 1 illustrates the main aspects of the solution approach proposed in this research.
Figure 1 shows that (i) the NLP model regarding the optimal dispatch of PV sources in distribution networks requires knowing the nodes where the PV sources are located, the solar radiance and temperature (the area of influence of the distribution grid), and the expected behavior of the energy users (demand consumption profiles); and (ii) the NLP model was implemented in the GAMS software, which allows determining the best generation profiles for each distributed generator as a function of the objective function under analysis, i.e., economic, technical, or environmental performance indicators.

Exact NLP model

The complete mathematical formulation of the studied problem is formulated in Equations (1)–(15).
Objective functions
min E c o s t = C k W h h H i N p i , h s Δ h + C O & M h H i N p i , h p v Δ h
min E l o s s = h H l L R l I l 2 Δ h ,
min E C O 2 = C E s h H i N p i , h s Δ h .
Set of constraints
p i , h s + p i , h p v P i , h d = l L A i , l V i , h r e I l , h r e + V i , h i m I l , h i m , i N , h H ,
q i , h s Q i , h d = l L A i , l V i , h r e I l , h i m V i , h i m I l , h r e , i N , h H ,
P i s , min p i , h s P i s , max , i N , h H
Q i s , min q i , h s Q i s , max , i N , h H ,
P i p v , min p i , h p v P i p v , max , i N , h H ,
I l , h r e = 1 R l 2 + X l 2 i N A i , l R l V i , h r e + X l V i , h i m , l L , h H ,
I l , h i m = 1 R l 2 + X l 2 i N A i , l R l V i , h i m X l V i , h r e , l L , h H ,
V i , h = V i , h r e 2 + V i , h i m 2 , i N , h H ,
I l , h = I l , h r e 2 + I l , h i m 2 , l L , h H ,
V i min V i , h V i max , i N , h H ,
0 I l , h I l max , l L , h H ,
p i , h p v P i p v C h p v , i N , h H .
The complete interpretation of the optimization model shown in (1)–(15) is as follows: Equation (1) corresponds to the first objective function regarding the minimization of the expected distribution grid operating costs, which includes the energy purchasing costs at the substation terminals, added with the operating costs of PV sources. Equation (2), the second objective function, is more related to a technical performance indicator used in optimizing distribution networks. It corresponds to the minimization of the expected daily energy losses associated with all the losses in the resistive parameters of the distribution lines for a daily operation environment. Equation (3) refers to the environmental performance indicator, an objective function that aims to minimize the greenhouse gas emissions (i.e., CO2) to the atmosphere caused by conventional or diesel generation sources. Equality constraints (4) and (5) are known as the power balance constraints. These are entrusted with ensuring the power equilibrium at each node and for each period, i.e., they are the combination of Kirchhoff’s first and second laws with Tellegen’s second theorem [23]. Box-type inequality constraints (5) and (6) refer to the admissible lower and upper active and reactive power generation bounds of the conventional generation source connected to node i in the period h, respectively. Inequality constraint (8) defines the admissible generation region allowed for any PV source integrated to the distribution grid. Equality constraints (9) and (10) allow calculating the real and imaginary parts of the currents through the distribution line l as a function of the voltage variables and impedance parameters of the line, respectively. Equations (11) and (12) define the magnitudes of the voltage and current variables, respectively, as a function of their rectangular components. Inequality constraints (13) and (14) are related to the voltage regulation limits imposed by regulatory policies and the maximum thermal limits associated with all the distribution lines, respectively. Finally, inequality constraint (15) shows that the PV generation units cannot necessarily work with maximum power point tracking as it will depend on the grid energy requirements.
Remark 1. 
The following are the most important characteristics of the optimization model defined from (1) to (15):
  • It is a nonlinear, non-convex optimization model due to the presence of products between the voltage and current variables in the power balance constraints, as well as square roots regarding voltage and current magnitudes.
  • It is possible to find the optimal solution for each one of the single-objective function models by using the interior point method with logarithmic barriers, given that it is a continuous nonlinear programming model with quadratic constraints [24].
  • The main effect in considering the grid nature (AC technology) in the optimization model is the presence of multiple nonlinear constraints regarding power equilibrium at each node and the presence of root square equalities regarding voltage variables, which become the optimization model highly complex in comparison to DC grids where the complexity of the optimization problem is reduced about 50% since no reactive power constraints and variables appear [25].
This research focuses on (i) the solution of the exact NLP model in the GAMS through the SNOPT solver and (ii) the comparison of this solution with multiple combinatorial optimization algorithms such as the Vortex Search algorithm, CBGA, the particle swarm optimization method, and the Ant Lion Optimizer. In addition, two radial distribution networks with different operating conditions are considered, one with urban characteristics and the other in a rural area. The next section presents the main characteristics of the implementation of the exact NLP model (1)–(15) in the GAMS software.

3. Solution Methodology

This section presents two main aspects regarding the proposed solution methodology. The first corresponds to the general implementation of the exact NLP model in the GAMS software. The second corresponds to the general approach for calculating the PV generation inputs in a distribution network depending on the distribution grid’s area of operation.
Remark 2. 
The proposed optimization model (1)–(15) is solved in the research with the help of the GAMS software by considering a single-objective minimization procedure, i.e., each one of the objective functions in Equations (1) to (3) are minimized separately, and the other two ones are evaluated to know their final values. Note that more research regarding multi-objective optimization is required, and it can be an opportunity for research in future works.

3.1. General Implementation of an NLP Model in the GAMS Software

To deal with the NLP model, shown in (1)–(15), this research selected the GAMS software to solve this optimization problem since, as demonstrated in multiple research articles, it can find the global optimum with its SNOPT solver if the optimization problem does not include discrete variables [26]. Multiple authors have successfully used the GAMS software to deal with complex NLP problems in engineering and science. The authors of [27] presented the solution to the problem regarding the optimal design of an osmotic generation plant in the Bahmanshir River of Iran, demonstrating excellent numerical results and low computational effort. The work by [28] addressed multiple optimization problems in power systems, which include the optimal dispatch with thermal plants and the optimal operation of batteries and energy storage systems in a market environment. Authors such as [29,30] have used the GAMS software to deal with the problem regarding the optimal placement and sizing of dispersed generation units in distribution networks, aiming to minimize the total grid power losses, with excellent numerical results when compared to those obtained via combinatorial optimization methods. The work by [31] presented a multi-objective optimization approach for the stack of a thermoacoustic engine using the GAMS as an optimization tool. In [32], an optimization model for a pump and valve schedule in complex water distribution networks was presented using GAMS Modeling Language. Finally, the authors of [33] used the GAMS software and the SNOPT solver to present the solution of an NLP problem regarding parametric estimation in single-phase transformers while considering voltage and current measures.
The literature above confirms that the GAMS optimization package efficiently deals with complex optimization problems, especially if they are defined in the continuous domain. This tool can find the optimal global solution by combining interior point methods with logarithmic barriers and gradient-based optimizers. Figure 2 presents the general structure in implementing an NLP model in the GAMS software.
Remark 3. 
Note that the value of f k is defined as the objective function of interest, i.e., f 1 = E c o s t , f 2 = E l o s s , and f 3 = E C O 2 . This implies that the flow diagram in Figure 2 is a general solution methodology that allows solving the NLP model (1)–(15) for different objective functions.

3.2. Adjusting the Solar Generation Curves

The main characteristic of PV-technology-based solar generation is its dependence on weather conditions, i.e., the solar radiation and temperature exposition of the panels [34]. In addition, due to the sudden variations in solar incidence for a particular area, e.g., due to cloud movements, generation based on PV systems is considered a non-dispatchable source [35]. This implies that for the daily economic dispatch analysis, it is mandatory to correctly predict the PV generation availability [26]. There are multiple literature reports that nonlinearly relate solar radiation and temperature to predict the total power output of a PV system [36]. This study adopts the formulation reported by [37] in obtaining the expected power production of a PV system.
p i , h p v = P i p v f p v G h T G i T , S T C 1 + α p T i , h c T i c , S T C ,
Note that in (16), it is observed that the total power output of a PV generation system is indeed a nonlinear function of the current system temperature, solar radiation, and some factors associated with the expected efficiency of the complete generation system.
To determine the surface temperature of the panels that compose the PV system, Equation (17) is used.
T i , h c = T h a + G h T T i c , N O C T T i a , N O C T G i T , N O C T 1 η i c α
To find the expected behavior of solar generation in the urban and rural areas under analysis, this research considers the parametric information presented in Table 1. Note that this information was adapted from [37,38], assuming that the panel was constructed with silicon polycrystalline technology.
It is worth mentioning that if one considers the total power output of the PV system under nominal operating conditions as 1 W , then the expected generation will be defined in the interval [0, 1], i.e., and it can be considered as percentage generation curve. Note that this curve represents the C h p v parameter and is an input in the proposed NLP model (1)–(15).

4. Generation and Demand Parametrization of the Urban and Rural Zones

To evaluate the effectiveness of the proposed GAMS-based optimization approach at operating dispersed generation based on PV generation for AC distribution networks, this study considers two types of operation areas: i.e., an urban area and a rural area. The first area of operation corresponds to the metropolitan area of Medellín, the second largest city of Colombia in terms of population. The second region corresponds to a rural area located on the Pacific coast of Colombia, i.e., the Municipality of Capurganá in the department of Chocó.

4.1. Urban and Rural Generation Curves

To characterize the power generation of the metropolitan area of Medellín, solar radiation and ambient temperature data provided by the National Aeronautics and Space Administration’s (NASA) database were considered [20]. Note that this information was defined in 2019, i.e., 1 January to 31 December, taking a 1-h resolution into account. This average information is presented in Table 2. In addition, if Equations (16) and (17) are considered for the information reported in Table 1, then the average power output generation for Medellín is as presented in Table 2 and Figure 3.
Remark 4. 
The information available in the NASA database is also considered to obtain the generation curve for the municipality of Capurganá, and the same procedure is followed. The complete generation profile for this area is also reported in Table 2 and Figure 3.

4.2. Urban and Rural Demand Curves

To determine the expected energy consumption profiles in the areas of interest, this study considers the consumption information provided by the distribution companies that operate in these areas:
  • Medellín: The historical reports made by the network operator Empresas Públicas de Medellín (EPM) [22] were considered. Consumption data for 2019 were taken, i.e., from 1 January to 31 December, with a 1-h sampling. As for the power generation curves, the data collected were averaged per hour, as shown in Table 3. With the data consigned in this table, the average behavior of power consumption for a typical day in Medellín was obtained, as shown in Figure 4 and Table 3.
  • Capurganá: Power consumption data were taken from the reports of historical events by the IPSE [21], which is in charge of monitoring and supervising the non-interconnected electrical areas of Colombia in order to promote, develop, and implement energy-related solutions in these areas. As in the previous case, the collected data were averaged per hour as shown in Table 3. Similarly, it is possible to obtain the average consumption behavior for a typical day in Capurganá, as shown in Figure 4 and Table 3.

4.3. Parametrization of the Optimization Model

To calculate the objective function values defined in Equations (1)–(3), the information reported in Table 4 is employed. Note that this table presents the costs of generating energy in urban and rural areas. In the same way, the costs associated with the maintenance of PV generation systems are shown.
It is worth noting the following:
  • The energy generation costs in the urban and rural areas were taken from the reports made by the network operators to the Unified Information System (SUI by its Spanish acronym) in 2019 [39,40].
  • The operation and maintenance costs of the PV generators were taken from [41].
  • The emissions factor for the urban area is the one established by XM for the interconnected electrical system, to which Empresas Públicas de Medellín (EPM) belongs [42]. Similarly, the emissions factor for the rural area is the one associated with diesel fuel and was taken from the database of the Emission Factors of Colombian Fuels (FECOC, by its Spanish acronym) [43].
Remark 5. 
The voltage regulation bounds for electrical systems with a voltage level greater than 1 k V and less than 62 k V , i.e., medium-voltage networks, are defined as + 5 and 10 % of the nominal voltage. These bounds are established by the 1340 Colombian Technical Standard (NTC, by its Spanish acronym) [44].

5. Test Systems

To evaluate the proposed NLP formulation to operate PV generation systems in urban and rural environments while considering different objective functions, two test feeders were considered. The first one is the IEEE 33-bus grid, which was employed to emulate the distribution operating conditions of the city of Medellín. The second one is a 27-bus grid originally designed for rural simulation environments, which is adapted in this research to analyze the municipality of Capurganá. To define the nodes where the PV generators are located, we consider that these were previously selected in distribution system planning studies carried out by the distribution company. In this research, the information regarding PV sources’ location and sizes has been obtained from [18].

5.1. Urban Simulation Test System

For this simulation case, the IEEE 33-bus test feeder is considered. This distribution system is composed of 33 nodes and 32 distribution lines, and it is operated at the substation terminals with a nominal voltage of 12.66 kV. The electrical topology of the IEEE 33-bus grid is presented in Figure 5 [45]. Note that to evaluate the effect of the PV generation in this system, three PV sources with nominal rates of 2400 kW were added to nodes 12, 15, and 31, respectively.
In addition, the parametric information regarding peak loads and branch parameters are listed in Table 5. It is worth mentioning that to evaluate the current constraints in the optimization model (1)–(15), the power flow solution under peak load conditions is used, which provides the maximum currents through each distribution line. With these currents, the conductors that can be assigned to these lines, according to the Colombian regulation NTC 2050, are found, assuming that they will operate under a nominal temperature of 60 °C.

5.2. Rural Simulation Test System

The 27-bus grid is a radial distribution network composed of 27 nodes and 26 distribution lines, which operate with a nominal voltage of 23 kV at the substation terminals. This test feeder was proposed initially by the authors of [46] to evaluate the problem regarding the optimal selection of conductors. The electrical configuration of this test feeder is reported in Figure 6. Note that this system has three PV generators, all with a nominal power of 2400 kW, located at nodes 5, 9, and 19.
Due to the fact that the 27-bus grid was initially proposed to determine the optimal conductor sizes, the thermal bounds for each distribution line are also taken from [46]. The complete parametric information of this test feeder is reported in Table 6.

6. Numerical Results and Discussions

The general NLP model that represents the problem regarding the optimal operation of PV generation in AC distribution networks has been implemented and solved in the GAMS optimization package with the SNOPT solver on a Dell Precision 3450 workstation with an Intel(R) Core(TM) i9-11900 CPU@2.50 Ghz processor, 64.0 GB RAM and a Windows 10 Pro 64-bit operating system. To demonstrate the efficiency of the GAMS software in operating PV generators in AC distribution networks, its results were compared with those of different combinatorial optimization techniques such as particle swarm optimization (PSO) [47], the CBGA [48], the Vortex Search algorithm (VSA) [49], and the Ant Lion Optimizer (ALO) [50]. These methodologies were selected due to their excellent performance in solving the optimal power flow problem in electrical distribution systems [18,51,52,53]. In addition, to ensure a fair comparison between the SNOPT solver and the combinatorial algorithms, each of them was tuned in order to guarantee the best performance when solving the studied problem. Regarding the selection of parameters, the CBGA was used with an initial population of 40 individuals and a maximum number of iterations of 400.

6.1. Urban Test System Simulations

Table 7 shows the numerical results of all the combinatorial optimization algorithms and the SNOPT solver applied to the IEEE 33-bus grid. The information in this table is presented from left to right, as follows: the methodology used, the value obtained for the evaluated function, and the average computation time.
The numerical results for the urban test system show that the SNOPT solver finds the best solution with respect to all the other methods. The following facts can be observed: (i) The final total operating costs of the network are 7219.93 USD, that is, an improvement of 2711.73 USD regarding the base case, 189.31 USD regarding the CBGA, 97.96 USD regarding PSO, 56.11 USD regarding the VSA, and 0.15 USD regarding the ALO; (ii) the final energy losses of the network are 2331.48 kWh, showing an improvement of 1047.59 kWh with respect to the base case, 14.52 kWh with respect to the CBGA, 0.57 kWh with respect to PSO, 0.13 kWh with respect to the VSA, and 0.03 kWh with respect to the ALO; and (iii) as for CO2 emissions, the SNOPT solver achieves a response of 9068.75 kg of CO2, evidencing an improvement of 3472.47 kg of CO2 with respect to the base case, 240.82 kg of CO2 with respect to the CBGA, 129.51 kg of CO2 compared to PSO, 83.30 kg of CO2 compared to VSA, and 0.18 kg of CO2 with respect to the ALO.
Similarly, it is evident that the SNOPT solver is the fastest methodology in the three simulation scenarios for the urban test system. The SNOPT solver takes approximately 0.3450 s to calculate f 1 , 0.3180 s to calculate f 2 , and 0.2830 s to calculate f 3 . This shows that in order to solve a multidimensional (i.e., 39-dimensional) NLP model with continuous variables (solution space with infinite combinations), the SNOPT solver takes less than 0.50 s to converge to the optimal solution.
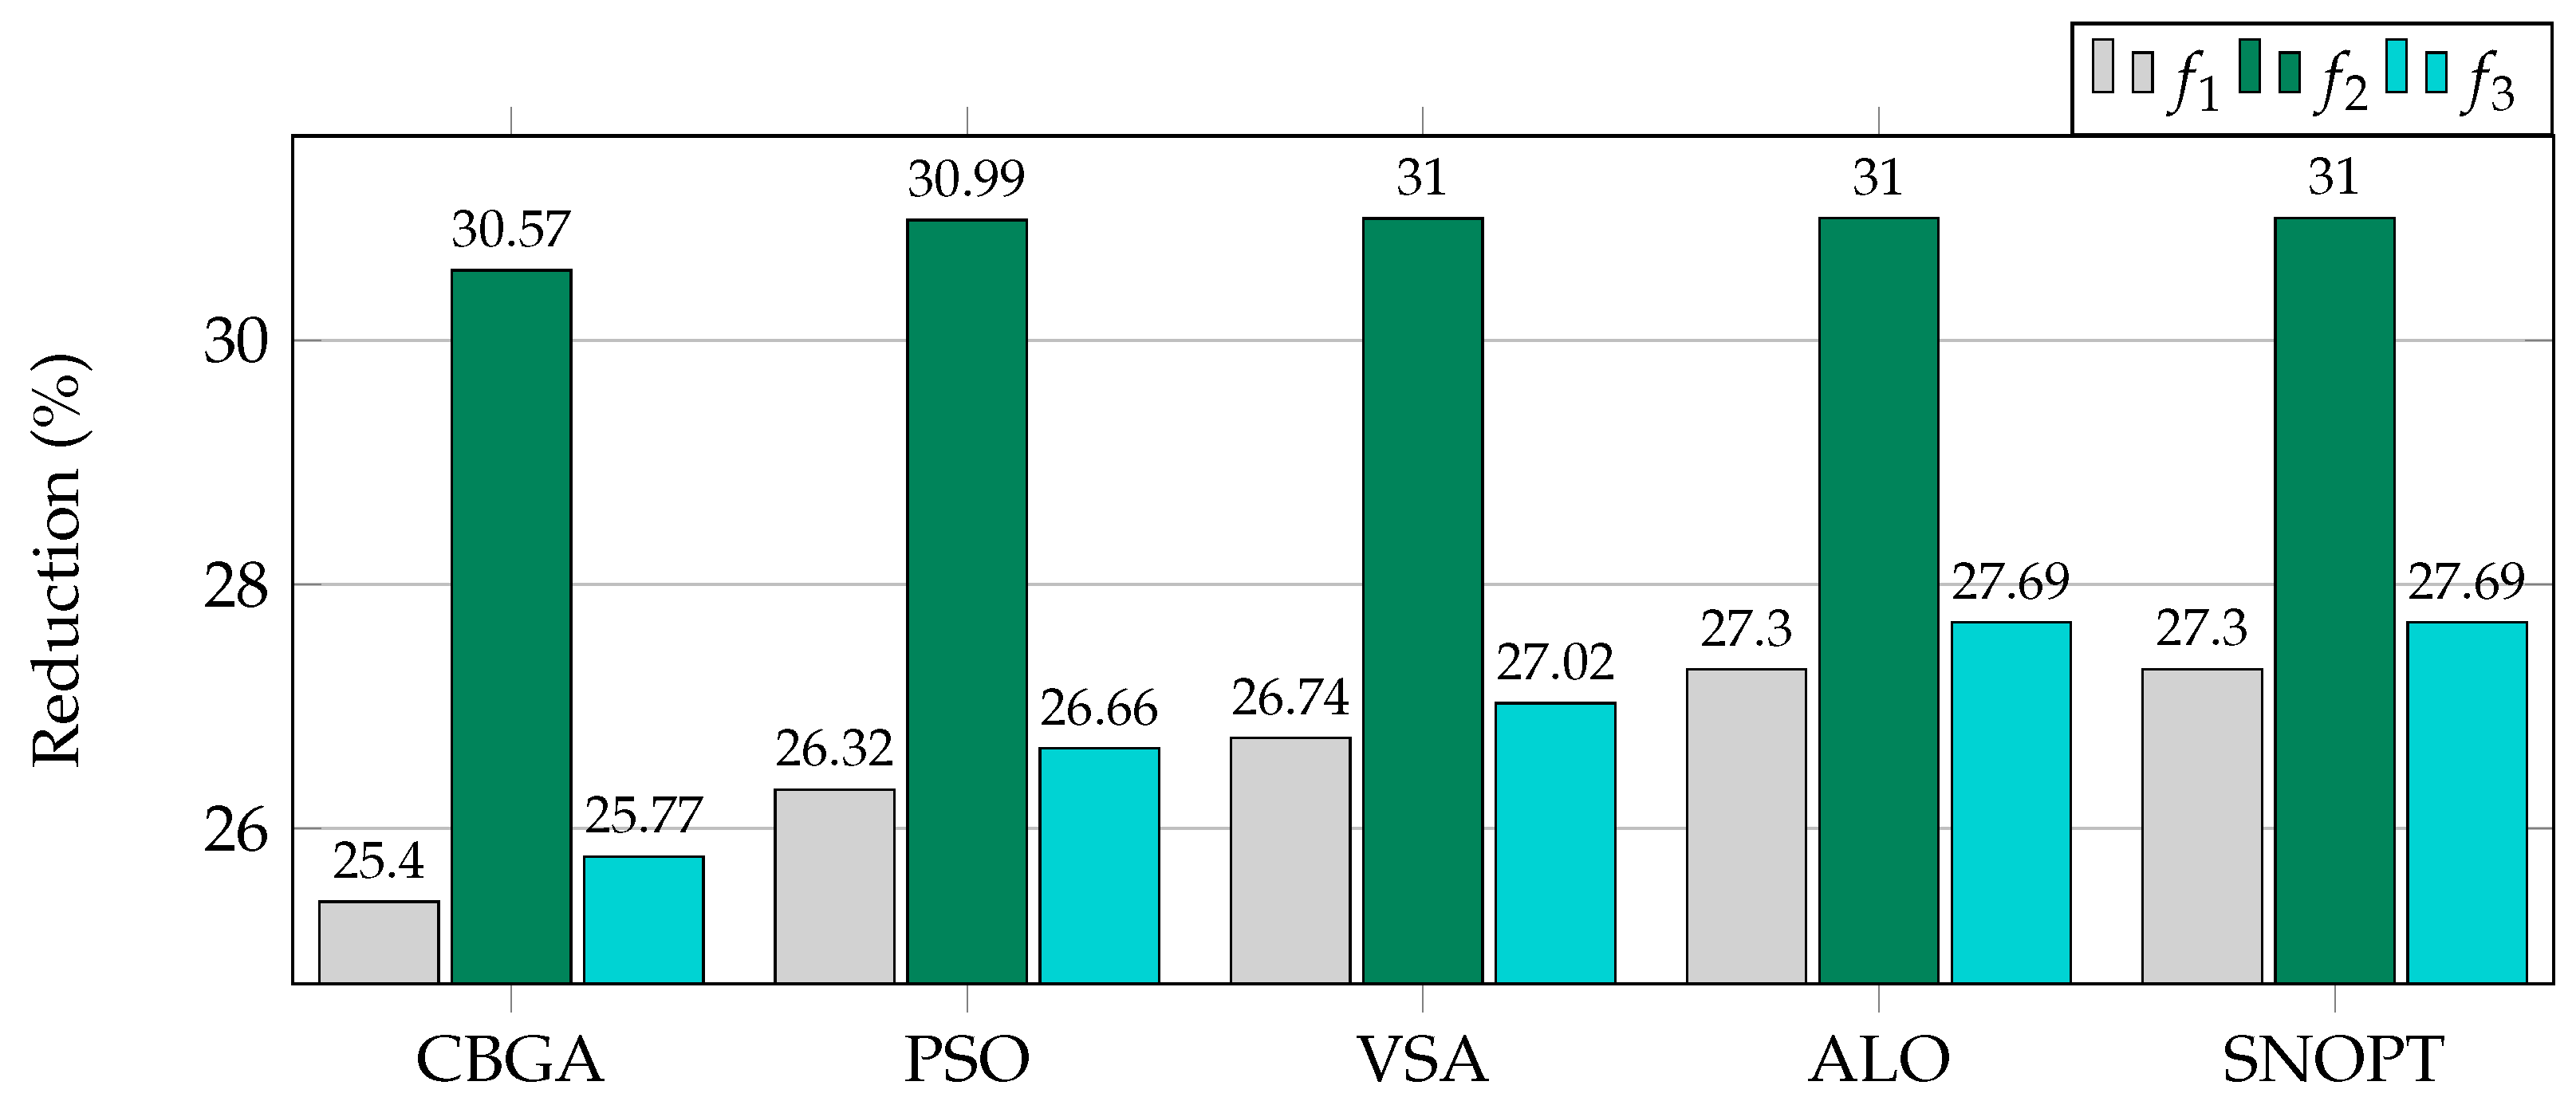
Regarding the daily expected improvements in the proposed objective functions, Figure 7 presents the percentage of reductions reached by each method with respect to the base case.
Figure 7 shows that all optimization techniques allow for a reduction of more than 25% compared to the base case for the three simulation scenarios. The SNOPT solver allows the highest objective function reduction for the three simulation scenarios, i.e., 27.30, 31, and 27.68%. On the other hand, all the combinatorial optimization methods exhibit very good performance. However, due to their random nature, these algorithms are trapped in locally optimal solutions, and statistical analysis is required to ensure that they reach good solutions on average.
Remark 6. 
The above demonstrates the effectiveness and robustness of the SNOPT solver when solving the problem regarding the operation of PV generators in AC distribution networks, which allows optimizing the system from an economic, technical, or environmental point of view. The exact solution obtains the best performance when it comes to the best response and processing times (less than 0.50 s). This turns the proposed approach into the best option to address this problem with regard to the urban test system, obtaining a global optimal solution for each simulation scenario, which respects the technical operating conditions of the network.

6.2. Rural Test System Simulations

Table 8 shows the numerical performance of all the combinatorial optimization algorithms and the SNOPT solver for the 27-bus grid in rural applications. Note that this table has the same information shown in Table 7.
The numerical results for the IEEE 27-bus grid show that the SNOPT solver finds the best solution with respect to all methods used: (i) for f 1 , the SNOPT solver exhibits a response of 12,022.34 USD, i.e., an improvement of 6521.50 USD regarding the base case, 259.68 USD regarding the CBGA, 82.27 USD regarding PSO, 30.60 USD regarding the VSA, and 0.06 USD regarding the ALO; (ii) in the case of the f 2 function, the SNOPT solver reaches a response of 558.20 kWh, showing an improvement of 132.95 kWh with respect to the base case, 1.31 kWh with respect to the CBGA, 0.08 kWh with respect to PSO, 0.02 kWh with respect to the VSA, and 0.00 kWh with respect to the ALO; and (iii) in the case of f 3 , the SNOPT shows a response of 10,985.71 kg of CO2, evidencing an improvement of 6019.50 kg of CO2 with respect to the base case, 206.96 kg of CO2 with respect to the CBGA, 79.01 kg of CO2 with respect to PSO, 37.80 kg of CO2 with respect to VSA, and 0.04 kg of CO2 with respect to the ALO.
It is worth mentioning that the SNOPT solver is the fastest methodology to solve the problem of optimal PV operation in the rural test system with regard to the proposed objective functions. The SNOPT solver takes approximately 0.2990 s to calculate f 1 , 0.2850 s to calculate f 2 , and 0.2410 s to calculate f 3 
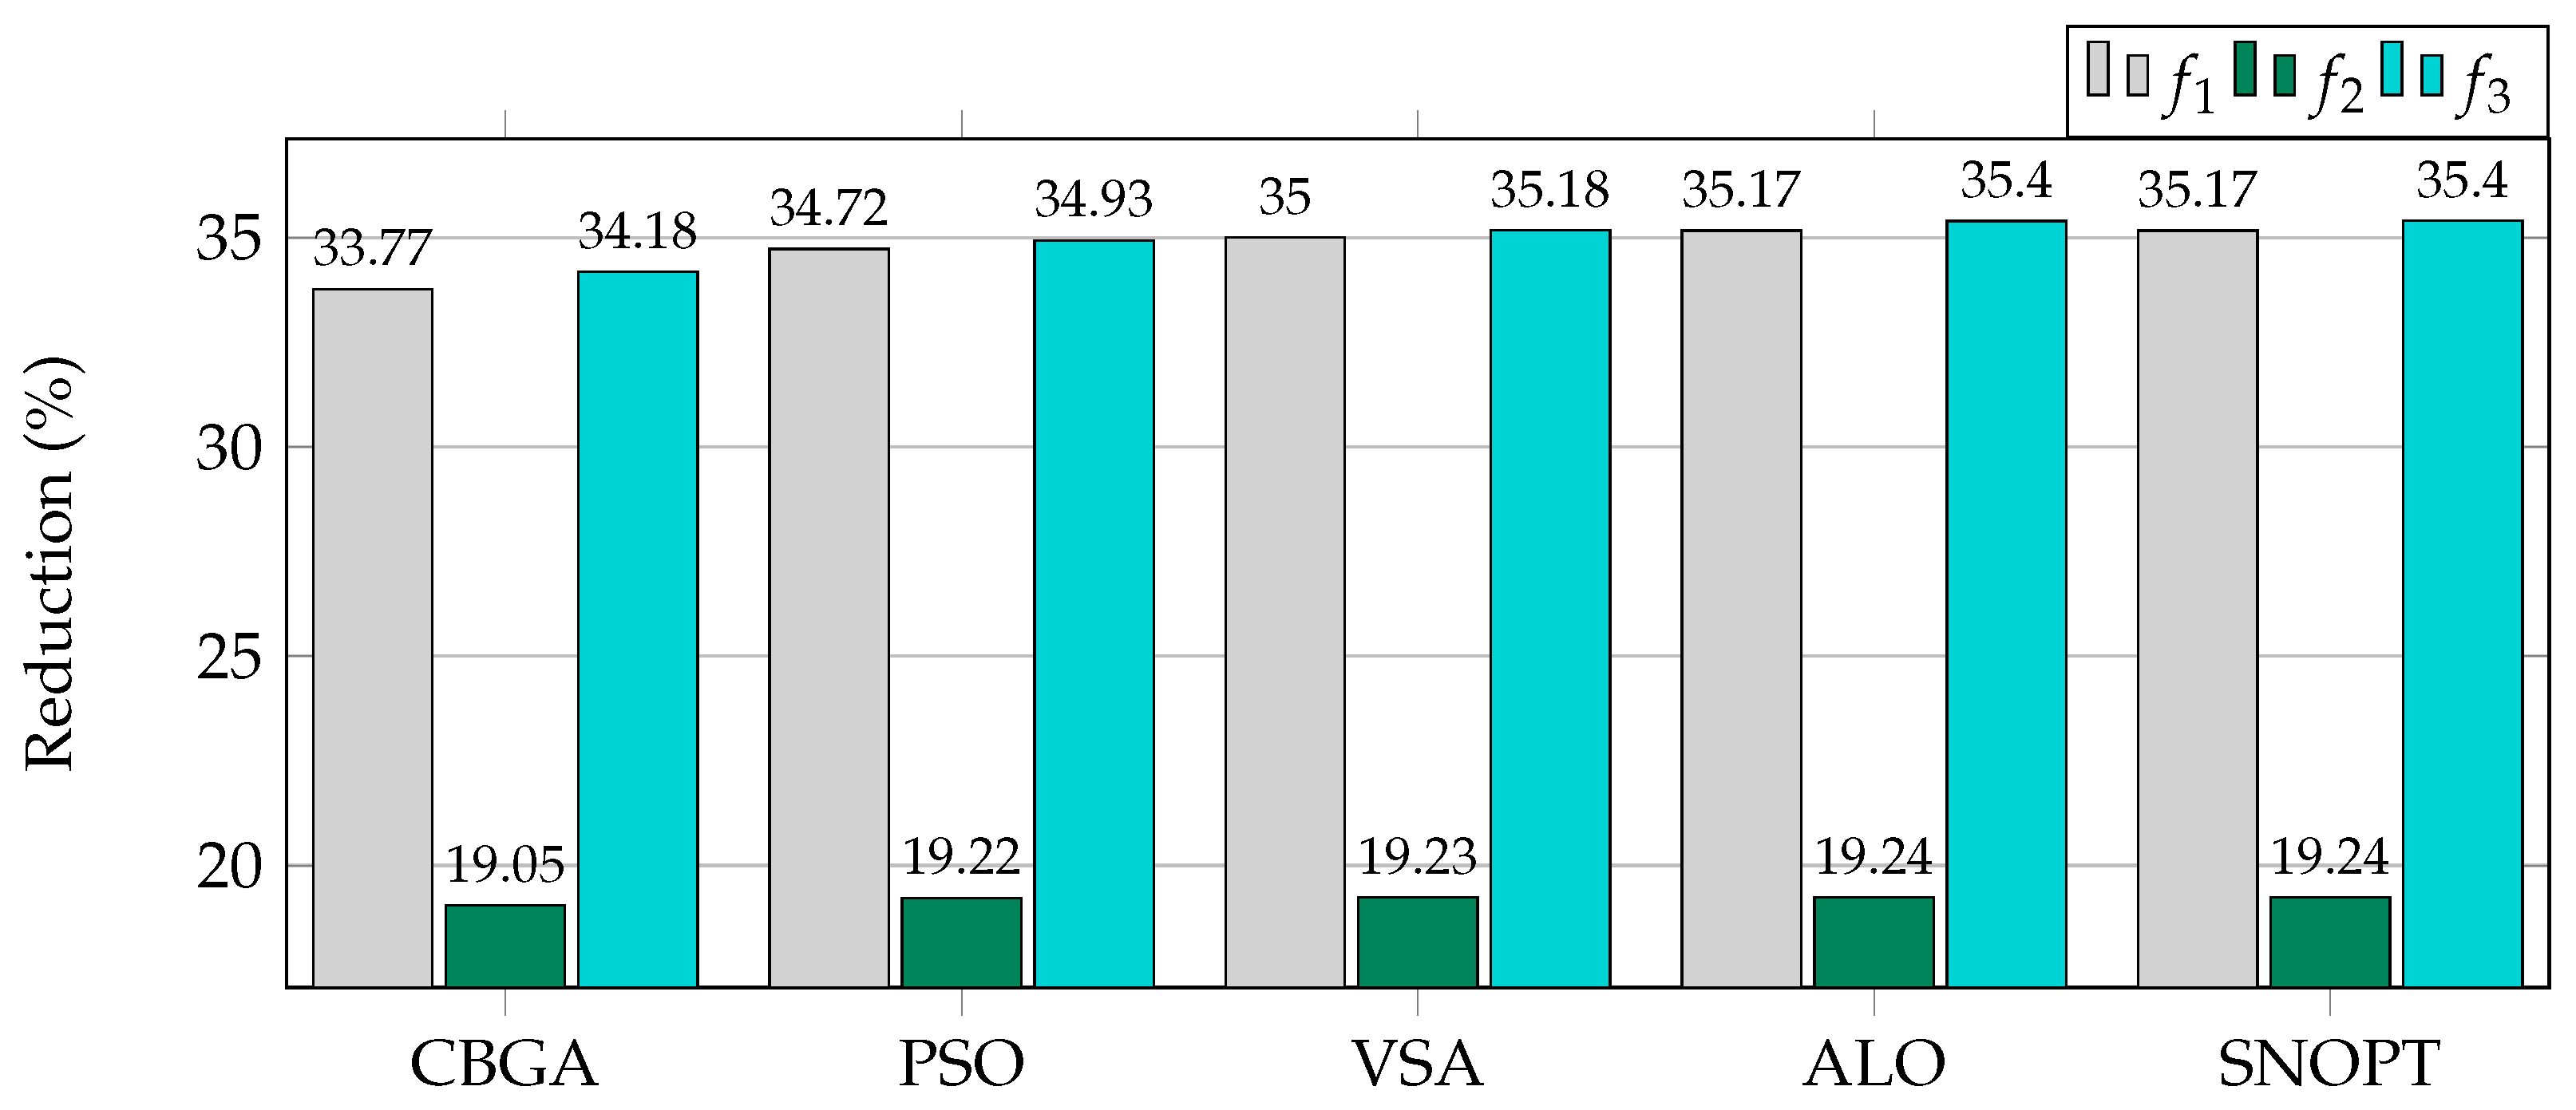
, thus showing that the GAMS approach takes less than 0.3 s to reach the optimal global solution of a complex problem from a dimensional and solution space perspective. In addition, Figure 8 depicts the expected reduction percentage reached by each method when compared to the base case.
In the rural case, all optimization techniques allow for a reduction of more than 18.5% compared to the base case for the three simulation scenarios. The SNOPT solver achieves the highest objective function reduction for the three simulation scenarios, i.e., 35.17, 19.27, and 35.40%. All the combinatorial optimization methods are adequate in solving the problem under study. However, they yield locally optimal solutions due to the randomness of the exploration and exploitation of the solution space.
Remark 7. 
The results obtained for the rural test system indicate that the SNOPT solver has the best performance, namely, better response and processing times (less than 0.3 s). This makes this solution methodology the best option to address the problem of operating PV generators in the IEEE 27-bus grid as it obtains an optimal global solution for each simulation scenario, which respects the technical-operating conditions of the network.

7. Conclusions and Future Work

The problem regarding the optimal daily operation dispatch of PV generation units in electrical distribution networks was addressed in this research by implementing its NLP model in the GAMS software with the SNOPT solver. Numerical results in two test feeders composed of 27 and 33 nodes demonstrated the effectiveness and robustness of the GAMS software in dealing with the global optimal solution while considering three different objective functions, i.e., the daily operating costs of energy purchasing at the substation bus, added with the maintenance and operation costs of the PV sources; the total daily energy losses caused by the resistive effects in all the distribution lines; and the total CO2 emissions (kg) at the substation bus.
A complete characterization of two different operation areas in Colombia was proposed in order to evaluate the proposed solution approach in urban and rural areas. The IEEE 33-bus grid was adapted to the operating conditions of the metropolitan area of Medellín, Antioquia, Colombia, and the 27-bus grid was set with the operating conditions of the municipality of Capurganá, Chocó. Information regarding solar radiation and temperature in 2019 was obtained from the NASA database in order to determine the potential for solar power generation in both areas. In addition, an accurate PV model was adjusted to consider the external effects on the effective power generation output. To characterize the demand behavior, the information provided by the utility company of Medellín (i.e., EPM) and the IPSE for the non-interconnected area were used to define the daily expected consumption profile of the urban and rural areas of analysis, respectively.
Numerical results showed the following: (i) For the urban simulation scenario, the SNOPT solver finds reductions of about 27.3039 , 31.0022 , and 27.6884 % with respect to the f 1 , f 2 , and f 3 benchmark cases, respectively. In the case of the rural system, these reductions were 35.1680 , 19.2358 , and 35.3980 % , respectively. In comparison with the combinatorial optimization methods used for validating the proposed approach, only the ALO approach reached a similar numerical performance while the other optimizers were stuck in locally optimal solutions due to the complexity of the NLP model and the infinite size of the solution space. (ii) Regarding the processing times, the SNOPT solver takes about 0.50 s to solve each one of the objective functions in both distribution grids, while the second best approach (i.e., the ALO approach) takes more than 120 s to reach its solutions. This confirms that the proposed approach finds the global optimal solution 240 times faster than the ALO approach with no need for statistical analysis, which was required by all the metaheuristic-based approaches in order to find the average performance and quality.
In future works, it will be possible to develop the following derived works: (i) extending the proposed NLP model to include battery energy storage systems and dynamic reactive power compensators; (ii) proposing a convex reformulation of the NLP model via conic or semidefinite programming in order to ensure that the global optimum is found; (iii) extending the proposed formulations to DC distribution networks with monopolar and bipolar structures; and (iv) the development of a comparative analysis of the proposed NLP model with other alternatives for modeling the PV sources and the power balance equations in distribution networks including uncertainties in demand and generation curves.

Author Contributions

Conceptualization, methodology, software, and writing (review and editing), L.F.G.-N., O.D.M., B.C.-C., F.Z. and J.R.-G. All authors have read and agreed to the published version of the manuscript.

Funding

This research was supported by Electrical Machines & Drives research Group (EM&D) from Universidad Nacional and project Think Green on the island of San Andres, BPIN 2016000100002 EEDAS ESP.

Data Availability Statement

Not applicable.

Conflicts of Interest

The authors of this paper declare no conflict of interest.

Abbreviations

The following abbreviations are used in this manuscript:
E c o s t Objective function associated with the total operating costs of the distribution grid (USD/day).
f 1 Component of the objective function related to the purchase of energy at the terminals of the substation node (USD/day).
f 2 Component of the objective function associated with the operation and maintenance costs of the PV generators (USD/day).
C k W h Average cost of purchasing power at the substation node (USD/Wh).
p i , h s Active power generated by a conventional source connected to a node i during a period h (W).
Δ h Time in which the electrical variables are assumed to be constant (h).
C O & M Maintenance and operation costs of a PV generator (USD/Wh).
p i , h p v Active power generated by a PV source connected to a node i during a period h (W).
N Set that contains all the nodes of the network.
H Set that contains all periods in a daily operation scenario.
E l o s s Energy losses costs for a day of operation (USD/day).
R l Resistance associated with the distribution line l ( Ω ).
X l Reactance associated with the distribution line l ( Ω ).
I l Magnitude of the current that flows through the distribution line l (A).
L Set that contains all the distribution lines of the distribution network.
E C O 2 Total greenhouse gas emissions per day of operation (kgCO2/day).
C E s Factor of CO2 emissions associated with conventional generation sources (kgCO2/W).
P i , h d Active power demanded at a node i for a period of time h (W).
Q i , h d Reactive power demanded at a node i for a period of time h (var).
q i , h s Reactive power generated by a conventional source connected to a node i during a period of time h (var).
V i , h r e Real part of the voltage profile at a node i during a period of time h (V).
V i , h i m Imaginary part of the voltage profile at a node i during a period of time h (V).
I i , h r e Real part of the current flowing through the line l during a period of time h (A).
I i , h i m Imaginary part of the current flowing through the line l during a period of time h (A).
A i , l Node-to-branch incidence matrix.
P i s , min Minimum active power bound associated with each conventional generator connected to node i (W).
P i s , max Maximum active power bound associated with each conventional generator connected to node i (W).
Q i s , min Minimum reactive power bound associated with each conventional generator connected to node i (var).
Q i s , max Maximum reactive power bound associated with each conventional generator connected to node i (var).
P i p v , min Minimum active power bound associated with each PV generator connected to node i (W).
P i p v , max Maximum active power bound associated with each PV generator connected to node i (W).
V i min Minimum voltage regulation bound associated with the voltage profile at node i (V).
V i max Maximum voltage regulation bound associated with the voltage profile at node i (V).
P i p v Nominal power of the PV generator located at a node i (W).
C h p v Expected PV generation behavior for the area where the distribution grid is located (p.u.).
f p v Reduction factor of the PV system’s power output. It models the external effects that affect generation in PV systems (%).
G h T Solar radiation that falls on a PV generator during a period of time h (W/m2).
G i T , S T C Solar radiation of the PV generator located at node i under standard test conditions (W/m2).
α p Coefficient regarding the power and temperature output (1/°C).
T i , h c Real surface temperature of the PV generator located at node i during a period of time h (°C).
T i c , S T C Expected surface temperature of the PV generators located at node i under standard test conditions (°C).
T h a Ambient temperature to which the PV generator is exposed during a period h (°C).
T i c , N O C T Nominal surface temperature of the PV generator located at node i (when it is exposed to a radiation G i T , N O C T and a temperature T i a , N O C T ) (°C).
η i c Electrical efficiency of the PV generator located at a node i (%).
τ Solar transmittance parameter of the PV generator.
α Solar absorption coefficient of the PV generator.

References

  1. Ahmed, I.; Rehan, M.; Basit, A.; Hong, K.S. Greenhouse gases emission reduction for electric power generation sector by efficient dispatching of thermal plants integrated with renewable systems. Sci. Rep. 2022, 12, 12380. [Google Scholar] [CrossRef] [PubMed]
  2. Jakhrani, A.Q.; Othman, A.K.; Rigit, A.R.H.; Samo, S.R. Estimation of carbon footprints from diesel generator emissions. In Proceedings of the 2012 International Conference on Green and Ubiquitous Technology, Besancon, France, 20–23 November 2012; IEEE. [Google Scholar] [CrossRef]
  3. Issa, M.; Ibrahim, H.; Hosni, H.; Ilinca, A.; Rezkallah, M. Effects of Low Charge and Environmental Conditions on Diesel Generators Operation. Eng 2020, 1, 137–152. [Google Scholar] [CrossRef]
  4. Yang, L.; Sun, Q.; Zhang, N.; Li, Y. Indirect Multi-Energy Transactions of Energy Internet With Deep Reinforcement Learning Approach. IEEE Trans. Power Syst. 2022, 37, 4067–4077. [Google Scholar] [CrossRef]
  5. Ahmad, L.; Khordehgah, N.; Malinauskaite, J.; Jouhara, H. Recent advances and applications of solar photovoltaics and thermal technologies. Energy 2020, 207, 118254. [Google Scholar] [CrossRef]
  6. Tan, J.D.; Chang, C.C.W.; Bhuiyan, M.A.S.; Minhad, K.N.; Ali, K. Advancements of wind energy conversion systems for low-wind urban environments: A review. Energy Rep. 2022, 8, 3406–3414. [Google Scholar] [CrossRef]
  7. Zhang, N.; Sun, Q.; Yang, L.; Li, Y. Event-Triggered Distributed Hybrid Control Scheme for the Integrated Energy System. IEEE Trans. Ind. Inform. 2022, 18, 835–846. [Google Scholar] [CrossRef]
  8. Aybar-Mejía, M.; Villanueva, J.; Mariano-Hernández, D.; Santos, F.; Molina-García, A. A Review of Low-Voltage Renewable Microgrids: Generation Forecasting and Demand-Side Management Strategies. Electronics 2021, 10, 2093. [Google Scholar] [CrossRef]
  9. Shafiullah, G. Impacts of renewable energy integration into the high voltage (HV) networks. In Proceedings of the 2016 4th International Conference on the Development in the in Renewable Energy Technology (ICDRET), Shenzhen, China, 30–31 December 2016; IEEE. [Google Scholar] [CrossRef]
  10. Zheng, H.; Yuan, X.; Cai, J.; Sun, P.; Zhou, L. Large-Signal Stability Analysis of DC Side of VSC-HVDC System Based on Estimation of Domain of Attraction. IEEE Trans. Power Syst. 2022, 37, 3630–3641. [Google Scholar] [CrossRef]
  11. Surinkaew, T.; Ngamroo, I. Coordinated Robust Control of DFIG Wind Turbine and PSS for Stabilization of Power Oscillations Considering System Uncertainties. IEEE Trans. Sustain. Energy 2014, 5, 823–833. [Google Scholar] [CrossRef]
  12. López, A.R.; Krumm, A.; Schattenhofer, L.; Burandt, T.; Montoya, F.C.; Oberländer, N.; Oei, P.Y. Solar PV generation in Colombia - A qualitative and quantitative approach to analyze the potential of solar energy market. Renew. Energy 2020, 148, 1266–1279. [Google Scholar] [CrossRef]
  13. Montoya, O.D.; Grisales-Noreña, L.F.; Perea-Moreno, A.J. Optimal Investments in PV Sources for Grid-Connected Distribution Networks: An Application of the Discrete–Continuous Genetic Algorithm. Sustainability 2021, 13, 13633. [Google Scholar] [CrossRef]
  14. Saidi, A.S. Impact of grid-tied photovoltaic systems on voltage stability of tunisian distribution networks using dynamic reactive power control. Ain Shams Eng. J. 2022, 13, 101537. [Google Scholar] [CrossRef]
  15. Schultz, H.S.; Carvalho, M. Design, Greenhouse Emissions, and Environmental Payback of a Photovoltaic Solar Energy System. Energies 2022, 15, 6098. [Google Scholar] [CrossRef]
  16. Valencia, A.; Hincapie, R.A.; Gallego, R.A. Optimal location, selection, and operation of battery energy storage systems and renewable distributed generation in medium–low voltage distribution networks. J. Energy Storage 2021, 34, 102158. [Google Scholar] [CrossRef]
  17. Montoya, O.D.; Ramos-Paja, C.A.; Grisales-Noreña, L.F. An Efficient Methodology for Locating and Sizing PV Generators in Radial Distribution Networks Using a Mixed-Integer Conic Relaxation. Mathematics 2022, 10, 2626. [Google Scholar] [CrossRef]
  18. Cortés-Caicedo, B.; Molina-Martin, F.; Grisales-Noreña, L.F.; Montoya, O.D.; Hernández, J.C. Optimal Design of PV Systems in Electrical Distribution Networks by Minimizing the Annual Equivalent Operative Costs through the Discrete-Continuous Vortex Search Algorithm. Sensors 2022, 22, 851. [Google Scholar] [CrossRef]
  19. Pal, P.; Krishnamoorthy, P.A.; Rukmani, D.K.; Antony, S.J.; Ocheme, S.; Subramanian, U.; Elavarasan, R.M.; Das, N.; Hasanien, H.M. Optimal Dispatch Strategy of Virtual Power Plant for Day-Ahead Market Framework. Appl. Sci. 2021, 11, 3814. [Google Scholar] [CrossRef]
  20. NASA. NASA Prediction of Worldwide Energy Resources. Available online: https://power.larc.nasa.gov/ (accessed on 21 September 2022).
  21. Instituto de Planificación y Promoción de Soluciones Energéticas para Zonas No Interconectadas. Informes Mensuales de Telimetría, Colombia. Available online: https://ipse.gov.co/cnm/informe-mensuales-telemetria/ (accessed on 21 September 2022).
  22. XM SA ESP. Sinergox Database, Colombia. Available online: https://sinergox.xm.com.co/Paginas/Home.aspx (accessed on 21 September 2022).
  23. Zagirnyak, M.; Rodkin, D.; Romashykhin, I. The possibilities of Tellegen’s theorem in the identification electrotechnical problems. In Proceedings of the 2017 International Conference on Modern Electrical and Energy Systems (MEES), Kremenchuk, Ukraine, 15–17 November 2017. [Google Scholar] [CrossRef]
  24. El-Sobky, B.; Abo-Elnaga, Y.; Mousa, A.A.A.; El-Shorbagy, M.A. Trust-Region Based Penalty Barrier Algorithm for Constrained Nonlinear Programming Problems: An Application of Design of Minimum Cost Canal Sections. Mathematics 2021, 9, 1551. [Google Scholar] [CrossRef]
  25. Grisales-Noreña, L.F.; Rosales-Mu noz, A.A.; Cortés-Caicedo, B.; Montoya, O.D.; Andrade, F. Optimal Operation of PV Sources in DC Grids for Improving Technical, Economical, and Environmental Conditions by Using Vortex Search Algorithm and a Matrix Hourly Power Flow. Mathematics 2022, 11, 93. [Google Scholar] [CrossRef]
  26. Montoya, O.D.; Gil-González, W. Dynamic active and reactive power compensation in distribution networks with batteries: A day-ahead economic dispatch approach. Comput. Electr. Eng. 2020, 85, 106710. [Google Scholar] [CrossRef]
  27. Naghiloo, A.; Abbaspour, M.; Mohammadi-Ivatloo, B.; Bakhtari, K. GAMS based approach for optimal design and sizing of a pressure retarded osmosis power plant in Bahmanshir river of Iran. Renew. Sustain. Energy Rev. 2015, 52, 1559–1565. [Google Scholar] [CrossRef]
  28. Soroudi, A. Power System Optimization Modeling in GAMS; Springer International Publishing: Berlin/Heidelberg, Germany, 2017. [Google Scholar] [CrossRef]
  29. Montoya, O.D.; Gil-González, W.; Grisales-Noreña, L. An exact MINLP model for optimal location and sizing of DGs in distribution networks: A general algebraic modeling system approach. Ain Shams Eng. J. 2020, 11, 409–418. [Google Scholar] [CrossRef]
  30. Kaur, S.; Kumbhar, G.; Sharma, J. A MINLP technique for optimal placement of multiple DG units in distribution systems. Int. J. Electr. Power Energy Syst. 2014, 63, 609–617. [Google Scholar] [CrossRef]
  31. Tartibu, L.; Sun, B.; Kaunda, M. Multi-objective optimization of the stack of a thermoacoustic engine using GAMS. Appl. Soft Comput. 2015, 28, 30–43. [Google Scholar] [CrossRef]
  32. Skworcow, P.; Paluszczyszyn, D.; Ulanicki, B.; Rudek, R.; Belrain, T. Optimisation of Pump and Valve Schedules in Complex Large-scale Water Distribution Systems Using GAMS Modelling Language. Procedia Eng. 2014, 70, 1566–1574. [Google Scholar] [CrossRef] [Green Version]
  33. Bocanegra, S.Y.; Montoya, O.D.; Molina-Cabrera, A. Parameter estimation in singe-phase transformers employing voltage and current measures (In Spanish). Rev. Uis Ing. 2020, 19, 63–75. [Google Scholar] [CrossRef]
  34. Dubey, S.; Sarvaiya, J.N.; Seshadri, B. Temperature Dependent Photovoltaic (PV) Efficiency and Its Effect on PV Production in the World—A Review. Energy Procedia 2013, 33, 311–321. [Google Scholar] [CrossRef] [Green Version]
  35. Jaya, S.; Vijay, A.S.; Khan, I.; Shukla, A.; Doolla, S. Mode Transition in DC Microgrids with Non-Dispatchable Sources. In Proceedings of the 2021 IEEE Energy Conversion Congress and Exposition (ECCE). IEEE, Vancouver, BC, Canada, 10–14 October 2021. [Google Scholar] [CrossRef]
  36. Ramirez-Vergara, J.; Bosman, L.B.; Leon-Salas, W.D.; Wollega, E. Ambient temperature and solar irradiance forecasting prediction horizon sensitivity analysis. Mach. Learn. Appl. 2021, 6, 100128. [Google Scholar] [CrossRef]
  37. Hassan, Q.; Jaszczur, M.; Przenzak, E.; Abdulateef, J. The PV cell temperature effect on the energy production and module efficiency. Contemp. Probl. Power Eng. Environ. Prot. 2016, 33, 33–40. [Google Scholar]
  38. Schwingshackl, C.; Petitta, M.; Wagner, J.; Belluardo, G.; Moser, D.; Castelli, M.; Zebisch, M.; Tetzlaff, A. Wind Effect on PV Module Temperature: Analysis of Different Techniques for an Accurate Estimation. Energy Procedia 2013, 40, 77–86. [Google Scholar] [CrossRef] [Green Version]
  39. Sistema Único de Información de Servicios Públicos Domicialiarios. Consolidado de Energía por Empresa y Departamento, Colombia. Available online: https://sui.superservicios.gov.co/Reportes-del-sector/Energia/Reportes-comerciales/Consolidado-de-energia-por-empresa-y-departamento (accessed on 21 September 2022).
  40. Sistema Único de Información de Servicios Públicos Domicialiarios. Consolidado de Información Técnica Operativa ZNI, Colombia. Available online: https://sui.superservicios.gov.co/Reportes-del-sector/Energia/Reportes-comerciales/Consolidado-de-informacion-tecnica-operativa-ZNI (accessed on 21 September 2022).
  41. Wang, P.; Wang, W.; Xu, D. Optimal Sizing of Distributed Generations in DC Microgrids With Comprehensive Consideration of System Operation Modes and Operation Targets. IEEE Access 2018, 6, 31129–31140. [Google Scholar] [CrossRef]
  42. XM SA EPS. En Colombia Factor de Emisión de CO2 por Generación eléCtrica del Sistema Interconectado: 164.38 Gramos de CO2 por Kilovatio Hora, Colombia. Available online: https://www.xm.com.co/noticias/en-colombia-factor-de-emision-de-co2-por-generacion-electrica-del-sistema-interconectado (accessed on 21 September 2022).
  43. Academia Colombiana de Ciencias Exactas, Físicas y Naturales. Factores de Emisión de los Combustibles Colombianos, Colombia. 2016. Available online: https://www.scribd.com/document/157258400/18-FECOC-factores-emision-colombia-docx# (accessed on 21 September 2022).
  44. Normas Técnicas y Certificación (ICONTEC). Tensiones y Frecuencia Nominales en Sistemas de Energía Elécrica en Redes de Servicio Público NTC1340; ICONTEC: Bogotá, Colombia, 2004. [Google Scholar]
  45. Baran, M.; Wu, F. Network reconfiguration in distribution systems for loss reduction and load balancing. IEEE Trans. Power Deliv. 1989, 4, 1401–1407. [Google Scholar] [CrossRef]
  46. Falaghi, H.; Ramezani, M.; Haghifam, M.R.; Milani, K. Optimal selection of conductors in radial distribution systems with time varying load. In Proceedings of the 18th International Conference and Exhibition on Electricity Distribution (CIRED 2005), Turin, Italy, 6–9 June 2005. [Google Scholar] [CrossRef] [Green Version]
  47. Eberhart, R.; Kennedy, J. Particle swarm optimization. In Proceedings of the IEEE International Conference on Neural Networks, Perth, WA, Australia, 27 November–1 December 1995; Citeseer: Piscataway, NJ, USA, 1995; Volume 4, pp. 1942–1948. [Google Scholar]
  48. Chu, P.C.; Beasley, J.E. A genetic algorithm for the multidimensional knapsack problem. J. Heuristics 1998, 4, 63–86. [Google Scholar] [CrossRef]
  49. Doğan, B.; Ölmez, T. A new metaheuristic for numerical function optimization: Vortex Search algorithm. Inf. Sci. 2015, 293, 125–145. [Google Scholar] [CrossRef]
  50. Mirjalili, S. The ant lion optimizer. Adv. Eng. Softw. 2015, 83, 80–98. [Google Scholar] [CrossRef]
  51. Wicaksana, M.G.S.; Putranto, L.M.; Waskito, F.; Yasirroni, M. Optimal placement and sizing of PV as DG for losses minimization using PSO algorithm: A case in Purworejo area. In Proceedings of the 2020 International Conference on Sustainable Energy Engineering and Application (ICSEEA), Online, 18–20 November 2020; pp. 1–6. [Google Scholar]
  52. KS, G.D. Hybrid genetic algorithm and particle swarm optimization algorithm for optimal power flow in power system. J. Comput. Mech. Power Syst. Control 2019, 2, 31–37. [Google Scholar]
  53. Ramavath, D.; Sharma, M. Optimal Power Flow Using Modified ALO. In Proceedings of the 2020 International Conference on Renewable Energy Integration into Smart Grids: A Multidisciplinary Approach to Technology Modelling and Simulation (ICREISG), Bhubaneshwar, India, 14–15 February 2020; pp. 84–89. [Google Scholar]
Figure 1. Main aspects of the proposed solution methodology.
Mathematics 11 00484 g001
Figure 2. General steps for implementing an NLP model in the GAMS software.
Mathematics 11 00484 g002
Figure 3. Expected generation profiles for Medellín and Capurganá, Colombia.
Mathematics 11 00484 g003
Figure 4. Expected energy consumption profiles for Medellín and Capurganá, Colombia.
Mathematics 11 00484 g004
Figure 5. Proposed configuration of the IEEE 33-bus grid for simulating the operation scenario in the city of Medellín.
Mathematics 11 00484 g005
Figure 6. Proposed configuration of the 27-bus grid to simulate the operation scenario in the municipality of Capurganá.
Mathematics 11 00484 g006
Figure 7. Reduction percentage regarding the objective functions in the IEEE 33-bus system.
Mathematics 11 00484 g007
Figure 8. Reduction percentage regarding the objective functions in the IEEE 27-bus system.
Mathematics 11 00484 g008
Table 1. Parametric information regarding PV generation sources.
ParameterValueUnitParameterValueUnit
P i p v 1W f p v 0.95-
G i T , S T C 1000W/m2 α p −0.00451/°C
T i c , S T C 25°C T i c , N O C T 46°C
G i T , N O C T 800W/m2 T i a , N O C T 20°C
η i c 0.141- τ α 0.9-
Table 2. Solar radiation data (W/m2), ambient temperature (°C), and behavior (p.u.) for an average day in the regions under study.
RegionMedellínCapurganá
Hour G T T a C pv G T T a C pv
1016.141320024.442520
2015.906360024.324740
3015.681320024.225450
4015.460220024.146740
5015.275450024.084220
6015.103290024.034820
746.0242515.157180.0454129.1457024.103670.02770
8190.8355916.156360.18424142.1106624.781260.13277
9362.8375317.438680.34100291.6192625.682110.26622
10526.6464718.873120.48161431.9538426.636710.38547
11640.9905820.274380.57375540.6158127.475150.47362
12709.0531221.363420.62572605.1636228.102520.52397
13701.8637021.987210.61809606.9302728.467750.52442
14626.8269022.121070.55716583.0747928.569230.50519
15499.8607421.830710.45236490.5590428.423340.43065
16346.2658121.203510.32052359.2203328.034600.32148
17186.6667120.386680.17693204.4877527.449450.18722
1852.3340319.359510.0506664.5177526.690080.06034
190.5098618.322580.000503.1746025.890160.00300
20017.724140025.392270
21017.295860025.092850
22016.961480024.876630
23016.673950024.708410
24016.405450024.569260
Table 3. Power consumption data (kW) and behavior (p.u.) for an average day in the regions under study.
RegionMedellínCapurganá
Hour P d P d , pu P d P d , pu
11,012,876.200.65509428.041170.84573
2974,315.400.63015409.767170.80962
3951,768.010.61557317.816540.62795
4952,169.920.61583256.706480.50720
5996,601.970.6445751.708640.10217
61,080,667.800.6989411.058350.02185
71,135,234.910.7342332.495530.06421
81,226,850.930.7934862.774910.12403
91,303,895.330.84331119.173810.23547
101,354,781.010.87622281.260570.55572
111,417,860.030.91702333.094290.65813
121,462,589.110.94595358.360760.70805
131,459,381.620.94388368.011400.72712
141,439,889.280.93127369.709170.73048
151,430,823.700.92541379.979010.75077
161,426,481.640.92260388.654780.76791
171,404,019.240.90807386.783650.76421
181,373,896.430.88859395.192660.78083
191,463,002.740.94622430.881770.85134
201,478,398.440.95618464.616700.91800
211,415,579.310.91555476.403130.94128
221,310,824.080.84779473.674620.93589
231,187,930.280.76831467.292810.92328
241,086,900.380.70297452.185900.89344
Table 4. Parameters to evaluate the objective function in the proposed NLP formulation.
ParameterValueUnitParameterValueUnit
C k W h U r b a n 0.1302USD/kWh C E s U r b a n 0.1644kg/kWh
C k W h R u r a l 0.2913USD/kWh C E s R u r a l 0.2671kg/kWh
C O & M p v 0.0019USD/kWh---
Table 5. Information regarding the peak load conditions, impedance parameters, and current bounds of the IEEE 33-bus grid.
Line lNode iNode j R ij ( Ω ) X ij ( Ω ) P j (kW) Q j (kvar) I l max (A)
1120.09220.047710060385
2230.49300.25119040355
3340.36600.186412080240
4450.38110.19416030240
5560.81900.70706020240
6670.18720.6188200100110
7781.71141.235120010085
8891.03000.7400602070
99101.04000.7400602070
1010110.19660.0650453055
1111120.37440.1238603555
1212131.46801.1550603555
1313140.54160.71291208040
1414150.59100.5260601025
1515160.74630.5450602020
1616171.28901.7210602020
1717180.73200.5740904020
182190.16400.1565904040
1919201.50421.3554904025
2020210.40950.4784904020
2121220.70890.9373904020
223230.45120.3083905085
2323240.89800.709142020085
2424250.89600.701142020040
256260.20300.10346025125
2626270.28420.14476025110
2727281.05900.93376020110
2828290.80420.700612070110
2929300.50750.258520060095
3030310.97440.96301507055
3131320.31050.361921010030
3232330.34100.5302604020
Table 6. Information regarding peak load conditions, impedance parameters, and current bounds for the 27-bus grid.
Line lNode iNode j R ij ( Ω ) X ij ( Ω ) P j (kW) Q j (kvar) I l max (A)
1120.01400.605100240
2230.74631.078300165
3340.40520.5855297.50184.3795
4451.15241.66500085
5560.52610.7601255.00158.0370
6670.71271.02960055
7781.66282.4024212.50131.7055
8895.34343.13200020
99102.15221.2615266.05164.8820
102110.40520.585585.0052.6870
1111121.15241.6650340210.7170
1212130.52610.7601297.50184.3755
1313141.23581.1332191.25118.5330
1414152.88352.6440106.2565.8520
1515165.34343.1320255.00158.0320
163171.29421.1867255.00158.0370
1717180.70270.6443127.5079.0255
1818193.32341.9480297.50184.3740
1919201.51720.8893340210.7125
2020210.71271.029685.0052.6820
214228.25282.9911106.2565.8520
225239.19613.333055.2534.2420
236240.74631.078369.7043.2020
248252.01120.7289255.00158.0320
258263.32341.948063.7539.5120
2626270.52610.7601170105.3620
Table 7. Numerical results in the 33-bus system for the urban zone.
Method f 1 (USD) f 2 (kWh) f 3 (kg CO2)Proc. Time f 1 (s)Proc. Time f 2 (s)Proc. Time f 3 (s)
Bench. Case9931.663379.0712,541.22---
CBGA7409.252346.009309.572.62582.60542.6236
PSO7317.892332.059198.2731.403531.998030.0664
VSA7276.052331.619152.0542.471037.980143.9550
ALO7220.092331.519068.94141.9966140.1495140.5316
SNOPT7219.932331.489068.750.34500.31800.2830
Table 8. Numerical results in the 27-bus system for the rural zone.
Method f 1 (USD) f 2 (kWh) f 3 (kg CO2)Proc. Time f 1 (s)Proc. Time f 2 (s)Proc. Time f 3 (s)
Bench. Case18,543.84691.1517,005.21---
CBGA12,282.02559.5111,192.671.80661.83111.8213
PSO12,104.61558.2811,064.7221.893427.80421.0702
VSA12,052.94558.2211,023.5130.730330.288130.4519
ALO12,022.40558.2010,985.75125.9021126.5206131.3081
SNOPT12,022.34558.2010,985.710.29900.28500.2410
Disclaimer/Publisher’s Note: The statements, opinions and data contained in all publications are solely those of the individual author(s) and contributor(s) and not of MDPI and/or the editor(s). MDPI and/or the editor(s) disclaim responsibility for any injury to people or property resulting from any ideas, methods, instructions or products referred to in the content.

