1. Introduction
In recent years, in order to preserve the ecological balance of different channels and prevent vicious online and offline competition, traditional manufacturers regard some products as “e-commerce exclusive” products, such as some household appliances and special handicrafts in Amazon and Taobao. These products are only available on online platforms and have subtle quality differences from offline products that are hard to perceive by consumers. In terms of pricing methods, the products in the offline market adopt a unified pricing method, while the online platform adopts personalized pricing. Online platforms can obtain, store and analyze the information of terminal via an app. They also utilize digital portrait technology to identify customers’ preferences and willingness to pay, promote product matching between manufacturers and consumers, and provide personalized pricing which improves the transaction efficiency and market service value [
1]. However, the personalized service of online platforms for “e-commerce exclusive” products may exert a negative impact on the market. For example, the platform attracts consumers and manufacturers to settle in through non-discriminatory subsidies, causing some inferior products to flood the market and boosting the trend of “consumption degradation” in the market; this damages the healthy development of the platform ecosystem.
Therefore, determining how to achieve the platform service value and better establish a benign market for “e-commerce exclusive” products has received considerable attention. A key point regarding how the platform shapes a benign market is the way in which it guides heterogeneous consumers to buy high-quality products and encourages manufacturers to enhance product quality. The related literature focuses on how to use consumer privacy information to characterize consumer types, correspond these demand types to the supply side, and provide personalized services for two-sided users to match supply and demand [
2,
3,
4]. In the whole service process of the platform, platform revenue management, such as price discrimination based on consumer behavior, is also a practical problem [
5,
6,
7,
8]. In addition, it is advised that platforms consider optimizing the market competition structure [
9,
10]. In the existing literature on platform market segmentation and market subsidy strategy, the majority of research focuses on optimizing the platform competition structure [
11,
12], service subsidies for specific markets [
13,
14,
15] and improving the profit of cooperative manufacturers and consumer surplus [
14]. Despite the feasibility of optimizing the platform strategy and structure based on consumer information, we believe that some subsidy strategies lead to inefficiency. The micro-market segmentation around the platform service value is not obvious, and this may cause the platform’s ambiguous market strategies. For example, the non-differentiated subsidy triggers consumers’ “get the best deal” behavior and does not really guide the benign consumption of consumers; as such, a lemon market still exists. Therefore, it is not only the impact of heterogeneous consumers that needs to be studied, but also the impact of the platform service value. Specifically, we address the following research questions: (1) what are the distinctive attributes of benchmark markets and platform markets? (2) Considering the service value of the platform, how do high-quality and low-quality manufacturers offer prices for heterogeneous consumers? (3) Under what circumstances will benign markets and non-benign markets exist after the pricing is completed? (4) How does the proportion of consumers with a preference for low-quality products affect the platform revenue, manufacturer profit and consumer surplus? (5) How are consumers with a preference for low-quality products guided to buy high-quality products and upgrading their consumption?
To solve these problems, we establish a vertical differentiation duopoly competition model. Here, two manufacturers that produce products of different quality engage in simultaneous price competition. There are heterogeneous consumers in the market, that is, they have distinct preferences for high and low quality. In the platform market, with the participation of the platform as an intermediary, manufacturers can obtain consumer information and execute personalized pricing. We find that the difference between the platform service value and product quality cost will affect the result of the competitive game; therefore, we solve the game model in two aspects.
The structure of this paper is as follows: In the second part, we review the relevant studies on the types of consumer information disclosure, and the platform market services. In the third part, we present the vertical differentiation model of manufacturers considering the platform service value. In the fourth part, we demonstrate the equilibrium solution and analysis of the model. In the fifth part, we further present a sensitivity analysis of the impact of the platform service value on the platform and the manufacturers. We provide the implications of our work in the sixth part and give our conclusion in the last part.
2. Literature Review
At present, academic studies have different opinions on personalized service for “e-commerce exclusive” products in the platform market. It is well known that platforms gather the “portrait” of each consumer by collecting consumers’ privacy data, including their geographical location, age, preferences, consumption habits, economic ability and other information [
16]. Additionally, platforms help manufacturers push products/services and set differentiated prices for different consumers; this seems to arouse two effects. Firstly, platforms collecting and using data to implement personalized services, such as targeted advertising, product and service innovation, personalized matching pricing, etc., are likely to reduce the transaction cost of searching and matching, and therefore improve consumer surplus [
17,
18,
19]. Secondly, the selective disclosure of transaction information by platforms may spark online fraud, triggering certain moral and legal risks, and thereby reducing consumers’ welfare [
2,
20,
21]. For example, due to the lack of a physical perception of online products, consumers tend to perform herd behavior under the guidance of price information. Consequently, their original quality preferences may change and “cheap goods” may meet their taste, which may be detrimental to product upgrading in the consumer market. For sellers, platforms with a personalized service also have negative effects on the seller’s market. This is because, if consumers purchase products with a lower quality or utility due to the personalized recommendation service of the platform, or if the income of low-quality manufacturers is higher compared with high-quality manufacturers, the notion that “bad money drives out good money” may form; subsequently, the platform market would likely evolve into a lemon market, and this would eventually be a detriment to social welfare [
22]. The opposite of the lemon market is the benign market. The benign consumption market is regarded as the market in which the increase in the platform revenue is in accordance with the situation that means that the high-quality manufacturer H gains more revenue than the low-quality manufacturer L. Meanwhile, the non-benign consumption market (lemon market) means that the revenue of the high-quality manufacturer H is lower than that of the low-quality manufacturer L [
22].
Our goal is to build a benign market on the platform. At present, the relevant literature focuses on the role of manufacturers in the general market. There are mainly two streams in the literature; these include the personalized pricing of manufacturers to consumers and the active disclosure of product-related information by manufacturers.
Most of the literature agrees that it is feasible to optimize the platform structure and strategy based on consumer information [
23,
24,
25]. With the rapid development of digital technology, platforms typically and efficiently provide various services, such as targeted advertising, consumption matching pricing and live-streaming sales to manufacturers. The platform service value derives from the accumulation of basic consumer behavior information. Based on the consumer privacy disclosure [
15,
21,
26,
27,
28], using product preference [
29,
30] and other behavioral factors, the platform can provide personalized pricing and information service strategies for manufacturers. The personalized service that grounds the collection of consumers’ private information, and the use of applications for profiling technology, can accurately identify the type of consumer preference, match the supply and demand, and achieve cost reduction and an increase in efficiency [
1,
31]. However, it seems that scholars haven’t reached an agreement with respect to the effectiveness of utilizing personalized practice to form a benign market. Zeng and Zhang reveal that most consumers in the market fail to accurately identify the product quality and may be misled by low-quality manufacturersn which may result in an unhealthy market [
32,
33]. In addition, some work propounds that a personalized service and pricing will stimulate price competition, damage product differentiation, and make consumers more easily to be confused by low-quality products;, which also prevents the development of a benign market. For instance, Choudhary et al. (2005) believe that personalized pricing not only expands the market coverage, but also intensifies price competition among enterprises [
34]. Zhang (2011) illustrates that, considering manufacturers make use of consumer preference information, personalization, on consumer behavior and price discrimination, will bring similar effects; that is, both will intensify price competition among manufacturers and damage product differentiation [
5]. On the contrary, some studies argue that personalized practice contributes to the creation of a benign market. Ghose and Huang (2009) study the influence of personalized pricing and quality allocation (PPQ) on competition, and show that using PPQ can reduce information asymmetry, enabling manufacturers to provide higher quality products [
35]. Furthermore, scholars have demonstrated that personalized pricing increases total welfare. Esteves and Resende (2019) found that under personalized pricing, all segmented consumers will pay a higher average price. However, counter-intuitively, personalized strategy improves the total welfare [
36]. A key message from these studies is that the effectiveness of personalized practice is ambiguous, and that most relevant studies focus on the impact of personalized practice that is provided by the platform and is upon manufacturers’ income or market competition; meanwhile, little literature focuses on its role in guiding consumers to upgrade their consumption. Our research attempts to clarify the effectiveness of a personalized service, and on this basis, aims to explore how consumers can be guided effectively to buy high-quality products and form a benign market.
Our study is also relevant to the literature on the proactive disclosure of product information by manufacturers. Zhang et al. (2018) found that the information tools developed by the platform greatly promote the disclosure of the seller’s information, which helps consumers recognize high-quality products. However, they also acknowledge that the optimal information strategy of the platform is given in the disclosure cost and product characteristics [
37]. Bergemann and Bonatti (2015) believe that, whether the information in the market is abundant or not, the behavior of the platform selling information will lead to a cost increase in the market; this is because manufacturers will pay certain information rents [
38]. Due to the high price that manufacturers need to pay to disclose more information, in order to make it easier for consumers to identify high-quality products, it is hard for manufacturers to actively disclose information, thus an alternative method is needed to guide consumers to buy quality products.
In summary, the existing literature mostly discusses how to use manufacturers’ practices, such as personalized pricing and active information disclosure, to guide consumers to purchase high-quality products. However, the effectiveness of the former needs to be investigated, while the feasibility of the latter is relatively low. Therefore, our work contributes to the existing literature by highlighting the guiding role of the platform in creating an efficient market operation mode. If only the profits of consumers and platforms are considered, as long as the privacy cost is low, the platform services can fully cover the market and the platform can disclose consumer information to the greatest extent, which achieves the best welfare [
17]. Because the direct conflict of interests between manufacturers and consumers lead to the inaccuracy of market information, it is necessary to give full play to the service value of the platform, thus better promoting the stability and far-reaching nature of the platform economy. Within the context of anti-monopoly development, how to use consumer information and establish a healthy two-sided market supply and demand relationship has become an important topic at present. There have been multiple measures offered to address this issue, such as innovative subsidies [
39], the layered design of the platform [
40,
41], combating counterfeit goods [
42], digital technology and platform ecological construction [
43,
44], etc. However, the literature seldom considers the heterogeneity of consumer demand and supply, or explores the platform’s subsidy strategy to guide consumers and improve the quality of manufacturers’ products. More specifically, there is still room to fill in the effects of the platform service value on guiding consumer market segmentation and decision-making, in regard to quality, of the supply-side manufacturers, and we provide new insights into this issue. This paper considers heterogeneous consumer preferences and explores the impact of the change in the platform service value on consumers and manufacturers, based on consumer types; this paper also establishes the model framework, considering the benchmark market and the platform market, combined with the platform service value. Further, we reveal how the platform maintains a benign situation via formulating appropriate subsidy strategies, according to the change in consumer demand types and manufacturers’ revenues.
3. Problem Description and Model
Consider two competitors, H and L, in the traditional benchmark market, who offer products of varying quality. Without online platforms, manufacturers fail to characterize consumers in the whole market, so only unified prices based on product quality and cost can be offered by the manufacturers. Consumers have heterogeneous preferences for product quality and we assume that there are low-quality demand consumers and high-quality demand consumers in the market.
Relative to the benchmark market, platform markets master the information of manufacturers and consumers, and can bring a greater service value to consumers and manufacturers. Through a platform service, manufacturers can better learn about the types of consumer demand and implement personalized pricing for consumers. Additionally, platforms provide personalized services for consumers, such as personalized recommendations and search-matching convenience. It is commonly assumed that the service value is an endogenous decision of the platform that can directly affect the utility of consumers.
The description of the main parameters in the model is shown in Nomenclature.
3.1. Consumer Utility
There are two kinds of consumer in two markets: the benchmark market (anonymous market) and the platform market (personalized service market). In both markets, consumers are rational and in equal amounts. In addition, the two markets have the same distribution of consumers. It is assumed that each consumer in each market only buys a one unit product in their own market, and the two markets are independent of each other.
Since the platform personalized service is unavailable in the benchmark market, consumers’ information is scattered, resulting in manufacturers failing to obtain consumers’ willingness to pay ,. In this case, it is assumed that the consumer’s surplus can be negative due to the lack of product quality awareness. For example, when the low-quality products are bought at a high price.
In the platform market, the platform has the advantage of information technology, which can be used to characterize the two types of consumers through their private information, and make deals with manufacturers through personalized services. Therefore, according to different trading channels, unified pricing and personalized pricing strategies are adopted, respectively, which is why consumers in different markets have different utilities, these are primarily reflected by the personalized service value of the platform.
Therefore, consumer utility is:
3.2. Manufacturer’s Profit
There are two kinds of manufacturers offering different quality products,
and
, respectively, and the quality gap of products is denoted as
. To facilitate our analysis, let the fixed cost of high-quality manufacturer
H be
c, and that of the low-quality manufacturer
L be zero. According to Choudhary (2005), in order to make the quality improvement of manufacturers profitable, we set
[
34]. We also assume that the two markets are entirely covered by products from two types of manufacturers [
45].
In the benchmark market, it is assumed that consumers’ quality demand and willingness to pay are unknown, i.e., only quality and price competition between manufacturers H and L for consumers with heterogeneous demand exist. Therefore, manufacturers H and L adopt unified pricing for products, according to product quality and cost, and there is no platform-based personalized service in this case.
While in the platform market, the platform can implement a personalized service for manufacturers and consumers, and differentiated pricing by manufacturers H and L is available. In this case, the platform can extract a commission level from the transaction between the manufacturers and consumers.
Hence, we obtain two profit functions in these two cases as follows:
3.3. Platform Revenue
In the platform market, different types of consumers can be accurately recognized by the platform. The platform’s revenue depends on the market transaction commission from manufacturers
H and
L, and we assume that the commission level for each manufacturer is the same. Considering the service value of the platform to consumers and manufacturers, the commission level of the platform is denoted as
, where
is the service conversion efficiency of the platform (
) and
is the fixed service cost of the platform; as such, the revenue function of the platform is:
3.4. Game Sequence
Manufacturers H and L compete in the benchmark market and platform market, and the game sequence is as follows.
In the benchmark market, as shown in
Figure 1, manufacturers
H and
L first decide price, respectively, according to their competitor’s quality and cost, i.e.,
and
. After the consumers observe the prices of the manufacturers’ products, they choose products according to utility.
Meanwhile, in the platform market, as shown in
Figure 2, the platform first observes the distribution of marginal consumer type
x and determines the market service value
, as well as the commission level
, before manufacturers make decisions. Then, the manufacturers,
H and
L, simultaneously decide the product price and quality, according to the service value
and commission level
of the platform, i.e., (
,
) and (
,
). Lastly, heterogeneous consumers determine which product to purchase. We solve the equilibrium of the game by backward induction.
4. Market Equilibrium Analysis
4.1. Benchmark Market
In the benchmark market, transactions between consumers and manufacturers arise offline. Since a platform intermediary is unavailable, manufacturers fail to obtain consumers’ privacy data, and the consumers’ willingness to pay is unknown. As a consequence, manufacturers only need to set a uniformed price according to their product quality, i.e.,
and
. Let the consumer utility functions of purchasing high-quality and low-quality products be equal, i.e.,
, and we obtain the marginal consumer type as follows:
The profit functions of manufacturers
H and
L, respectively, are:
We substitute the marginal consumer types in (4) into Equation (5), and according to the first-order condition and , the manufacturers’ unified prices are obtained, i.e., and . In addition, we obtain an equilibrium point in the consumer type, i.e., .
In the benchmark market, the consumer surplus of high-quality and low-quality products is, respectively:
Since some consumers purchase low-quality products from manufacturer
L, which will cause some deadweight loss (
DWL):
Hence, the profits of high-quality and low-quality manufacturers,
H and
L, in the benchmark market are:
The following proposition shows the manufacturers’ profit comparison and competition.
Proposition 1. In the benchmark market, when ,; meanwhile, when,. Therefore, in the benchmark market, the competition between the manufacturers, H and L, mainly derives from the product quality and cost. In addition, manufacturers adopt a unified pricing strategy in the benchmark market to achieve equilibrium. The following corollary shows the two types of consumer surplus.
Corollary 1. Under the unified pricing of the benchmark market, when ,; meanwhile, when ,.
Proposition 1 indicates that, in the benchmark market, as the product quality cost difference changes, the income of the high-quality manufacturer,
H, is not necessarily higher than the low-quality manufacturer,
L. Therefore, the market does not necessarily incentivize high-quality products. Corollary 1 confirms that it is possible for manufacturers to utilize consumer data analysis and provide them with reserved prices, i.e., the highest price that each consumer is willing to pay according to consumer preferences and their existing income [
46]. Additionally, when price discrimination is “ Progressive”, it is more ethical than single pricing [
47].
4.2. Platform Market
In the platform market, it is assumed that there is a data contract between the platform and consumers, i.e., the platform collects and uses consumer data information for the purpose of providing personalized services. Since disclosing information will benefit consumers to some extent, all consumers who enter the platform are willing to disclose personal information, such as personal behavior preferences, so that the different types of consumer in the whole market are recognized.
Consequently, there is competition between high-quality and low-quality manufacturers, focusing on the consumers in the platform market, in which the platform helps manufacturers to provide personalized pricing services for products of different quality. Therefore, the utility of heterogeneous consumers in the platform is , , in which is the service value of the platform and is assumed endogenous decided by the platform. Let the utility of consumers with high-quality and low-quality demands be equal, i.e., , and the marginal type of consumers’ quality demands in the platform market can be obtained as , .
Since consumer type is obtained by manufacturers through the platform’s service, the manufacturer adopts the reserved pricing based on the consumer type, i.e., . As such, the personalized price that manufacturers set is , .
The profit functions of manufacturers
H and
L in the platform market are, respectively, obtained:
By substituting the personalized price into the manufacturers’ profit functions, we can obtain:
Let and , we have:
Manufacturer H takes the maximum platform market consumer type, while manufacturer L takes the minimum platform market consumer type, i.e., , .
Let , we can obtain .
The profit of the platform is:
Obviously, if the high-quality manufacturer,
H, and the low-quality manufacturer,
L, join the platform, the revenue of the platform depends on the commission level. In addition, when considering that the commission level of the platform depends on the platform’s service value,
is denoted as the efficiency of the platform commission. Substituting
into
, we can obtain the simplified
:
Proposition 1 and Corollary 1 show that the platform service value will affect the competitive result between manufacturer H and manufacturer L. In the past, the product quality cost plays a first-order role in manufacturers’ competition. After introducing a platform service, the competition among manufacturers depends on the platform service value and the product quality cost difference. Hence, we discuss two cases concerning these two factors, as follows.
4.2.1. When the Platform Service Value Is Lower than the Quality Cost Difference of Products
Given the platform service value, as the types of consumers in the platform change, the profits of the platform, and manufacturer H and manufacturer L in the market, will change accordingly. The following proposition shows this change.
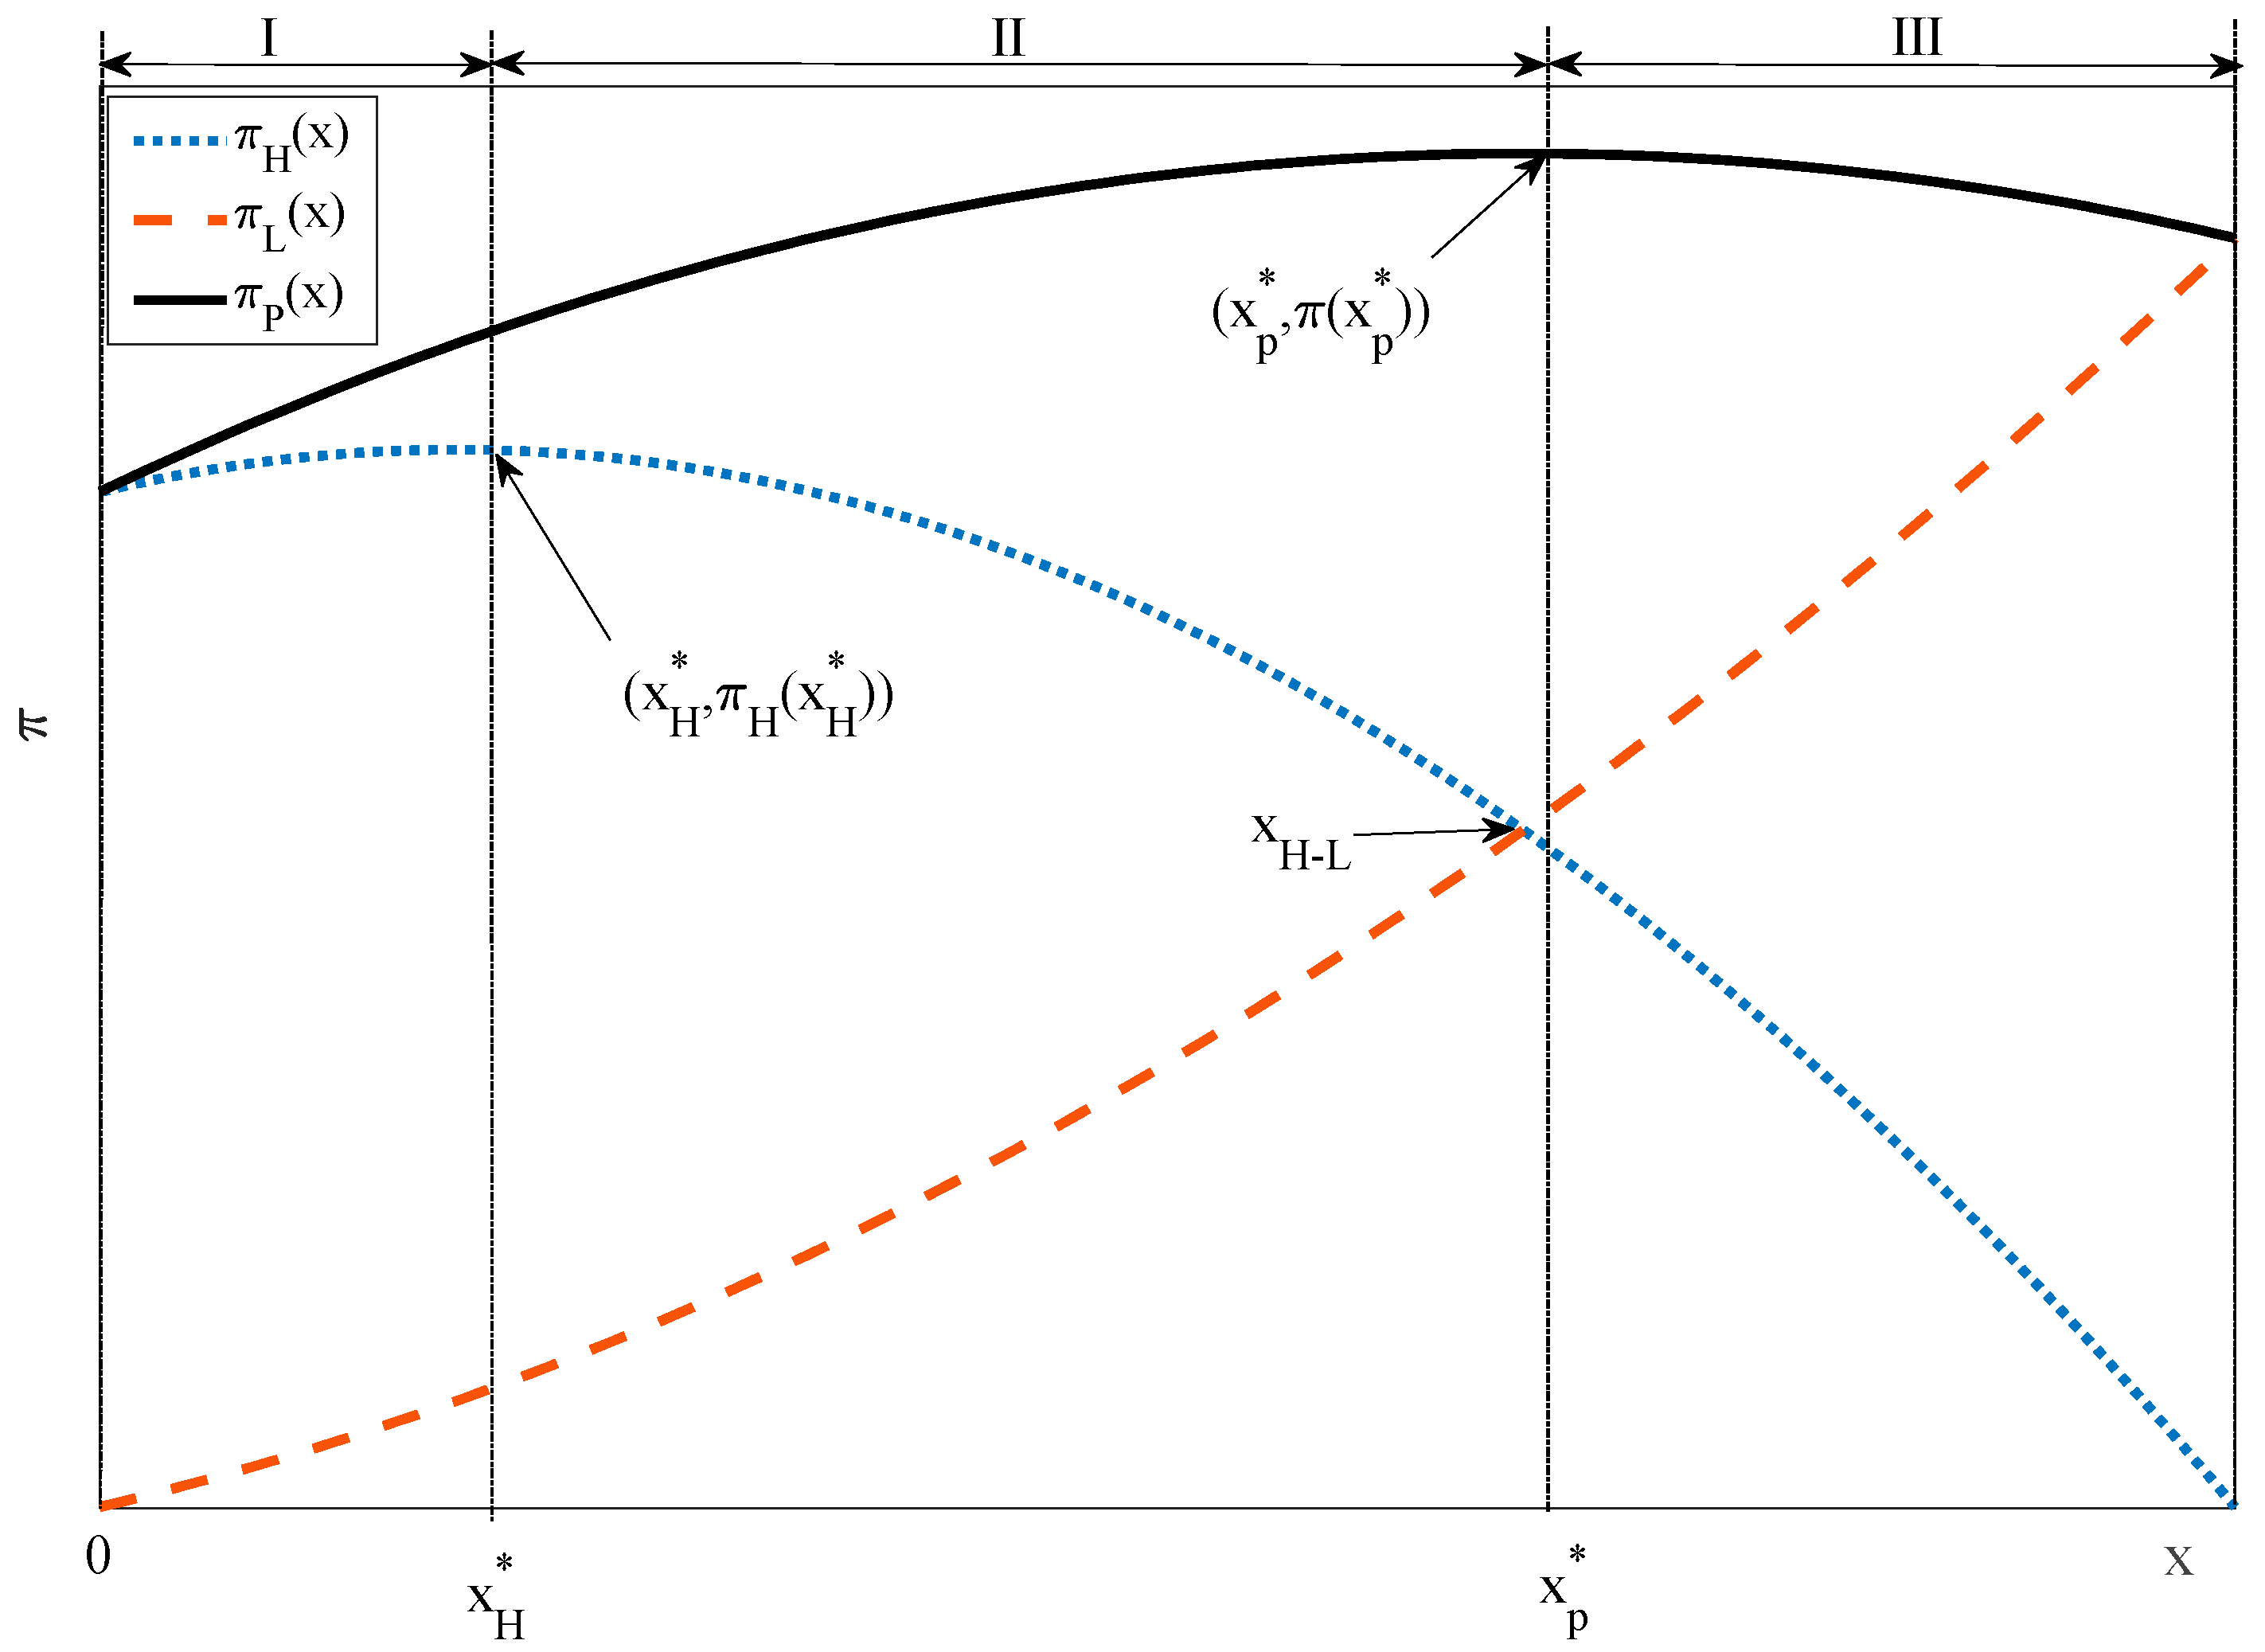
Proposition 2. When the service value of the platform is less than the quality cost difference in the product, i.e., when , the manufacturer L will make a non-negative profit in the platform market. If , both manufacturers H and L can obtain positive benefits in the platform market. In addition, when the type of consumer in the platform is located at , i.e., , the platform revenue will reach a maximum; when , manufacturer H will make great gains in the platform market; when , it is manufacturer L that makes great gains in the platform market.
Proof. Considering the case that makes it profitable for manufacturers
H and
L to join the platform market, the boundary conditions of the consumer type are given by:
The condition and in (13) ensure that manufacturer H and L gain a non-negative profit, respectively. When , i.e., it obviously ensures that manufacturer H can obtain positive returns in the platform market. The consumers located at in the platform will choose manufacturer H’ s product, allowing manufacturer H to obtain non-negative benefits in the platform market. Within the consumer boundary of the platform market, i.e., , both manufacturer H and L account for a certain market share and obtain positive revenues in the platform market.
By taking a partial derivative of the manufacturers’ profits in (10), with respect to and , we can obtain , , , , and . According to the Hessian matrix, when , we can know that . In addition, when , and when , , indicating that when , manufacturer H will attain the highest profit. Similarly, when and , it is easy to obtain , so that manufacturer L will benefit most at .
Additionally, by taking a partial derivative of the platform’s profit in (11), with respect to and , we can know that , , , and . Since we assume , which assures that product quality difference is more than product cost difference, we can further prove Proposition 2.
When , according to the Hessian matrix, let . Obviously, is a negative matrix and when , ; meanwhile, when , . Consequently, it is when that the platform revenue reaches a maximum. □
From our analysis above, it is quite clear, that when the proportion of consumers with different quality demands changes, the profits of the three parties will also change. We next define different market scenarios concerning the composition of consumers and the revenues of three parties as the following:
Definition 1. Benign Consumption Market is regarded as the market in which the revenue of the platform will enhance, and the high-quality manufacturer, H, gains more revenue than the low-quality manufacturer, L, with the proportion of consumers who have a low product-quality preference. General Market refers to a market in which the platform’s revenue is uncertain, depending on service value and the difference in product quality. Non-benign Consumption Market means that the revenue of high-quality manufacturer H is lower than that of low-quality manufacturer L in this scenario. In the second-hand commodity market, this phenomenon is known as “Lemon Market” [22].
Corollary 2. Based on the nature of the revenue function, the platform market will change with the share of consumers who have low product-quality demand. Hence, there are three market scenarios, as follows:
- (1)
In the benign consumption market of platform I, the consumers with low-quality demand account for a minority, but with the increase in consumers with low-quality product demand, the revenue of the three parties will all enhance. This result shows that, even when all the consumers enjoy a high product quality preference, i.e.,, it is not necessary that manufacturer H makes the highest profit. This is because, when the consumers prefer high-quality products, the revenue of manufacturer H may still decline due to imperfect platform services or the high-quality cost of products, i.e.,is low andis high. While owing to the cost advantage, the market share of low-quality manufacturer L may increase, which raises its profitability.
- (2)
In the general market of platform II, with the increase in consumers in demand for low-quality products, the revenue of manufacturer H will slump, while the profit of the manufacturer L and platform will increase. In addition, the profit gap between manufacturer H and L will surge with the amount of consumers with low-quality product demand. Additionally, as shown in Figure 3, there exists a thresholdthat enables manufacturer H to achieve the optimal revenue. There also exists another threshold that enables the revenue of the platform to reach a maximum. - (3)
In the non-benign consumption market of platform III, with the increase in consumers chasing low-quality products, the revenues of both platform and manufacturer H will decrease; however, manufacturer L still enjoys an increase in profit. What is worse is that the revenue of manufacturer H is lower than manufacturer L’ s, as the demand of low-quality products increases, i.e.,. Therefore, the inferior manufacturers may expel excellent manufacturers, which is a detriment to the sound development of the product market. In this scenario, the platform can adopt a differentiated service strategy [23], and utilize freight insurance to guide consumers to purchase high-quality products [13].
Table 1 summarizes three market scenarios in equilibrium, as follows:
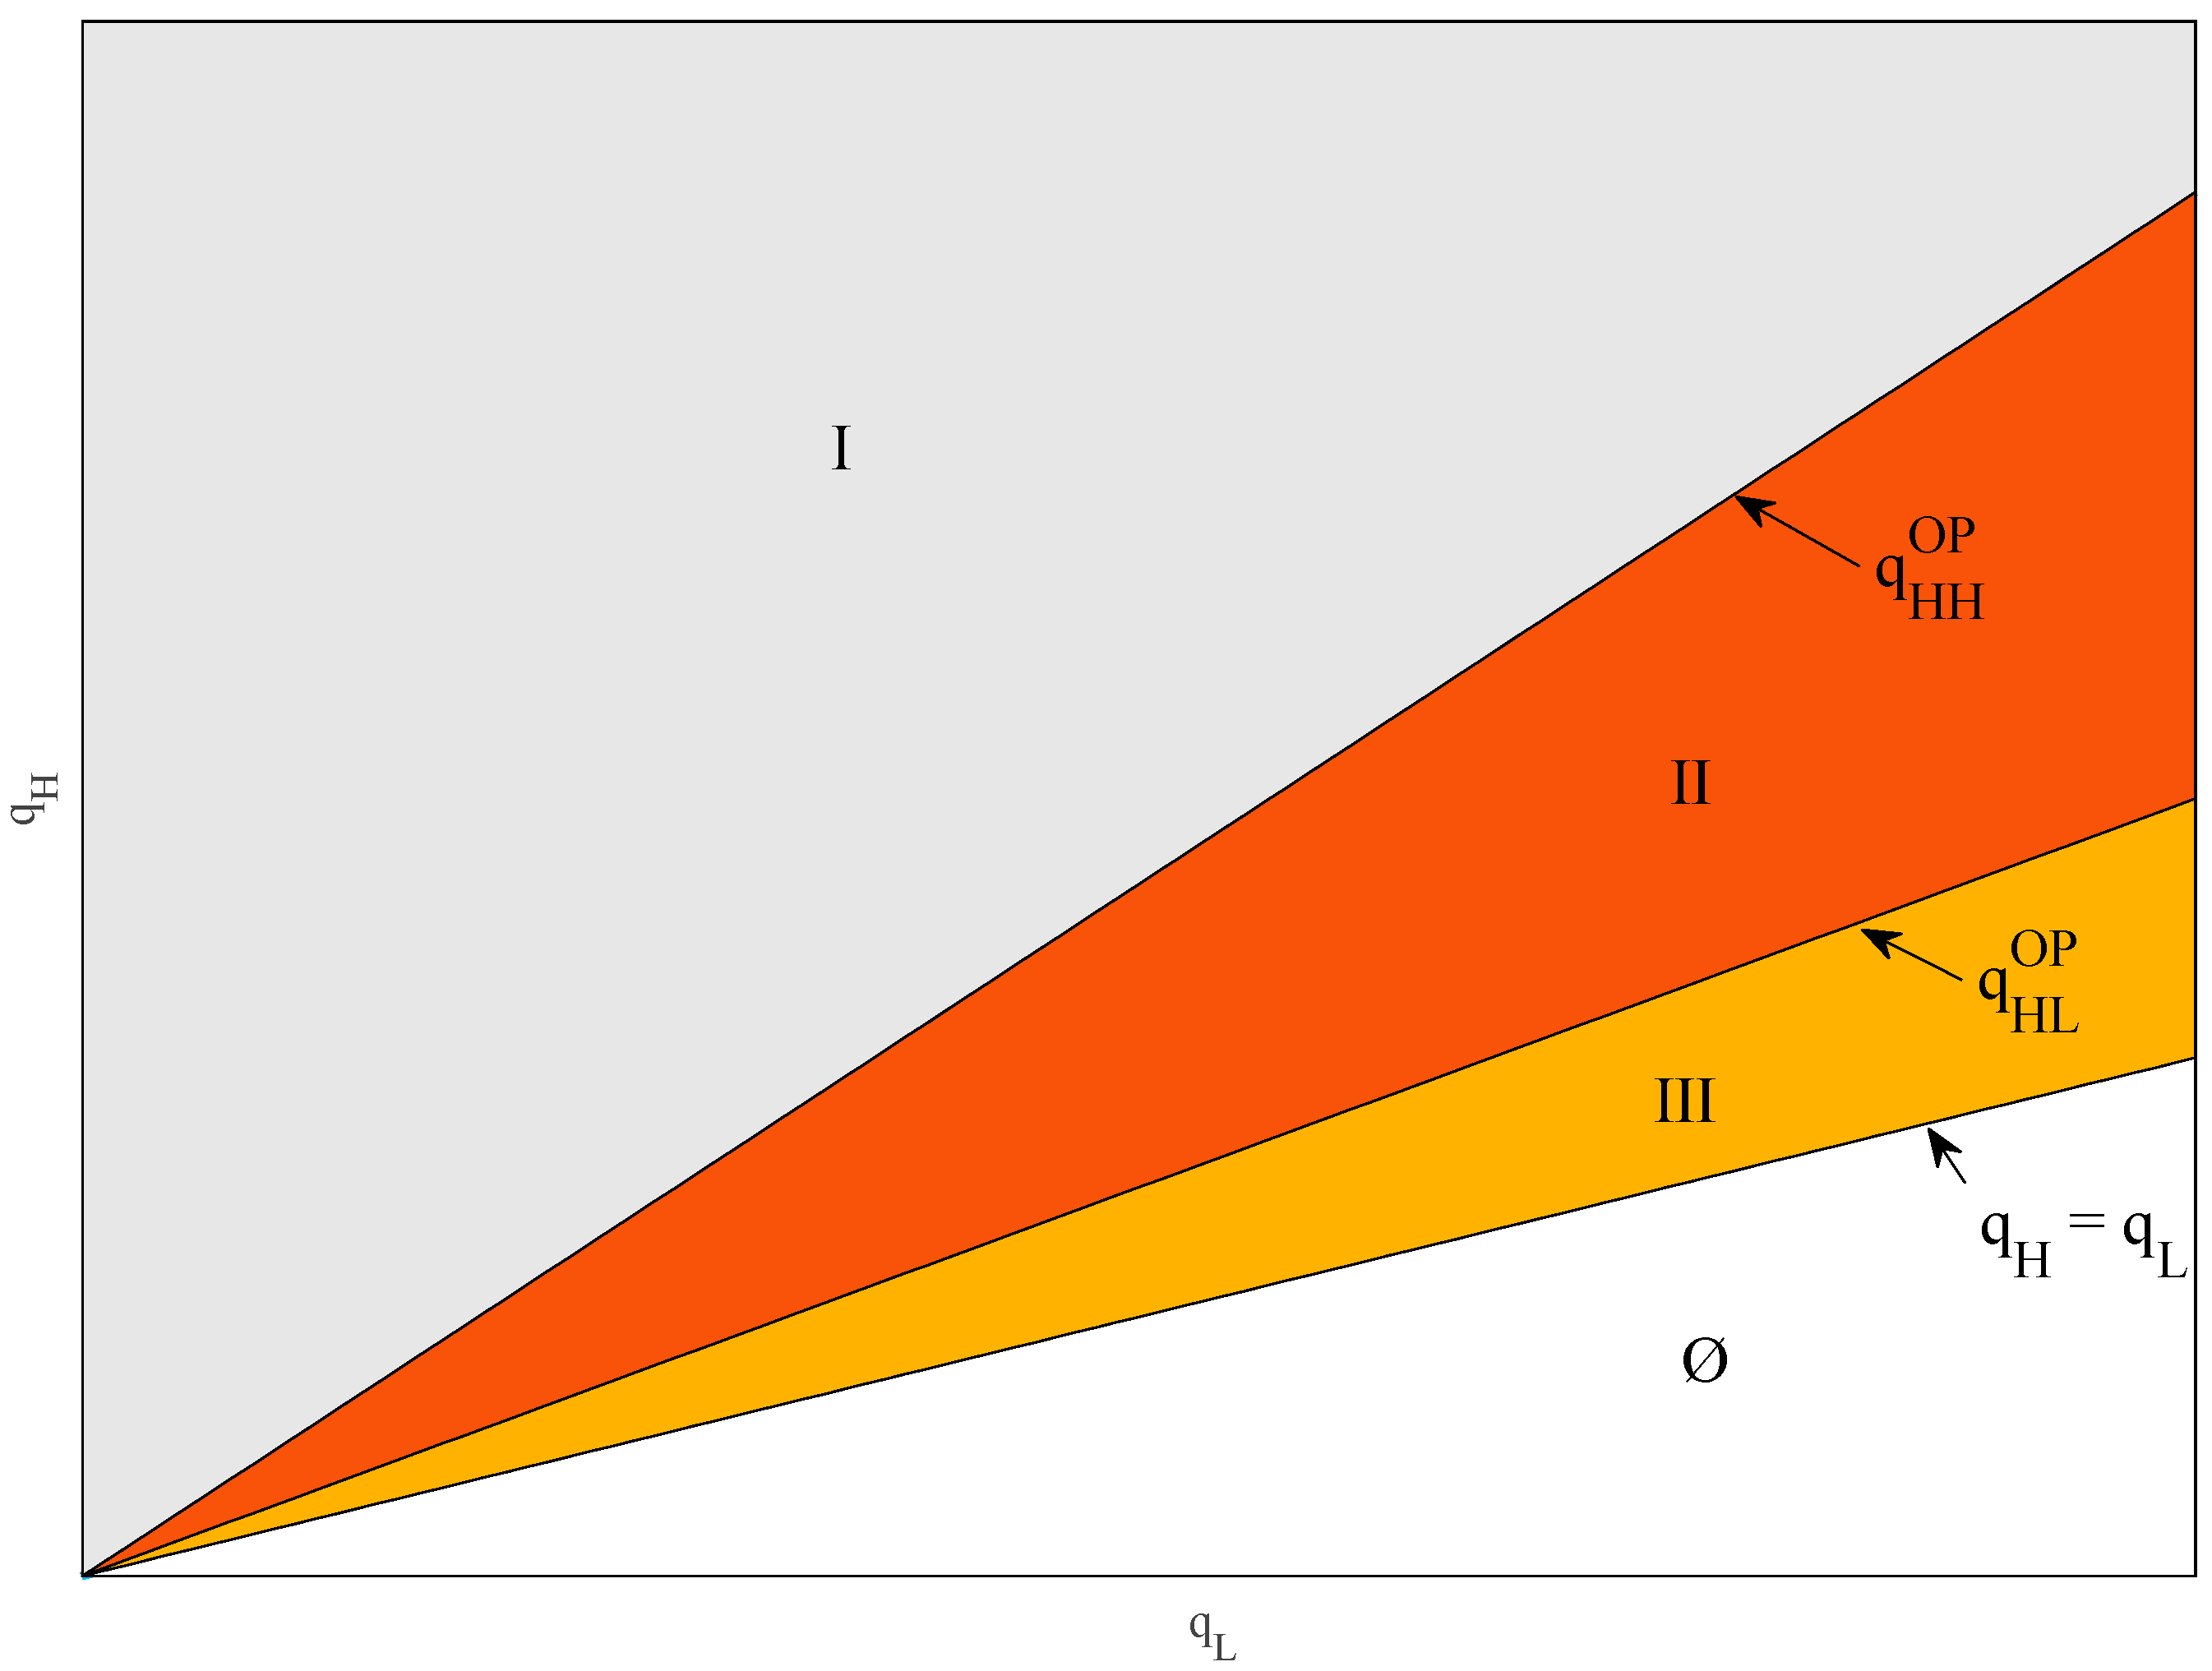
4.2.2. When the Platform Service Value Is Higher than the Quality Cost Difference of Products
We first set the threshold that enables the revenue of manufacturer
H and
L to be equal as
, as shown in
Figure 4. When
, we have
, which ensures manufacturer
H obtains a positive income when trading in the platform. Additionally, when
, we can easily know
and
. Therefore, in order to give the high-quality manufacturers an incentive to participle in the platform, it is necessary to ensure that the revenue of high-quality manufacturers is not lower than that of low-quality manufacturers. We next discuss what measures the platform can take to satisfy this requirement. It is easy to obtain the revenue gap between manufacturer
H and manufacturer
L, as follows:
Then, is substituted into the Equation (14), and we can obtain the consumer type that makes manufacturer H and manufacturer L attain the same profits, that is, .
Since
,
, while
,
and considering
, we can obtain:
In addition, due to
and according to monotonicity, we have
. Therefore, the platform always has the incentive to achieve a benign market. As shown in
Figure 4, in market scenario III, the platform market is not benign, which needs to be appropriately guided. We find that, to ensure that the platform can attain asymptotically optimal revenue and maintain a benign market, the platform can implement two market subsidy measures for the consumer type in
. Firstly, if the platform wants to attain the highest revenue, it can provide subsidy
, as shown in
Figure 4, for the consumers with low product quality demand, so that these consumers may switch to purchasing high-quality products. As such, the market scenario may become benign. In addition, to make sure that the high-quality manufacturers are at a better position, it is effective for the platform to offer subsidy
, which allows the platform’s revenue to reach an asymptotically optimal level, and also promotes the profit of high-quality manufacturers. Hence, the following proposition summarizes the viable platform subsidy strategies that ensure that manufacturer
H gains more than manufacturer
L, thus maintaining a benign consumption market.
Proposition 3. When the service value of the platform is higher than the product quality cost of high-quality manufacturers, i.e., , both manufacturer H and L will participate in the platform. However, the platform can subsidize consumers up to to attain the most revenue, or reduce the subsidy to ensure that the high-quality manufacturers gain more in the platform.
Corollary 3. When
, it can trigger the platform to implement subsidies to maintain its optimal profitability. When , it is more urgent for the platform to maintain a benign consumption market.
- (1)
As shown in Figure 4, when, the number of consumers with low-quality demand is not too much. In this case, the high-quality manufacturers earn more than the low-quality manufacturers, i.e.,. Hence, the platform is a benign market. - (2)
As shown in Figure 4, when, the number of consumers with low-quality demand is at a medium level, which still makes platform an asymptotically benign market. However, due toand, the platform has the incentive to guide consumers to purchase high-quality products and to enhance profit. It suggests that the upper subsidy that the platform can offer is, thereby reducing the proportion of consumers with low-quality preference fromto.
- (3)
As shown in Figure 4, when , there are too many consumers pursuing low-quality products, resulting in a non-benign market. Hence, apart from offering , the platform should add . As such, the total subsidy is , which can form a benign market. Further, if only providing , the platform can still obtain an asymptotically optimal revenue, thereby maintaining an asymptotically benign market.
In addition, as shown in
Figure 4, the subsidy
should not be higher than the revenue difference between manufacturer
H and manufacturer
L when
. This is seen as follows:
Further, to avoid the platform attaining a negative profit, the total amount of subsidies offered by the platform should not be higher than the overall revenue of the platform, i.e., . If , the platform is glutted with the consumers holding low-quality demand and the subsidy strategies mentioned above fail to work. In this case, the platform can implement other strategies, such as selectively increasing the service value of the platform, disclosing product quality information to consumers and enhancing consumers’ awareness of product quality.
Next, we compare the same type of consumer surplus in different markets and discuss the effect of different purchasing channels on consumers.
4.3. Comparison of Consumer Surplus
In the benchmark market, it is difficult for manufacturers to learn about consumer demand and recognize consumer segments. Therefore, the platform can only implement uniform pricing based on product quality cost. In the previous sections, we obtained the equilibrium quality that the manufacturers and the marginal consumers set in the benchmark market, i.e.,
,
and
; the consumer surplus, after purchasing high-quality and low-quality products, respectively, will be given by:
In the platform market, manufacturers can gather consumer privacy information through personalized services of the platform, which enables them to practice personalized pricing and extract nearly all the consumer surplus. Hence, the consumer surplus will converge to zero, i.e., .
We next let the respective consumer surplus of high-quality and low-quality segments in these two cases be equal; the results are given by
By solving the Equations (19) and (20), we have and , and the following proposition is obtained.
Proposition 4. Givenand, we have:
- (a)
For the consumers with high-quality demand:
- (a. 1)
When, there is, so thatdoes not exist and;
- (a. 2)
When, if, there is;
- (a. 3)
When, if, there is.
- (b)
For the consumers with low-quality demand:
- (b. 1)
When, that is,, we can know.
- (b. 2)
When, that is,, we have.
Proposition 4 reveals varying effects of product cost on consumer surplus. In terms of consumers with high-quality preference, as shown in case (a. 2), when the cost increase in manufacturers’ products brings limited quality improvement, the consumers are better off the platform market. While case (a. 3) provides a counterintuitive result, that is, when the cost increase in the manufacturers’ products brings great quality improvement, consumers are worse off in the platform market. This stems from the fact that huge quality promotion may result in a high price, which shrinks consumers’ utilities. In terms of consumers with high-quality demand, case (b. 1) indicates that, when the product quality in the platform is low enough, consumers are better off in the platform market, while case (b. 1) shows that, when the quality of all products on the platform is not very inferior, consumers are better off in the benchmark market.
Corollary 4. Considering, we can knowand the market is divided as follows:
- (1)
If, there are,, and all consumers are better off in the platform market, as shown in area I of Figure 5.
- (2)
If, there are,, and consumer market preferences vary with product quality demand. That is, consumers with high-quality demand tend to buy in the benchmark market, while consumers with low-quality demand prefer the platform market, as shown in area II of Figure 5.
- (3)
If, there are,, implying that all consumers are better off in the benchmark market, as shown in area III of Figure 5.
Proposition 4 and Corollary 4 show that, for the consumers pursuing high-quality products, when the product quality of high-quality manufacturers is good enough and the cost of product quality is controllable, consumers obtain more in the platform market; when the quality advantage of high-quality manufacturers is not obvious, consumers are better off in the benchmark market. Similarly, for the consumers with low-quality product demand, only when the product quality is low enough, are consumers better off buying in the platform market.
We next discuss the deadweight loss from purchasing low-quality products, as follows:
With the increase in low-quality consumers, i.e.,
is increasing, the consumer surplus on the platform market is declining, revealing that it is adverse for consumers to purchase low-quality products in the platform. However, when consumers are fully informed about the product quality, the proportion of consumers with low-quality preferences may plunge. Hence, the platform can disclose the product quality information to consumers through the platform’s services, which can reduce the segment of the consumers who prefer low-quality products and achieve
; this decreases the deadweight loss for consumers in the benchmark market. As shown in
Figure 5, in region I, the platform can guide consumers to shop in the platform market under benign market conditions; in region II, when the quality of manufacturer
H’ s product declines, the platform should guide the consumers with high-quality preference to the benchmark market, and the low-quality demand consumers should be guided to the platform market; as for in region III, the gap between high-quality products and low-quality products is small and the consumers should be guided to the benchmark market.
In the real scenario, when the entry barriers of the platform market are negligible and consumers fail to identify the quality of products which are provided by some immoral manufacturers, the low-priced and inferior products may easily mislead consumers to buy; this results in deadweight losses of consumers. Therefore, on the one hand, the platform can properly guide consumers to buy high-quality products, enhancing the brand value of the platform. On the other hand, in order to prevent low-end product manufacturers from using dumping and other similar means to destroy the market, the platform can adopt different charging policies, and set the entry threshold by charging fixed fees and commission rates; this maintains the two-sided benign market ecology of the platform, and highlights the service value of the platform.
5. Sensitivity Analysis
This section discusses the impact of the platform service value on the platform and different manufacturers, through numerical simulation.
5.1. The Impact of the Platform Service Value on Platform Revenue
To ensure that the platform always achieves positive revenues, we let , and obtain . When , , which indicates that only when the platform service value exceeds a certain threshold, can a positive profit be attained. This result can explain why certain platforms attain negative revenues when initially participating in the market. As a consequence of the emerging platform joining the market, its service is not mature; therefore, the platform needs to subsidize users to obtain a market share, which requires huge costs. When the service value of the platform rises and the brand influence is formed, the platform presents great service value, thus achieving positive returns.
We further reveal how the platform attains growing revenue. According to
, we let
, and
is obtained. When
,
, while when,
; this indicates that the platform revenue presents a U-shape, with respect to its service value, as shown in
Figure 6. In addition, when
, we have
, which shows that the positive effect of the platform’s service value on the revenue of the platform is amplified.
In addition, as shown in
Figure 6, the extent of consumers preferring low-quality products also affects the platform’s profit. When the proportion of consumers with the low-quality preference increases, i.e.,
x is increasing, the platform suffers. Therefore, the platform needs to promote service value, for example, let
. Furthermore, improving the service value of the platform can effectively guide consumers to purchase high-quality goods and reduce the
x. Through these measures, the platform can maintain a benign development, thereby achieving increasing profitability.
5.2. The Impact of Platform Service Value on Manufacturer’s Revenue
In the benchmark market, since there is no platform service, the profits of manufacturers depend on product quality and cost, which leads to Bertrand competition. Therefore, the platform’s benign development cannot be guaranteed. In particular, when , the profits of low-quality manufacturer L will obtain more than high-quality manufacturer H. In order to skirt this result, the platform should adopt the benign consumption market strategy, and provide high-quality product subsidies to consumers, thereby achieving a benign market.
In the platform market, the profits of manufacturers
H and
L are as follows:
Let
and
, and we can obtain:
Hence, when , , while when , . Similarly, when , , while when , .
With the increase in the platform service value
, the revenues of all manufacturers show an inverted U-shaped trend, as showed in
Figure 7 and
Figure 8. This is because in the early stages, the platform provides manufacturers with a personalized pricing service that requires a low commission level, so that the revenues of manufacturers increase. However, when the platform service value is promoted further, the commission level goes up accordingly, resulting in decreasing profits for manufacturers. For example, platforms, such as Meituan Takeout and Didi, have been developing with online and offline integration, attracting a large quantity of manufacturers. With the improvement of platform service facilities, the matching efficiency is improved; therefore, the market monopoly advantage is strengthened and the service value is highlighted. Therefore, these platforms keep increasing the commission level, which leads to an inverted U-shaped change in the profits of the manufacturers. Consequently, the manufacturers have the incentive to avoid market dependence, caused by excessive service on the platform.
Due to , it is easily found that with the increase in platform value, the high-quality manufacturer, H, reaches the maximum profit before the low-quality manufacturer, L. Therefore, the platform needs to determine the optimal service value for different manufacturers, based on the change in consumer types in the platform. It is effective for the platform to implement differentiated strategies to ensure that high-quality manufacturers gain more, which is also a feasible way to maintain a benign market. However, when the service value of the platform reaches a certain level, the platform can consider constant commission level to improve the benefits that two-sided users can obtain, thus truly exerting the value of the platform and increasing social welfare.
6. Implications
The main theoretical contribution of our analysis is that the number of consumers with a low-quality preference plays a significant role in all parties’ payoffs; we find that three proportions of the consumers with low-quality demand in the platform, and manufacturer H and manufacturer L, obtain the optimal revenue, respectively. In addition, we define the benign market of the platform and determine three market scenarios concerning the platform’s benign level. We also demonstrate that it is effective for platforms to subsidize consumers with low-quality preferences to promote a benign market. For instance, some e-commerce platforms, such as Pinduoduo, tend to use low prices to attract consumers to buy low-quality products, which leads to the loss of high-quality manufacturers. Thus, when the market is so full of “e-commerce exclusive” products of varying quality, we show that the platform service value is reflected in two ways. On the one hand, the platform can segment the type of consumer demand in the market. Through the private information data disclosed by consumers, which can truly reflect consumer demand, the platform can provide personalized services and match pricing for consumers and manufacturers; this can improve the consumer surplus. On the other hand, when consumers prefer lower quality products, some subsidy strategies can be used to guide consumers to purchase high-quality products, thereby raising platform profit and maintaining the platform’s benign consumer market. Further, it also enables manufacturers to improve product quality and avoid the notion that “bad money drives out good money”, thereby indirectly boosting consumer surplus.
Our primary managerial implication is that the platform can implement two subsidy strategies to achieve different goals. Firstly, when the market is in a general state, the platform can formulate a general subsidy strategy to guide consumers with low-quality needs to purchase high-quality products, thus maximizing the platform’s revenue. Secondly, when the market reduces to a non-benign market state, the platform needs to strengthen subsidies to maintain the maximum revenue. However, if the platform wants to make sure that the profits of high-quality manufacturers are greater than those that low-quality manufacturers obtain, the subsidy intensity can be appropriately decreased. In addition to using subsidy strategies to guide consumers to patronize high-quality products, we provide a second managerial insight; this shows that the platform can adopt different charging policies and set entry barriers to prevent low-end manufacturers from undermining the normal operation of the market, by means of inferior approaches. For example, the platform can implement two-part pricing, with a fixed entry fee and different commission levels for manufacturers with different quality levels.
Lastly, our main policy contributions are as follows: On the one hand, platform supervisors can appropriately encourage the platform to practice subsidy policies to maintain the benign development of the platform. On the other hand, platforms can be required to specify the differentiated fee for manufacturers of different quality levels in the market.
7. Conclusions
Considering the consumer demand type, this paper studies the impact of the platform service value on the market competition of “e-commerce exclusive” products, among manufacturers of different quality, and the platform’s benign consumption market strategy via a vertical differentiation model. We show that (1) In the benchmark market, due to the lack of platform service, manufacturers fail to master the information of consumer demand type, so manufacturers can only uniformly price products. The profit gap between high-quality manufacturer H and low-quality manufacturer L depends on the quality difference and cost difference of their products. If consumers buy low-quality products, they will incur unavoidable deadweight losses. (2) In the platform market, the types of consumers are gathered, which enables manufacturers to personalize prices for heterogeneous consumers. The findings are as follows: (i) When the platform service value is lower than the product quality cost, the platform market may have three scenarios: benign consumer market I, general market II and non-benign consumer market III. (ii) When the platform service value is higher than the quality cost of the product and many consumers in the platform tend to be consumers with low-quality demand, there are two stages of platform subsidy. First, in the first stage of the decline of platform revenue, the revenue of manufacturer H is still higher than that of manufacturer L. At this time, if the platform wants to improve revenue, it can pay subsidies to consumers who buy high-quality products, which can increase consumer surplus without reducing the platform revenue. In addition, in the second stage of the decline of platform revenue, manufacturer L may obtain more than manufacturer H, resulting in a lemon market. Hence, the platform should provide stronger subsidies for the benign consumer market. Finally, if the subsidy influence is insufficient to reverse the revenue of manufacturers H and L, the platform needs to adjust the service value; this can include disclosing the product quality information to consumers, enhancing consumers’ awareness of product quality, or adjusting the fixed and floating rates of manufacturers. (3) By comparing the consumer surplus of varying quality demands in the benchmark market and the platform market, we believe that, when consumers are fully aware of the product quality of different manufacturers, consumers with different demands between the benchmark market and the platform market may change their buying market channels. Meanwhile, the product quality of different manufacturers will indirectly affect the choice of the consumers market, which can be the direction of future work. (4) Through the sensitivity analysis of the platform value to the platform and manufacturer’s revenue, it can be concluded that the increase in the platform service value makes the platform’s revenue show a U-shaped growth, and this has an inverted U-shaped impact on the revenue of manufacturers H and L. Therefore, for manufacturers H and L, there exists an optimal platform service value, which can optimize the profit of each manufacturer in the platform market, and the platform can provide a service level to allow high-quality manufacturers to reach the maximum profit before low-quality manufacturers. For example, some differentiated services, such as search bidding ranking and live-streaming sales can be provided by the platform. Further, the platform should realize that excessive service to manufacturers will be detrimental.
In summary, constructing a benign consumer market needs to balance the interests of the platform, manufacturers, and consumers. When the platform’s consumer portrait technology conveys a more accurate service matching value, it is still necessary to pay attention to the heterogeneity of consumers; this includes privacy sensitivity and quality preference. When the consumer market environment is constantly changing, the platform can guide high-quality consumption by implementing market subsidy strategies. In addition, through service innovation, information technology and commercial practice, differentiated service value can be appropriately provided to consumers and manufacturers; this is to improve consumers’ shopping cognition and adjust the transaction service costs of manufacturers with products of differing quality, and thereby guiding the benign development of the market. With further developments in data portrait technology, work focused on price discrimination and based on the historical data of consumers increases. In view of the diversified and heterogeneous demand characteristics of consumers, research on the repeated game of consumers’ participation in the market will be an important direction. However, personalized pricing, combined with consumer privacy in line with legal regulation, is still difficult; this involves consumer groups, related to information privacy protection laws and sound market mechanisms. Therefore, future research could consider consumer privacy protection regulations and platform information strategies, providing more significant insights.


