Article

HLEGF: An Effective Hypernetwork Community Detection Algorithm Based on Local Expansion and Global Fusion

1
School of Computer, Qinghai Normal University, Xining 810008, China
2
The State Key Laboratory of Tibetan Intelligent Information Processing and Application, Xining 810008, China
3
Department of Computer, Mathematical and Physical Sciences, Sul Ross State University, Alpine, TX 79830, USA
*
Author to whom correspondence should be addressed.
Mathematics 2023, 11(16), 3497; https://doi.org/10.3390/math11163497
Submission received: 13 July 2023 / Revised: 10 August 2023 / Accepted: 10 August 2023 / Published: 13 August 2023
(This article belongs to the Topic Complex Systems and Network Science)

Abstract

:
Community structure is crucial for understanding network characteristics, and the local expansion method has performed well in detecting community structures. However, there are two problems with this method. Firstly, it can only add nodes or edges on the basis of existing clusters, and secondly, it can produce a large number of small communities. In this paper, we extend the local expansion method based on ordinary graph to hypergraph, and propose an effective hypernetwork community detection algorithm based on local expansion (LE) and global fusion (GF), which is referred to as HLEGF. The LE process obtains multiple small sub-hypergraphs by deleting and adding hyperedges, while the GF process optimizes the sub-hypergraphs generated by the local expansion process. To solve the first problem, the HLEGF algorithm introduces the concepts of community neighborhood and community boundary to delete some nodes and hyperedges in hypergraphs. To solve the second problem, the HLEGF algorithm establishes correlations between adjacent sub-hypergraphs through global fusion. We evaluated the performance of the HLEGF algorithm in the real hypernetwork and six synthetic random hypernetworks with different probabilities. Because the HLEGF algorithm introduces the concepts of community boundary and neighborhood, and the concept of a series of similarities, the algorithm has superiority. In the real hypernetwork, the HLEGF algorithm is consistent with the classical Spectral algorithm, while in the random hypernetwork, when the probability is not less than 0.95, the NMI value of the HLEGF algorithm is always greater than 0.92, and the RI value is always greater than 0.97. When the probability is 0.95, the HLEGF algorithm achieves a 2.3% improvement in the NMI value, compared to the Spectral algorithm. Finally, we applied the HLEGF algorithm to the drug–target hypernetwork to partition drugs with similar functions into communities.

1. Introduction

In real life, many complex relationships can often be represented as complex networks, such as citation networks, social networks, and mobile information control networks [1]. In these different networks, nodes represent individuals and edges represent their interactions. Three important characteristics of complex networks, namely the small-world property [2], scale-free property [3], and community structure [4], have garnered significant attention from scholars.
Ordinary graphs are limited to pairwise relationship information, and this binary measure is often insufficient in many applications. Consequently, hypernetworks have become a popular research topic in network science. The concept of a hypernetwork is divided into two categories, namely supernetworks based on networks, and hypernetworks whose topology is a hypergraph. Estrada et al. [5] referred to networks based on hypergraphs as hypernetworks, and first extended some concepts to hypernetworks. Since the concept of supernetwork has been proposed, the model construction of hypernetworks has attracted much attention from scholars; many papers [6,7,8,9,10] show that hypernetworks that reveal multivariate relationships are ubiquitous in life. In addition, The community detection problem in hypergraphs has also been extensively studied. Community detection in hypergraphs aims to identify a partition, such that C = C 1 , C 2 , , C k C 1 C 2 C k V , and the internal nodes of each community are more closely connected than the external nodes. Based on the ordinary complex networks’ community detection algorithms, Cheng et al. [11] transformed the community detection problem of the hypernetwork into a graph segmentation problem; Kamiński et al. [12] extended the definition in ordinary networks; Chodrow et al. [13] combined the degree-corrected random block model in the hypergraph; Larremore et al. [14] extended the concept of modularity to hypergraphs. The non-negative matrix factorization method can reveal the community structure existing in ordinary complex networks, but without considering multiple relationships. Wu et al. [15] combined the hypergraph regular term, and made it applicable to the community detection problem of the hypernetwork. The dynamic equations can also well reflect the structure of the network and then mine the community. Some scholars [16,17,18,19] have considered higher-order interaction relationships to solve the problem of the dynamics of the hypernetworks; when the equations reach the steady state, we can find the corresponding community structure.
Among them, the local expansion method has proven to be effective in detecting the community structure in real-world networks and its working principle can be found in [20]. Since the motif clustering perspective is relatively new, the available combinatorial approaches are still few. Chhabra et al. [21] used local motif clustering to obtain local clustering results based on the distribution of motifs. Since the algorithm avoids randomness by repeating the partitioning process, it is time-consuming. Guo et al. [22] and Ma et al. [23] obtained the final community division results by optimizing the quality functions, but the accuracy of the method largely depends on the selection of the quality functions. To overcome the above problems, Ding et al. [24] expanded communities by analyzing the characteristics of communities from the perspective of nodes, but failed to distinguish between highly admixed communities. Recent studies [25,26,27] show that reinforcement learning and fuzzy-logic-based approaches can detect communities present in networks. However, compared to the local extension-based methods, the latter are relatively simple and easy to implement, as they only require basic graph theory, and the results are clear and interpretable. In contrast, reinforcement learning and fuzzy-logic-based approaches may require more complex algorithms, models, and even datasets, and therefore produce more opaque or complex results. However, there are two problems with local expansion methods when detecting communities: first, they can only add nodes or edges based on existing clusters, and second, they generate a great number of small communities. For this reason, we present a new algorithm.
In this paper, we propose a new algorithm for detecting community structures in hypernetworks by extending the local expansion method to hypergraphs. The algorithm consists of two processes: the local expansion process and the global fusion process. The former includes seed selection, deletion, and expansion sub-processes, while the latter involves merging sub-hypergraphs generated from the previous process. We choose the node with the highest influence as the seed based on the centrality indicator, and nodes contained in the neighborhood of the seed node are considered as the initial community of this node. We remove some hyperedges and nodes from the initial community based on the similarity between hyperedges and sub-hypergraphs, as well as the similarity between nodes and communities. We then expand more similar hyperedges outside the community into the current community to obtain a sub-hypergraph. A great number of small sub-hypergraphs are obtained in the local expansion process. Next, we compare the distances between different seed nodes of each sub-hypergraph. If the distance is less than a specified threshold, we merge these two sub-hypergraphs into one and obtain the final community partitioning result.
The main contributions of this paper are as follows:
(1)
This paper extends the local expansion method to hypergraphs and proposes a hypernetwork community detection algorithm based on local expansion and global fusion, which provides a solution for identifying communities with hypergraph structures;
(2)
Based on the local expansion, we consider deleting nodes and hyperedges;
(3)
The algorithm establishes connections between sub-hypergraphs through global fusion to improve the relativity of detected communities.
This paper is organized as follows. Some definitions associated with the algorithm are provided in Section 2, the HLEGF algorithm and its two processes are introduced in Section 3, Section 4 verifies the feasibility and superiority of the algorithm through analytical experiments, and Section 5 concludes this paper and discusses future research.

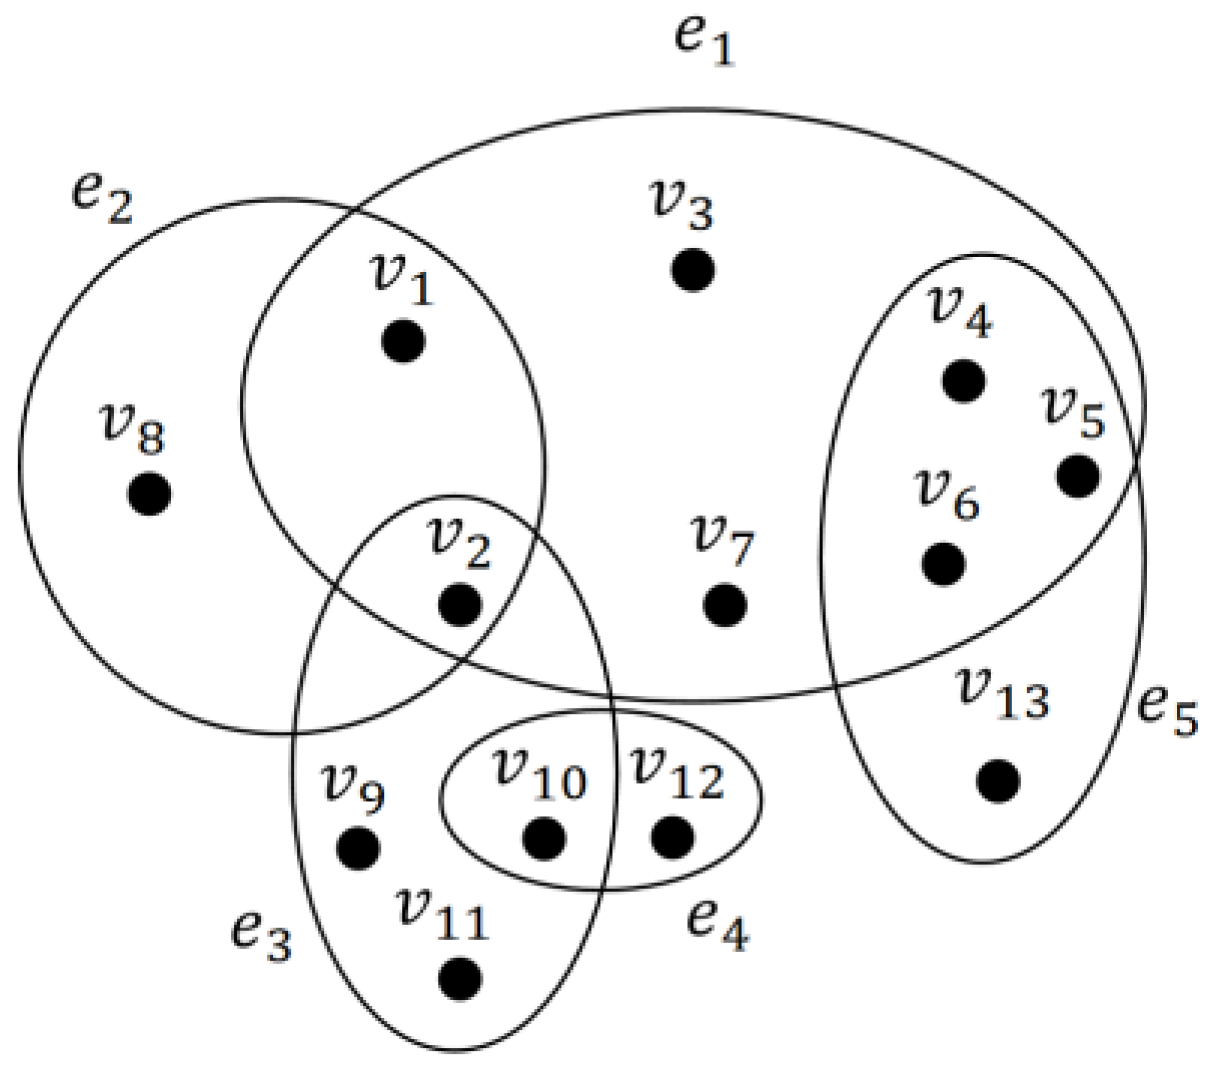
2. Basic Definitions

Definition 1
(Hypergraph [28]). A hypergraph H is a pair H = V ,   E , where V is a finite set of nodes (also called vertices) V = v 1 , v 2 , , v n , and E = e 1 , e 2 , , e m is a family of nonempty subsets of elements of V . These subsets are called hyperedges or hyperlinks, and they represent an interaction taking place between elements of V (see Figure 1).
If a node   v i hyperedge e j , we say that v i is incident to e j , and the corresponding entry in the incidence matrix A is A j i = 1 , otherwise, the entry is 0. Two hyperedges e i and e j are said to be incident if e i e j , i.e., if they have at least one node in common. We use matrix B to represent this relationship, if e i e j , B i j = 1 , otherwise, the entry is 0. The degree d v i of the node v i in a hypergraph is defined as the number of nodes directly adjacent to it. The hyperdegree d H v i of a node is defined as the number of hyperedges containing that node. The distance d v i , v j between two nodes v i and v j in a hypergraph is defined as the minimum length of the path connecting the two nodes. If there is no path between two nodes, the distance d v i , v j = .
Definition 2 (Sub-hypergraph).
Given two hypergraphs H = V , E and H = V , E , if V V , and e E there is only one e E , such that e e , then H is called a sub-hypergraph of H .
Definition 3 (Node Centrality).
In this paper, we define the centrality of a node v i in hypergraph as follows:
N C v i = α d H v i E + 1 α d v i V
Formula (1) consists of two terms. The first term is the ratio of the hyperdegree of the node to the total number of hyperedges, which reflects the importance of hyperedges. The second term is the ratio of the degree of the node to the total number of nodes, which reflects the importance of nodes, α is a tunable parameter. Therefore, node centrality is measured by both node degree and hyperdegree, it is also used to determine the order of selecting seed nodes in this paper.
In Figure 1, when α = 0.5 , the node with the greatest centrality is v 2 . Therefore, the seed node is v 2 .
Definition 4 (Node Neighborhood).
The neighborhood of a node v i is defined as the set of all hyperedges containing that node.
Γ v i = { e j   |   e j E , A j i = 1 } , v i V
In this paper, nodes contained in the neighborhood Γ v i of the seed node v i are considered as the initial community of this node, denoted by C v i . Therefore, in Figure 1, the initial community of node v 2 is C v 2 = v 1 , v 2 , v 3 , v 4 , v 5 , v 6 , v 7 , v 8 , v 9 , v 10 , v 11 .
Definition 5 (Community Boundary and Neighborhood).
Given a community C , the boundary B C is defined as follows:
B C = { e j | e j C , B i j = 1 , e i C }
A community’s boundary consists of hyperedges inside the community, which have at least one of the incident hyperedges located outside the community.
The community’s neighborhood Γ C of community C is defined as follows:
Γ C = { e j | e j C , B i j = 1 , e i C }
A community’s neighborhood consists of hyperedges outside the community, which have at least one of the incident hyperedges located within the community.
In the hypergraph shown in Figure 1, the boundary of the community C v 2 is B C v 2 = e 1 , e 3 , and its neighborhood is Γ C v 2 = e 4 , e 5 .
Definition 6 (Similarity between a hyperedge and Sub-hypergraph).
For a given community C and a sub-hypergraph H = V , E , the similarity h s s e i , H is defined as follows:
h s s e i , H = m a x e i e j * B i j , e j E i f e i B ( C ) a n d V C v v e i e j , e j E , e j e i i f e i B ( C ) a n d V = C m a x e i e j * B i j , e j E , e j e i i f e i Γ ( C ) a n d V C v v e i e j , e j E i f e i Γ ( C ) a n d V = C
Definition 7 (Similarity between Node and Community).
The similarity between a node v i and a community C is defined as the ratio of the number of hyperedges satisfying certain conditions in the node neighborhood to the number of hyperedges in the node neighborhood. Among them, the hyperedges of the molecular part should satisfy the condition that at least half of the nodes contained in these hyperedges are located in the community C . The result reflects how much the node is connected with the community C .
n c s v i , C = | { e j   e j Γ v i , e j C e j | 0.5 } | Γ v i
In the above equation, if n c s v i , C < 0.5 , the node v i is removed from the community C .

3. Proposed Method

This paper proposes a new algorithm, called HLEGF, for detecting community structures in hypernetworks. The algorithm consists of two processes: the LE process and the GF process. The LE process includes seed selection, deletion, and expansion sub-processes. The seed selection sub-process selects the node with the highest centrality as the seed node from the hypernetwork and uses nodes contained in the neighborhood of the seed node as the initial community. In the deletion sub-process, hyperedges within the community boundary with low similarity to the sub-hypergraph consisting of the current community are first removed, and then nodes with lower similarity n c s v , C between the nodes and the community are removed. The expansion sub-process determines whether to expand the community based on the similarity h s s e , H between a hyperedge within the community neighborhood and sub-hypergraph, and adds the hyperedge with higher similarity to the community. This process can obtain multiple smaller sub-hypergraphs. The GF process globally merges the sub-hypergraphs generated by the previous process according to the distance between the seed nodes of the different sub-hypergraphs. When the distance is smaller than the specified threshold, the smaller sub-hypergraph is merged into the larger sub-hypergraph, and the final community detection result is obtained.

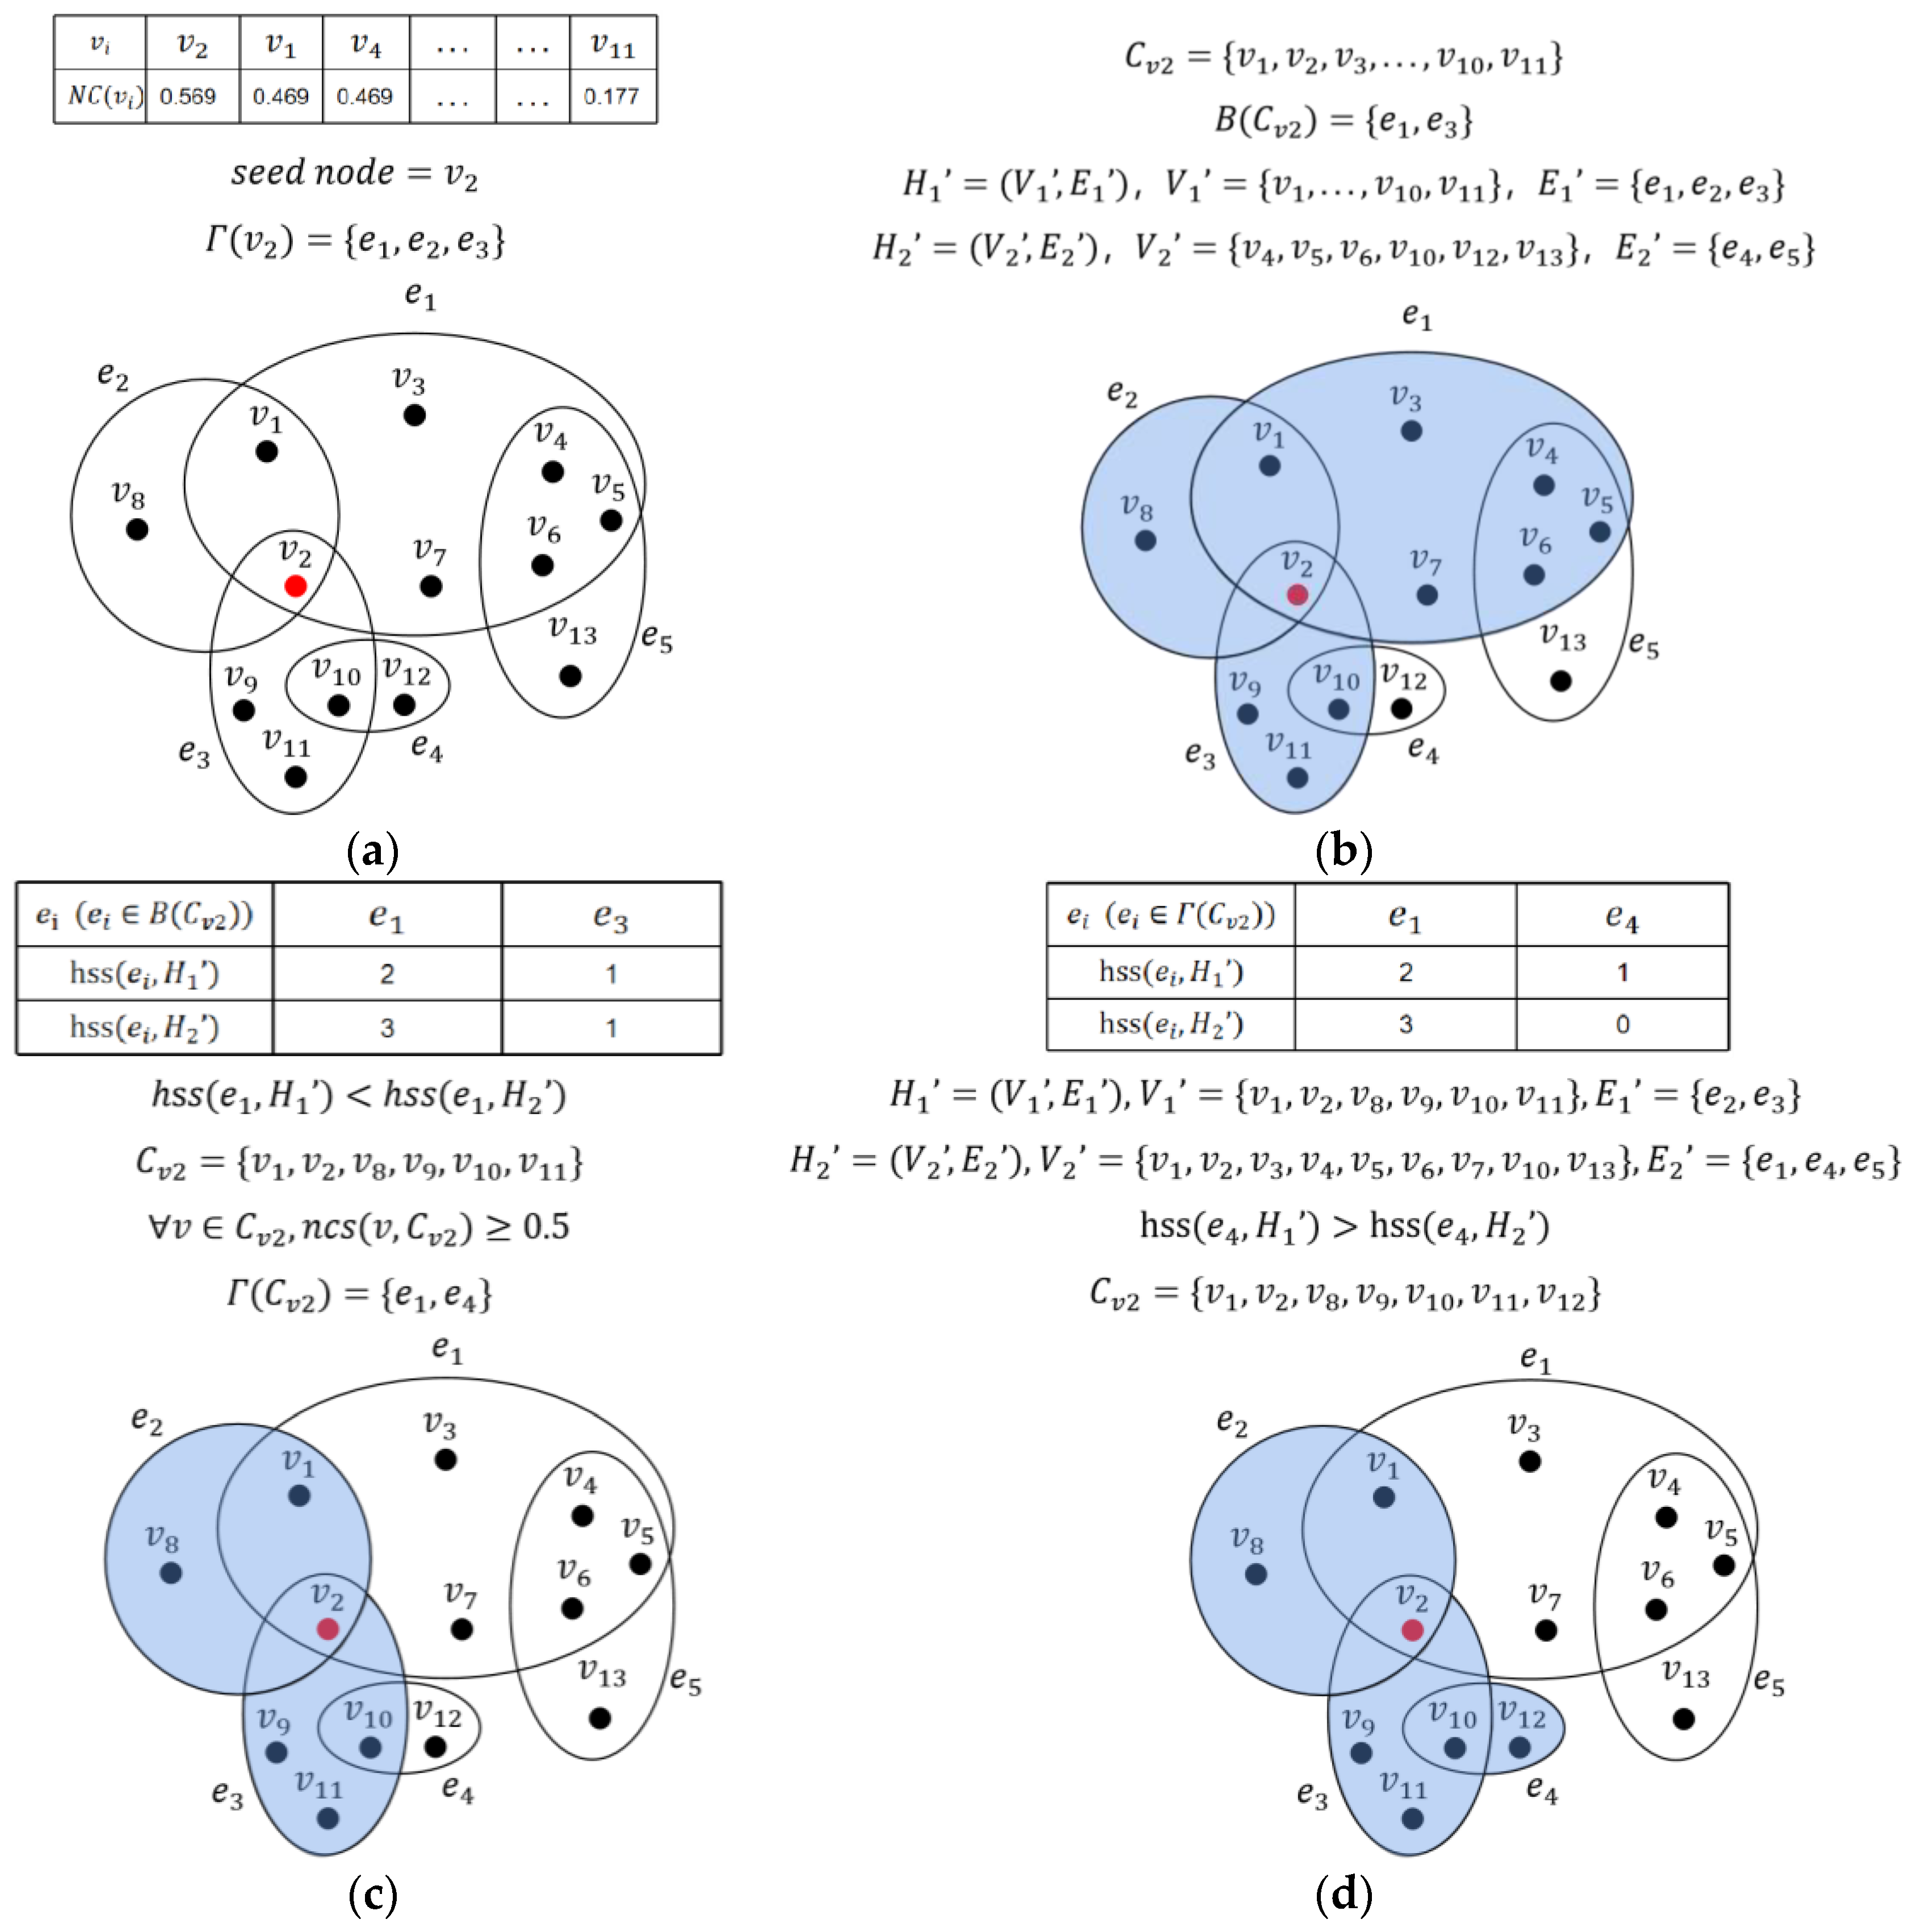
3.1. Local Expansion Process

The LE process is displayed in Algorithm 1. Lines 1–6 describe the initialization process, where C is the sub-hypergraph set, S is the seed node set, D is the set of deleted hyperedges, and U is the set of unassigned nodes. The centrality value of each node is calculated according to Definition 3. Lines 7–34 describe the LE process, where the algorithm executes the seed selection, deletion, and expansion sub-processes sequentially. The seed selection sub-process (lines 9–12) selects the node v s with the maximum centrality from the set of unassigned nodes as the seed and determines the community C v s based on Definition 4. The deletion sub-process (lines 13–23) first obtains hyperedges within the community boundary based on Definition 5, then calculates the similarity between the hyperedge and the sub-hypergraph consisted in community h s s e , H 1 , as well as the similarity between the hyperedge and the rest of the sub-hypergraphs outside the community h s s e , H 2 . If h s s e , H 1 < h s s e , H 2 , this hyperedge is deleted, and nodes associated with this hyperedge but not included in other hyperedges inside the community are also deleted. Then, the set D is updated. The similarity n c s v , C v s between the community’s node and the community is then calculated. If n c s v , C v s < 0.5 , the node is deleted. The expansion sub-process (lines 24–33) first obtains the hyperedges within the community neighborhood based on Definition 5, calculates the similarity between the hyperedge and the sub-hypergraph consisted in the current community h s s e , H 1 , as well as the similarity between the hyperedge and the rest of the sub-hypergraphs outside the community h s s e , H 2 . If h s s e , H 1 > h s s e , H 2 , this hyperedge and its associated nodes are added to the current community. At this time, we obtain a sub-hypergraph. Then, the sub-hypergraph set C and unassigned node sequence U are updated. Repeat the above process until U = .
To facilitate the use of the next process, we generate a new hypergraph H 2 , H 2 = V , E , where E′ is obtained after deleting the hyperedges of the set D from the original hyperedge set E , and there will be many isolated nodes in H 2 .
Algorithm 1: LE algorithm
Start LE
Input: Hypergraph H = V , E , Node set V , Hyperedge Set E .
Output: The sub-hypergraph set C .
1: Initialization:
2: Initialize the sub-hypergraph, C =
3: Initialize the seed node set, S =
4: Initialize the deleted edges, D =
5: Initialize an unassigned-node sequence U ,   U = V
6: Calculate the centrality of each node N C v v V based on Definition 3
7: Local expansion process:
8: While  U do
9: Seed selection sub-process:
10: Get the seed node v s v s U with the maximum centrality
11: Get neighborhood Γ v s of node v s based on Definition 4
12: Current community C v s = { v j | v j e i , e i Γ v s }
13: Deletion sub-process:
14: Get community boundary B C v s based on Definition 5
15: H 1 = V 1 , E 1   the sub-hypergraph consisted of the C v s , namely V 1 = C v s
16: H 2 = V 2 , E 2   the sub-hypergraphs outside the C v s , namely V 1 C v s
17: While  E d e l = { e i | h s s e i , H 1 < h s s e i , H 2 ,   e i B C v s } do
18: Update C v s = C v s { v i | v i e j , for   every   e j Γ v s ,   there   is   e j E d e l }
19: Update D = D E d e l
20: End while
21: While  V d e l = { v i | n c s v i , C v s < 0.5 ,   v i C v s } do
22: Update C v s = C v s V d e l
23: End while
24: Expansion sub-process:
25: Get community neighborhood Γ C v s based on Definition 5
26: Update H 1 and H 2
27: While  E a d d = e i h s s e i , H 1 > h s s e i , H 2   ,   e i Γ C v s do
28: E N a d d = { v i | v i e j , e j E add }
29: Update C v s = C v s E N a d d
30: End while
31: Update C = C C v s , U = U C v s ,   S = S v s
32: End while
33: hypergraph H 2 = V , E , for every e j e j E , there is e j D
34: return C
End LE
The time complexity of Algorithm 1 is O 2 m + n , where m is the number of hyperedges in the hypernetwork, and n is the number of nodes. Figure 2 illustrates the process.
Figure 2a shows the original hypergraph, and the node v 2 with the maximum centrality is selected as the seed node, and the neighborhood Γ v 2 of the node is e 1 ,   e 2 ,   e 3 . In Figure 2b, nodes contained in the neighborhood Γ v 2 are used as the initial community C v 2 . The boundary of the community is e 1 ,   e 3 . Based on the similarity between hyperedge and sub-hypergraph, it can be seen that the hyperedge e 1 is more similar to the sub-hypergraph outside the community. Therefore, the hyperedges e 2 ,   e 3 and their associated nodes are retained in the community C v 2 , and the remaining nodes v 1 , v 2 , v 8 , v 9 , v 10 , v 11 in the community are shown in Figure 2c. Based on the similarity between the node and community, it can be seen that these nodes are more similar to the current community, so they are retained. In the expansion sub-process, the neighborhood of the current community is e 1 ,   e 4 . Since the similarity between the hyperedge e 4 and the sub-hypergraph comprising the current community is greater than that between the hyperedge and the sub-hypergraph outside the community, the hyperedge e 4 and its contained nodes are added to the community, and then the final sub-hypergraph is obtained. The above sub-process is shown in Figure 2d.

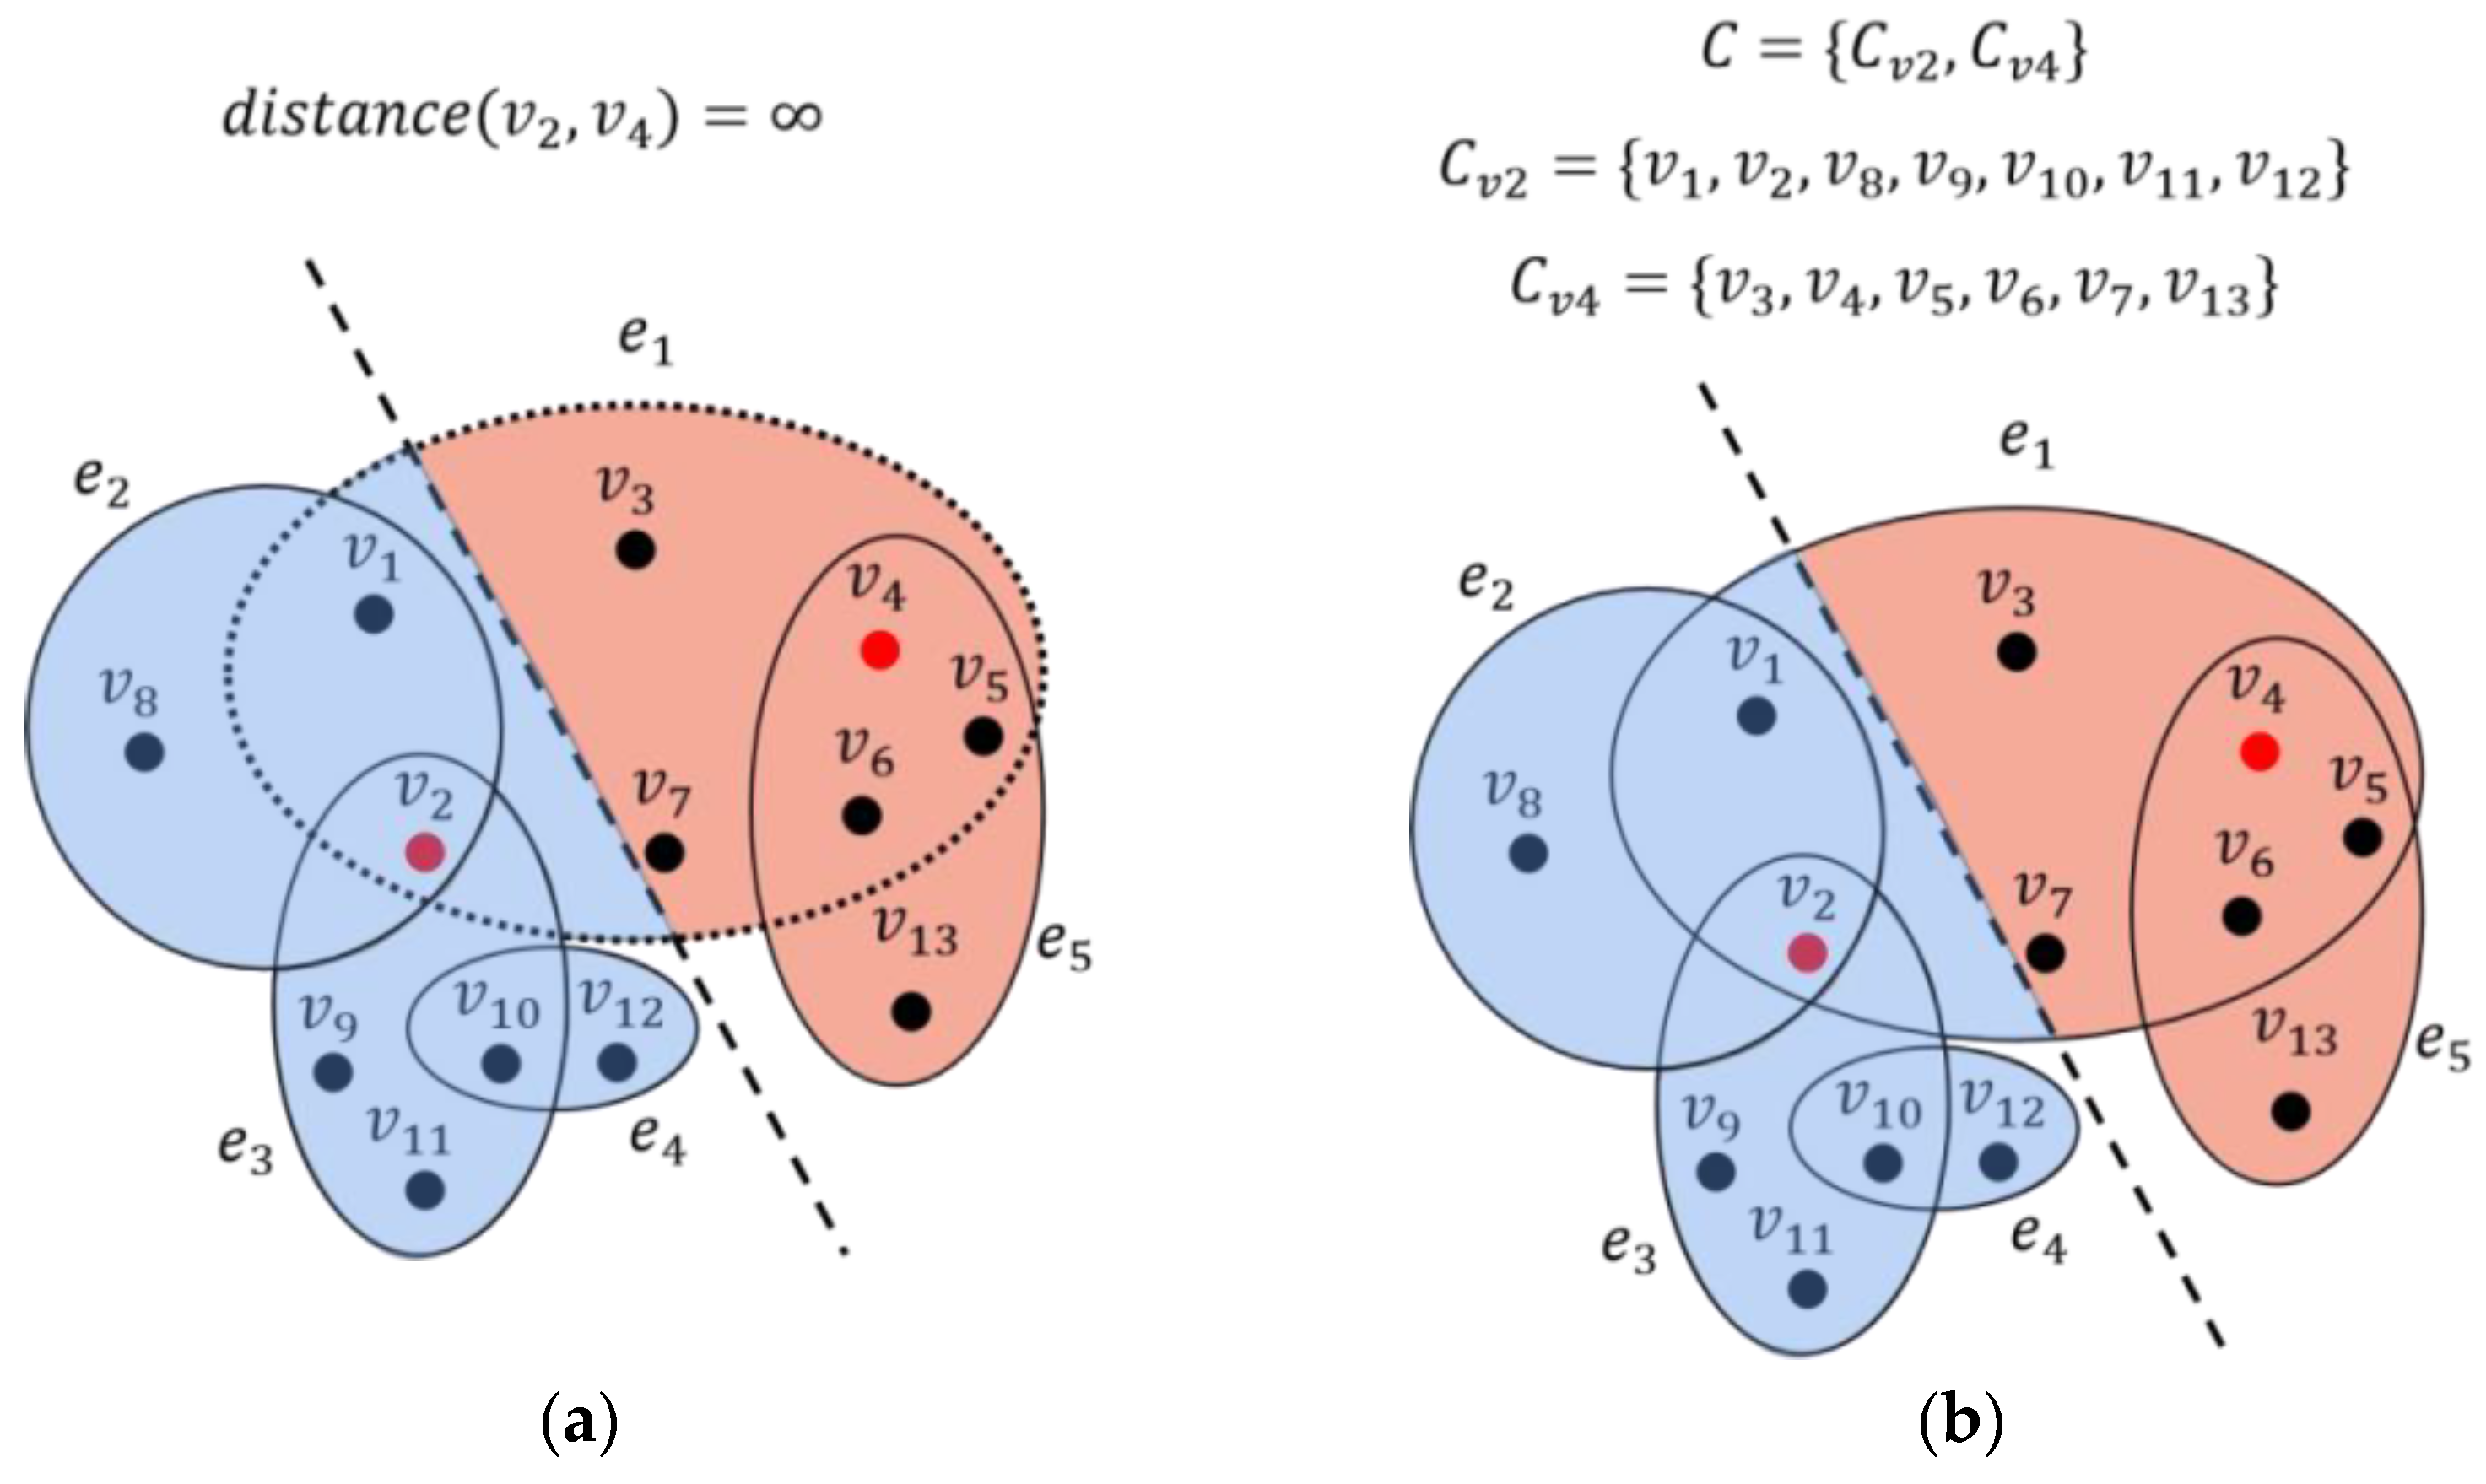
3.2. Global Fusion Process

GF process is displayed in Algorithm 2. The GF process first sorts the multiple sub-hypergraphs obtained from the LE process in ascending order according to the number of nodes contained, and obtains the seed node for the corresponding sub-hypergraph. Then, it sequentially selects a sub-hypergraph C c u r , the corresponding seed node is s n c u r . Based on the distance between different seed nodes on hypergraph H 2 , we can find the sub-hypergraph C p o r b corresponding to the shortest distance. If the shortest distance is less than the threshold τ , C c u r is merged into C p o r b and the sub-hypergraph C c u r and its corresponding seed node s n c u r are deleted. This process continues until there are no more sub-hypergraphs that can be merged, resulting in the final community detection result. We let τ = 2 % in this paper which is consistent with the conclusion of Rodriguez and Laio [29]. The specific process is as follows: calculate the distance between all seed nodes in each sub-hypergraph, select the top 2% of distances, and if the distance between two sub-hypergraphs’ seed nodes is greater than 2%, these two sub-hypergraphs will not be merged.
Algorithm 2: GF algorithm
Start GF
Input: Hypergraph H 2 and the sub-hypergraphs C obtained by the LE process, the threshold τ .
Output: The final communities C f i n
1: Sort C in increasing order based on the size of different sub-hypergraphs
2: Get the corresponding seed node as SN
3: for  C c u r in C   :
4: Get seed node s n c u r that corresponds to the current sub-hypergraph C c u r
5: Get C p o r b based on m i n d i s t a n c e s n c u r , s n p r o b from the hypergraph H 2
6: If  d i s t a n c e s n c u r , s n p r o b < τ
7: Merge C c u r into C p o r b
8: C = C C c u r
9: S N = S N s n c u r
10: End if
11: End for
12: C f i n = C
13: return C f i n
End GF
Assuming that Algorithm 1 generates the number of sub-hypergraphs as c , the time complexity of Algorithm 2 is O c 2 . The specific process is shown in Figure 3.
After the local expansion process, the hypergraph is divided into two sub-hypergraphs, namely, C v 2 and C v 4 , corresponding to the seed nodes v 2 and v 4 . Since the hyperedge e 1 (denoted by a dashed dotted line) was deleted in the hypergraph H 2 , there is no path between v 2 and v 4 , and the distance is infinite, as shown in Figure 3a. Therefore, the two sub-hypergraphs cannot be merged, and the final community obtained is C = C v 2 , C v 4 , where C v 2 = v 1 , v 2 , v 8 , v 9 , v 10 , v 11 , v 12 , C v 4 = v 3 , v 4 , v 5 , v 6 , v 7 , v 13 , as shown in Figure 3b.

4. Experimental Results and Analysis

4.1. Dataset

We use the dataset of southern women hypernetwork and random hypernetwork to verify the feasibility of the algorithm. In addition, the dataset of drug-targets hypernetwork was used to partition drugs with similar functions into a community, which enabled us to mine drug modules. The details of these datasets were displayed in Table 1.

4.2. Evaluate Metrics

The Rand Index (RI) and Normalized mutual information (NMI), as two classical metrics, can consider both similarity within and between communities, thus allowing a more comprehensive evaluation of the quality of community divisions. Moreover, because both the real-world hypernetwork and random hypernetworks used in this paper have known community structure, NMI and RI are more appropriate than indicators such as modularity. We therefore used these two indicators to represent the effectiveness of the algorithm in this paper.
The RI is defined as follows:
R I = T P + T N T P + F P + F N + T N
The RI consists of four terms: TP, TN, FP, and FN. Where TP represents the number of nodes that belong to the same community in both the experimental results and the true data. TN represents the number of nodes that belong to different communities in both the experimental results and true data. FP represents the number of nodes that belong to different communities in the true data but are assigned to the same community in the experimental results. FN represents the number of nodes that belong to the same community in the true data but are assigned to different communities in the experimental results. The RI ranges from 0 to 1, a value closer to 1 indicates better agreement with the actual partition, while a value of 0 indicates the complete opposite, and a value of 1 indicates complete agreement.
The N M I is defined as follows:
N M I X , Y = 2 I X , Y H X + H Y      
where, I X , Y = H X H ( X Y ) , H X = x P x l o g P x is the Shannon entropy of X , and H ( X Y ) = x , y P x , y l o g P ( x y ) is the conditional entropy of X given Y . The NMI equals 1 if and only if the partitions are identical, whereas it has an expected value of 0 if they are independent.

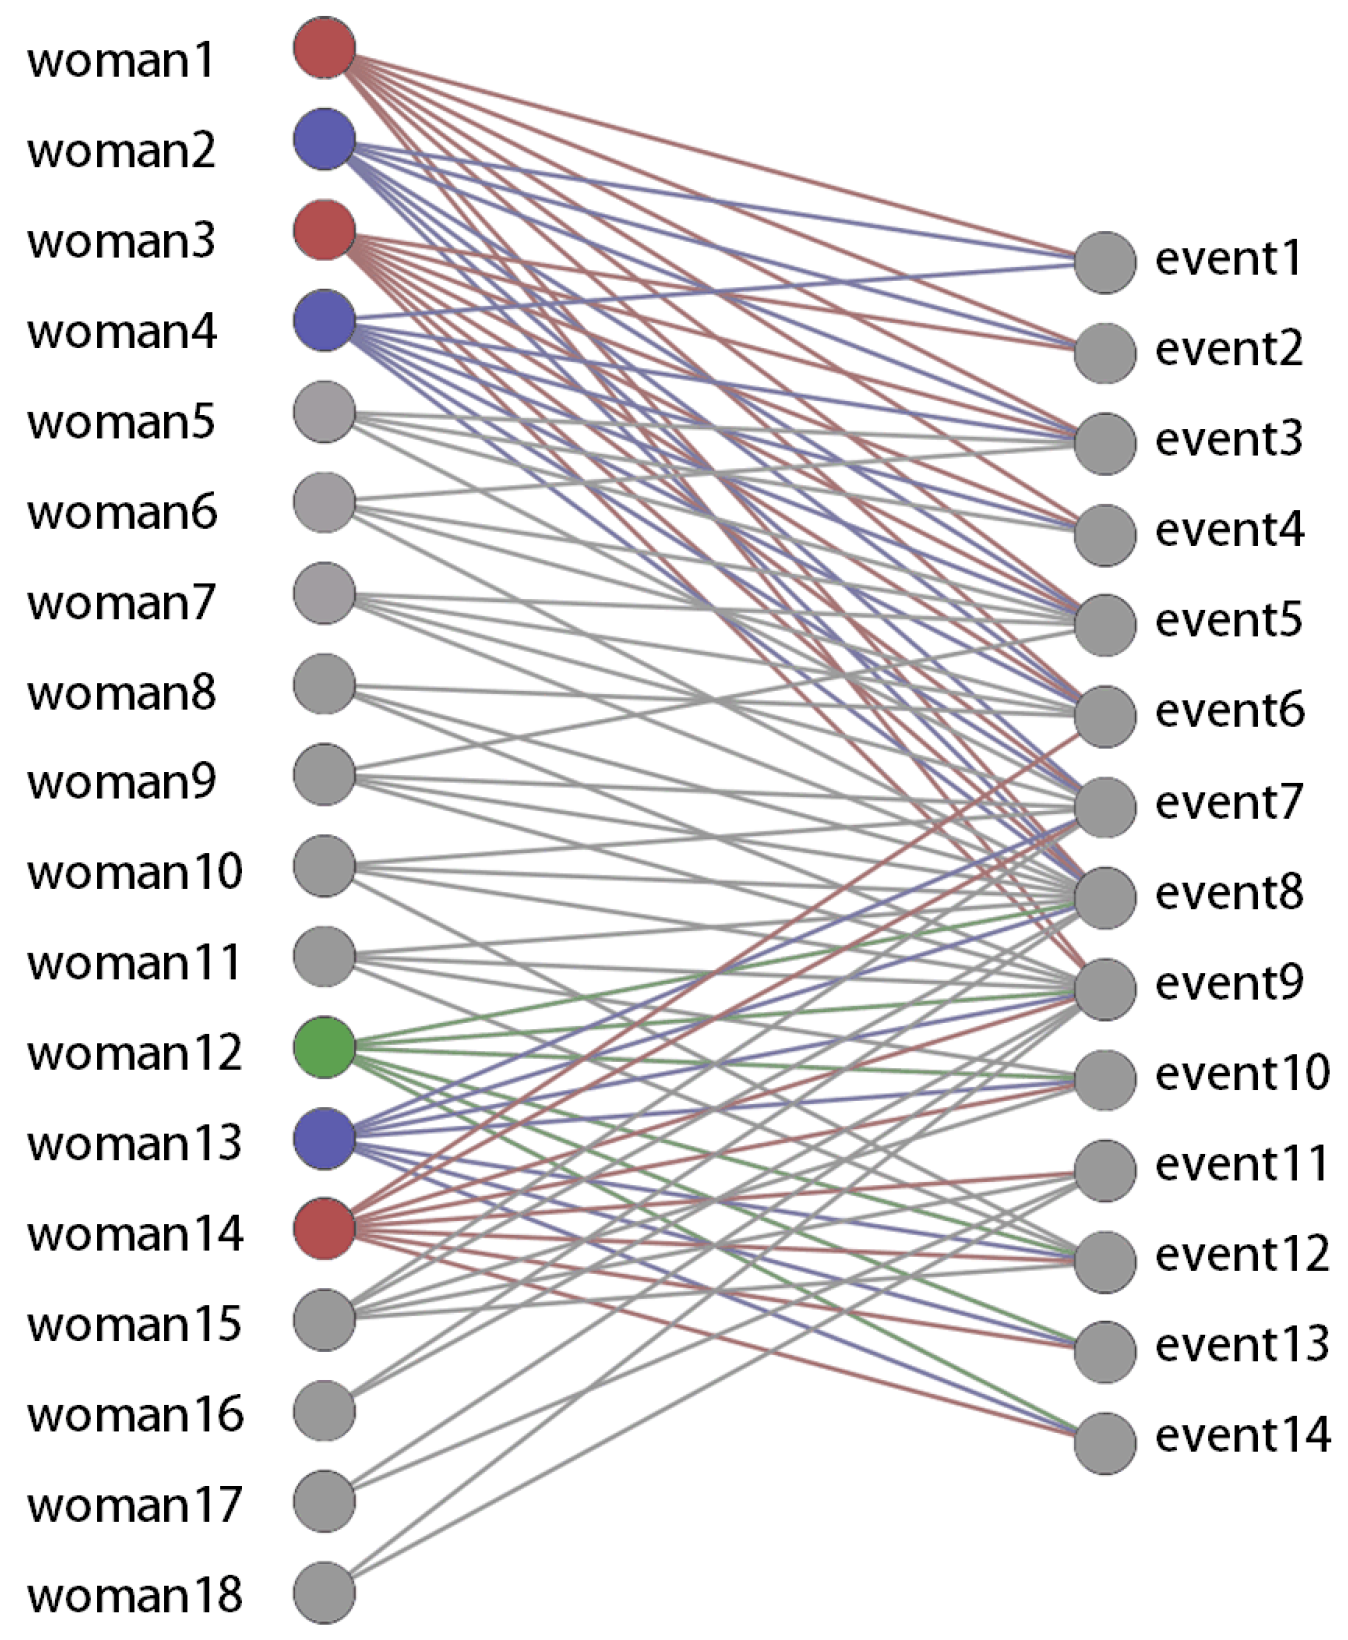
4.3. Southern Women Hypernetwork

We considered a real-world hypernetwork with community structure, namely the Southern Women hypernetwork, which is a social network. Table 1 provides details about this dataset. We compared the HLEGF algorithm with four different algorithms to verify the feasibility of the algorithm.
Figure 4 illustrates the Southern Women hypernetwork, which includes 18 women and 14 social events. The original data were collected by Davis [30]. For our analysis, we treat the 18 women as nodes and the 14 social events as hyperedges to construct the hypernetwork. The hypernetwork can be represented as a bipartite graph, as shown in Figure 4, where the women are listed on the left and the social events are listed on the right. An edge is established between a woman and a social event in the bipartite graph if she participated in that event.
To facilitate description, we numbered the 18 women from 1 to 18. As the nodes within the same hyperedge are fully connected, we can convert the hypernetwork into an ordinary network. We then compared our HLEGF algorithm with the IRMM algorithm [31] and Spectral algorithm [32] in the hypernetwork, and the LPA algorithm [33] and GN algorithm [34] in the ordinary network.
We used the Rand Index to represent the effectiveness of the algorithms. The number of nodes in the Southern Women hypernetwork is very small, so we set the parameter α = 0.5 . Table 2 presents the community detection results of these algorithms in the Southern Women hypernetwork, as well as the actual result.
For ease of comparison, we bolded the HLEGF algorithm and its performance proposed in this paper. The result shows that the community detection algorithms for hypernetworks are generally better than those for ordinary networks, and the community detection results obtained by the HLEGF algorithm are completely consistent with the ground truth. Therefore, using this algorithm can correctly partition the 18 women.

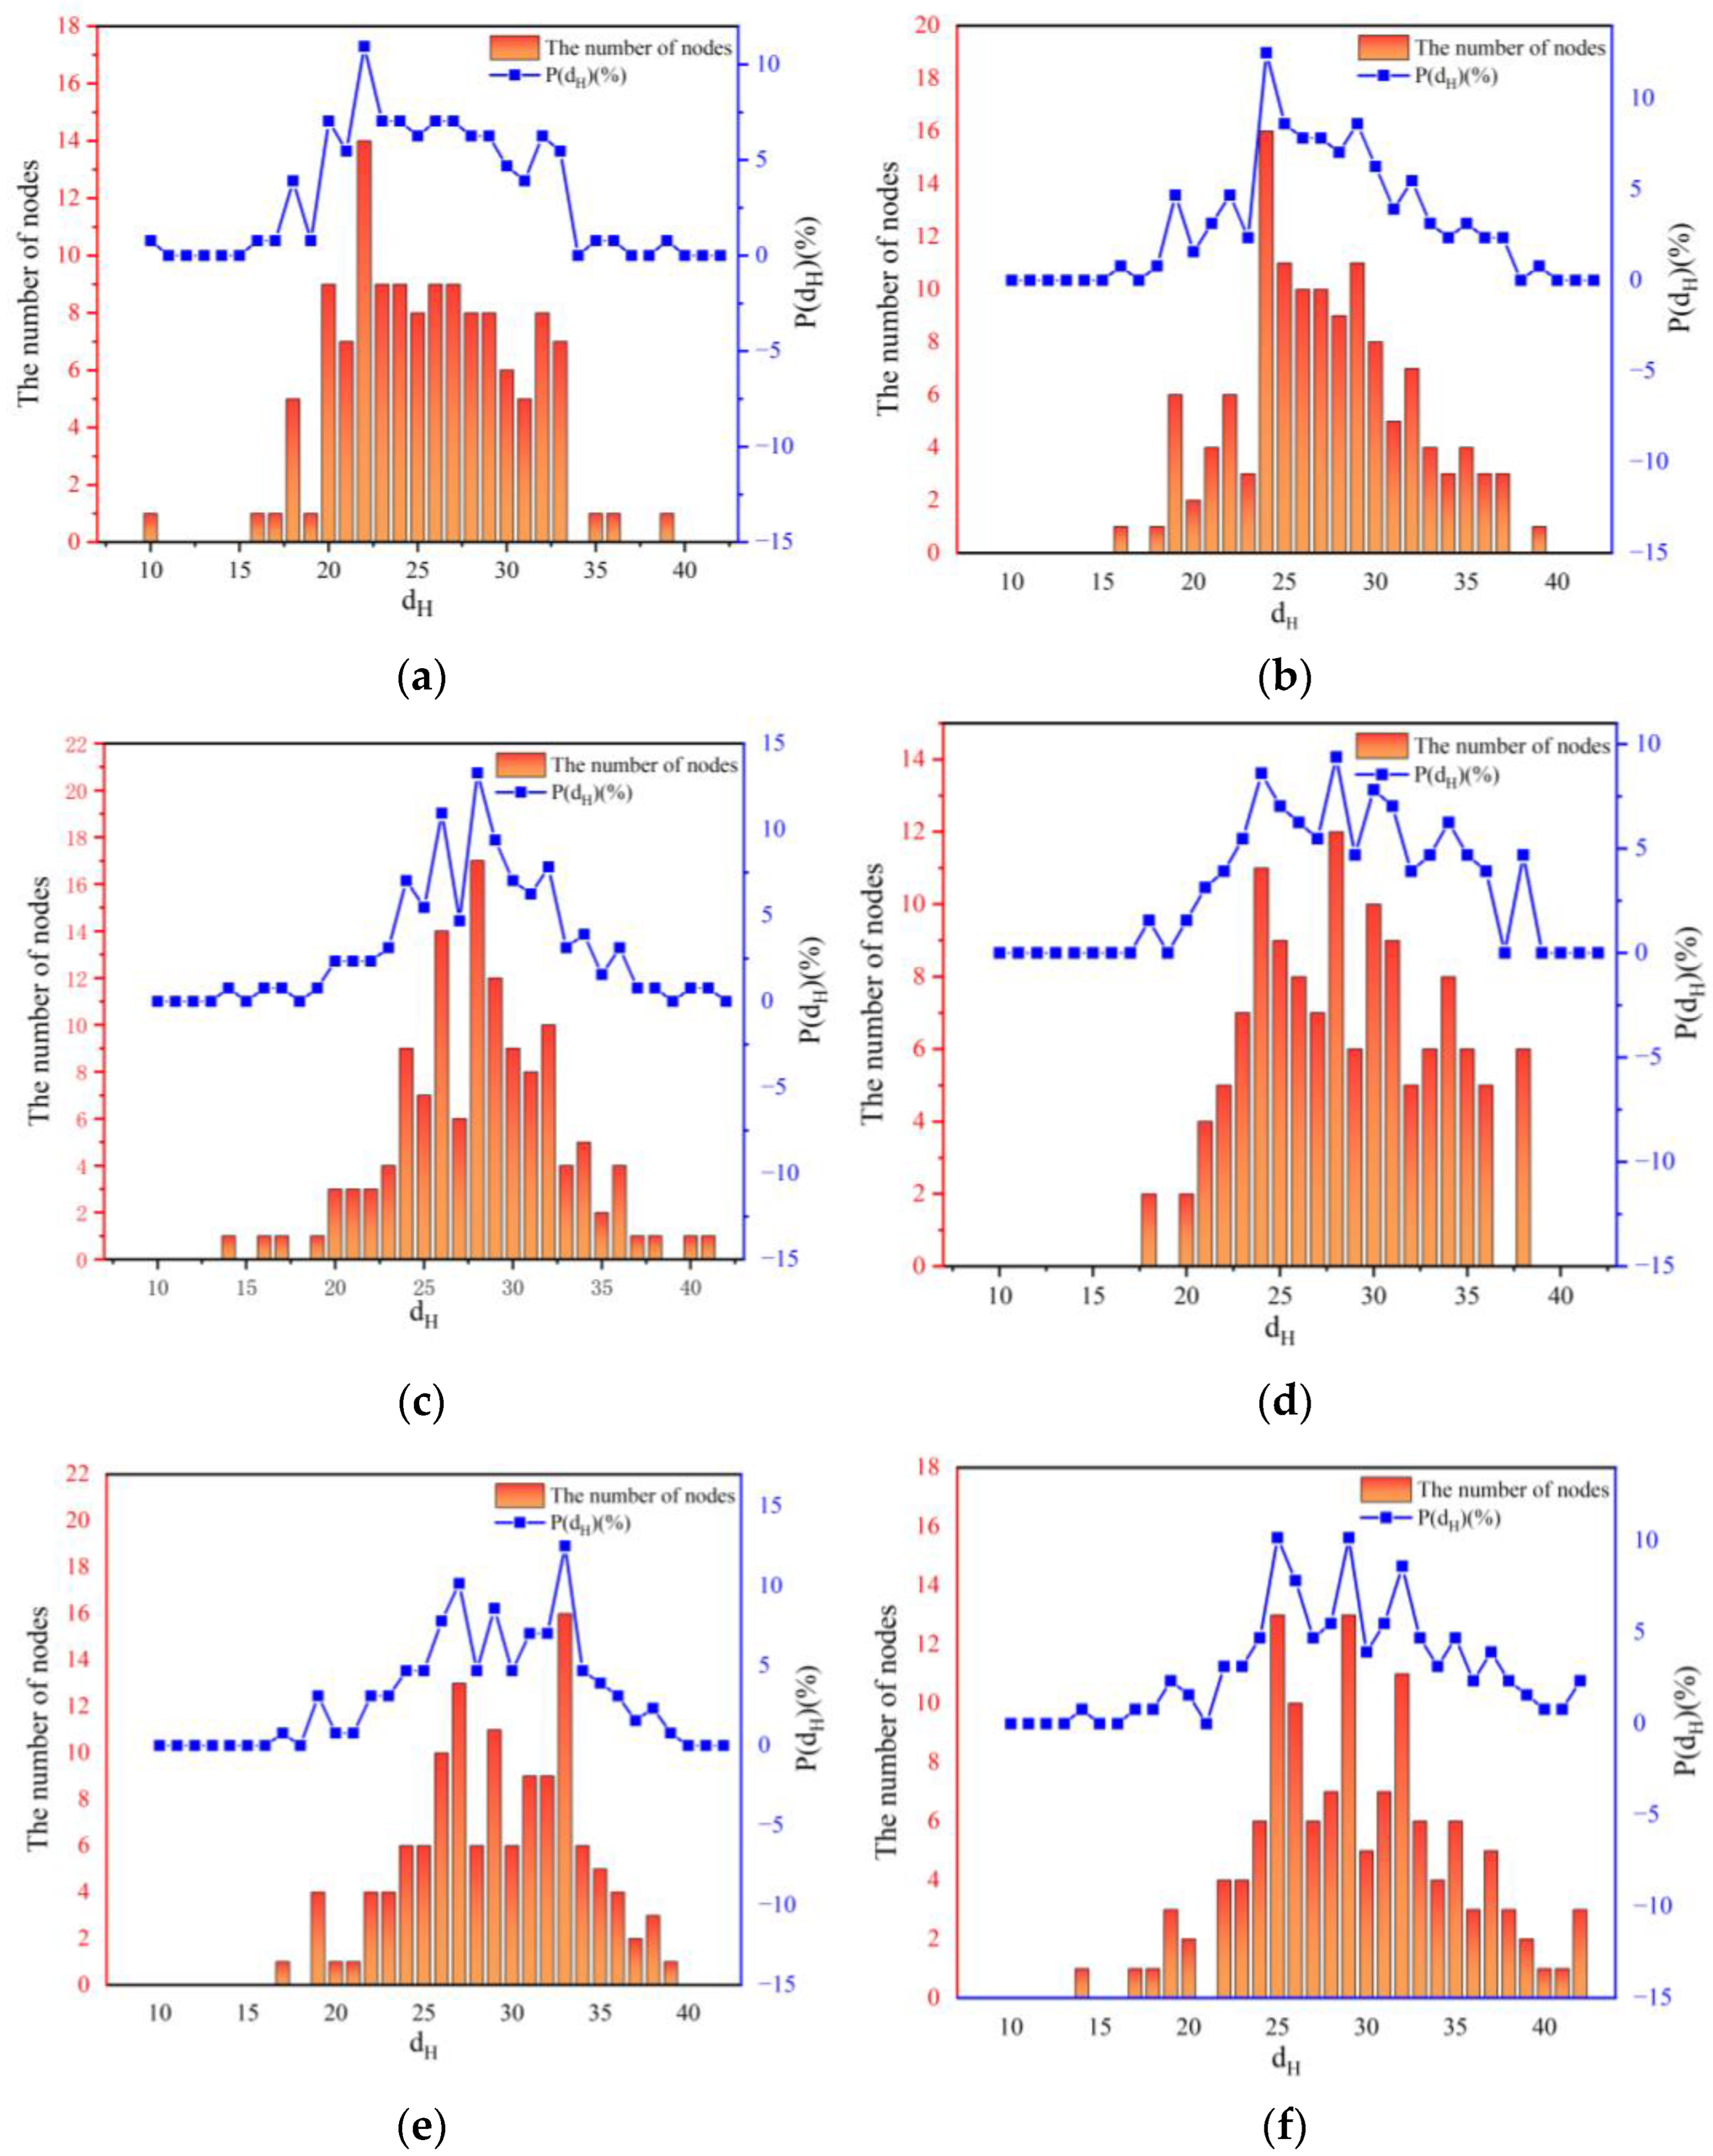
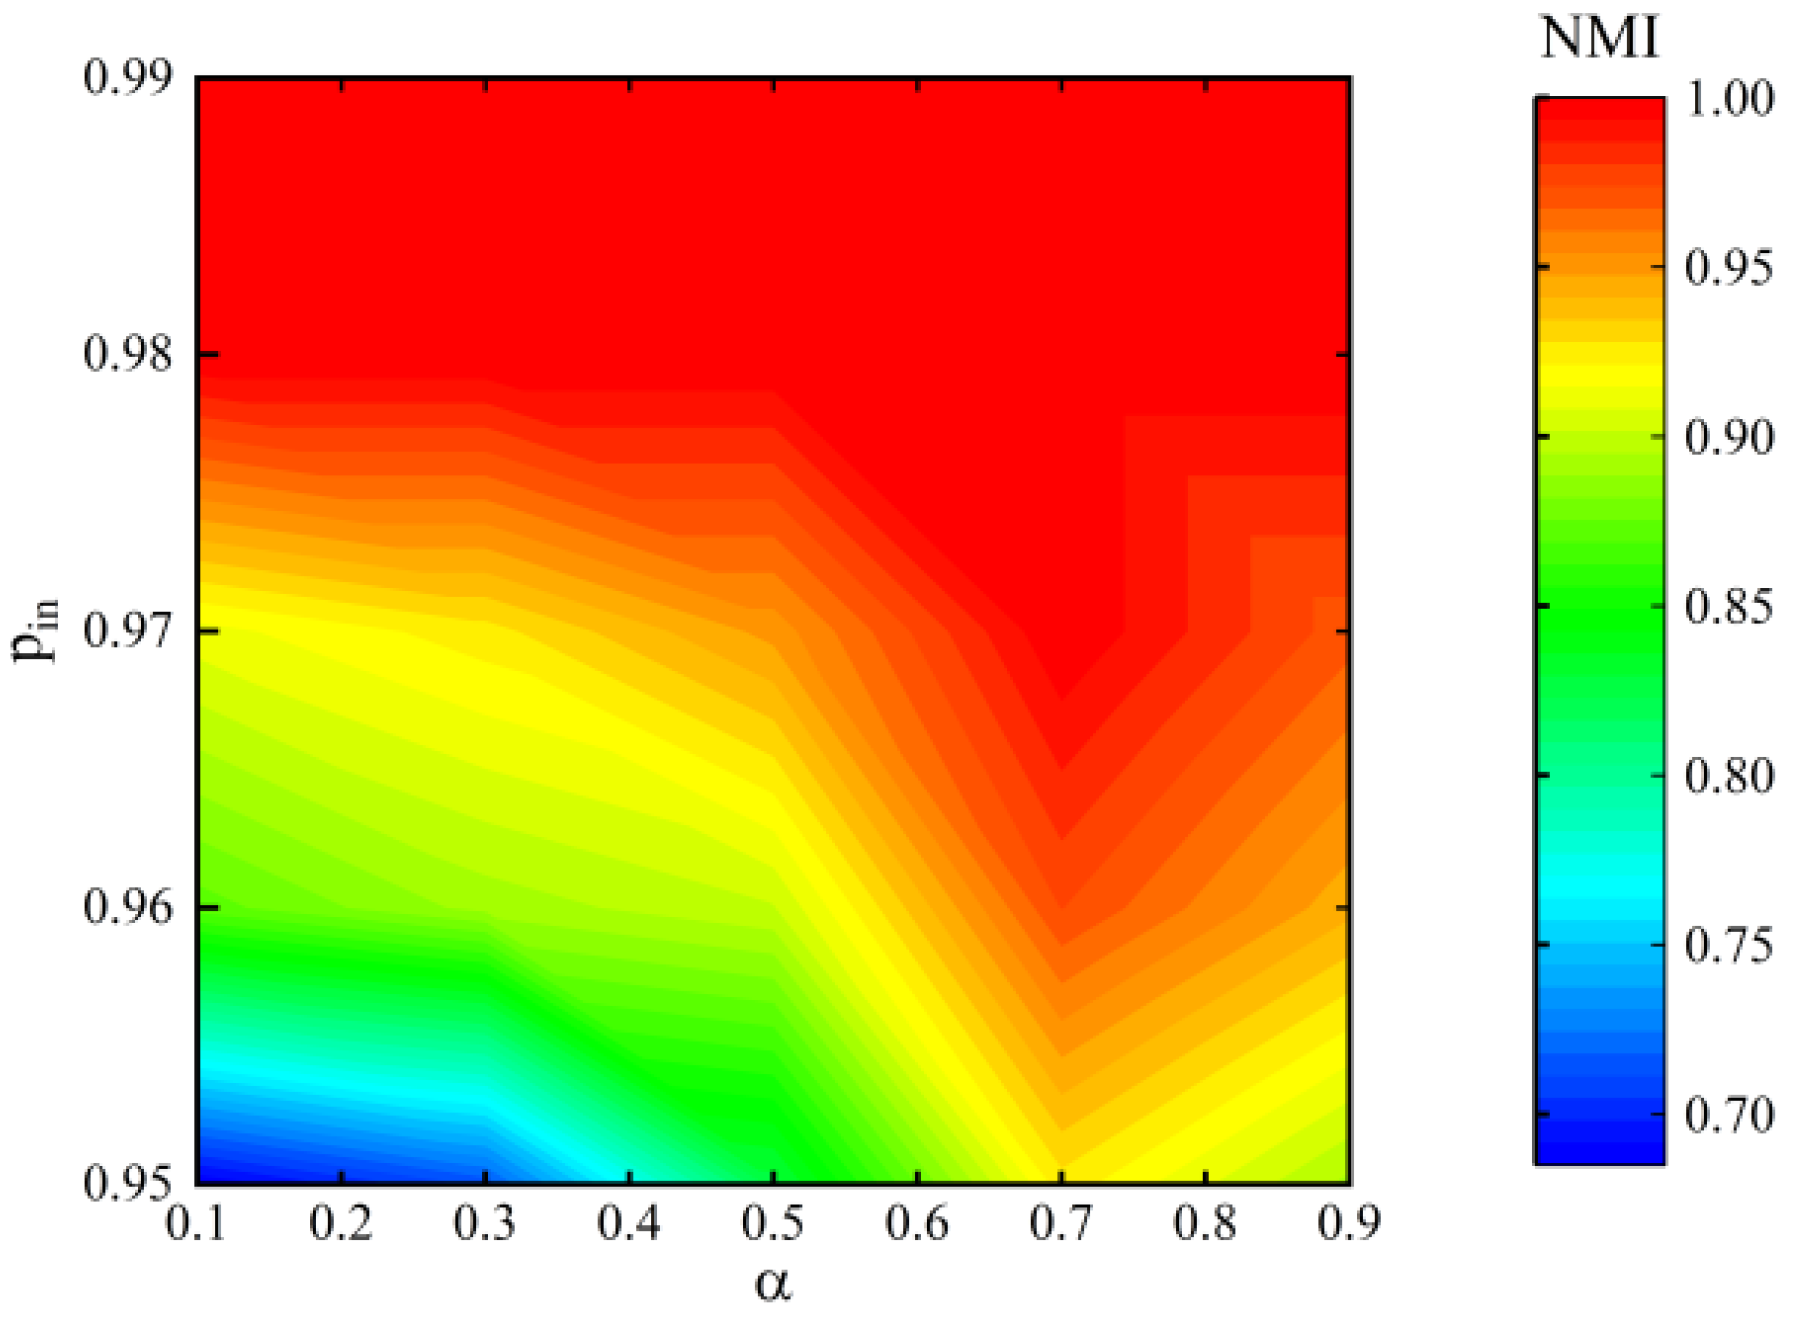
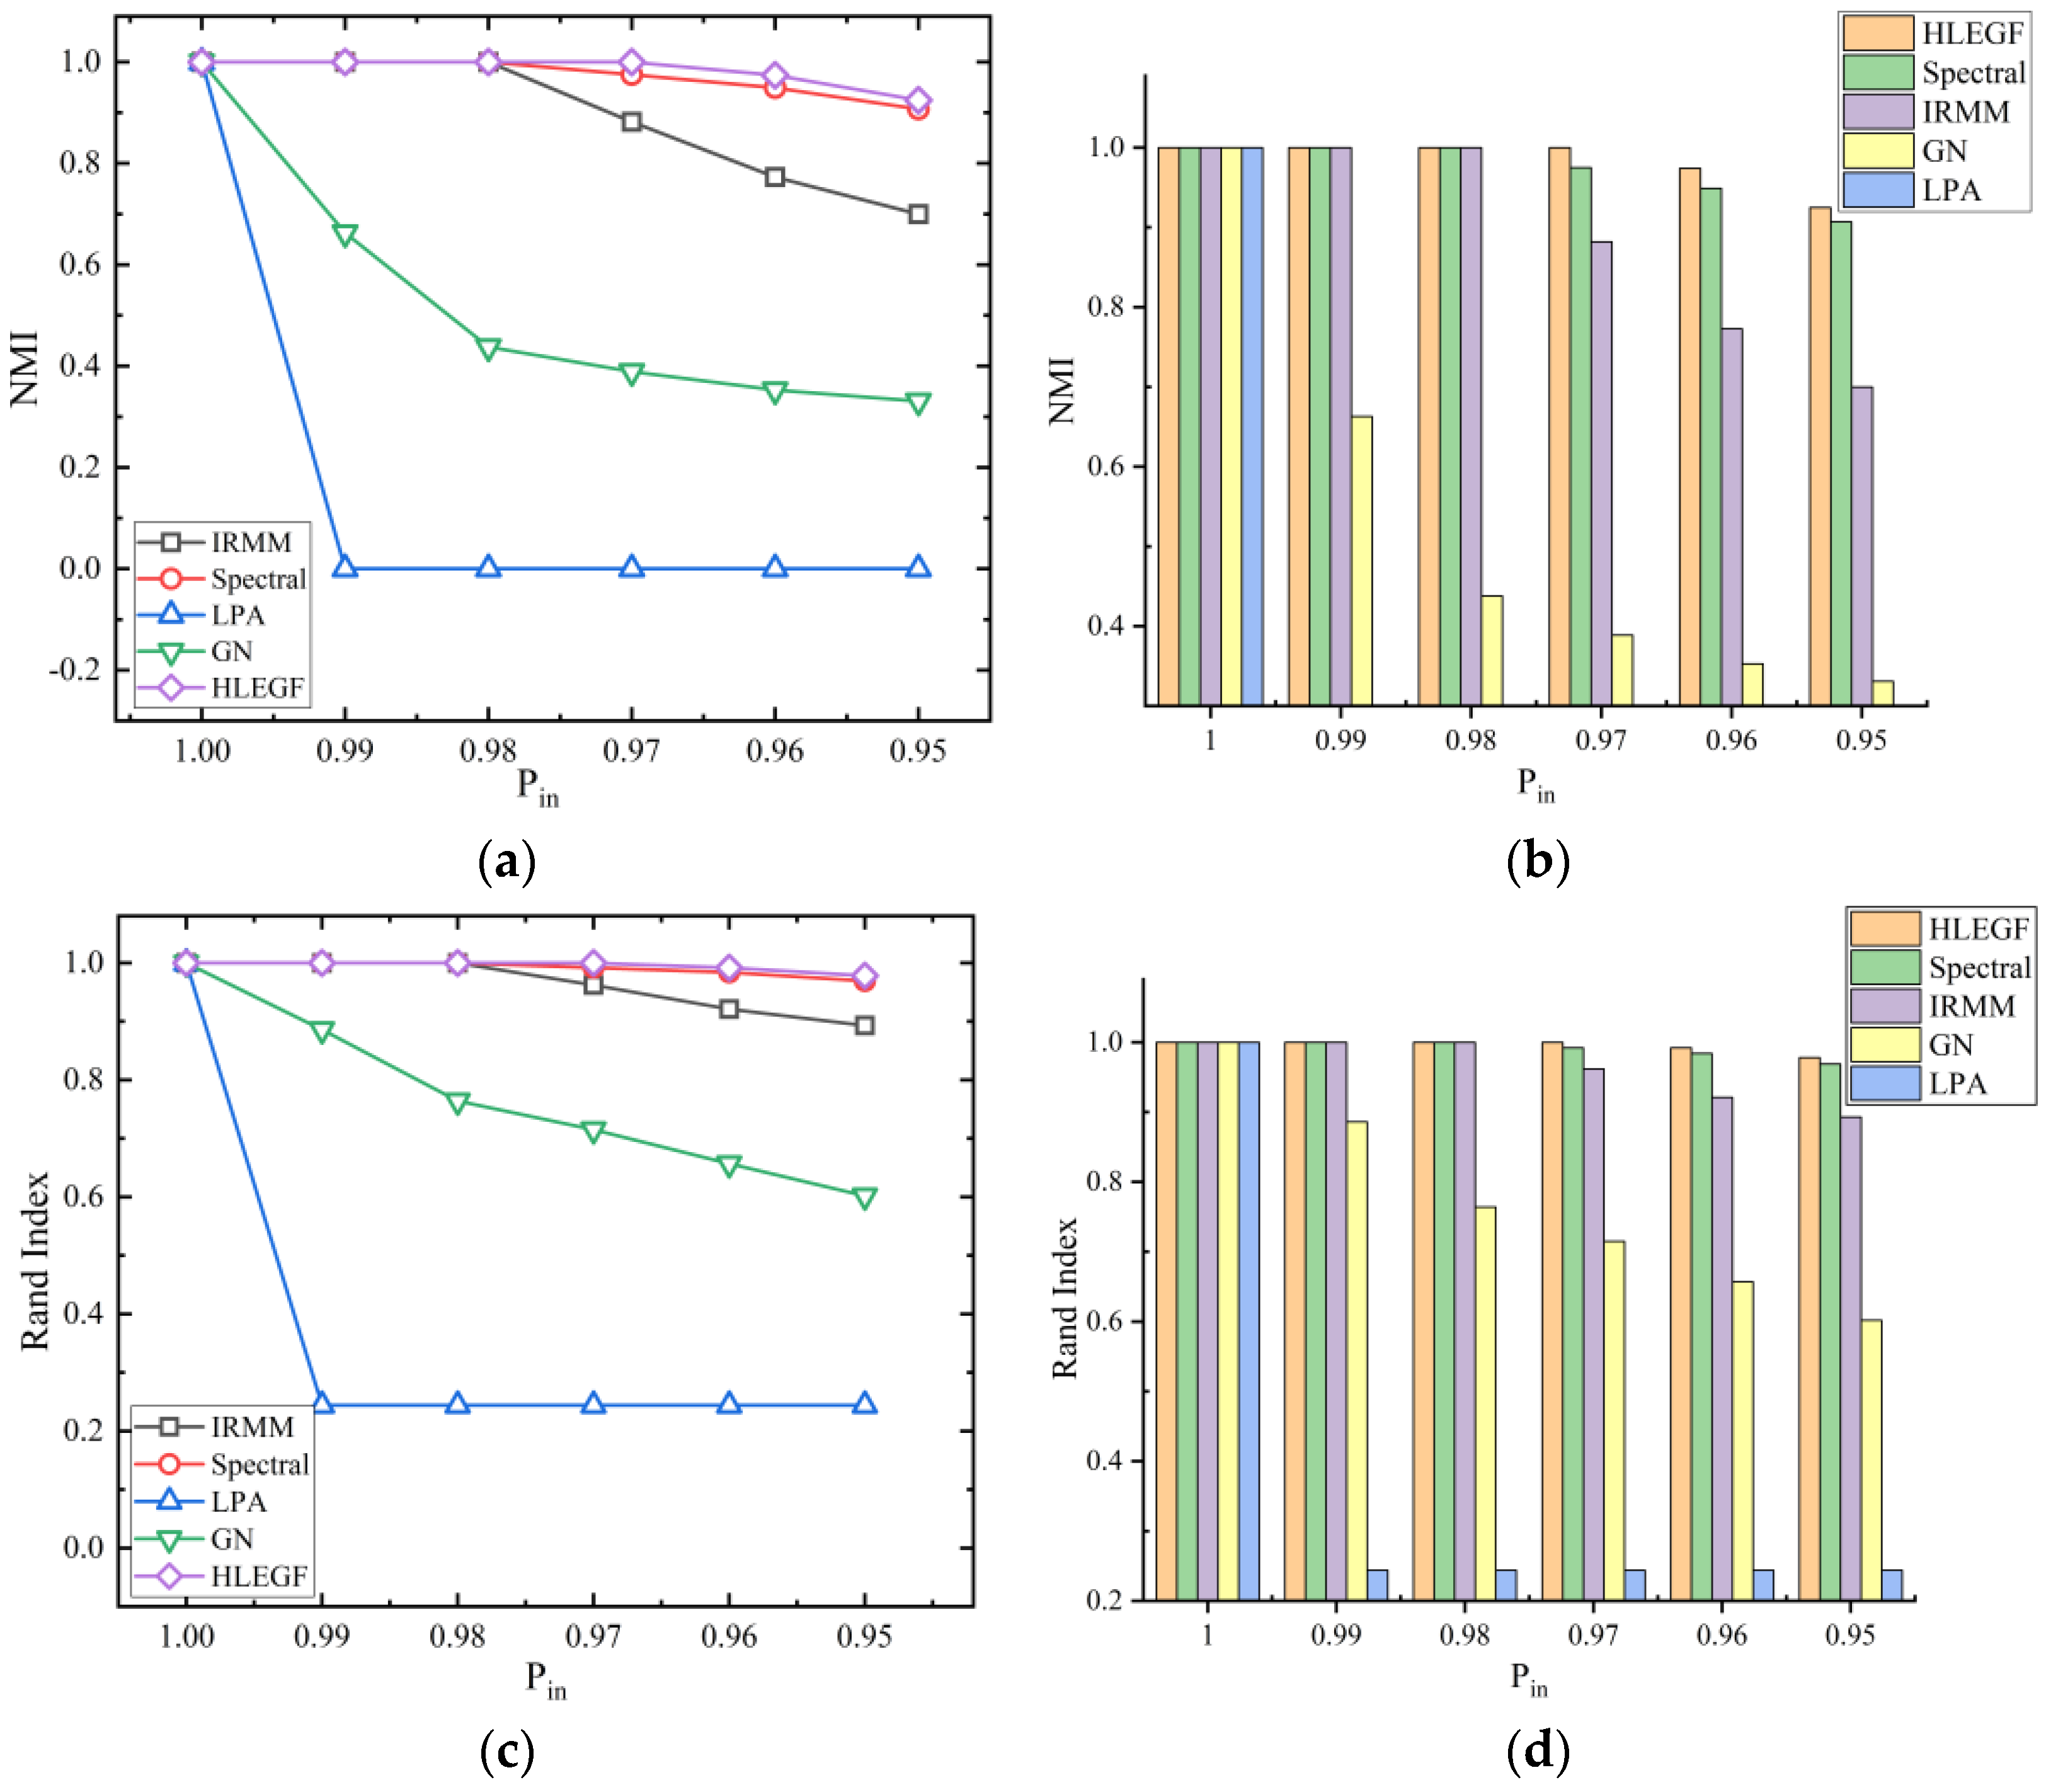
4.4. Random Hypernetwork

We constructed six synthetic random hypernetworks under different probabilities, with corresponding probabilities of 1, 0.99, 0.98, 0.97, 0.96, 0.95, respectively. These random hypernetworks have known community structure. Similarly, we compared the algorithm in this paper with the four algorithms in six random hypernetworks; the results showed that our algorithm has some advantages.
We first generated a random hypernetwork with a known community structure. The hypernetwork consisted of n nodes and K communities, where each community includes n k nodes. At each iteration, we randomly selected n v nodes ( n v < n m a x ). If the selected nodes belonged to the same community, they were connected by a hyperedge with a certain probability p i n , otherwise, they were connected with a probability p o u t , and p o u t = 1 p i n . We repeated the process until we generated a hypernetwork with m hyperedges.
In our experiments, we set n = 128 ,   K = 4 ,   n k = 32 ,   n m a x = 5 ,   m = 1000 , then six hypernetworks under different probabilities p i n = 0.95 ,   0.96 ,   0.97 ,   0.98 ,   0.99 ,   1.00 were constructed. The hyperdegree distribution curves of the resulting hypernetworks are shown in Figure 5.
As shown in Figure 5, under different probabilities, most nodes are included in 25 to 30 hyperedges.
We used the Rand Index and NMI indicators to evaluate the experimental effect. To investigate the effect of the parameter α on NMI, we varied the value of α (between 0.1 and 0.9) and the value of probability (between 0.95 and 0.99). Figure 6 shows that, when the probability p i n 0.97 , the community structure in the hypernetwork is obvious, and the community detection results are consistent with the actual situation, regardless of the value of α . However, when the probability p i n < 0.97 , a higher NMI value is achieved at a value of α 0.7 , indicating that the best community detection results are obtained at α 0.7 . Therefore, we set the parameter α = 0.7 for subsequent experiments.
Since all nodes within the same hyperedge are fully connected in the hypernetwork, we can obtain ordinary networks under different probabilities. In Figure 7, we present the performance of five algorithms on these hypernetworks.
The IRMM algorithm, Spectral algorithm, and our HLEGF algorithm directly partition the hypernetwork into communities, while the LPA algorithm and GN algorithm partition the ordinary network corresponding to the hypernetwork into communities. We used the Rand Index and NMI as indicators to evaluate the experimental results.
Figure 7a,b provide an intuitive representation of the changes in NMI values of the five algorithms under different probabilities, while Figure 7c,d depict the changes in Rand Index values of the algorithms under different probabilities p i n . The results show that, when the probability p i n = 1 , only nodes within the same community are connected by hyperedges in the current hypernetwork, and the community structure is obvious. Therefore, all five algorithms can accurately partition all nodes. As the probability p i n decreases and p o u t increases, nodes between different communities are connected with a certain probability p o u t , and the community structure gradually becomes less distinct. When 0.98 p i n < 1 , three algorithms used for the hypernetworks perform well, while the LPA and GN algorithms used for ordinary networks show significant disadvantages. When p i n = 0.97 , the Index and NMI values of the IRMM algorithm decrease significantly, and the partition results of the Spectral algorithm also produce some errors. However, our HLEGF algorithm can still accurately identify the communities in the current hypernetwork. When the probability p i n is reduced from 0.97 to 0.95, our algorithm outperforms the Spectral algorithm slightly, indicating that our algorithm has some advantages.

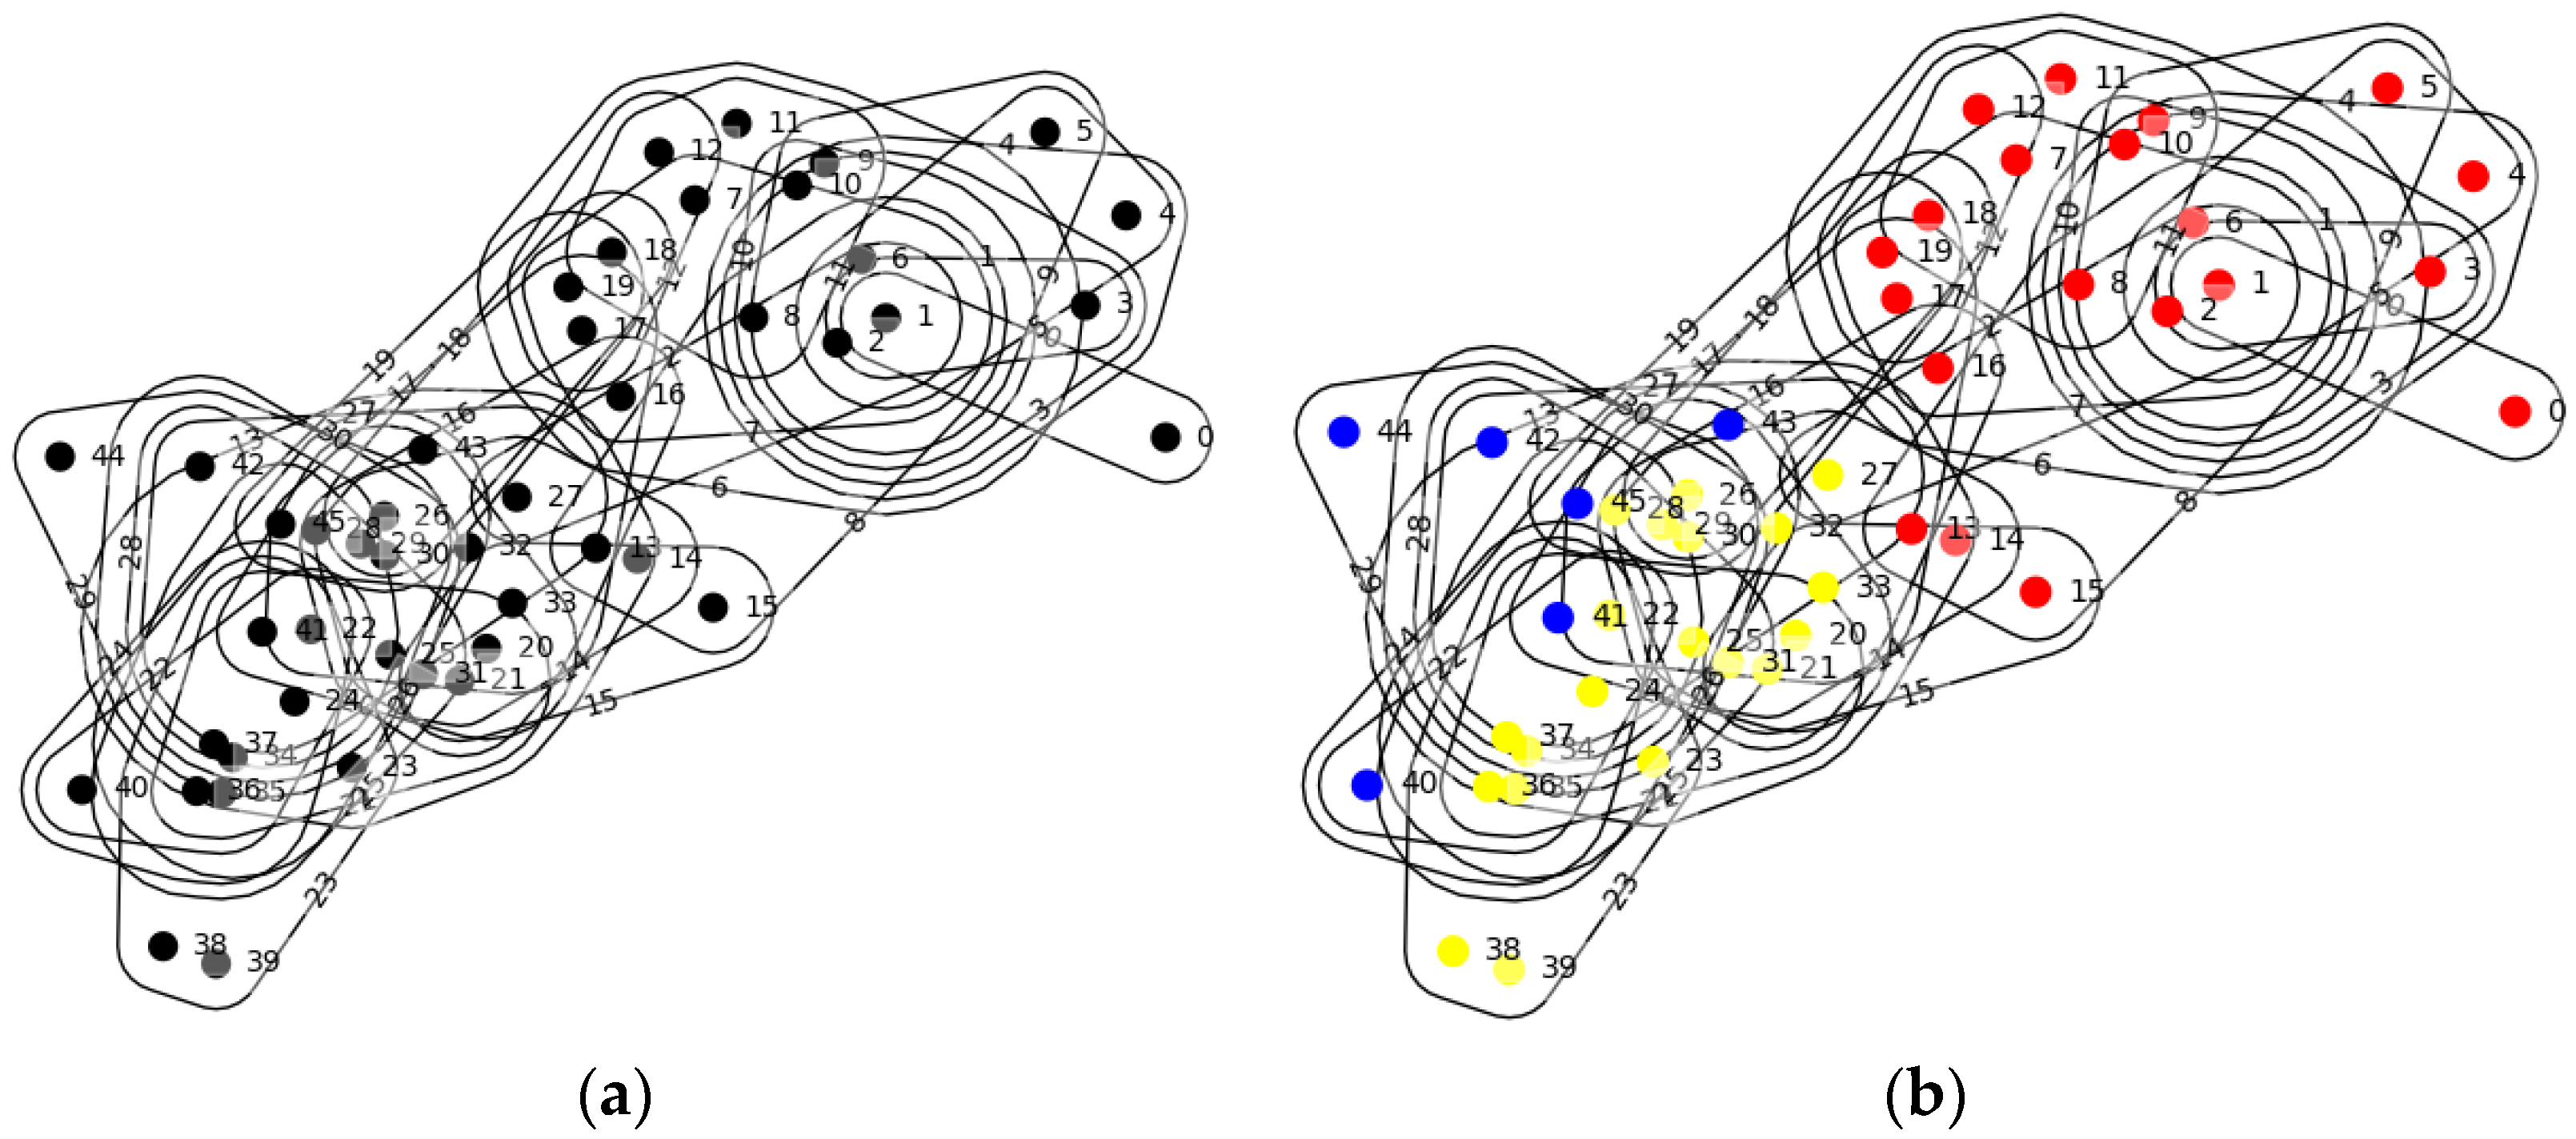
4.5. Drug–Targets Hypernetwork

After verifying the feasibility of the algorithm, we applied the HLEGF algorithm to a relatively large drug–target hypernetwork to detect communities and identify multiple drug modules.
We obtained drug and target information from the DrugBank database, which included 825 FDA-approved drugs and 4871 targets. We constructed a drug–target hypernetwork with 825 nodes and 4871 hyperedges, where hyperedges included drugs that act on the same target. Because this hypernetwork has a large size, we present only a portion of it in Figure 8a.
Figure 8a displays a partial diagram of the drug–target hypernetwork, which contains 46 nodes and 31 hyperedges. The nodes are numbered from 0 to 45, with each node representing a drug. We provide the corresponding drug and target information for the nodes and hyperedges shown in Figure 8a in Table 3.
After constructing the drug–target hypernetwork, we applied our algorithm to partition the 825 drug nodes into communities. The results indicated that 825 drugs were divided into 76 communities, with an average of approximately 10 drugs per community. For instance, the 46 drugs mentioned in Table 3 were divided into three communities in the partial diagram shown in Figure 8a, as demonstrated in Figure 8b.
The first type of nodes is represented in red and corresponds to drugs such as Chromous sulfate, Human C1-esterase inhibitor, Iron, Ferrous gluconate, and Ocriplasmin, which are mainly used to treat blood-related diseases. For example, Chromous sulfate and Human C1-esterase inhibitor can improve lipid metabolism, Iron is used for coagulation, Ferrous gluconate is used for iron-deficiency anemia, and Ocriplasmin is used as a human plasma protein. The second category of nodes is represented in yellow and corresponds to drugs such as Lorazepam, Etomidate, Carisoprodol, Zolpidem, and Oxazepam, which are mainly used to treat neurological excitability. For instance, Lorazepam and Oxazepam are used to treat anxiety and depression, Etomidate is used as a short-acting anesthetic or sedative, Carisoprodol has sedative and anti-anxiety effects, and Zolpidem is used as a hypnotic for short-term treatment of insomnia. The third category of nodes is represented in blue and corresponds to drugs such as Medrysone, Levomenthol, Nifedipine, and Quinidine barbiturate, which all have inhibitory effects and their target receptors that can be detected in the brain, retina, heart, and vascular system. For example, Medrysone is a locally applied corticosteroid that can be used to inhibit edema, Levomenthol is a stimulant with sliding motion inhibitory effects, Nifedipine inhibits calcium ion influx and can treat angina pectoris, and Quinidine barbiturate directly acts on the myocardial cell membrane as a membrane-inhibiting anti-arrhythmic drug.
The experimental results demonstrated that the HLEGF algorithm was able to partition drugs with similar functions into a community, which enabled us to mine drug modules. This outcome showcased the practical application value of our algorithm and established a foundation for future drug development and target identification.

5. Conclusions and Discussion

In this paper, we aim to design a community detection algorithm applicable to hypernetworks. To overcome two limitations of the local extension method, we introduce the definition of community boundary and neighborhood and propose the HLEGF algorithm, which is based on local expansion and global fusion. We validated our algorithm on a real hypernetwork and six synthetic random hypernetworks with different probability, the results showed that our algorithm is close to the classical Spectral algorithm result, and in some cases, our algorithm slightly outperforms the Spectral algorithm. Further analysis shows that the Spectral algorithm represents a network as a Laplacian matrix, and obtains the community structure in the network by performing eigenvalue decomposition and eigenvector analysis on the Laplacian matrix. The value of the eigenvector can be interpreted as the importance of the node in the community, and the similarity between eigenvectors reflects the similarity between nodes. Our algorithm also judges the importance of nodes in the network and conducts community detection based on the definition of similarity. Both algorithms detect communities based on the local structure of the network, so the results are approximate. However, for nodes that are highly clustered but do not belong entirely to a community, the HLEGF algorithm can assign them reasonably to a community, while Spectral analysis may classify them as isolated nodes or noise. Therefore, the HLEGF algorithm is slightly better than the Spectral method. After verifying the effectiveness of the algorithm, we applied the HLEGF algorithm to the drug–target hypernetwork and realized the mining of drug modules.
Despite the efficacy of our HLEGF algorithm in detecting community structures of hypernetworks, it still has some flaws. Through inspection and analysis, it was found that the algorithm is not ideal for overlapping community detection. The next step is to use and enhance the HLEGF algorithm so that it can be applied to overlapping and large-scale hypernetworks. In addition, we will consider the effect of medicine doses on community detection based on the existing studies. We hope that our algorithm will have practical significance in other fields as well.

Author Contributions

Investigation, F.W.; Resources, F.H. and N.X.; Methodology, F.W., R.C. and F.H.; Software, F.W. and R.C.; Validation, R.C., F.H. and N.X.; Formal analysis, F.W.; Writing—original draft preparation, F.W.; Writing—review and editing, F.H. and N.X.; Supervision, F.H. All authors have read and agreed to the published version of the manuscript.

Funding

This paper was supported by the project: The National Natural Science Foundation of China (Grant No. 61663041) and the Basic Research Program of Qinghai Province (Grant No. 2023-ZJ-916M).

Data Availability Statement

The data used in this work can be access via: https://go.drugbank.com/releases/latest, accessed on 1 February 2022.

Conflicts of Interest

The authors declare no conflict of interest.

References

  1. Huang, S.; Zeng, Z.; Ota, K.; Dong, M.; Wang, T.; Xiong, N.N. An intelligent collaboration trust interconnections system for mobile information control in ubiquitous 5G networks. IEEE Trans. Netw. Sci. Eng. 2020, 8, 347–365. [Google Scholar] [CrossRef]
  2. Watts, D.J.; Strogatz, S.H. Collective dynamics of ‘small-world’ networks. Nature 1998, 393, 440–442. [Google Scholar] [CrossRef] [PubMed]
  3. Barabási, A.L.; Albert, R. Emergence of scaling in random networks. Science 1999, 286, 509–512. [Google Scholar] [CrossRef] [Green Version]
  4. Girvan, M.; Newman, M.E.J. Community structure in social and biological networks. Proc. Natl. Acad. Sci. USA 2002, 99, 7821–7826. [Google Scholar] [CrossRef] [PubMed]
  5. Estrada, E.; Rodríguez-Velázquez, J.A. Subgraph centrality and clustering in complex hyper-networks. Physica A 2006, 364, 581–594. [Google Scholar] [CrossRef] [Green Version]
  6. Hu, F.; Zhao, H.X.; He, J.B.; Li, F.X.; Li, S.L.; Zhang, Z.K. An evolving model for hypergraph-structure-based scientific collaboration networks. Acta Phys. Sin. 2013, 62, 198901. [Google Scholar]
  7. Irving, D.; Sorrentino, F. Synchronization of dynamical hypernetworks: Dimensionality reduction through simultaneous block-diagonalization of matrices. Phys. Rev. E 2012, 86, 056102. [Google Scholar] [CrossRef] [Green Version]
  8. Sorrentino, F. Synchronization of hypernetworks of coupled dynamical systems. New J. Phys. 2012, 14, 033035. [Google Scholar] [CrossRef] [Green Version]
  9. Ghoshal, G.; Zlatić, V.; Caldarelli, G.; Newman, M.E. Random hypergraphs and their applications. Phys. Rev. E 2009, 79, 066118. [Google Scholar] [CrossRef] [Green Version]
  10. Zlatić, V.; Ghoshal, G.; Caldarelli, G. Hypergraph topological quantities for tagged social networks. Phys. Rev. E 2009, 80, 036118. [Google Scholar] [CrossRef] [Green Version]
  11. Cheng, Q.; Liu, Z.; Huang, J.; Cheng, G. Community detection in hypernetwork via density-ordered tree partition. Appl. Math. Comput. 2016, 276, 384–393. [Google Scholar] [CrossRef]
  12. Kamiński, B.; Prałat, P.; Théberge, F. Community detection algorithm using hypergraph modularity. In Proceedings of the International Conference on Complex Networks and Their Applications, Madrid, Spain, 1–3 December 2020; pp. 152–163. [Google Scholar]
  13. Chodrow, P.S.; Veldt, N.; Benson, A.R. Generative hypergraph clustering: From blockmodels to modularity. Sci Adv. 2021, 7, eabh1303. [Google Scholar] [CrossRef]
  14. Larremore, D.B.; Clauset, A.; Jacobs, A.Z. Efficiently inferring community structure in bipartite networks. Phys. Rev. E 2014, 90, 012805. [Google Scholar] [CrossRef] [Green Version]
  15. Wu, W.; Kwong, S.; Zhou, Y.; Jia, Y.; Gao, W. Nonnegative matrix factorization with mixed hypergraph regularization for community detection. Inf. Sci. 2018, 435, 263–281. [Google Scholar] [CrossRef]
  16. Carletti, T.; Fanelli, D.; Lambiotte, R. Random walks and community detection in hypergraphs. J. Phys. Complex. 2021, 2, 015011. [Google Scholar] [CrossRef]
  17. Eriksson, A.; Carletti, T.; Lambiotte, R.; Rojas, A.; Rosvall, M. Flow-Based Community Detection in Hypergraphs. In Higher-Order Systems; Springer International Publishing: Berlin, Germany, 2022; pp. 141–161. [Google Scholar]
  18. Benson, A.R.; Abebe, R.; Schaub, M.T.; Jadbabaie, A.; Kleinberg, J. Simplicial closure and higher-order link prediction. Proc. Natl. Acad. Sci. USA 2018, 115, E11221–E11230. [Google Scholar] [CrossRef] [Green Version]
  19. Yang, Y.; Xiong, N.; Chong, N.Y.; Defago, X. A decentralized and adaptive flocking algorithm for autonomous mobile robots. In Proceedings of the 3rd International Conference on Grid and Pervasive Computing, Kunming, China, 25–28 May 2008. [Google Scholar]
  20. Ding, X.; Zhang, J.; Yang, J. Node-community membership diversifies community structures: An overlapping community detection algorithm based on local expansion and boundary re-checking. Knowl. Based. Syst. 2020, 198, 105935. [Google Scholar] [CrossRef]
  21. Chhabra, A.; Faraj, M.F.; Schulz, C. Local motif clustering via (hyper) graph partitioning. In Proceedings of the 2023 Symposium on Algorithm Engineering and Experiments (ALENEX), Florence, Italy, 22–23 January 2023. [Google Scholar]
  22. Guo, K.; He, L.; Chen, Y.; Guo, W.; Zheng, J. A local community detection algorithm based on internal force between nodes. Appl. Intell. 2020, 50, 328–340. [Google Scholar] [CrossRef]
  23. Ma, H.S.; Li, S.C.; Jian, Z.J.; Kuo, Y.H.; Huang, J.W. Local Community Detection by Local Structure Expansion and Exploring the Local Communities for Target Nodes in Complex Networks. J. Inf. Sci. Eng. 2021, 37, 499–515. [Google Scholar]
  24. Ding, X.; Zhang, J.; Yang, J. A robust two-stage algorithm for local community detection. Knowl. Based. Syst. 2018, 152, 188–199. [Google Scholar] [CrossRef]
  25. Ahn, S.; Couture, S.V.; Cuzzocrea, A.; Dam, K.; Grasso, G.M.; Leung, C.K.; McCormick, K.L.; Wodi, B.H. A fuzzy logic based machine learning tool for supporting big data business analytics in complex artificial intelligence environments. In Proceedings of the 2019 IEEE International Conference on Fuzzy Systems, New Orleans, LO, USA, 23–26 June 2019; pp. 1–6. [Google Scholar]
  26. Guo, W.; Wang, Y.; Gan, Y.; Lu, T. Energy efficient and reliable routing in wireless body area networks based on reinforcement learning and fuzzy logic. Wirel. Netw. 2022, 28, 2669–2693. [Google Scholar] [CrossRef]
  27. Behera, S.K.; Jena, L.; Rath, A.K.; Sethy, P.K. Disease classification and grading of orange using machine learning and fuzzy logic. In Proceedings of the 2018 International Conference on Communication and Signal Processing, Beijing, China, 12–16 August 2018; pp. 678–682. [Google Scholar]
  28. Boccaletti, S.; Lellis, D.P.; Genio, C.I.; Alfaro-Bittner, K.; Criado, R.; Jalan, S.; Romance, M. The structure and dynamics of networks with higher order interactions. Phys. Rep. 2023, 1018, 1–64. [Google Scholar] [CrossRef]
  29. Rodriguez, A.; Laio, A. Clustering by fast search and find of density peaks. Science 2014, 344, 1492–1496. [Google Scholar] [CrossRef] [PubMed] [Green Version]
  30. Davis, A.; Gardner, B.B.; Gardner, M.R. Deep South: A Social Anthropological Study of Caste and Class; University of Chicago Press: Chicago, IL, USA, 2022. [Google Scholar]
  31. Kumar, T.; Vaidyanathan, S.; Ananthapadmanabhan, H.; Parthasarathy, S.; Ravindran, B. Hypergraph clustering by iteratively reweighted modularity maximization. Appl. Netw. Sci. 2020, 5, 52. [Google Scholar] [CrossRef]
  32. Zhou, D.; Huang, J.; Schölkopf, B. Learning with hypergraphs: Clustering, classification, and embedding. In Advances in Neural Information Processing Systems 19; MIT Press: Cambridge, MA, USA, 2007; pp. 1601–1608. [Google Scholar]
  33. Raghavan, U.N.; Albert, R.; Kumara, S. Near linear time algorithm to detect community structures in large-scale networks. Phys. Rev. E 2007, 76, 036106. [Google Scholar] [CrossRef] [PubMed] [Green Version]
  34. Newman, M.E.J.; Girvan, M. Finding and evaluating community structure in networks. Phys. Rev. E 2004, 69, 026113. [Google Scholar] [CrossRef] [Green Version]
Figure 1. An example of hypergraph H . The hypergraph is formed by 13 nodes, one hyperedge of size 2, one hyperedge of size 3, two hyperedges of size 4, and one hyperedge of size 7. d v 2 = 10 , d H v 2 = 3 . d v 1 , v 2 = 1 ,   d v 1 , v 9 = 2 .
Mathematics 11 03497 g001
Figure 2. An example of the LE process. (a) Select node v 2 as the seed node and obtain its neighborhood, the node is marked in red; (b) Obtain the initial community and its boundary; (c) Calculate the similarity between hyperedges within the community boundary and sub-hypergraph, as well as the similarity between nodes within the community and the current community itself, delete the hyperedges and nodes with low similarity, and then obtain the community’s neighborhood; (d) Calculate the similarity between hyperedges within community’s neighborhood and sub-hypergraph, and add the hyperedge with high similarity and its associated nodes to the current community.
Mathematics 11 03497 g002
Figure 3. An example of the GF process. (a) Two sub-hypergraphs can be obtained by the LE process are C v 2 and C v 4 , corresponding seed nodes v 2 and v 4 . These seed nodes are marked in red. Since the hyperedge e 1 was deleted in the hypergraph H 2 , the distance between v 2 and v 4 is infinite; (b) Since the distance is infinite, the final communities are C v 2 and C v 4 . C v 2 = v 1 , v 2 , v 8 , v 9 , v 10 , v 11 , v 12 , C v 4 = v 3 , v 4 , v 5 , v 6 , v 7 , v 13 .
Mathematics 11 03497 g003
Figure 4. Bipartite graph form of the Southern Women hypernetwork, where the 18 female nodes are listed on the left and the 14 event nodes are listed on the right.
Mathematics 11 03497 g004
Figure 5. Hyperdegree distribution of random hypernetworks under different probabilities p i n . (a) p i n = 0.95 ; (b) p i n = 0.9 6; (c) p i n = 0.97 ; (d) p i n = 0.98 ; (e) p i n = 0.99 ; (f) p i n = 1.00 .
Mathematics 11 03497 g005
Figure 6. The impact of parameter α on NMI. The corresponding NMI value is high at α 0.7 under the same probability.
Mathematics 11 03497 g006
Figure 7. The performance of five algorithms under different probabilities in synthetic hypernetworks. (a) Line chart and (b) bar chart of the NMI values corresponding to the five algorithms under different probabilities; (c) line chart and (d) bar chart of the Rand Index values corresponding to the five algorithms under different probabilities.
Mathematics 11 03497 g007
Figure 8. A partial diagram of the drug–target hypernetwork. (a) Hypernetwork diagram; (b) the results diagram of community detection, in which different colored nodes represent different communities.
Mathematics 11 03497 g008
Table 1. The details of three datasets.
DatasetsDate Sources
Southern Women Hypernetworkhttps://rdrr.io/cran/latentnet/man/davis.html, accessed on 1 December 2022
Random Hypernetworkhttps://doi.org/10.1016/j.amc.2015.12.039, accessed on 1 March 2023
Drug-Targets Hypernetworkhttps://go.drugbank.com, accessed on 1 February 2022
Table 2. Results of the different algorithms in the Southern Women hypernetwork.
AlgorithmFinal CommunitiesRand Index
LPA{1–18}0.471
GN{1–18}0.471
IRMM{1–7, 9}, {8, 10–18}0.889
Spectral{1–9}, {10–18}1
HLEGF{1–9}, {10–18}1
Ground truth{1–9}, {10–18}1
Table 3. Information on nodes and hyperedges in the local network.
Node NumberDrug NumberDrug NameHyperedge NumberTarget NumberTarget Name
0DB00002Cetuximab0P02746C1QB_HUMAN
1DB14530Chromous sulfate1P293723MG_HUMAN
2DB06404Human C1-esterase inhibitor2P23415GLRA1_HUMAN
3DB00515Cisplatin3P04731MT1A_HUMAN
4DB08888Ocriplasmin4P01023A2MG_HUMAN
...............
45DB01346Quinidine barbiturate30Q01668CAC1D_HUMAN
Disclaimer/Publisher’s Note: The statements, opinions and data contained in all publications are solely those of the individual author(s) and contributor(s) and not of MDPI and/or the editor(s). MDPI and/or the editor(s) disclaim responsibility for any injury to people or property resulting from any ideas, methods, instructions or products referred to in the content.

