
Efficient Red Kite Optimization Algorithm for Integrating the Renewable Sources and Electric Vehicle Fast Charging Stations in Radial Distribution Networks


Abstract
:1. Introduction
- Most of the reported works used metaheuristic optimization algorithms to integrate RESs and FCSs to the network.
- Many of these methods lack accuracy due to the fall in local optimal solution in addition to the slow convergence rate of some approaches.
- Also, the reported hybrid algorithms were complicated to implement and required excessive effort and time.
- Many researchers ignored the installation of distributed generators (DGs) and they relied mainly on the grid as the source of energy.

| Author | Year | DG | Type | Objective | Algorithm | Metaheuristic | Remarks |
|---|---|---|---|---|---|---|---|
| Amer et al. [6] | 2020 | √ | wind |
| Genetic algorithm | √ | The genetic algorithm has a slow convergence rate |
| Sachan et al. [7] | 2020 | × | -- |
| Biogeography-based optimizer | √ | The installation of DGs is ignored |
| Mohanty et al. [8] | 2022 | √ | NA |
| GWO-PSO | √ | The presented hybrid algorithm is complicated and requires excessive effort for implementation |
| Zeng et al. [9] | 2020 | √ | wind | Maximize the overall profit of parking lots | Genetic algorithm | √ | The genetic algorithm has a slow convergence rate |
| Kong et al. [11] | 2019 | √ | NA | Minimize the costs of construction and operation | Iterative optimization algorithm | × | The authors considered fast charging stations for all EVs |
| Battapothula et al. [12] | 2019 | √ | NA |
| NSGA-II | √ | NSGA-II is very complicated in construction and implementation |
| Khan et al. [13] | 2019 | √ | PV | Minimize the net power exchange between the charging station and grid | Constant current-constant voltage | × | An energy management strategy between DG, charging station, and grid has been implemented |
| Pal et al. [14] | 2021 | √ | Solar |
| Harris hawks optimizer and GWO | √ | Both HHO and GWO are easy to trap in local optima |
| Wu et al. [15] | 2021 | × | -- |
| Binary PSO | √ | PSO can not avoid the local optima and has a low convergence rate |
| aSa’adati et al. [16] | 2021 | √ | Wind and solar | Minimize the costs of investment and energy losses | CFRLM | × | The authors ignored the driving range uncertainty and the EV’s SOC during arrival at the transportation network |
| Amer et al. [17] | 2021 | √ | wind |
| Genetic algorithm | √ | The genetic algorithm has a slow convergence rate |
| Pal et al. [18] | 2021 | × | -- |
| DE and HHO | √ | The authors ignored the installation of DGs |
| Rajesh et al. [19] | 2021 | √ | NA |
| Quantum-behaved Gaussian mutational dragonfly algorithm | √ | The employed approach is difficult and requires large computational time |
| Ahmad et al. [21] | 2021 | √ | Solar |
| Improved chicken swarm optimizer | √ | Many steps are followed in the presented approach that make it complicated in implementation |
| Deb et al. [22] | 2021 | × | -- | Minimize the overall cost of FSC construction | CSO-TLBO | √ | The optimal sites of swapping stations and EV charging have not been considered |
| Goswami et al. [23] | 2021 | √ | Solar |
| Stochastic firefly algorithm | √ | Firefly suffers from high complexity, computational time, and slow convergence speed |
| Khaksari et al. [24] | 2021 | × | -- | Minimize the investment cost of FCS | Gurobi optimization | × | Gurobi optimization is limited to the complexity of the handled problem. Also, it is not fast enough to solve complex problems |
| Bhadoriya et al. [25] | 2022 | √ | NA | Mitigate the total active power loss | Transient search optimizer | √ | TDO may trap in local optima during handling complex problems with high dimensions |
| Yi et al. [26] | 2022 | × | -- | Minimize the annual cost paid by the car owners and investors | Binary PSO | √ | PSO falls in local optima and has a slow convergence rate |
| Zhou et al. [28] | 2022 | × | -- | Minimize the total social cost | Genetic algorithm | √ | The genetic algorithm has a slow convergence rate |
| Aljehane et al. [29] | 2022 | √ | RESs | Reduce the charging time and cost | Black widow optimizer | √ | BWO can not avoid the local optima and has a slow rate of convergence |
| Kumar et al. [31] | 2022 | × | -- | Mitigate the investment cost, power loss, and voltage deviation | Fuzzy optimized via NSGA-II | √ | NSGA-II is very complicated in construction and implementation |
| Zu et al. [32] | 2022 | × | -- |
| CPLEX and YALMIP languages | × | The solver needs high memory for solving complex problems |
| Thangaraju [33] | 2022 | √ | NA | Minimize the annualized costs | Student psychology optimizer and AdaBoost algorithm | √ | Large consumed time is required for implementing the student psychology optimizer |
| Al Wahedi et al. [34] | 2022 | √ | Wind and PV | Minimize investment and operating costs | HOMER | × | Detailed inputs, data, and time are mandatory to obtain adequate results from HOMER |
| Erdogan et al. [36] | 2021 | × | -- | Minimize the overall cost of charging station | Multi-objective optimization (MOO) | NA | The presented MOO method is not clear, also the authors did not consider DG installation |
| Ma et al. [37] | 2021 | × | -- | Minimize the daily charging time | Surrogate optimization algorithm | √ | The surrogate optimization algorithm has a slow convergence rate |
| Ahmadi et al. [38] | 2021 | √ | Wind and PV | Minimize the loss and voltage fluctuation |
| √ | Excessive computational time is required by both employed hybrid approaches |
| Fathy et al. [39] | 2020 | × | -- |
| Competition over resource | √ | The authors did not consider the installation of DGs |
- A new methodology incorporating the simple and efficient red kite optimization algorithm (ROA) is proposed to evaluate the optimal capacities and places of RESs and FCSs in distribution networks.
- The considered fitness functions are: reducing the network active loss and minimizing the voltage deviation.
- A multi-objective red kite optimization algorithm (MOROA) is proposed to reduce both targets.
- The proposed approach competency is proved through the obtained results.
2. The Considered System Model
2.1. Model of the PV System
2.2. Model of a Wind Turbine
2.3. Model of an Electric Vehicle
3. Form of Optimization Problem
3.1. Network Power Loss
3.2. Network Voltage Violation
3.3. Constraints
3.3.1. Supply-Demand Balance
3.3.2. Bus Voltage Constraint
3.3.3. Thermal Constraint
3.3.4. Generation Limit
3.3.5. EV Constraint
4. The Basics of the Red Kite Optimization Algorithm
- The first stage—the initial position of the birds: In this stage, according to Equation (26), the position of red kites can be initialized randomly as,where is ith red kite’s position at iteration , and are lower and upper boundaries, respectively, is size of population, denotes problem dimension, and is a random number in [0, 1].
- The second stage—selection of the leader: Selecting the leader is obtained according to Equation (27):where denotes position of the best bird in iteration , denotes the position of ith red kite in iteration , is value of the bird evaluation function in iteration , and is the value of the evaluation function of the best bird in iteration .
- The third stage—the movement of the birds: It is considered that red kites must gradually move from exploration phase to exploitation stage through considering decreasing coefficient () according to Equation (28).where is the current iteration and denotes the maximum iteration.
5. The Proposed ROA-Based Methodology
| Algorithm 1 The proposed ROA pseudo code to solve the single objective optimization problem. |
| 1: Define the ROA parameters like max iteration (t_max), size of population (n), d, lb, ub, and number of runs (n_run). 2: Input the load data and line data of the network under study. 3: Conduct load flow analysis and keep the voltage fluctuation and power loss. 4: Formulate the initial population using Equation (26). 5: for i = 1: n 6: Integrate in the network, where is the probable solution from the population. 7: Conduct power flow for the network with integrating . 8: Compute the initial evaluation function . 9: end for 10: while k > n_run do 11: for t > t_max do 12: for i = 1: n 13: Calculate the values of SC, UC, and D using Equations (28) and (32). 14: Calculate the red kites’ new positions using Equations (19) and (30). 15: Check the positions’ limits using Equation (31). 16: Compute the new objective function . 17: if > 18: Update bu 19: end if 20: i = i + 1 21: end for 22: t = t + 1 23: end for 24: end for 25: k = k + 1 26: end while 27: Save the optimal places and sizes of RESs and FCSs. |
6. Numerical Analysis and Discussions
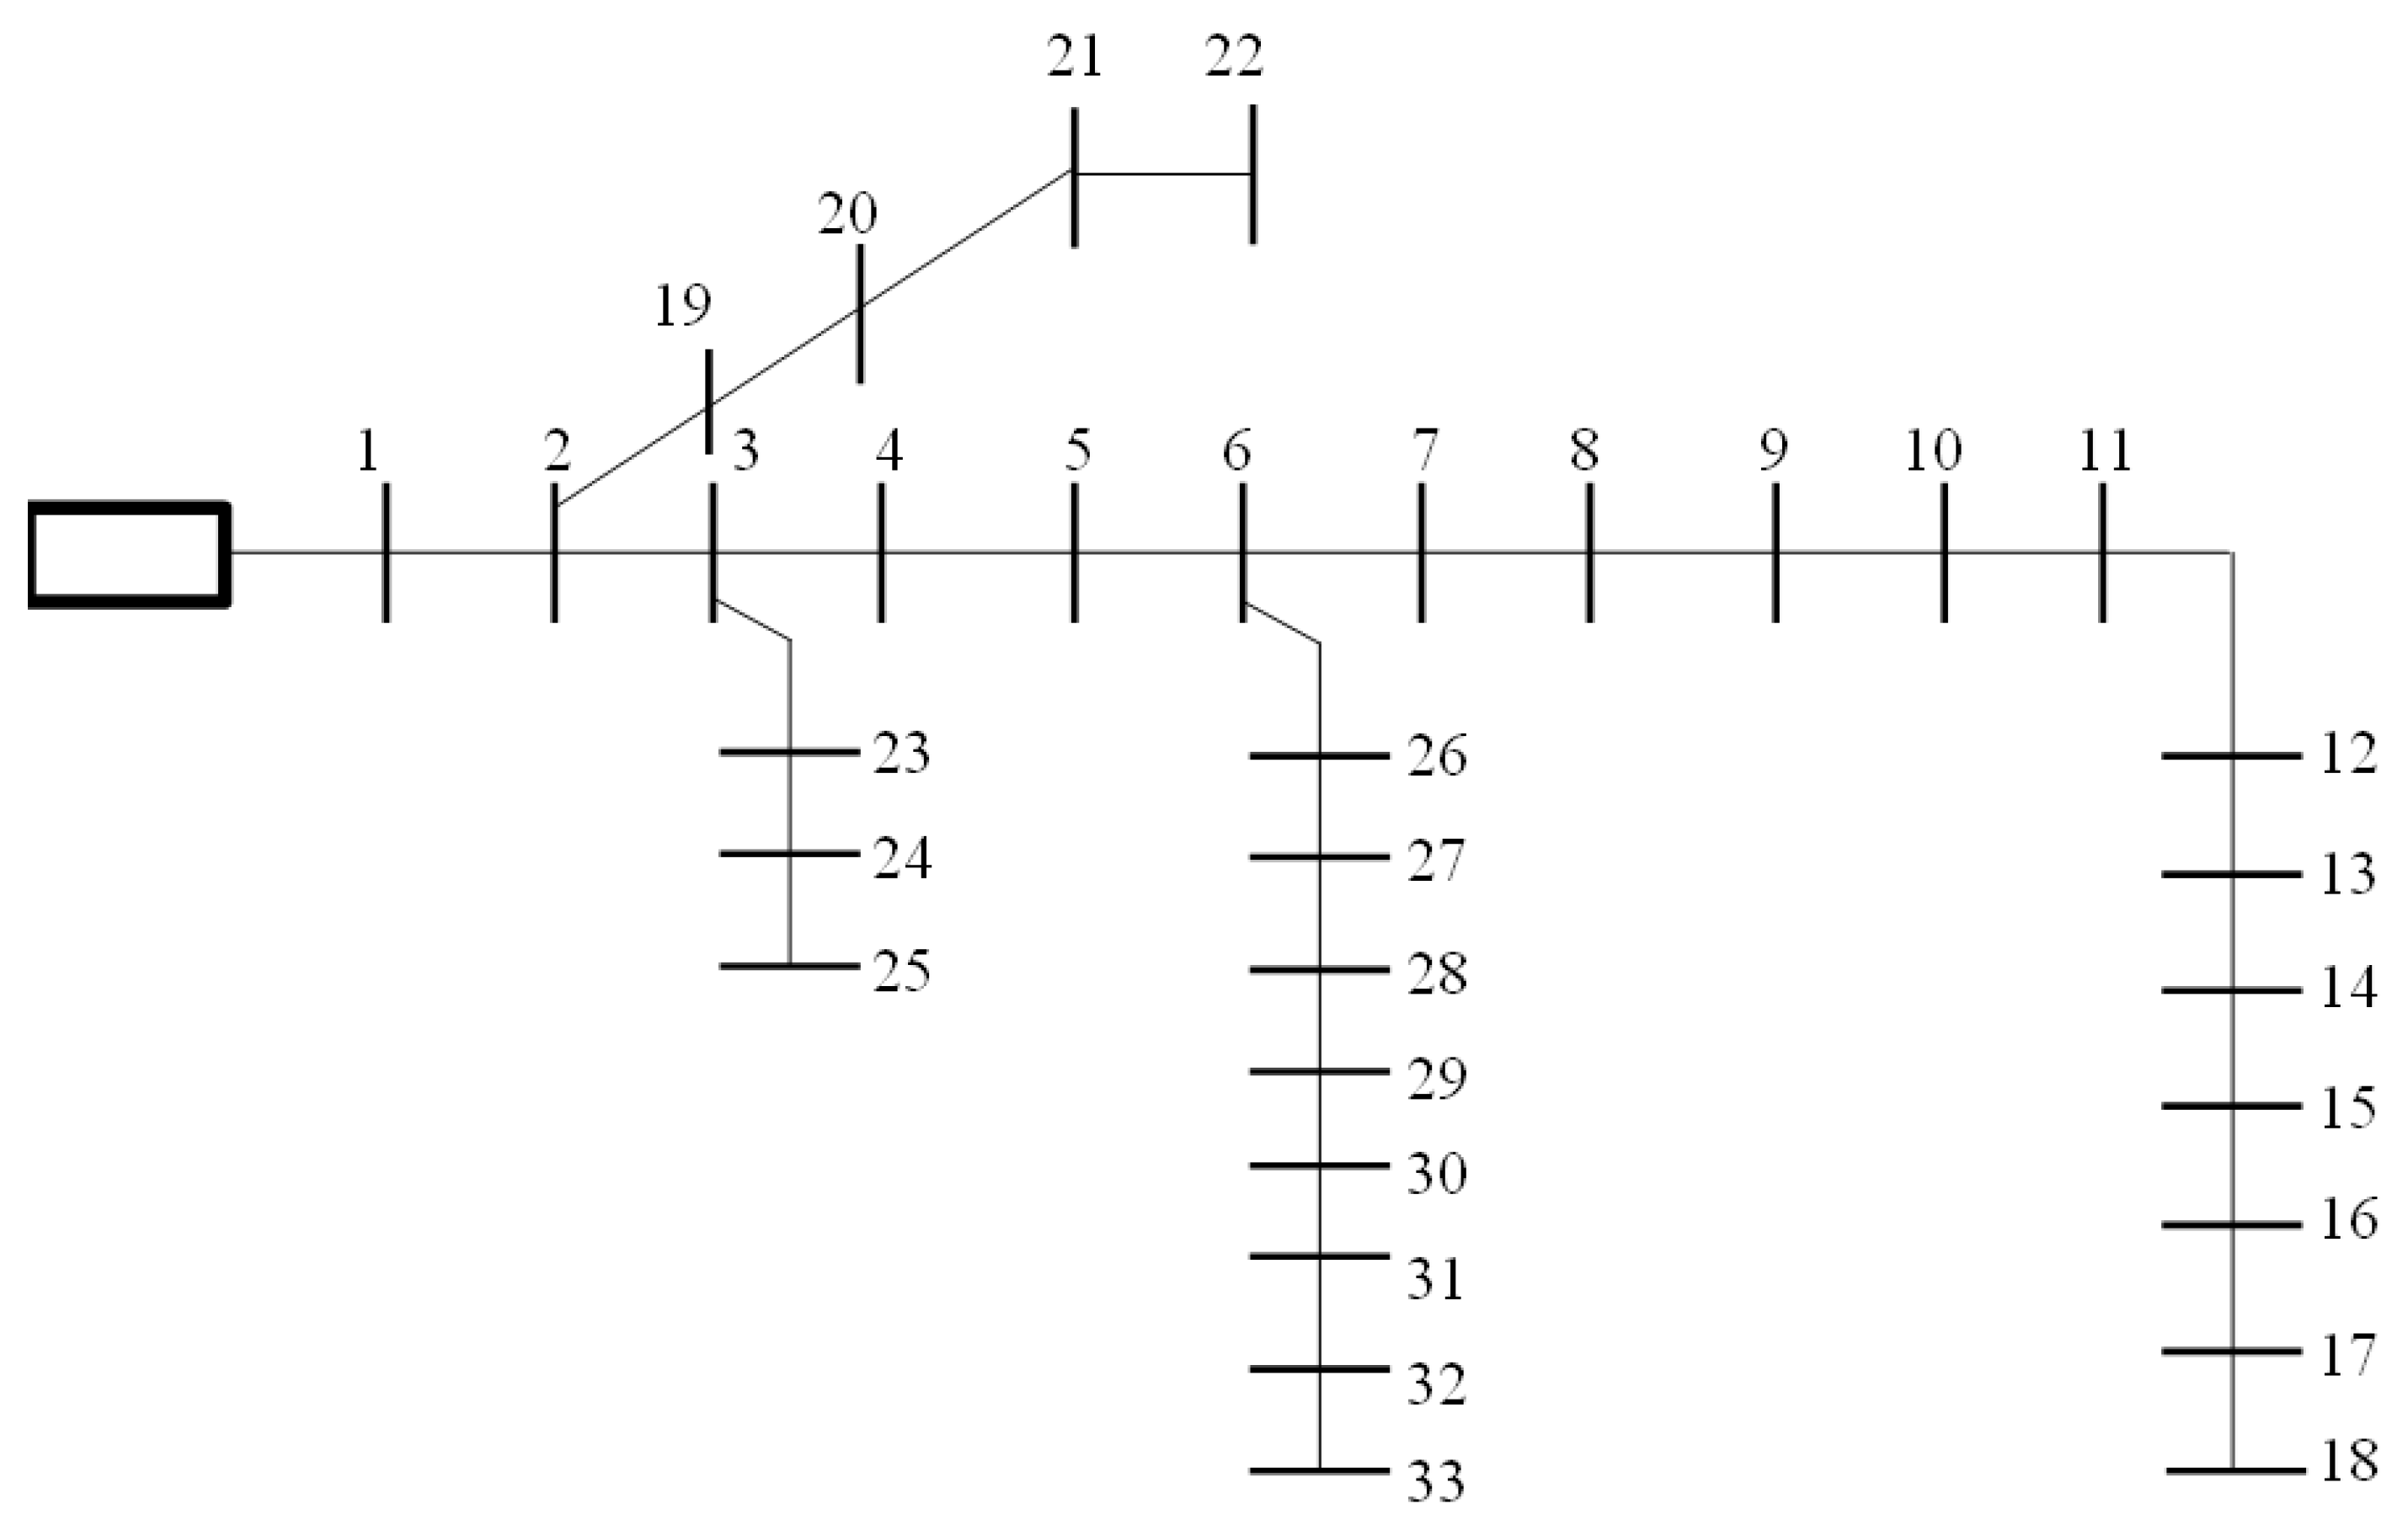
6.1. IEEE-33 Bus Network
6.2. IEEE-69 Bus Network
7. Conclusions
Author Contributions
Funding
Data Availability Statement
Conflicts of Interest
References
- Fazelpour, F.; Vafaeipour, M.; Rahbari, O.; Rosen, M.A. Intelligent optimization to integrate a plug-in hybrid electric vehicle smart parking lot with renewable energy resources and enhance grid characteristics. Energy Convers. Manag. 2014, 77, 250–261. [Google Scholar] [CrossRef]
- Amini, M.H.; Boroojeni, K.G.; Wang, C.J.; Nejadpak, A.; Iyengar, S.S.; Karabasoglu, O. Effect of electric vehicle parking lots’ charging demand as dispatchable loads on power systems loss. In Proceedings of the 2016 IEEE International Conference on Electro Information Technology (EIT), Grand Forks, ND, USA, 19–21 May 2016; pp. 499–503. [Google Scholar] [CrossRef]
- Xu, N.Z.; Chung, C.Y. Uncertainties of EV charging and effects on well-being analysis of generating systems. IEEE Trans. Power Syst. 2014, 30, 2547–2557. [Google Scholar] [CrossRef]
- Kumar, Y.V.P.; Rao, S.N.V.B.; Padma, K.; Reddy, C.P.; Pradeep, D.J.; Flah, A.; Kraiem, H.; Jasiński, M.; Nikolovski, S. Fuzzy hysteresis current controller for power quality enhancement in renewable energy integrated clusters. Sustainability 2022, 14, 4851. [Google Scholar] [CrossRef]
- Rao, S.B.; Kumar, Y.P.; Amir, M.; Ahmad, F. An adaptive neuro-fuzzy control strategy for improved power quality in multi-microgrid clusters. IEEE Access 2022, 10, 128007–128021. [Google Scholar] [CrossRef]
- Amer, A.; Azzouz, M.A.; Azab, A.; Awad, A.S. Stochastic planning for optimal allocation of fast charging stations and wind-based DGs. IEEE Syst. J. 2020, 15, 4589–4599. [Google Scholar] [CrossRef]
- Sachan, S.; Amini, M.H. Optimal allocation of EV charging spots along with capacitors in smart distribution network for congestion management. Int. Trans. Electr. Energy Syst. 2020, 30, 12507. [Google Scholar] [CrossRef]
- Mohanty, A.K.; Suresh Babu, P.; Salkuti, S.R. Optimal allocation of fast charging station for integrated electric-transportation system using multi-objective approach. Sustainability 2022, 14, 14731. [Google Scholar] [CrossRef]
- Zeng, B.; Zhu, Z.; Xu, H.; Dong, H. Optimal public parking lot allocation and management for efficient PEV accommodation in distribution systems. IEEE Trans. Ind. Appl. 2020, 56, 5984–5994. [Google Scholar] [CrossRef]
- Gupta, R.S.; Tyagi, A.; Anand, S. Optimal allocation of electric vehicles charging infrastructure, policies and future trends. J. Energy Storage 2021, 43, 103291. [Google Scholar] [CrossRef]
- Kong, W.; Luo, Y.; Feng, G.; Li, K.; Peng, H. Optimal location planning method of fast charging station for electric vehicles considering operators, drivers, vehicles, traffic flow and power grid. Energy 2019, 186, 115826. [Google Scholar] [CrossRef]
- Battapothula, G.; Yammani, C.; Maheswarapu, S. Multi-objective simultaneous optimal planning of electrical vehicle fast charging stations and DGs in distribution system. J. Mod. Power Syst. Clean Energy 2019, 7, 923–934. [Google Scholar] [CrossRef] [Green Version]
- Khan, W.; Ahmad, F.; Alam, M.S. Fast EV charging station integration with grid ensuring optimal and quality power exchange. Eng. Sci. Technol. Int. J. 2019, 22, 143–152. [Google Scholar] [CrossRef]
- Pal, A.; Bhattacharya, A.; Chakraborty, A.K. Placement of public fast-charging station and solar distributed generation with battery energy storage in distribution network considering uncertainties and traffic congestion. J. Energy Storage 2021, 41, 102939. [Google Scholar] [CrossRef]
- Wu, X.; Feng, Q.; Bai, C.; Lai, C.S.; Jia, Y.; Lai, L.L. A novel fast-charging stations locational planning model for electric bus transit system. Energy 2021, 224, 120106. [Google Scholar] [CrossRef]
- Sa’adati, R.; Jafari-Nokandi, M.; Saebi, J. Allocation of RESs and PEV fast-charging station on coupled transportation and distribution networks. Sustain. Cities Soc. 2021, 65, 102527. [Google Scholar] [CrossRef]
- Amer, A.; Azab, A.; Azzouz, M.A.; Awad, A.S. A stochastic program for siting and sizing fast charging stations and small wind turbines in urban areas. IEEE Trans. Sustain. Energy 2021, 12, 1217–1228. [Google Scholar] [CrossRef]
- Pal, A.; Bhattacharya, A.; Chakraborty, A.K. Allocation of electric vehicle charging station considering uncertainties. Sustain. Energy Grids Netw. 2021, 25, 100422. [Google Scholar] [CrossRef]
- Rajesh, P.; Shajin, F.H. Optimal allocation of EV charging spots and capacitors in distribution network improving voltage and power loss by Quantum-Behaved and Gaussian Mutational Dragonfly Algorithm (QGDA). Electr. Power Syst. Res. 2021, 194, 107049. [Google Scholar] [CrossRef]
- Narasipuram, R.P.; Mopidevi, S. A technological overview & design considerations for developing electric vehicle charging stations. J. Energy Storage 2021, 43, 103225. [Google Scholar] [CrossRef]
- Ahmad, F.; Khalid, M.; Panigrahi, B.K. An enhanced approach to optimally place the solar powered electric vehicle charging station in distribution network. J. Energy Storage 2021, 42, 103090. [Google Scholar] [CrossRef]
- Deb, S.; Gao, X.Z.; Tammi, K.; Kalita, K.; Mahanta, P. A novel chicken swarm and teaching learning based algorithm for electric vehicle charging station placement problem. Energy 2021, 220, 119645. [Google Scholar] [CrossRef]
- Goswami, A.; Sadhu, P.K. Stochastic firefly algorithm enabled fast charging of solar hybrid electric vehicles. Ain Shams Eng. J. 2021, 12, 529–539. [Google Scholar] [CrossRef]
- Khaksari, A.; Tsaousoglou, G.; Makris, P.; Steriotis, K.; Efthymiopoulos, N.; Varvarigos, E. Sizing of electric vehicle charging stations with smart charging capabilities and quality of service requirements. Sustain. Cities Soc. 2021, 70, 102872. [Google Scholar] [CrossRef]
- Bhadoriya, J.S.; Gupta, A.R.; Zellagui, M.; Saxena, N.K.; Arya, A.K.; Bohre, A.K. Optimal allocation of electric vehicles charging station in distribution network beside DG using TSO. In Planning of Hybrid Renewable Energy Systems, Electric Vehicles and Microgrid: Modeling, Control and Optimization; Springer Nature: Singapore, 2022; pp. 785–808. [Google Scholar] [CrossRef]
- Yi, T.; Cheng, X.; Peng, P. Two-stage optimal allocation of charging stations based on spatiotemporal complementarity and demand response: A framework based on MCS and DBPSO. Energy 2022, 239, 122261. [Google Scholar] [CrossRef]
- Ghasemi-Marzbali, A. Fast-charging station for electric vehicles, challenges and issues: A comprehensive review. J. Energy Storage 2022, 49, 104136. [Google Scholar] [CrossRef]
- Zhou, G.; Zhu, Z.; Luo, S. Location optimization of electric vehicle charging stations: Based on cost model and genetic algorithm. Energy 2022, 247, 123437. [Google Scholar] [CrossRef]
- Aljehane, N.O.; Mansour, R.F. Optimal allocation of renewable energy source and charging station for PHEVs. Sustain. Energy Technol. Assess. 2022, 49, 101669. [Google Scholar] [CrossRef]
- Ahmad, F.; Iqbal, A.; Ashraf, I.; Marzband, M. Optimal location of electric vehicle charging station and its impact on distribution network: A review. Energy Rep. 2022, 8, 2314–2333. [Google Scholar] [CrossRef]
- Kumar, N.; Kumar, T.; Nema, S.; Thakur, T. A comprehensive planning framework for electric vehicles fast charging station assisted by solar and battery based on Queueing theory and non-dominated sorting genetic algorithm-II in a co-ordinated transportation and power network. J. Energy Storage 2022, 49, 104180. [Google Scholar] [CrossRef]
- Zu, S.; Sun, L. Research on location planning of urban charging stations and battery-swapping stations for electric vehicles. Energy Rep. 2022, 8, 508–522. [Google Scholar] [CrossRef]
- Thangaraju, I. Optimal allocation of distributed generation and electric vehicle charging stations-based SPOA2B approach. Int. J. Intell. Syst. 2022, 37, 2061–2088. [Google Scholar] [CrossRef]
- Al Wahedi, A.; Bicer, Y. Techno-economic optimization of novel stand-alone renewables-based electric vehicle charging stations in Qatar. Energy 2022, 243, 123008. [Google Scholar] [CrossRef]
- Deb, S.; Gao, X.Z.; Tammi, K.; Kalita, K.; Mahanta, P. Nature-inspired optimization algorithms applied for solving charging station placement problem: Overview and comparison. Arch. Comput. Methods Eng. 2021, 28, 91–106. [Google Scholar] [CrossRef]
- Erdogan, N.; Pamucar, D.; Kucuksari, S.; Deveci, M. An integrated multi-objective optimization and multi-criteria decision-making model for optimal planning of workplace charging stations. Appl. Energy 2021, 304, 117866. [Google Scholar] [CrossRef]
- Ma, T.Y.; Xie, S. Optimal fast charging station locations for electric ridesharing with vehicle-charging station assignment. Transp. Res. Part D Transp. Environ. 2021, 90, 102682. [Google Scholar] [CrossRef]
- Ahmadi, M.; Hosseini, S.H.; Farsadi, M. Optimal allocation of electric vehicles parking lots and optimal charging and discharging scheduling using hybrid metaheuristic algorithms. J. Electr. Eng. Technol. 2021, 16, 759–770. [Google Scholar] [CrossRef]
- Fathy, A.; Abdelaziz, A.Y. Competition over resource optimization algorithm for optimal allocating and sizing parking lots in radial distribution network. J. Clean. Prod. 2020, 264, 121397. [Google Scholar] [CrossRef]
- Khan, M.J.; Iqbal, M.T. Pre-feasibility study of stand-alone hybrid energy systems for applications in Newfoundland. Renew. Energy 2005, 30, 835–854. [Google Scholar] [CrossRef]
- Moghaddam, A.A.; Seifi, A.; Niknam, T. Multi-operation management of a typical micro-grids using Particle Swarm Optimization: A comparative study. Renew. Sustain. Energy Rev. 2012, 16, 1268–1281. [Google Scholar] [CrossRef]
- Fathy, A.; Kaaniche, K.; Alanazi, T.M. Recent approach based social spider optimizer for optimal sizing of hybrid PV/wind/battery/diesel integrated microgrid in aljouf region. IEEE Access 2020, 8, 57630–57645. [Google Scholar] [CrossRef]
- Roe, C.; Meliopoulos, A.P.; Meisel, J.; Overbye, T. November. Power system level impacts of plug-in hybrid electric vehicles using simulation data. In Proceedings of the 2008 IEEE Energy 2030 Conference, Atlanta, GA, USA, 17–18 November 2008; pp. 1–6. [Google Scholar] [CrossRef]
- Mozafar, M.R.; Moradi, M.H.; Amini, M.H. A simultaneous approach for optimal allocation of renewable energy sources and electric vehicle charging stations in smart grids based on improved GA-PSO algorithm. Sustain. Cities Soc. 2017, 32, 627–637. [Google Scholar] [CrossRef]
- Li, Z.; Chowdhury, M.; Bhavsar, P.; He, Y. Optimizing the performance of vehicle-to-grid (V2G) enabled battery electric vehicles through a smart charge scheduling model. Int. J. Automot. Technol. 2015, 16, 827–837. [Google Scholar] [CrossRef]
- Gahruei, J.R.; Beheshti, Z. The Electricity Consumption Prediction using Hybrid Red kite Optimization Algorithm with Multi-Layer Perceptron Neural Network. J. Intell. Proced. Electr. Technol. 2022, 15, 1–22. [Google Scholar]
- Fathy, A. A novel artificial hummingbird algorithm for integrating renewable based biomass distributed generators in radial distribution systems. Appl. Energy 2022, 323, 119605. [Google Scholar] [CrossRef]
- Xue, J.; Shen, B. Dung beetle optimizer: A new meta-heuristic algorithm for global optimization. J. Supercomput. 2023, 79, 7305–7336. [Google Scholar] [CrossRef]
- Abdollahzadeh, B.; Gharehchopogh, F.S.; Mirjalili, S. African vultures optimization algorithm: A new nature-inspired metaheuristic algorithm for global optimization problems. Comput. Ind. Eng. 2021, 158, 107408. [Google Scholar] [CrossRef]
- Alsattar, H.A.; Zaidan, A.A.; Zaidan, B.B. Novel meta-heuristic bald eagle search optimisation algorithm. Artif. Intell. Rev. 2020, 53, 2237–2264. [Google Scholar] [CrossRef]
- Das, A.K.; Pratihar, D.K. Bonobo optimizer (BO): An intelligent heuristic with self-adjusting parameters over continuous spaces and its applications to engineering problems. Appl. Intell. 2022, 52, 2942–2974. [Google Scholar] [CrossRef]
- Mirjalili, S.; Mirjalili, S.M.; Lewis, A. Grey wolf optimizer. Adv. Eng. Softw. 2014, 69, 46–61. [Google Scholar] [CrossRef] [Green Version]
- Fathy, A.; Abdelaziz, A.Y. Grey wolf optimizer for optimal sizing and siting of energy storage system in electric distribution network. Electr. Power Compon. Syst. 2017, 45, 601–614. [Google Scholar] [CrossRef]


| Vehicle Model | Honda Accord | Toyota Prius | Chevrolet Volt | Ford Fusion |
|---|---|---|---|---|
| Consumed power | 29 kW/mile | 29 kW/mile | 36 kW/mile | 34 kW/mile |
| Distance with battery capacity | 13 miles | 11 miles | 37 miles | 21 miles |
| Capacity of battery | 6.6 kWh | 4.4 kWh | 16 kWh | 7.6 kWh |
| Maximum rate of charge | 6.6 kW | 3.5 kW | 3.5 kW | 3.5 kW |
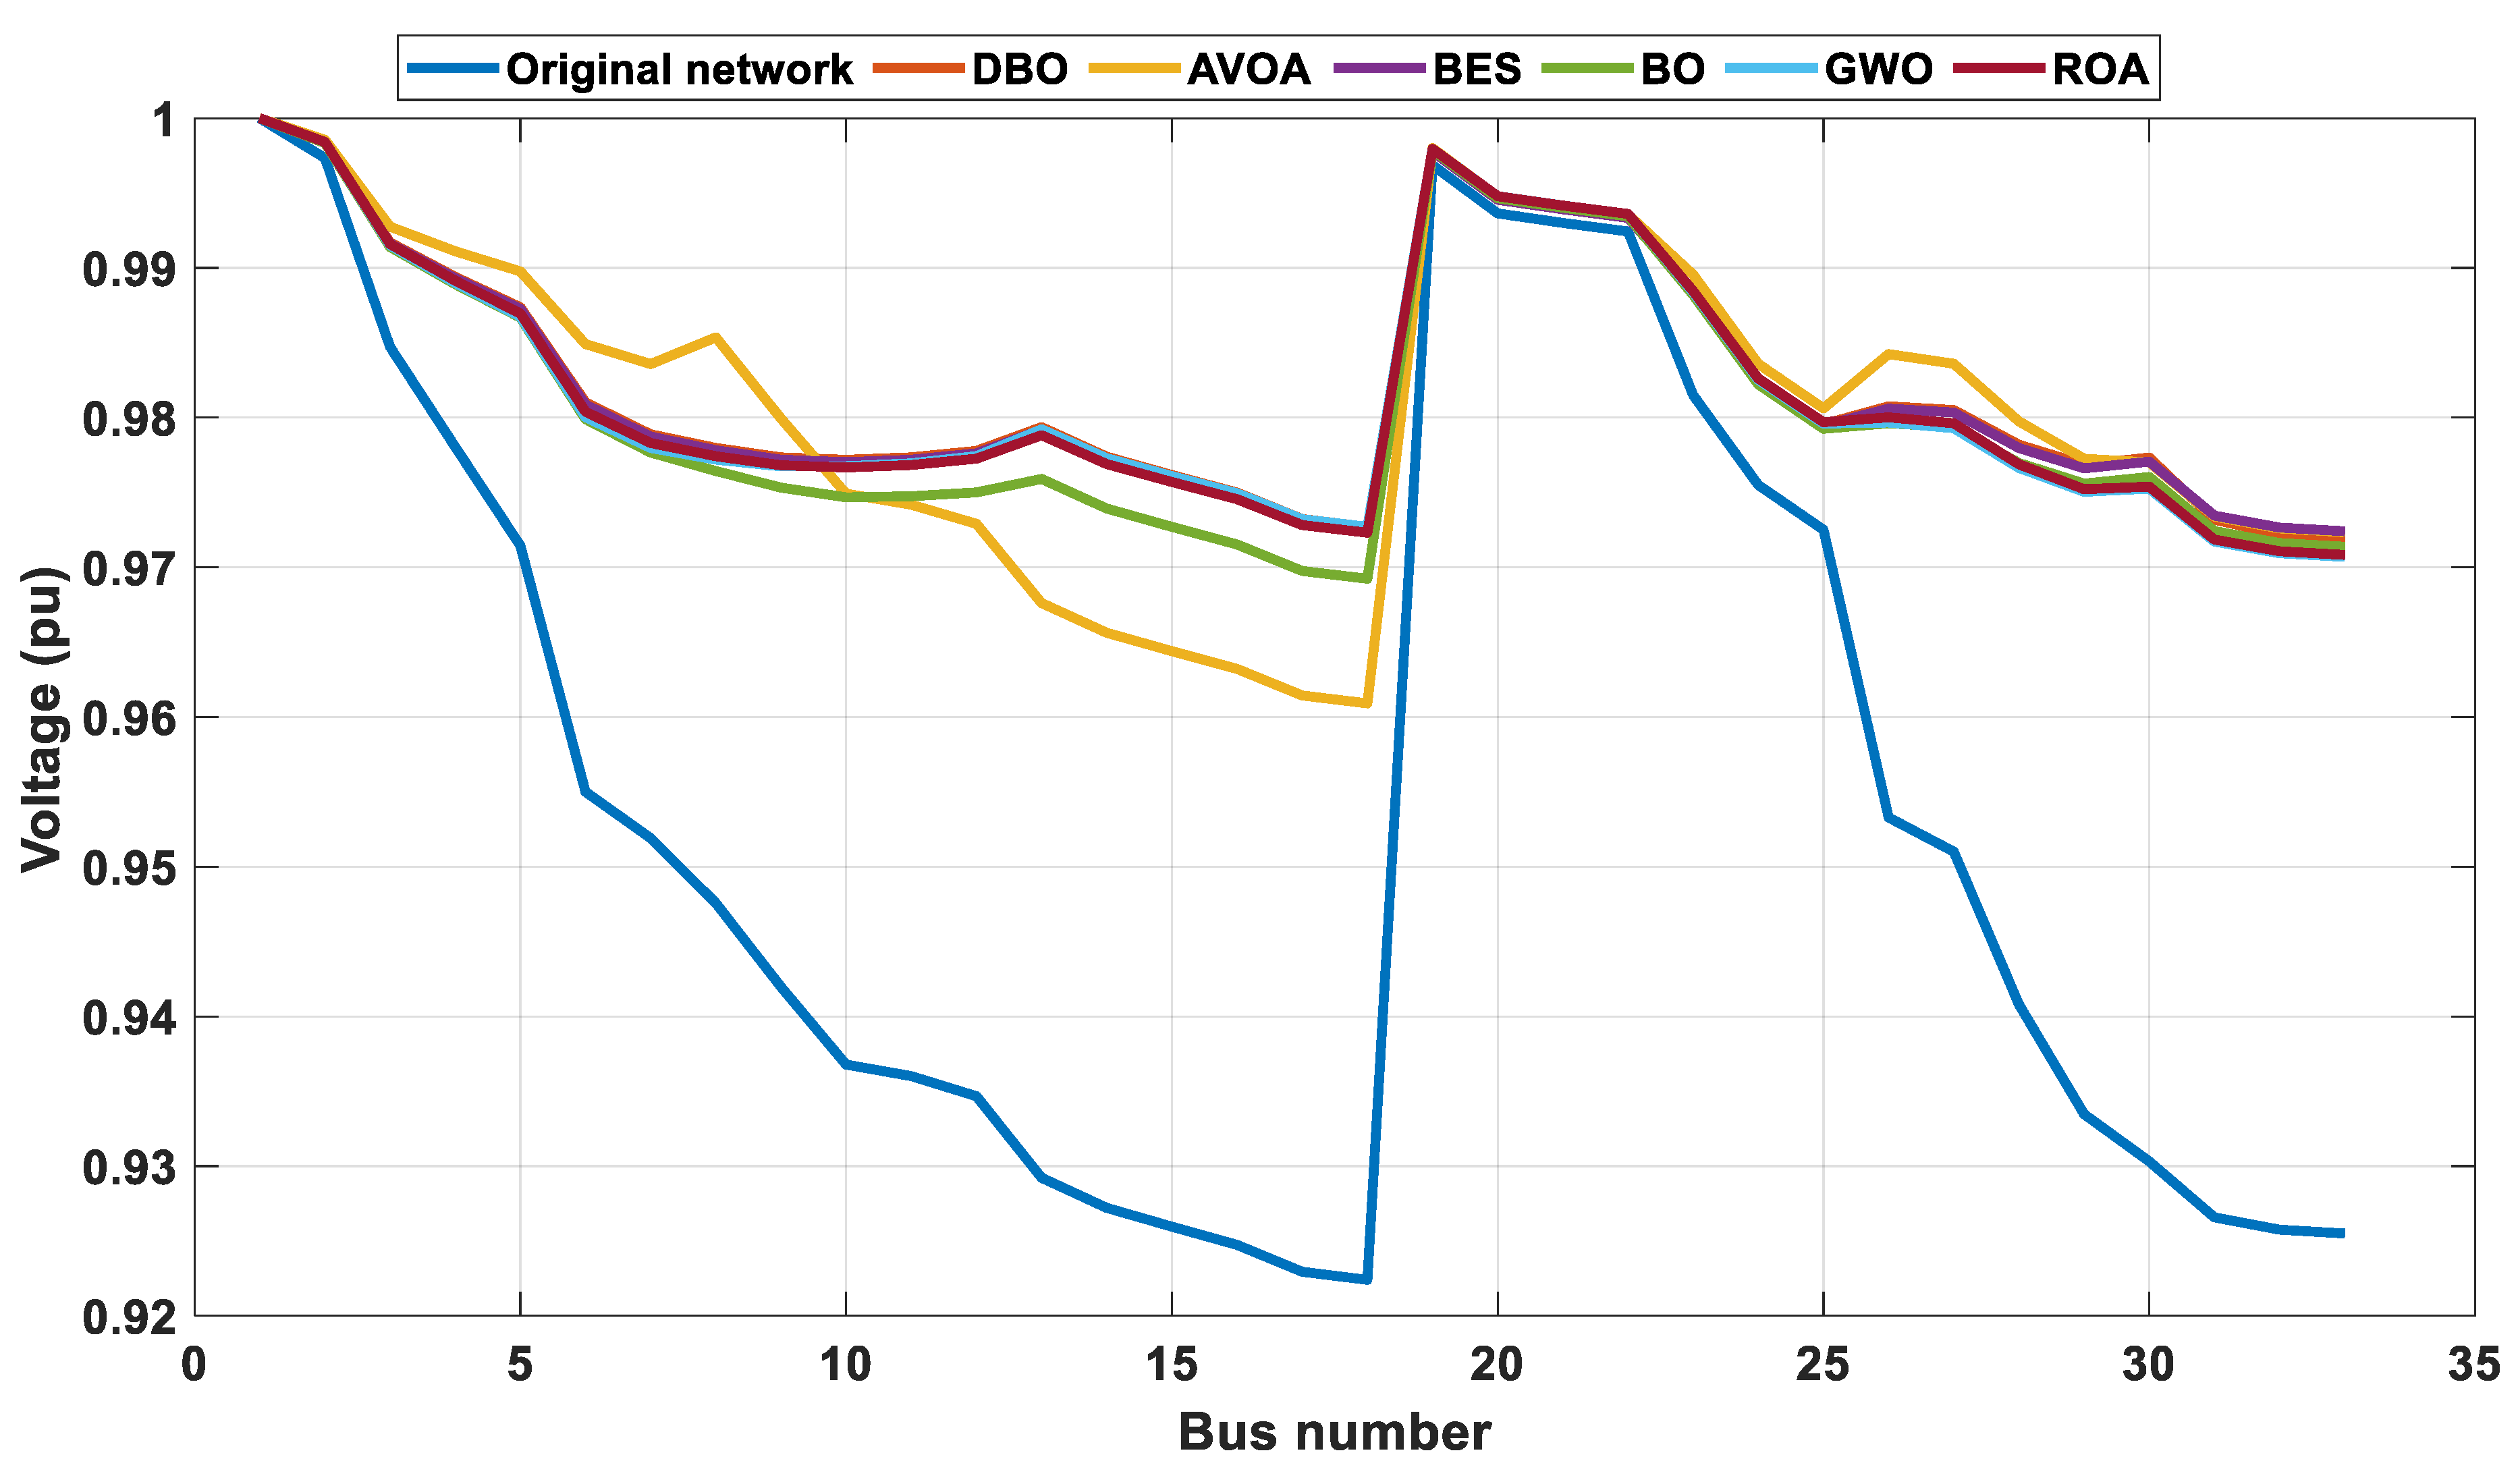
| DBO | AVOA | BES | BO | GWO | ROA | |
|---|---|---|---|---|---|---|
| RES (kW)/location | 1172.455/(30) | 1415.316/(8) | 767.7161/(13) | 1072.105/(30) | 796.258/(13) | 770.3162/(13) |
| 768.3386/(13) | 841.6776/(30) | 1073.831/(30) | 870.675/(13) | 1179.83/(30) | 1126.969/(30) | |
| FCS (kW)/location | 99.000/(33) | 109.800/(26) | 104.8500/(2) | 103.400/(2) | 79.4101/(6) | 63.34486/(30) |
| 107.05/(2) | 107.625/(19) | 112.6125/(19) | 103.950/(13) | 95.9678/(30) | 50.23074/(2) | |
| Active power loss (kW) | 1650.078 | 1716.946 | 1641.0623 | 1633.4916 | 1652.1002 | 1631.1189 |
| Reactive power loss (kVar) | 1067.1 | 1104.5 | 1060.6 | 1067.3 | 956.48116 | 947.36830 |
| Vmin (pu)/location | 0.9718/(33) | 0.9609/(18) | 0.9724/(33) | 0.9692/(18) | 0.9707/(33) | 0.9708/(33) |
| Vmax (pu)/location | 1.000/(1) | 1.000/(1) | 1.000/(1) | 1.000/(1) | 1.000/(1) | 1.000/(1) |
| Voltage deviation (pu) | 14.1639 | 15.2245 | 14.2351 | 15.2438 | 14.5806 | 14.5663 |
| Time (s) | 92.287 | 89.6085 | 247.461 | 66.547 | 131.489 | 64.569 |
| DBO | AVOA | BES | BO | GWO | ROA | |
|---|---|---|---|---|---|---|
| RES (kW)/location | 1498.299/(10) | 1449.13/(11) | 1485.9678/(10) | 1500/(10) | 1500/(10) | 1499.994/(10) |
| 1500/(31) | 1500/(31) | 1500/(30) | 1380.22/(31) | 1500(20) | 1500/(30) | |
| FCS (kW)/location | 50/(2) | 89.58208/(30) | 50/(33) | 50/(2) | 74.7382/(10) | 50/(2) |
| 181.6571/(33) | 82.92387/(33) | 50/(26) | 52.7957/(23) | 121.3876/(3) | 79.68228/(10) | |
| Active power loss (kW) | 1838.1837 | 1748.6105 | 1743.0893 | 1840.8733 | 1654.1723 | 1643.5811 |
| Reactive power loss (kVar) | 1307.9386 | 1246.4018 | 1223.3889 | 1307.5806 | 1154.3989 | 1148.2444 |
| Vmin (pu)/location | 0.9833/(25) | 0.9833/(25) | 0.9837/(25) | 0.9833/(25) | 0.9828/(25) | 0.9831/(25) |
| Vmax (pu)/location | 1.0024/(10) | 1.0026/(11) | 1.0036/(10) | 1.0025/(10) | 1.0/(1) | 1.0/(1) |
| Voltage deviation (pu) | 3.7273 | 3.7866 | 3.5632 | 3.7378 | 3.5399 | 3.4762 |
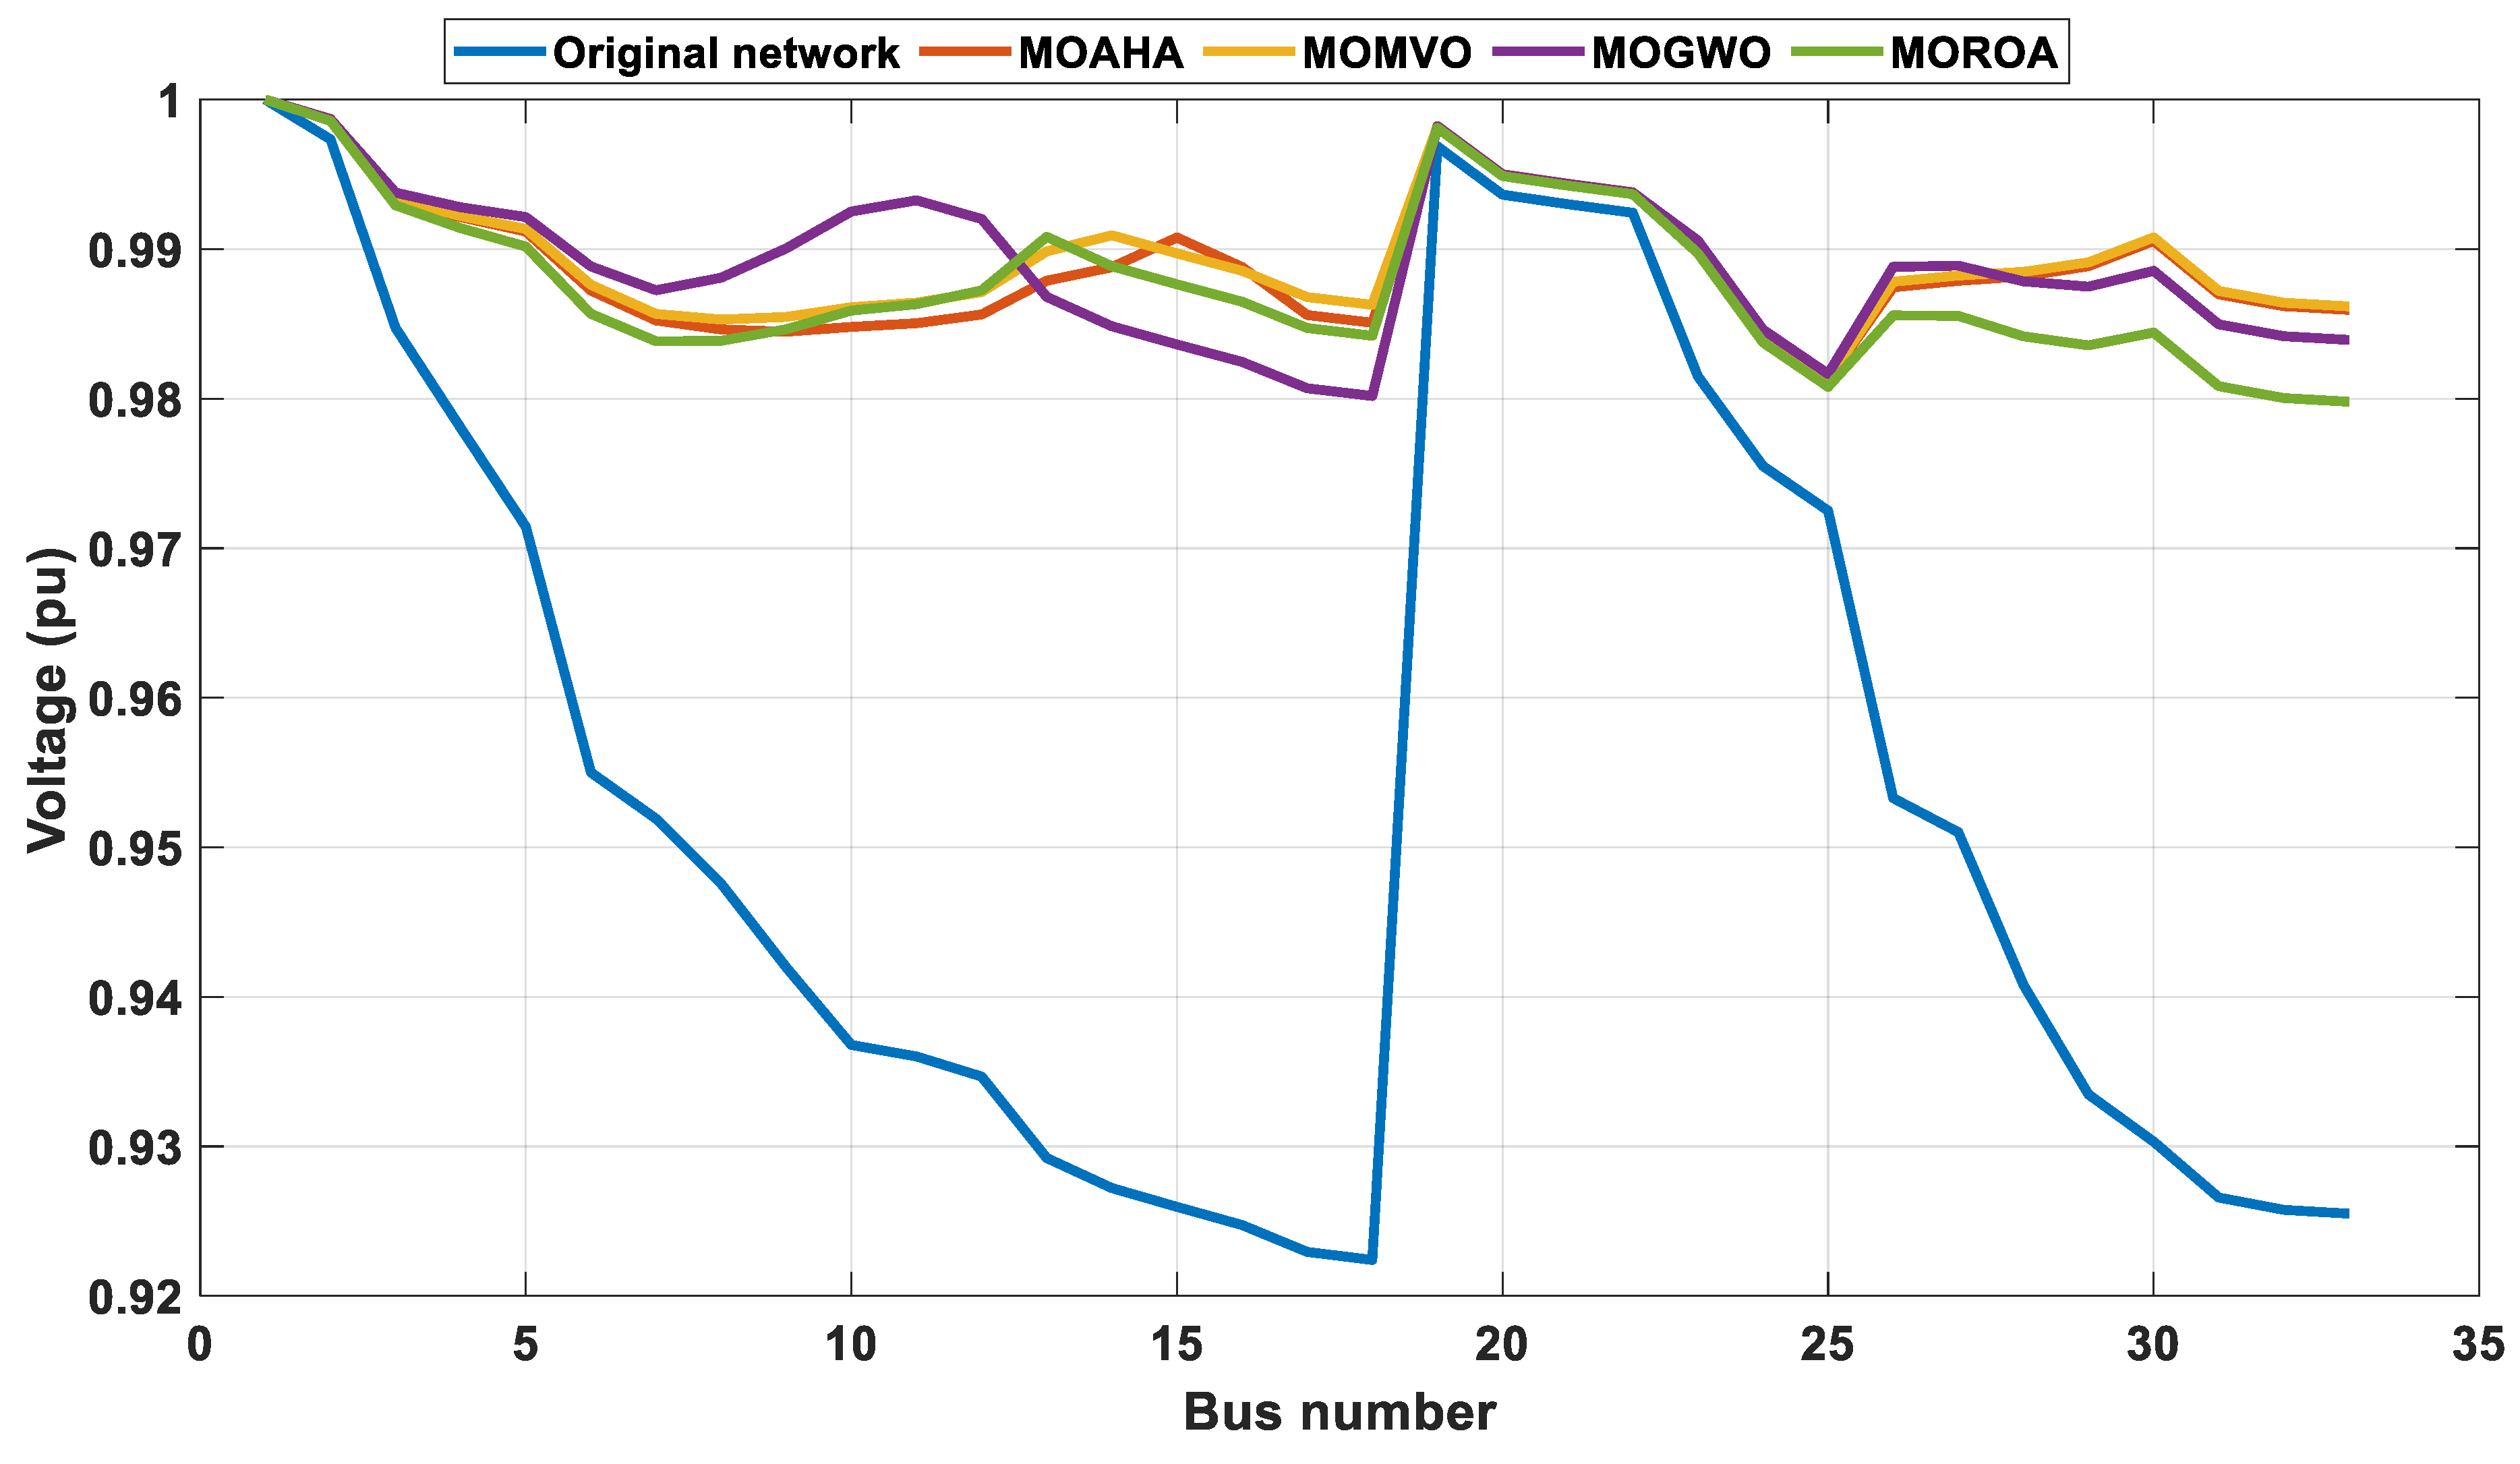
| MOAHA [47] | MOMVO | MOGWO | MOROA | |
|---|---|---|---|---|
| RES (kW)/location | 1475.0424/(30) | 885.715/(14) | 1283.274/(11) | 994.2378/(13) |
| 1073.4234/(15) | 1465.69/(30) | 1264.667/(30) | 1472.334/(30) | |
| FCS (kW)/location | 63.763105/(14) | 51.3188/(3) | 190.1696/(2) | 128.1094/(2) |
| 188.82647/(17) | 92.0779/(2) | 96.09850/(10) | 165.3984/(30) | |
| Active power loss (kW) | 1829.26 | 1810.31 | 1801.96 | 1763.93 |
| Voltage deviation (pu) | 6.7704 | 6.2317 | 6.4819 | 6.6547 |
| Reactive power loss (kVar) | 1152.29 | 1122.65 | 1108.20 | 1025.81 |
| Vmin (pu)/location | 0.9813/(25) | 0.9813/(25) | 0.9802/(18) | 0.9798/(33) |
| Vmax (pu)/location | 1.0/(1) | 1.0/(1) | 1.0/(1) | 1.0/(1) |
| DBO | AVOA | BES | BO | GWO | ROA | |
|---|---|---|---|---|---|---|
| RES (kW)/location | 1500/(61) | 1500/(61) | 713.821/(17) | 1500/(61) | 1500/(61) | 1500/(61) |
| 518.641/(17) | 295.224/(6) | 584.281/(62) | 426.56/(17) | 47.971/(23) | 663.715/(69) | |
| 54.7547/(14) | 813.401/(10) | 1036.10/(61) | 485.21/(53) | 575.167/(12) | 502.0473/(19) | |
| FCS (kW)/location | 51.0967/(18) | 67.2109/(4) | 58.7486/(18) | 50.019/(53) | 64.7808/(35) | 156.5290/(19) |
| 50/(69) | 53.2949/(51) | 82.7298/(47) | 50/(2) | 196.489/(47) | 50/(4) | |
| 50.6284/(5) | 54.3663/(29) | 191.153/(17) | 50/(47) | 173.715/(29) | 346.3399/(69) | |
| Active power loss (kW) | 2810.358 | 2905.728 | 2775.538 | 2742.766 | 2819.619 | 2738.731 |
| Reactive power loss (kVar) | 1291.968 | 1311.428 | 1274.645 | 1259.164 | 1296.032 | 1276.838 |
| Vmin (pu)/location | 0.9796/(65) | 0.9798/(27) | 0.9836/(65) | 0.9819/(65) | 0.9804/(65) | 0.9800/(65) |
| Vmax (pu)/location | 1.0/(1) | 1.0/(1) | 1.0/(1) | 1.0/(1) | 1.0/(1) | 1.0/(1) |
| Voltage deviation (pu) | 11.4739 | 13.3273 | 11.5038 | 10.4405 | 13.3135 | 12.1014 |
| Time (s) | 159.893 | 104.103 | 347.468 | 62.493 | 145.821 | 62.078 |
| DBO | AVOA | BES | BO | GWO | ROA | |
|---|---|---|---|---|---|---|
| RES (kW)/location | 987.669/(63) | 1500/(12) | 1499.996/(63) | 801.0936/(64) | 549.582/(19) | 1464.69/(63) |
| 1152.20/(13) | 1500/(64) | 1499.999/(68) | 1500/(59) | 1500/(62) | 1495.45/(56) | |
| 1416.90/(63) | 607.458/(54) | 469.3114/(58) | 1500/(69) | 1500/(55) | 891.503/(15) | |
| FCS (kW)/location | 245.784/(43) | 350/(7) | 53.66301/(58) | 50/(36) | 162.323/(29) | 311.624/(7) |
| 253.716/(64) | 234.083/(46) | 50/(2) | 350/(58) | 58.5327/(21) | 337.688/(16) | |
| 308.648/(56) | 333.914/(31) | 163.3407/(67) | 192.210/(66) | 149.570/(47) | 231.826/(5) | |
| Active power loss (kW) | 3316.866 | 3518.4419 | 3534.8244 | 3636.6704 | 3176.7778 | 3284.3169 |
| Reactive power loss (kVar) | 1626.321 | 1740.1091 | 1659.1212 | 1696.3122 | 1602.5207 | 1645.6244 |
| Vmin (pu)/location | 0.9941/(56) | 0.9870/(61) | 0.9912/(65) | 0.9922/(61) | 0.9903/(65) | 0.9915/(65) |
| Vmax (pu)/location | 1.0040/(13) | 1.0055/(12) | 1.0096/(68) | 1.0100/(69) | 1.0024/(55) | 1.0021/(56) |
| Voltage deviation (pu) | 3.748 | 4.2701 | 3.4861 | 3.5533 | 2.7751 | 2.6607 |
| MOAHA [47] | MOMVO | MOGWO | MOROA | |
|---|---|---|---|---|
| RES (kW)/location | 1469.52/(61) | 1249.069/(49) | 1260.96/(68) | 917.811/(9) |
| 916.516/(18) | 1500/(61) | 1395.23/(51) | 647.6445/(15) | |
| 301.015/(59) | 855.449/(14) | 1470.41/(62) | 1500/(61) | |
| FCS (kW)/location | 307.607/(47) | 98.1616/(34) | 305.866/(68) | 248.222/(28) |
| 60.7376/(52) | 80.8805/(43) | 307.682/(6) | 135.164/(2) | |
| 207.741/(26) | 207.898/(31) | 296.051/(51) | 336.811/(37) | |
| Active power loss (kW) | 2974.105 | 2960.5889 | 3351.509 | 2929.075 |
| Voltage deviation (pu) | 5.1243 | 6.832 | 5.4632 | 4.3347 |
| Reactive power loss (kVar) | 1294.045 | 1232.638 | 1501.993 | 1303.072 |
| Vmin (pu)/location | 0.9881/(65) | 0.9817/(65) | 0.9812/(65) | 0.9856/(65) |
| Vmax (pu)/location | 1.0002/(18) | 1.0/(1) | 1.0008/(68) | 1.0005/(15) |
Disclaimer/Publisher’s Note: The statements, opinions and data contained in all publications are solely those of the individual author(s) and contributor(s) and not of MDPI and/or the editor(s). MDPI and/or the editor(s) disclaim responsibility for any injury to people or property resulting from any ideas, methods, instructions or products referred to in the content. |
© 2023 by the authors. Licensee MDPI, Basel, Switzerland. This article is an open access article distributed under the terms and conditions of the Creative Commons Attribution (CC BY) license (https://creativecommons.org/licenses/by/4.0/).
Share and Cite
Alshareef, S.M.; Fathy, A. Efficient Red Kite Optimization Algorithm for Integrating the Renewable Sources and Electric Vehicle Fast Charging Stations in Radial Distribution Networks. Mathematics 2023, 11, 3305. https://doi.org/10.3390/math11153305
Alshareef SM, Fathy A. Efficient Red Kite Optimization Algorithm for Integrating the Renewable Sources and Electric Vehicle Fast Charging Stations in Radial Distribution Networks. Mathematics. 2023; 11(15):3305. https://doi.org/10.3390/math11153305
Chicago/Turabian StyleAlshareef, Sami M., and Ahmed Fathy. 2023. "Efficient Red Kite Optimization Algorithm for Integrating the Renewable Sources and Electric Vehicle Fast Charging Stations in Radial Distribution Networks" Mathematics 11, no. 15: 3305. https://doi.org/10.3390/math11153305