Article

Has the COVID-19 Pandemic Led to a Switch in the Volatility of Biopharmaceutical Companies?

by
Adriana AnaMaria Davidescu
1,2,*,
Eduard Mihai Manta
3,
Oana Mihaela Vacaru (Boita)
3,
Mihaela Gruiescu
4,
Razvan Gabriel Hapau
5,6 and
Paul Laurentiu Baranga
7
1
Department of Statistics and Econometrics, The Bucharest University of Economic Studies, 010552 Bucharest, Romania
2
Department of Education, Training and Labour Market, National Scientific Research Institute for Labour and Social Protection, 010643 Bucharest, Romania
3
Doctoral School of Cybernetics and Statistics, Bucharest University of Economic Studies, 010374 Bucharest, Romania
4
Department of Informatics, Statistics and Mathematics, Romanian-American University, 012101 Bucharest, Romania
5
Doctoral School of Finance, Western University of Timisoara, 300223 Timisoara, Romania
6
The Financial Supervisory Authority, 050092 Bucharest, Romania
7
Doctoral School of Economics II, Bucharest University of Economic Studies, 010374 Bucharest, Romania
*
Author to whom correspondence should be addressed.
Mathematics 2023, 11(14), 3116; https://doi.org/10.3390/math11143116
Submission received: 9 May 2023 / Revised: 25 June 2023 / Accepted: 11 July 2023 / Published: 14 July 2023
(This article belongs to the Special Issue Advanced Statistical Applications in Financial Econometrics)

Abstract

:
Biopharmaceutical companies are critical in developing vaccines, treatments, and diagnostics for COVID-19. Thus, understanding the contagion effects of their stock market can have important economic implications, especially in the context of global financial markets. Due to the COVID-19 pandemic, biopharmaceutical companies’ stock markets may have experienced sudden volatility and risk changes, which may have had spillover effects on other sectors and markets. Policymakers can take pre-emptive measures to stabilize financial markets. Analyzing the contagion effects makes it even more relevant to analyze the stock market response of four leading pharmaceutical companies that either developed vaccines against COVID-19 or drugs that help to fight the virus, namely, Pfizer, AbbVie Inc., Sanofi, and Bristol Myers Squibb. The analysis considers two periods, before and during the COVID-19 crisis, and considers the influence of the market volatility and technological market index. In order to capture the contagion effects, DCC-GARCH models have been applied, which estimate time-varying correlation coefficients using a multivariate GARCH framework, allowing for the modeling of time-varying volatility and correlations in financial returns. The results reveal the impact of market volatility on the returns of all four pharmaceutical companies. Additionally, a contagion effect between all four companies, the technological market, and market volatility was observed during the COVID-19 period.

1. Introduction

The relevance of the planet’s sustainable development, as expressed in efforts such as the goals stated in the 2030 Agenda for Sustainable Development, has piqued the interest and attention of humanity and the research community in recent years. Both economic and social actors have attempted to provide new responses and approaches to help achieve all of these set targets from a wide range of viewpoints, such as the issuance of green bonds [1], corporate strategy assessment [2], or developing programs in various areas, such as the European Commission’s nature-based solutions [3]. Admittedly, unrestricted population and economic development based on the heavy exploitation of finite resources have resulted in many detrimental repercussions on the planet, including climate change, with dire ramifications for human existence [4]. Human activity has maximum transmission vulnerability to natural disasters and the advent of new infectious illnesses [5]. The COVID-19 pandemic, which has produced the worst worldwide health disaster in modern times, is the most recent illustration of the negative consequences of these operations.
The COVID-19 virus has compelled the development of policy measures and government initiatives in countries around the globe. All of these factors comprise restriction and closure strategies, such as enforced limitations or education and job closures; budgetary plans, such as monetary aid for jobless persons or humanitarian relief spending for the effects of COVID-19; and health regulations, such as medical bills in the event of an emergency, broad screening, and contact tracking rules by the government, with all supported for vaccine development [6]. These, in some cases, delayed initiatives to prevent viral transmission have, in turn, created additional economic and societal concerns.
The COVID-19 pandemic has significantly impacted the global economy, including the stock market. One area that has been particularly affected is the biopharmaceutical industry, which has been at the forefront of developing treatments and vaccines for COVID-19. The contagion effects of biopharmaceutical companies’ stock market in the context of the COVID-19 pandemic refers to the spillover effects of the stock market movements of biopharmaceutical companies on other companies in the same industry and the overall stock market.
The GARCH models have been widely employed in financial research because they provide precise and reliable results. As a result, the GARCH family of models has emerged as the standard methodology for modeling volatility in financial time series data [7]. One way to measure the contagion effects of biopharmaceutical companies’ stock market is using the GARCH-DCC-GARCH family models. The rationale for using the DCC-GARCH model in this context is that it allows for a more accurate estimation of the time-varying correlation between biopharmaceutical companies’ stock prices and the overall stock market, considering the potential impact of COVID-19 on these correlations. This model can also help to identify any spillover effects between different biopharmaceutical companies’ stock prices, which can provide insights into how the pandemic has affected the industry. Empirical evidence for the usage of GARCH models in analyzing the impact of the COVID-19 pandemic on the volatility of biopharmaceutical companies has been supported by studies [8,9,10,11,12,13,14,15].The main conclusion of all of these studies is that the COVID-19 pandemic has significantly increased stock market volatility, showing a substantial increase in volatility during the pandemic period compared to the pre-pandemic period based on the results of GARCH family models. This suggests that the pandemic has introduced heightened uncertainty and market fluctuations, leading to greater volatility in the stock market.
Given the sector’s crucial role in the fight against the pandemic, this study aims to examine the stock market behavior of four prominent biopharmaceutical companies, AbbVie Inc. (ABBV), Pfizer (P.F.E.), Sanofi (SNY), and Bristol Myers Squibb (B.M.Y.), before and during the COVID-19 crisis. By selecting these four prominent biopharmaceutical companies, the study can provide insights into the specific impact of the COVID-19 pandemic on this sector, capturing the volatility shifts and market reactions of key players in the industry. The main criteria used were industry importance, market capitalization, global reach, and market performance. These companies have a significant impact on the overall healthcare industry. The selected companies have substantial market capitalization, indicating their size and influence in the biopharmaceutical sector. Their market capitalization reflects their overall value and significance within the industry. The chosen companies have a global presence and are well-known multinational corporations operating in various countries. These companies have historically demonstrated significant market performance and have been key players in the biopharmaceutical sector. By examining their volatility during the pandemic, valuable insights can be gained regarding the market dynamics and investor sentiment in response to the crisis.
The primary objective of this research is to investigate the impact of market volatility on the returns of ABBV, P.F.E., SNY, and B.M.Y. and to compare their volatility patterns before and during the pandemic. Furthermore, the study aims to assess whether the companies’ commitment to developing innovative messenger R.N.A. vaccines, in this analysis of P.F.E., has influenced the technological market. To achieve these objectives, the study considers several variables, including the volatility of the market (V.I.X.) and the technological market index (NASDAQ). Therefore, the study utilizes GARCH (1,1) and DCC-GARCH (1,1) models [16]. The study period spans from 6 February 2018 to 8 April 2022, divided into pre-COVID-19 (6 February 2018 until 10 March 2020) and COVID-19 (from 11 March 2020 to 8 April 2022).
This study makes a valuable contribution to the body of knowledge regarding the impact of the COVID-19 pandemic on financial markets, specifically within the biopharmaceutical sector, adding to the existing literature the novelty of considering companies that did not develop COVID-19-targeted vaccines. The findings reveal the significance of market volatility on the returns of the companies under investigation. The study emphasizes the importance of action at multiple levels, including government, organizations, investors, and society, to promote a natural transition to a green economy and a shared commitment to preventing and mitigating the conditions that contribute to natural disasters and diseases. The government may play a key role in ensuring the health and well-being of current and future generations. Organizations must comply with rigorous sustainability protocols and regulations, while investors should make decisions that reward or penalize companies based on their responsible behavior. Finally, society must adopt sustainability as a cultural value that guides all actions.
The remainder of this paper is arranged as follows. Section 2 establishes the theoretical framework and defines the hypotheses under consideration. Section 3 explains the study’s research strategy, data sources, and methods. Section 4 and Section 5 present the research’s primary findings and accompanying commentary. Finally, Part 6 discusses the results, practical consequences, limitations, and prospective future research routes.

2. Literature Review

2.1. Contextualization of the COVID-19 Pandemic and Its Implications on Market Behavior

Cases of pneumonia with unknown etiology were first recorded in the Chinese city of Wuhan in Hubei Province in December 2019. The coronavirus disease 2019 (COVID-19) epidemic began at this time. The virus’s strong transmission potential and quick spread across continents and nations prompted the World Health Organization (WHO) to declare it as a worldwide pandemic on 11 March 2020, when the number of confirmed cases in 114 countries had already topped 118,000 [17].
Increasing herd immunity and reducing the spread of COVID-19 is based on the large-scale distribution of effective vaccines worldwide, positioning the biopharmaceutical sector as an important player in the global recovery process. Many biopharmaceutical companies are developing effective vaccines using innovative technologies at high speeds. The general administration of vaccines has significantly reduced the number and severity of infected persons in the short term. Still, the impact of COVID-19 goes beyond this and requires a multifaceted approach focusing on sustainable growth. This magnitude of events offers new research opportunities to analyze the importance of critical industries, both as causes and consequences of these events, and to justify the significant impact of these magnitudes on the economy and society. The serious health, social, and economic consequences of COVID-19 require establishing an ethically responsible action plan to restore normality and prevent new catastrophic events from appearing.
Using parallels with prior illnesses and natural calamities that have indeed affected financial market performance, it was predicted that COVID-19 would do the same [18]. This epidemic has posed significant problems, putting governments, industries, the economy, and society to the test. The emergence of the new coronavirus has shaken the global stock markets since WHO declared a Public Health Emergency of International Concern on 30 January 2020, decreasing market performance and increasing worry and panic among investors [19]. This initial response to the exceptional event brought about unprecedented economic uncertainty, which decision-makers, finance industry regulators, institutional investors, and individual investors interpreted as a measure of financial risk and uncertainty surrounding the incentive to invest in financial assets [20]. The Volatility Index (V.I.X.), a worldwide known measure of U.S. stock market uncertainty, is one of the most recognized and utilized methods of evaluating the frequency and amplitude of price changes in a financial asset. By mid-March 2020, global market volatility had skyrocketed; in particular, American volatility levels had equaled or exceeded those recorded in crises, such as the Great Depression in 1929, Black Monday in October 1987, and the Global Financial Crisis in December 2008. The increased interconnectedness of markets led to a major volatility spillover, mostly from the European continent to the rest of the globe.
Throughout the early months of the coronavirus outbreak, the WHO numbers had different degrees of influence on financial markets. Albulescu [21] research conducted in January and February 2020 concluded that Chinese figures regarding the virus’s spread had little influence on the V.I.X. in U.S. financial markets, but the notification of new cases outside of China and the rising global death rate significantly increased financial volatility. Europe and the United States received more attention than China because of their high sensitivity to uncommon occurrences and global relevance. Although neither region’s financial markets reacted considerably in the near term to the news of the initial COVID-19 cases, a considerable negative reaction was documented when the first deaths were announced [22]. Global numbers relating to the appearance of new instances of infected or deceased persons had a bigger influence on the volatility and liquidity of U.S. financial markets than local statistics throughout the first wave of COVID-19 [23]. This dynamic altered as the number of daily confirmed cases of sick or deceased people in the United States increased, accompanied by a negative sentiment fostered by the media and government restrictions imposed on citizens [24]. The stock market in the United States reacted unusually to events related to the 2020 pandemic. According to these scientists, the most dramatic daily moves in the stock market caused by pandemics during the last 120 years cannot be attributed only to the virus’s lethality (since the excess death rate of COVID-19 throughout the study period was only 1/25th that of the Spanish flu). Instead, government-imposed limits on trade and individual movement and the public’s intentional social separation played an important impact [25]. In their analysis, Zaremba [25] separated the impact of restrictive government regulations and established their significant influence on growing global stock market volatility. According to them, two major non-pharmaceutical policy actions led to increased volatility.
After COVID-19, stock market indices recovered more slowly and with more difficulty than before Ebola, MERS, and SARS [26]. Although stock indices in the top 10 economies of the world recovered in the first and second quarters of 2020, only China and the United States experienced positive returns between January and June [27]. Even with the lifting of quarantine restrictions during the first wave, the increased daily infection and death rates in the world during the first and second waves of COVID-19 raised concerns in the U.S. stock market [28]. This allowed investors to recognize the importance of sustainability and minimize the impact of these natural events. In fact, in the first quarter of 2020, companies with high environmental and social policy ratings achieved better performance and lower volatility in stock prices [29].
According to the findings of Nguyen et al. [12], it was demonstrated that during the COVID-19 pandemic, contagion from the U.S. was observed in only 3 out of 10 Asian emerging markets. Also, the study of Gunay and Can [13] highlighted, using DCC-GARCH and Diebold–Yilmaz connectedness methodology to investigate financial contagion and volatility spillovers during the COVID-19 pandemic, that the transmission of shocks was significantly greater among developed economies compared to emerging markets in the context of stock market reactions to the pandemic. Ji et al. [14] pointed out, based on the results of a DCC–MGARCH model, that the dynamic conditional correlations (DCCs) during the COVID-19 pandemic were higher than those during the 2008 financial crisis.
Siddiqui et al. [15] examined the contagion effect arising from the three major developed markets (the United States of America, the United Kingdom, and Japan) related to market capitalization on four emerging markets in Asia (China, India, Thailand, and Taiwan) and on Africa and the Middle East (Egypt, South Africa, Saudi Arabia, and the U.A.E.). The findings revealed the existence of contagion in six pairs within the Asian region, while there were seven pairs within the African and the Middle East regions displaying a contagion effect.
The study of Boyer [30] presents empirical evidence of contagion effects in financial markets, demonstrating that disturbances originating in one market have the potential to propagate to other markets, including those that are not directly interconnected or accessible. Chiang et al. [31] provide evidence of dynamic correlation and contagion effects among Asian financial markets, indicating the interdependence and transmission of shocks across these markets. Syllignakis and Kouretas [32] and Davidescu et al. [33] examined financial contagion in Central and Eastern European markets and found evidence of dynamic correlations and contagion effects, suggesting the presence of interdependence among these markets. Akhtaruzzaman, Boubaker, and Sensoy’s [34] study focused on financial contagion during the COVID-19 crisis, highlighting the presence of a contagion effect.

2.2. The Potential of the Biopharmaceutical Sector to Address the COVID-19 Pandemic

Progress in biotechnology has been the solution to global issues such as safety and efficiency of production, energy conservation, food security, and combating disease. Adopting biotechnology in the pharmaceutical industry has opened new possibilities for the fight against diseases and accelerated the development of new vaccines [35]. The urgent need to contain the spread of COVID-19 and to effectively diagnose, prevent, and control the disease has put the biopharmaceutical sector at the forefront of government financial markets and society.
In February 2021, an experimental vaccine was approved by WHO [36], and the number of vaccines under development exceeded 200. The vaccination race was led mainly by two American companies, Pfizer and Moderna. Moderna was the first COVID-19 vaccine candidate to be tested on humans, but on 11 December 2020, the U.S. Food and Drug Administration (F.D.A.) issued the first emergency use license for Pfizer BioNTech vaccines. These two companies were responsible for developing the first and most sophisticated RNA-based vaccines against SARS-CoV-2, the coronavirus that causes COVID-19 disease. Both companies use similar technology, but their roots are very different. Pfizer, founded in 1849 in New York City, is one of the world’s leading biopharmaceutical companies. According to the 2020 Fortune 500, the company ranked 64th among the 500 largest companies in the United States. The organization has a long history of discovering, developing, and manufacturing pharmaceuticals, vaccines, and consumer health products. In recent years, Pfizer has completed a restructuring process to focus on developing new biopharmaceutical products. Pfizer is listed on the New York Stock Exchange.
This paper focuses on the most prominent companies in the biopharmaceutical sector, namely, Pfizer and the following three companies, regarding shares that are not part of the NASDAQ Global Select Market.
In a survey analyzing the financial performance of 1066 biopharmaceutical companies in the United States from 1930 to 2015, Thakor [37] revealed similarities and differences in the behavior of biopharmaceutical stock exchanges compared to pharmaceutical and biotechnology companies. The study was divided into two subdivisions, in the 1980s and the 1980s, before and after modern biotechnology emerged. The authors pointed out that, in general, the revenues of the pharmaceutical sector were higher than those of the stock market over the entire analyzed period, with an average annual revenue of 3%.
Chen [38] showed that investors and fund managers investing in biotech stocks and holding biotechnology stocks experience less investment risk and generate profits, although most industries were negatively affected by the 2003 SARS outbreak in Taiwan. Ichev and Marinc [39] found strong evidence that the Ebola outbreak of 2014–2016 positively impacted the return of the U.S. biopharmaceutical and medical equipment industry compared to the negative impact experienced by most other U.S. industries. Similarly, Al-Awadhi [40] recently discovered that the COVID-19 outbreak in China impacted the performance of the technology and medical sectors, which were better than other sectors of the Chinese stock market.
The COVID-19 pandemic has impacted all four companies in the study, with their performance in the pre-COVID-19 period remaining relatively flat without significant changes in their share prices. Before the outbreak, Pfizer’s common stock price showed a slight uptrend from February 2018 to December 2018, followed by a complex decline spanning two years and a slight rebound in the latter half of 2019. In comparison, Abbvie Inc. and Bristol Myers Squibb share a similar pattern in terms of the trend of the series, with a slight downward trend from February 2018 until October 2019 and then a slight upward trend until February 2020, while Sanofi remained relatively constant for the whole of the pre-COVID-19 period (Figure A1 from Appendix A). Therefore, the following hypothesis was tested:
H1. 
The returns of all four companies of Pfizer, AbbVie Inc., Sanofi, and Bristol Myers Squibb were influenced by market volatility both pre- and during the COVID-19 pandemic.
The emergence and spread of COVID-19 from China to other parts of the world impacted the pharmaceutical companies’ performance, albeit to varying degrees. At the start of the study period, Pfizer’s, Abbvie’s, Sanofi’s, and Bristol Myers Squibb’s share prices were USD 32.40, 104.91, 41.65, and 59.83, respectively. On 11 March 2020, the day WHO declared the COVID-19 pandemic, Pfizer’s stock price was USD 32.03, Abbvie’s was 85.8, Sanofi’s was 45.21, and Bristol Myers Squibb’s was 56.78. However, by 12 February 2021, Pfizer’s shares had recovered to USD 34.44, while AbbVie’s increased to 103.76, Sanofi’s increased to 47.14, and Bristol’s increased to 59.86. Hence, the following hypothesis was tested:
H2. 
The volatility of all four companies exhibited dissimilarities between the pre-COVID-19 and COVID-19 periods.
Considering the innovative and technological characteristics of the vaccines produced, it is worth examining their progress relative to the NASDAQ, one of the most widely recognized indices in the United States and a global standard for innovation. The NASDAQ-100 is a stock market index comprising the 100 biggest non-financial companies listed on the NASDAQ stock market, including domestic and international companies. The NASDAQ comprises the biggest global companies in the technology sector, alongside consumer services, healthcare (including biopharmaceuticals), consumer goods, and select industrial companies.
To gain a more comprehensive understanding of the relationship between the technological market and the behaviors of Pfizer, Abbvie Inc., Sanofi, and Bristol Myers Squibb, it is imperative to conduct a more in-depth analysis, particularly when examining both the pre-COVID-19 and COVID-19 periods. Consequently, the following hypothesis was tested:
H3. 
During the COVID-19 period, a contagion effect existed between Pfizer, AbbVie Inc., Sanofi, Bristol Myers Squibb, and NASDAQ.
Given the significant impact of major events in 2020 on stock market movements, examining whether irrational investor behavior plays a significant role in financial outcomes is crucial.

3. Data and Methodology

3.1. Data and Variables

The data used in the analysis comprise the daily returns of Pfizer, AbbVie Inc., Sanofi, Bristol Myers Squibb, V.I.X., and NASDAQ. They contain 1052 observations from 6 February 2018 to 8 April 2022. The analysis uses pre-COVID-19 (from 6 February 2018 to 10 March 2020) and COVID-19 (from 11 March 2020 to 8 April 2022) periods. The sample was split on the day of WHO’s official declaration of COVID-19 as a pandemic on 11 March 2020, and the data from that day onwards were considered to be part of the COVID-19 period for analysis. The two samples were chosen to be equal in terms of observations. The data were extracted from Yahoo Finance.
Table 1 presents the descriptive statistics for the pre-COVID-19 period. It shows that Abbvie Inc. returns had a bearish tendency with a negative mean. On the other hand, all other pharmaceutical companies’ returns had a positive mean, indicating different behavior between these companies. Abbvie Inc., Pfizer, Bristol Myers Squibb, and NASDAQ contained negative values in terms of skewness resulting in a left-skewed distribution, while V.I.X. presented a right-skewed distribution and Sanofi presented a closer-to-the-normal distribution.
In the COVID-19 period, all of the companies had a positive mean. Still, Pfizer had higher volatility than the other firms, as shown by the standard deviation, which again indicates distinct behavior between them (Table 2).
Comparatively analyzing the values of kurtosis data in both periods, it can be highlighted that the distribution of daily returns underwent substantial changes during those periods. Moreover, since the kurtosis values increased during the COVID-19 period compared to the pre-COVID-19 period, it implies that the distribution of daily returns peaked and exhibited heavier tails. This suggests that the daily returns of these securities or indices experienced more extreme values and higher volatility during the COVID-19 period. The ARCH-LM test presents the problem of conditional heteroskedasticity in data, with the null hypothesis (no ARCH effects) being rejected for all returns, at a significance level of 1%. This suggests the need to develop models with stochastic volatility such as GARCH models, to study the phenomenon of contagion between the pharmaceutical sector and two main indices (V.I.X and NASDAQ) (Table 3).

3.2. DCC-GARCH Methodology

In this study, we employed the multivariate DCC-GARCH models proposed by Engle [16] to estimate the dynamic conditional correlations between the stock returns of four pharmaceutical companies Pfizer, Abbvie Inc., Sanofi, and Bristol Myers Squibb in relation to two main indices (V.I.X. and NASDAQ).
The DCC-GARCH model offers several advantages. Firstly, it allows for the estimation of correlation coefficients for the standardized residuals, considering heteroskedasticity. This feature provides a more accurate representation of the relationship between the stock returns. Additionally, the DCC-GARCH model permits the inclusion of additional explanatory variables in the mean equation, enabling the measurement of a common factor that may influence the stock returns. Furthermore, the model’s parameters increase linearly with the number of stock returns, resulting in a relatively parsimonious model. Additionally, the use of dynamic conditional correlations is appropriate for investigating the potential contagion effects caused by herding behavior in emerging financial markets during crisis periods, as demonstrated in previous studies such as those by Corsetti [41], Boyer [30], Chiang [31], Syllignakis and Kouretas [32], and Akhtaruzzaman [34].
The DCC-GARCH model is often chosen for studying contagion due to its ability to capture dynamic correlations [16], flexibility in handling different data types [42], and robustness to non-normality [43] and contagion detection [44]. It can effectively identify and quantify contagion effects by capturing changes in correlations during periods of financial stress or crisis.
The stock market returns are assumed to follow the below process:
r t = μ + γ 1 r t 1 + γ 2 r t 1 V I X , N A S D A Q + ε t
where r t = r 1 , t , r 2 , t , , r n , t , ε t = ε 1 , t , ε 2 , t , , ε n , t , and ε t | I t 1 ~ N 0 , H . r t is a (nx1) vector of stock market returns and εt is a (nx1) vector of conditional residuals. In this study, the vector rt consists of the returns on the four pharmaceutical companies, as well as the rates of return of two main indices (VIX and NASDAQ).
The estimate of Engle’s DCC-GARCH model consists of two steps: the estimation of the univariate GARCH model and the estimation of the time-varying conditional correlations.
The conditional variance–covariance matrix is further specified as follows:
H t = D t R t D t
where D t is a diagonal matrix of size (n × n), which contains time-varying standard deviations that are obtained from univariate GARCH models. D t presents the terms h i i , t on the ith diagonal, i = 1, 2,…, n (the univariate GARCH(1,1) model is specified as h i i , t = ω i + α i , 1 ε i , t 1 2 + β i , 1 h i i , t 1 for i = 1, 2,…, n), and R t is the time-varying correlation matrix of size (nxn).
The DCC-GARCH model proposed by Engle and Sheppard [16] involves two stages of estimation of the conditional variance–covariance matrix H t :
-
In the first stage, univariate volatility models are fitted for each rate of return and estimates for h i i , t are obtained.
-
In the second stage, stock return residuals are transformed by their estimated standard deviations (obtained in the first stage), as follows: u i , t = ε i , t / h i i , t ; then, u i , t is used to estimate the parameters of the conditional correlation.
The expression gives the evolution of the correlation in the DCC-GARCH model:
Q t = 1 a b Q + a u t 1 u t 1 + b Q t 1
where Q t = q i j , t is the (n × n) time-varying variance–covariance matrix of u t , Q = E ¯ u t u t is the (n × n) unconditional variance–covariance matrix of u t , and a   and   b are non-negative scalar parameters that satisfy the expression a + b < 1 . (A typical element of Q t is q i j , t = 1 a b ρ i j + a u i , t 1 u j , t 1 + b q i j , t 1 , where ρ i j represents the unconditional correlations of u i , t u j , t .)
Because the matrix Q t is a variance–covariance matrix, it generally does not have the value 1 on the diagonal; therefore, it was adjusted to obtain an appropriate correlation matrix R t . Thus,
R t = Q t * 1 Q t   Q t * 1
where Q t * is a diagonal matrix containing the elements q i i , t ….   q n n , t . Matrix Q t * resizes the items in the Q t matrix, so that | ρ i j , t = q i j , t q i i , t q j j , t |     1.
Now, R t from Equation (4) is a correlation matrix with the value 1 on the diagonal and off-diagonal elements being smaller than 1 in absolute value, if Q t is positively definite.
ρ i j , t = q i j , t / q i i , t q j j , t ,   i , j   = 1 , 2 . . , n   and   i j
In the last step, the Wilcoxon signed-rank test was used to test the consistency of the dynamic correlation coefficients between the combination of the four companies with NASDAQ and V.I.X. in the pre-COVID-19 and COVID-19 periods to judge the contagion effect. The t-test is the standard test for testing whether the difference between population means for two paired samples is equal. If the populations are non-normal, particularly for small samples, then the t-test is not valid. The Wilcoxon signed-rank test is a non-parametric equivalent of the t-test that is often used to assess whether there is a significant difference between two dependent or paired samples, and it is typically applied when the data do not meet the assumptions of normality.
The hypotheses of the Wilcoxon signed-rank test concern the population median of the difference scores. The null and alternative hypotheses are defined as follows:
H 0 = μ ρ C O V I D = μ ρ p r e C O V I D , H 1 = μ ρ C O V I D μ ρ p r e C O V I D
where μ ρ p r e C O V I D and μ ρ C O V I D are the conditional correlation coefficient means of population in the pre-COVID-19 and COVID-19 periods.
The test statistic for the Wilcoxon signed-rank test is W, defined as the smaller of W+ and W−, which are the sums of the positive and negative ranks:
W = min(W+,W−)
If the p-value associated with the test is below a 0.05 significance level, it indicates a significant difference, suggesting a contagion effect. On the other hand, if the p-value is above the significance level, it suggests no significant difference, implying that the correlation coefficients remained consistent across the two periods.
Furthermore, a potential confounding effect could arise between the NASDAQ and the volatility index (VIX) due to the nature of the variables involved. The NASDAQ is a stock market index heavily skewed toward technology companies, while the VIX is a measure of expected market volatility. The relationship between these two can be confounding because both can be influenced by similar external factors, such as economic policy changes, geopolitical events, and macroeconomic data releases.
In times of high uncertainty, investors may retreat from riskier assets, like tech stocks, which can lead to declines in the NASDAQ. Simultaneously, this increased uncertainty can elevate the VIX, as market participants anticipate greater future volatility. Thus, observing a negative correlation between the NASDAQ and the VIX might not necessarily indicate that changes in one are causing changes in the other; instead, it could be that both are reacting to the same underlying factors. In such a way, the observed relationship between both variables can be influenced by one or more additional variables.
Having all of this information, a robustness check analysis was added, now estimating the DCC models but alternatively using only NDQ and VIX in the analysis, in order to check the contagion effect.

4. Empirical Results

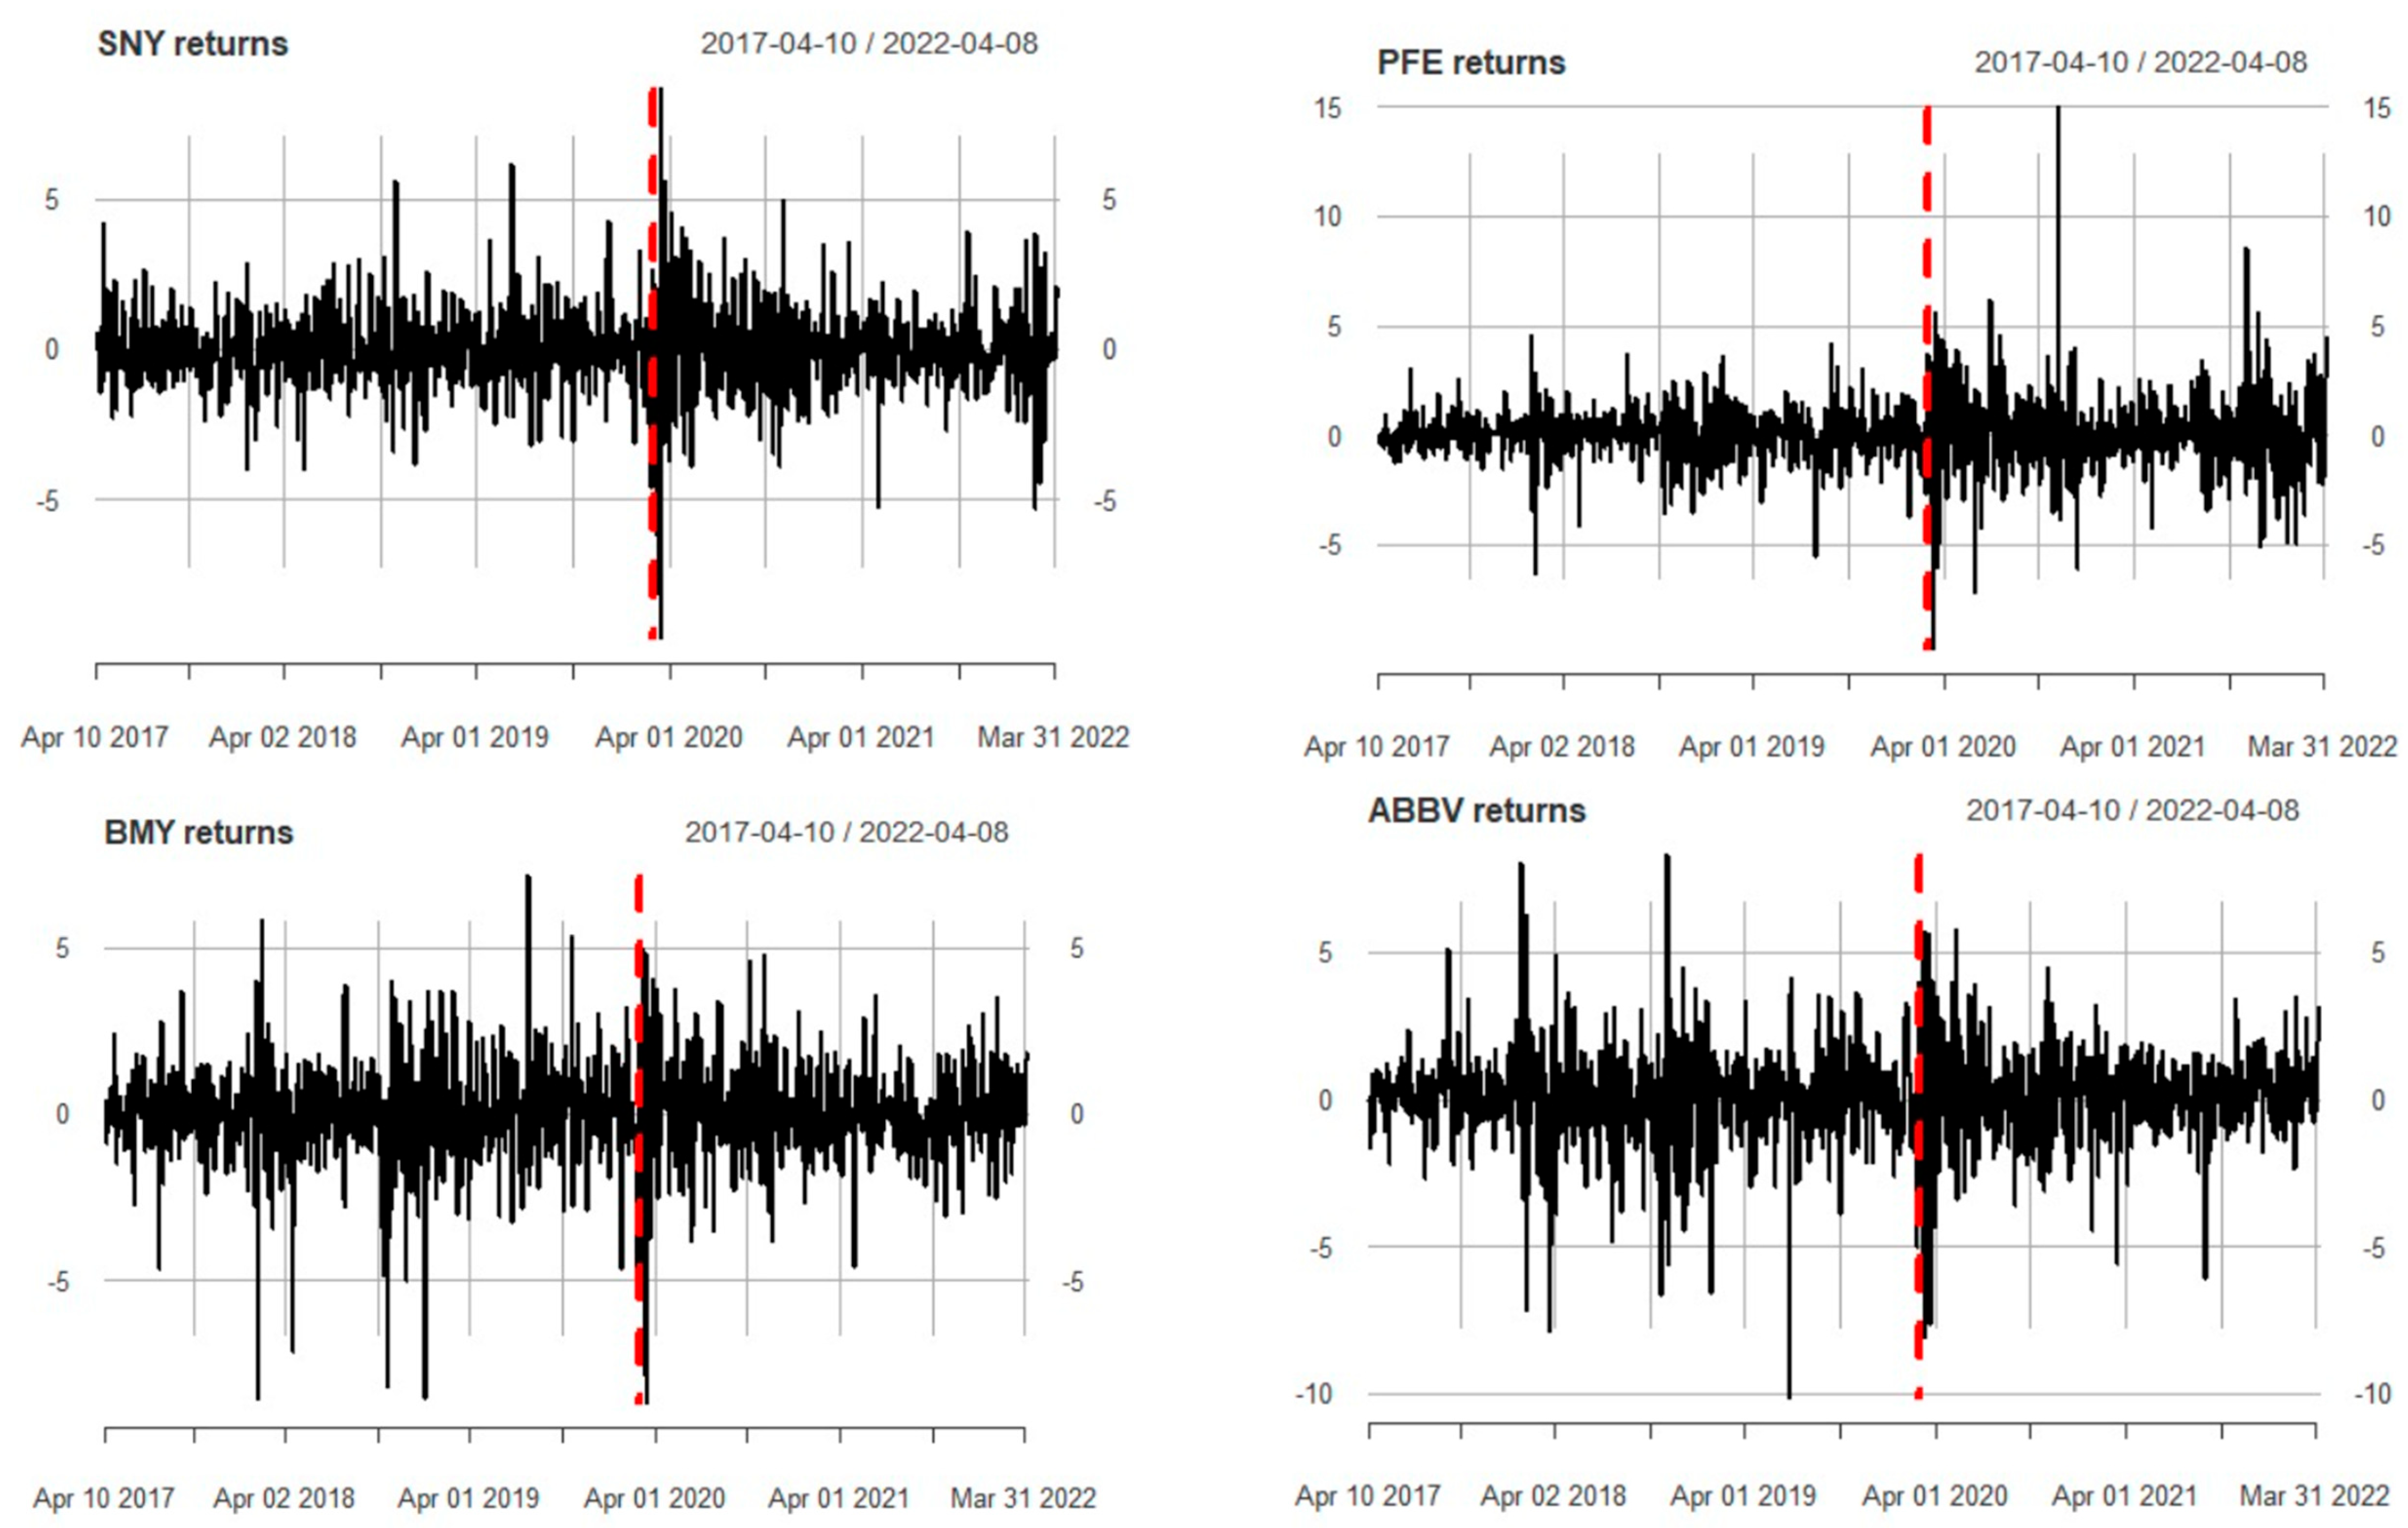
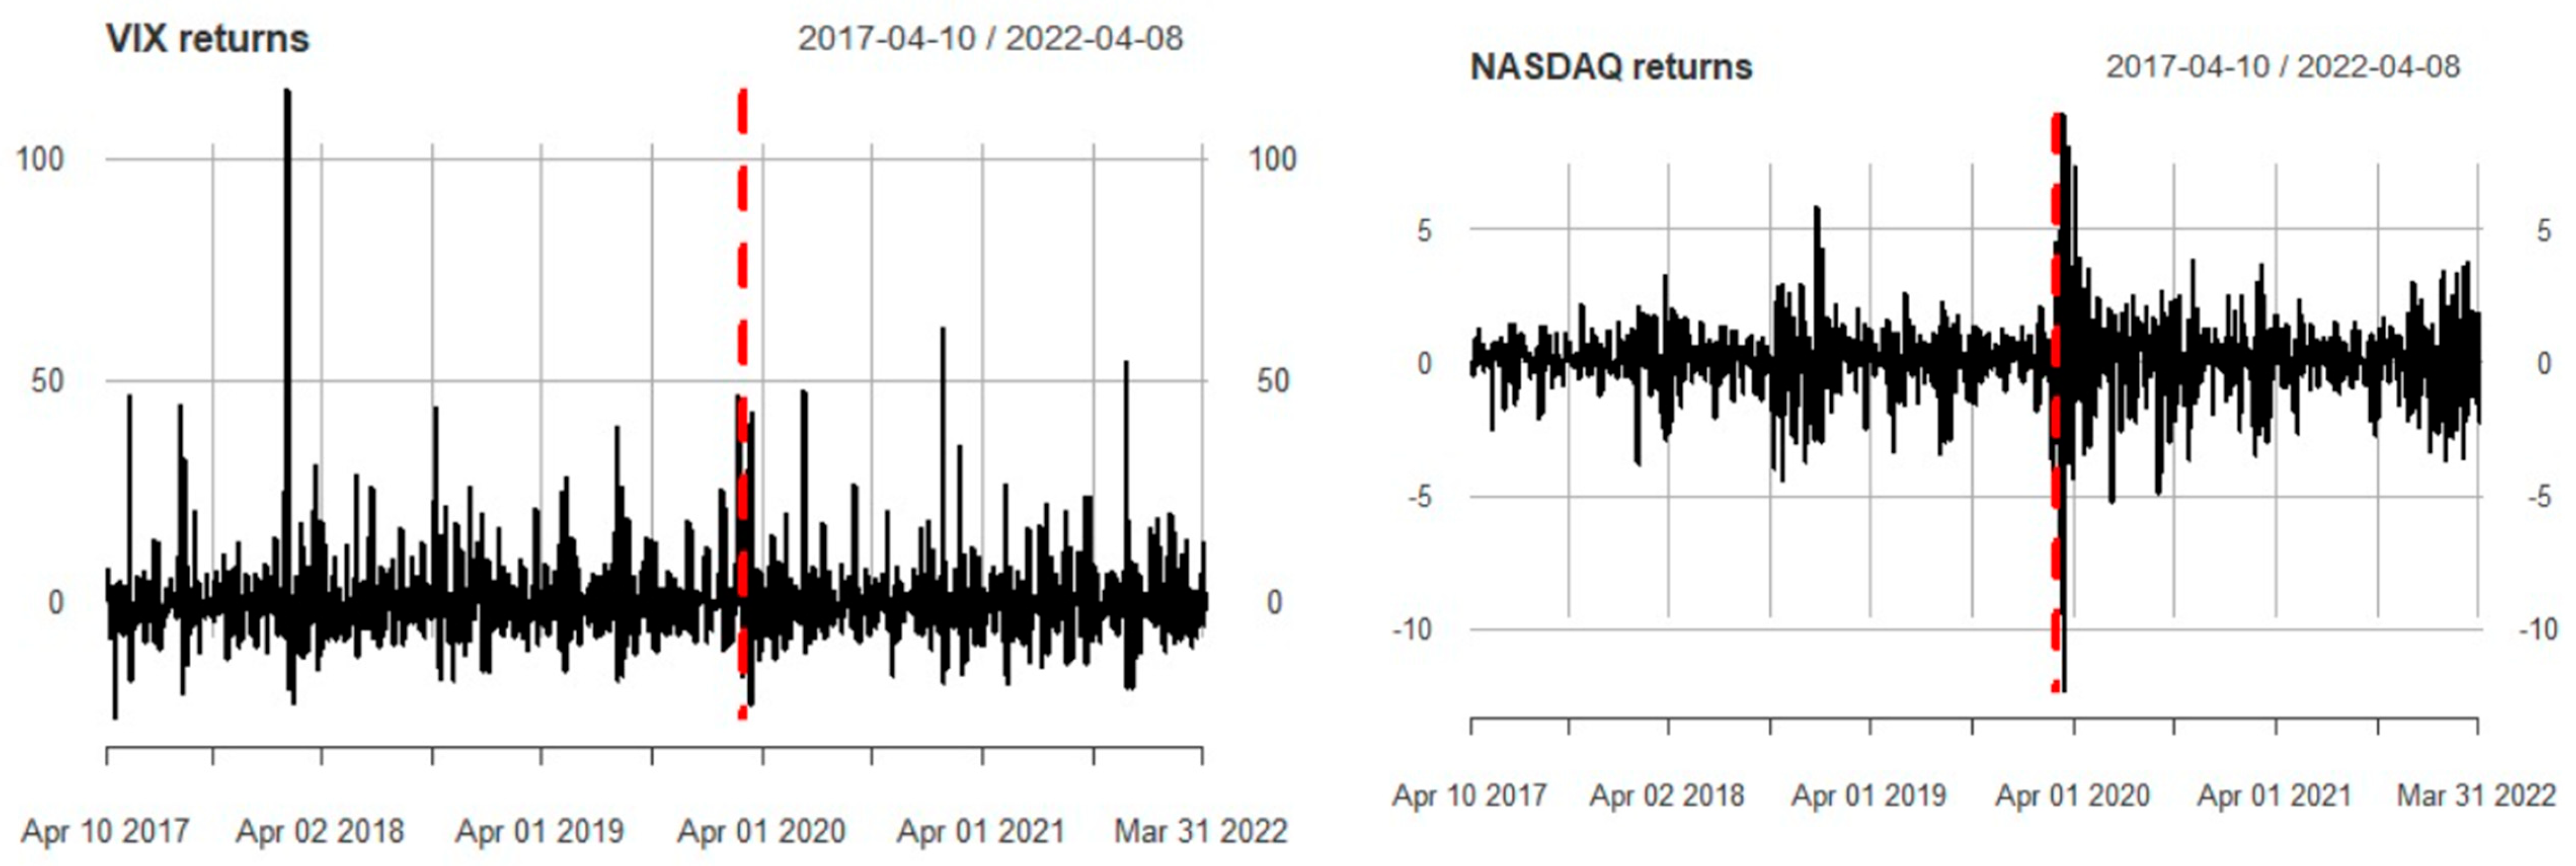
Figure 1 presents the stock return series for the pre-COVID-19 and COVID-19 periods. It can be observed that the pre-COVID-19 series share a similar pattern for all of the pharmaceutical companies analyzed. At the end of the pre-COVID-19 period, just before the official announcement of the pandemic by WHO on 11 March 2020, NASDAQ and V.I.X. series saw a high increase in terms of volatility, while the pharmaceutical companies showed just a slight increase in volatility.
Starting with the official announcement by WHO regarding the COVID-19 pandemic, companies such as Abbvie Inc., Sanofi, and Bristol Myers Squibb shared a similar pattern with NASDAQ, while Pfizer seemed to immunize better after the exogenous shock of the pandemic. For the studied period, from a graphical standpoint, the companies Abbvie Inc., Sanofi, and Bristol Myers Squibb shared a common pattern with NASDAQ, while Pfizer showed a similar pattern with V.I.X.
Furthermore, the variance ratio test was applied to evaluate potential differences in volatilities between the pre-COVID-19 and COVID-19 periods. The empirical results revealed that in most of the cases, the group variances were not equal, highlighting the existence of statistical differences between both periods, with the exception of Abbvie Inc. (Table 4).
The correlation between the variables during the pre-COVID-19 and COVID-19 periods is presented in Table 5 and Table 6, respectively. Abbvie Inc., Pfizer, Sanofi, and Bristol Myers Squibb exhibited a positive and significant correlation with NASDAQ and a negative and significant correlation with V.I.X. during the pre-COVID-19 period. The strength of the relationship is low, even if it is significant. A potential explanation for the low correlation between stock returns and the VIX index before the COVID-19 pandemic could be given by stable market conditions, lack of major market shocks, or complacent investor sentiment. Before the COVID-19 pandemic, the global financial markets were relatively stable, characterized by lower levels of market volatility, and there had been a lack of significant market shocks or events that led to heightened volatility. Investors became complacent and exhibited reduced sensitivity to market volatility, leading to a lower demand for portfolio protection strategies, such as buying options or hedging positions, which is reflected in the lower VIX levels. All of the pharmaceutical companies exhibited a lower to a medium positive and significant relationship between them. The medium correlation coefficient is between Abbvie Inc. and Pfizer or Bristol Myers Squibb, and between Pfizer and Sanofi or Bristol Myers Squibb.
However, these correlations were insignificant between pharmaceutical companies and V.I.X. during COVID-19. This indicates a change in market behavior and may mean that investors did not consider the market situation during the COVID-19 period. When comparing the correlation between the return of the NASDAQ and the return of the pharmaceutical company, again, the behavior of the pharmaceutical company was different, especially during the COVID-19 period, with a significant positive correlation between the returns of the pharmaceutical companies. However, the significance was reduced from 99% to 95% and 90% for Abbvie Inc. and Bristol Myers Squibb, and 95% to 90% for Pfizer. Sanofi’s return did not change the behavior between the two periods.
Between VIX and NDQ, there was a negative correlation in both periods, even if it was smaller for the COVID-period. The VIX is a way to gauge market sentiment and is commonly known as the “fear index” because it represents the market’s expectation of future volatility. When markets are calm and rising, the VIX tends to be low; when markets are volatile and falling, the VIX tends to be high. On the other hand, the NASDAQ is heavily weighted toward technology companies. These companies may be perceived as higher risk, and thus, when fear in the market (as represented by the VIX) increases, these stocks may see larger selloffs than other sectors, leading to a negative correlation.
During the COVID-period, the smaller magnitude of the correlation could be due to a variety of factors. Perhaps technology companies, which make up a significant portion of the NASDAQ, were seen as safer investments during the pandemic, given the shift toward remote work and digital services. This could have led to less volatility in these stocks compared to the broader market, thus reducing the strength of the negative correlation with the VIX.
Also, it can be highlighted that an increase in correlations across pharmaceutical companies during the COVID-19 pandemic can be revealed, since the COVID-19 pandemic had a significant impact on the entire pharmaceutical industry. The shared market conditions, such as increased demand for healthcare products and services, vaccine development efforts, and government regulations, led to a more synchronized response among pharmaceutical companies. As a result, their stock returns and performance may have become more closely aligned, leading to higher correlations.
Furthermore, statistical differences in the correlations before and during COVID-19 were evaluated using Fisher’s z-test. The empirical results proved the existence of statistical differences in the correlations before and during the COVID-19 pandemic.
In the initial phase of the analysis, the volatility of the returns of the four pharmaceutical companies was examined using univariate GARCH models. These models revealed a consistent first-order autoregressive structure, denoted as AR(1), indicating that the stock returns from the previous day have a significant influence on the returns of the current day. The empirical findings consistently indicated that the GARCH (1,1) model was the most suitable choice for capturing the volatility dynamics of all of the return series (Table A1 from Appendix A).
In the subsequent stage of the analysis, the focus shifted to examining the dynamic structure of the four pharmaceutical companies and investigating the potential contagion effect from the two important indices VIS and NASDAQ, by estimating two DCC-GARCH models.
Table 7 (pre-COVID-19 time) and Table 8 (COVID-19 time) illustrate the GARCH estimation findings. The L.M. test for the ARCH effects in residuals yields a p-value of 0.000 for all of the models. The GARCH (1,1) models are therefore supported.
In both models, the ARCH coefficient was found to be significant for Pfizer and Abbvie Inc., indicating the volatility of Pfizer or Abbvie Inc. In the previous days, it impacted the volatility of Pfizer and Abbvie Inc. This effect was more pronounced in the pre-COVID-19 period. However, Sanofi and Bristol Myers Squibb in the pre-COVID-19 period did not show a significant ARCH coefficient, while in the COVID-19 period, the coefficient was statistically significant.
The GARCH coefficient is significant for Pfizer, Abbvie Inc., and Bristol Myers Squibb for the pre-COVID-19 period, which implies that the market volatility from the previous day significantly impacts the volatility of the mentioned companies. This impact is higher for all of the companies during the COVID-19 period compared to in the pre-COVID-19 period. Moreover, the impact is also significant for Sanofi in the COVID-19 period. Therefore, the GARCH (1,1) model is appropriate for modeling the volatility of Pfizer, Abbvie Inc., Sanofi, and Bristol Myers Squibb during the COVID-19 period. In comparison, the market volatility has a greater influence on Pfizer’s and Abbvie’s Bristol’s volatility than on Sanofi’s volatility, indicating that they reacted differently to market volatility during the COVID-19 period.
Figure 2 illustrates the dynamic correlations between Pfizer-NASDAQ, Abbvie-NASDAQ, Bristol Myers Squibb-NASDAQ, and Sanofi-NASDAQ over time. It can be observed that during the COVID-19 period, the dynamic correlations between these stocks increased significantly in comparison to the pre-COVID-19 period, indicating a clear contagion effect. This result suggests that the biopharmaceutical companies might have positively impacted the market, mitigating the downturn caused by the lockdown and the cessation of activities in most economic sectors.
Similarly, Figure 3 illustrates the dynamic correlations between Pfizer-VIX, Abbvie-VIX, Bristol Myers Squibb-VIX, and Sanofi-VIX over time. It can be observed that during the COVID-19 period, the dynamic correlations between these companies and V.I.X. increased significantly in comparison to the pre-COVID-19 period, indicating a clear contagion effect. The strength of the correlation coefficient is slightly lower than with NASDAQ, but it is still medium.
Furthermore, given the negative and strong correlation between VIX and NDQ, a robustness check analysis was performed estimating four DCC models, with two of them incorporating only VIX before and during COVID-19, as well as two models for NASDAQ (NDQ) before and during COVID-19. The empirical results are presented in Table 9 and Table 10.
In the case of VIX-DCC-GARCH, in both models (pre- and during COVID-19), the ARCH coefficient was found to be significant for all four pharmaceutical companies, and this result was preserved in both periods. The effect was more pronounced in the pre-COVID-19 period.
The GARCH coefficient is significant for all four companies of Pfizer, Abbvie Inc., Sanofi-Aventis, and Bristol Myers Squibb for both periods, which implies that the market volatility from the previous day significantly impacts the volatility of the mentioned companies. This impact was higher during the COVID-19 period for Pfizer, although for the other three companies the impact was higher in the pre-COVID-19 period. Therefore, the GARCH (1,1) model is appropriate for modeling the volatility of Pfizer, Abbvie Inc., Sanofi, and Bristol Myers Squibb during the COVID-19 period. In comparison, the market volatility has a greater influence on Pfizer’s and Sanofi’s volatility than AbbVie’s and Bristol’s volatility, with Pfizer and Sanofi being prominent pharmaceutical companies with significant market capitalization and global operations. As such, they are more likely to be influenced by market-wide events and sentiments during times of heightened uncertainty, such as the COVID-19 pandemic.
In the case of NDQ-DCC-GARCH, in both models (pre- and during COVID-19), the ARCH coefficient was found to be significant for all four pharmaceutical companies, and this result was preserved in both periods. The effect was more pronounced in the pre-COVID-19 period.
The GARCH coefficient is significant for all four companies of Pfizer, Abbvie Inc., and Sa Bristol Myers Squibb and nofi-Aventis for both periods, which implies that the market volatility from the previous day significantly impacts the volatility of the mentioned companies. This impact was higher during the COVID-19 period for Pfizer, although for the other three companies the impact was higher in the pre-COVID-19 period. Therefore, the GARCH (1,1) model is appropriate for modeling the volatility of Pfizer, Abbvie Inc., Sanofi, and Bristol Myers Squibb during the COVID-19 period. In comparison, the market volatility has a greater influence on Pfizer’s, Sanofi’s, and AbbVie’s volatility than Bristol’s volatility.
In the analysis of the DCC-GARCH model, various criteria such as the AIC (Akaike information criterion), BIC (Bayesian information criterion), Shibata criterion, and Hannan–Quinn criterion were used as error measure analysis criteria. These criteria are commonly employed in model selection and comparison to assess the goodness of fit and determine the most appropriate model. Lower values of all of these criteria indicate better model fit. These error measure analysis criteria help to assess the trade-off between model complexity and goodness of fit. By comparing these criteria across different models or variations in the DCC-GARCH model, the most appropriate model that achieves a good balance between accuracy and simplicity can be determined. The smallest values were registered by the NDQ model from the pre-COVID-19 period.
To check for the existence of contagion, the analysis employed the Wilcoxon signed-rank test to test whether the DCC correlation coefficients are different in the pre-COVID-19 and COVID-19 periods. Table 11 shows the findings of the test. In Table 11, the null hypothesis of the mean of the DCC correlations which is the same in the pre-COVID-19 and COVID-19 periods is rejected for Pfizer, Abbvie Inc., Sanofi, and Bristol Myers Squibb. All of the pharmaceutical companies were the most influenced by the contagion effects from NASDAQ and V.I.X.
The contagion effect from NASDAQ implies that movements or changes in the NASDAQ index, which represents a significant portion of technology stocks, have had a substantial impact on the stock prices or returns of Pfizer, AbbVie Inc., Sanofi, and Bristol Myers Squibb. This suggests a high degree of interdependence or sensitivity of these pharmaceutical companies’ stock performance to the overall market conditions of the technology sector, as reflected by NASDAQ.
Similarly, the contagion effect from V.I.X., also known as the “Fear Index”, indicates that changes in market volatility, as measured using V.I.X., influenced the stock prices or returns of Pfizer, AbbVie Inc., Sanofi, and Bristol Myers Squibb. Higher levels of market volatility, often associated with increased investor fear or uncertainty, can have an impact on the stock prices of various companies, including those in the pharmaceutical sector.

5. Discussion

This study aimed to examine biopharmaceutical companies’ performance in the stock market during the COVID-19 pandemic and compare it to the pre-crisis period. The analysis focused on Pfizer, Abbvie Inc., Sanofi, and Bristol Myers Squibb, the first company to develop a vaccine using messenger R.N.A. technology and the other three main pharmaceutical companies in terms of market share that are not part of the technological index NASDAQ. The study investigated the correlation between the returns of these companies and the technology market index (NASDAQ) and market volatility (V.I.X.) in both the pre-and COVID-19 periods.
Based on the findings, it can be concluded that the behavior of Pfizer’s and Abbvie’s returns varied depending on the time analyzed. Specifically, during the pre-COVID-19 period, all four companies’ returns were influenced by both the technology market and market volatility. However, during the COVID-19 period, the signs of these two benchmarks were interchanged. On the other hand, during the pre-COVID-19 period, the technology market and market volatility significantly impacted Pfizer, Sanofi, AbbVie, and Bristol Myers Squibb, which changed during the COVID-19 period, as they were affected by both the technology market and market volatility. These findings suggest that investors perceived Pfizer as a favorable investment choice during the COVID-19 period, likely due to the company’s vaccine development, regardless of market volatility.
Furthermore, Pfizer is a bigger and more established company with a greater number of divisions than its counterparts, which did not have a COVID-19 vaccine on the market. However, the companies were conceived by investors as a clear choice for investment, despite market volatility, since the COVID-19 virus has similar treatment as a normal flu and other pharmaceutical companies develop these treatments. Hypothesis 1 is totally validated, revealing that all four companies were affected by market volatility during the COVID-19 period. The influence of market volatility on Pfizer, AbbVie Inc., Sanofi, and Bristol Myers Squibb during the COVID-19 period confirms Hypothesis H1. These results are in line with other authors who have found similar results for Pfizer [45,46].
Two DCC-GARCH models were used to examine the volatility of Pfizer, AbbVie Inc., Sanofi, and Bristol Myers Squibb in relation to VIX and alternatively to NASDAQ. The data show that the volatility of all of the companies varied from one period to the next. During the pre-COVID-19 period, the effect of the previous day’s company volatility was greater than the influence of the previous day’s market volatility. During the COVID-19 era, however, the reverse was true. According to Baker [47], this change may be linked to the trade scenario and individual movement constraints created during the COVID-19 period. Additionally, the effect of market volatility on Pfizer’s volatility throughout the COVID-19 era was demonstrated to be bigger than the influence on the other companies’ volatility, validating hypothesis H2. This finding again indicates that pharmaceutical companies performed differently over the study time, with Bristol being less influenced by market volatility.
Moreover, the empirical results of the Wilcoxon test revealed the existence of a contagion effect between all four pharmaceutical companies and NASDAQ on the one hand, as well as also regarding VIX, demonstrating the existence of a contagion effect between the companies and both NASDAQ and V.I.X., confirming hypothesis H3. This means that, unlike other market indexes, all four pharmaceutical companies operated as a “locomotive” for the market, preventing NASDAQ from experiencing significant losses and delayed recovery. The study’s results align with Piñeiro-Chousa’s [45] paper, with the observation that this previous study only treated the U.S. biopharmaceutical market and stated that further research was needed considering different markets and companies that either developed a COVID-19 vaccine or did not. In this sense, in terms of novelty, this study, on the one hand, confirms the results of the study of Piñeiro-Chousa for the Pfizer company but took into consideration the three biggest global pharmaceutical companies in terms of market share (Abbvie Inc., Sanofi, and Bristol Myers Squibb), with one of them, namely Sanofi, being part of the European market. Another novelty of the study is the contagion effect analysis that employed t-tests to test whether DCC correlation coefficients differed in the pre-COVID-19 and COVID-19 periods.
Also, the research of Pineiro-Chousa [45] introduces the concept of the “paradoxical cycle”, which suggests that human activities can trigger changes and negative consequences in interconnected systems and sectors. These changes can lead to imbalances with uncertain implications for human well-being. The “paradoxical cycle” implies that actions taken in one sector can have unintended consequences in other sectors, creating a chain reaction of effects. Financial crises can illustrate the “paradoxical cycle”, as actions in the financial sector can have ripple effects on other sectors of the economy. The 2008 global financial crisis started in the housing and financial sectors but quickly spread to other sectors, impacting employment, consumer spending, and business investment. The study of Reinhart and Rogoff [48] provides empirical evidence on the contagion effects and interdependencies across sectors during financial crises.
The COVID-19 pandemic itself serves as empirical evidence of the “paradoxical cycle”. The actions taken to contain the virus, such as lockdowns and travel restrictions, have had significant spillover effects on various sectors of the economy. For instance, the closure of businesses and restrictions on mobility in the tourism and hospitality sectors have resulted in widespread job losses and economic contractions. Studies conducted during the pandemic [49,50,51], such as those analyzing the economic and health impacts of non-pharmaceutical interventions, highlight the interconnectedness of sectors and the chain reactions triggered by the pandemic.

6. Conclusions

This study specifically focuses on the market performance of the biopharmaceutical vaccine developer Pfizer and the other three main pharmaceutical companies Abbvie Inc., Sanofi, and Bristol Myers Squibb, and their contribution to the search for effective solutions to the COVID-19 pandemic. Sanofi is part of the European market, while the other three companies are in the U.S. market.
The findings of this study have significant implications for various stakeholders at different levels. These results highlight the importance of reducing stock market uncertainty and risk, and governments and policymakers should formulate policies to mitigate or prevent extreme volatility. Monitoring market volatility is also important to control possible unjustified panic situations generated by events such as COVID-19. This requires investors to obtain accurate and accessible information to help them to make decisions based on reality rather than assumptions.
Economic, social, and environmental policies developed by governments and agencies must prioritize preventing such events by setting up effective action lines to respond quickly and effectively. The objective must be to abide by the principles necessary to ensure strictly sustainable growth. The COVID-19 contagious effect found between Pfizer, AbbVie, Sanofi, Bristol, Squibb, NASDAQ-100, and V.I.X. emphasizes the importance of key technologies in financial markets to offer solutions to major events beyond traditional safe-haven assets. Investors must be able to evaluate firms such as Pfizer fairly, which have made strong commitments in terms of R&D, innovation, and knowledge generation to mitigate the serious effects of the COVID-19 epidemic and other diseases. Investors should also consider significant differences in the financial performance of biopharmaceutical companies, particularly in the face of high-impact events and health crises.
This study shows that investors invested heavily in innovative biopharmaceutical companies during the COVID-19 crisis, rewarding their initiatives and producing pharmaceutical products to help humankind recover from such infections. Meanwhile, public authorities must focus on developing policies to promote business innovation, knowledge generation, and a natural transition toward a green economy.
Therefore, governments, organizations, investors, and society must strive to respond quickly and successfully to catastrophic events and unforeseen diseases that have serious economic and social consequences, and demonstrate strong commitment to avoiding and reducing the conditions that cause these negative events. Companies must change their business strategies to be more ethical and sustainable and create and use technological advances in production and commercialization processes that are environmentally friendly and resource-efficient. Politicians, investors, and communities must work together to promote this change and achieve a common commitment to environmental sustainability to ensure human health and existence.
This study, like any other empirical study, has limitations. Firstly, the analysis of the COVID-19 period can be considered to be limited, and even so, the new global situation related to the conflict between Russia and Ukraine can raise awareness of the stock market. It would be worth analyzing the COVID-19 period, also covering the outbreak of the war in Europe. Secondly, only four biopharmaceutical companies from the U.S. and European markets were part of this study. It would be worth investigating how other biopharmaceutical companies from important markets such as Japan, China, and Australia behaved in the context of the pandemic. Thirdly, a relatively small number of companies were considered for this study.
In terms of future research directions, controversy from the news related to the COVID-19 vaccine or medicine could be considered in subsequent studies, and the vaccination rate, the number of infections with COVID-19, or other indicators closely related to the virus might be added in a DCC-GARCH approach. Finally, in future research, it would also be worth inspecting how different sectors behaved during COVID-19 and how the contagion effects were spread across industries in the U.S. and European markets.

Author Contributions

Conceptualization, A.A.D., E.M.M., O.M.V., M.G., R.G.H. and P.L.B.; methodology, A.A.D., E.M.M. and M.G.; software, E.M.M.; validation, A.A.D., E.M.M., O.M.V., M.G., R.G.H. and P.L.B.; formal analysis, O.M.V., A.A.D. and P.L.B.; investigation, A.A.D., E.M.M., O.M.V., M.G., R.G.H. and P.L.B.; resources, R.G.H. and P.L.B.; data curation, A.A.D. and E.M.M.; writing—original draft preparation, A.A.D., E.M.M., O.M.V., M.G., R.G.H. and P.L.B.; writing—review and editing, A.A.D. and E.M.M.; visualization, A.A.D. and E.M.M.; supervision, A.A.D.; project administration, A.A.D. All authors have read and agreed to the published version of the manuscript.

Funding

This research received no external funding.

Data Availability Statement

The data are available upon request to the author of correspondence.

Acknowledgments

The research study was conducted within the Data Science Research Lab for Business and Economics of the Bucharest University of Economic Studies, within the project ID 585 PERFECTIS, entitled ‘Increasing institutional performance through the development of the infrastructure and research ecosystem of transdisciplinary excellence in the socio-economic field’, contract number and date: 42PFE, 30.12.2021, within the project ID CNFIS-FDI-20223-F-0499, entitled ‘The development and promotion of excellence research in BUES by strengthening the R&D processes, supporting the visibility of the results and the impact on the economic environment, in an Open Science context’ and within the project entitled “Analysis of sources of uncertainty regarding the forecasting of the evolution of the national economic environment in the context of recent global socio-economic shocks” (INCERTEC 2023).

Conflicts of Interest

The authors declare no conflict of interest.

Appendix A

Figure A1. Evolution of the prices of the companies.
Mathematics 11 03116 g0a1aMathematics 11 03116 g0a1b
Table A1. The empirical results of ARCH-GARCH models.
VariableModelLM-TestProb.Conclusion
ABBVARCH (1)39.770.000The model does not capture the ARCH effects
GARCH (1,1)3.820.986The model does capture the ARCH effects
PFEARCH (1)38.760.000The model does not capture the ARCH effects
GARCH (1,1)4.330.976The model does capture the ARCH effects
BMYARCH (1)34.120.000The model does not capture the ARCH effects
GARCH (1,1)4.020.983The model does capture the ARCH effects
SNYARCH (1)71.720.000The model does not capture the ARCH effects
GARCH (1,1)5.430.941The model does capture the ARCH effects
NASDAQARCH (1)196.050.000The model does not capture the ARCH effects
GARCH (1,1)15.070.237The model does capture the ARCH effects
VIXARCH (1)20.140.044The model does not capture the ARCH effects
GARCH (1,1)3.960.983The model does capture the ARCH effects

References

  1. Piñeiro-Chousa, J.; López-Cabarcos, M.Á.; Caby, J.; Šević, A. The influence of investor sentiment on the green bond market. Technol. Forecast. Soc. Chang. 2021, 162, 120351. [Google Scholar] [CrossRef]
  2. Calabrese, A.; Costa, R.; Ghiron, N.L.; Tiburzi, L.; Pedersen, E.R.G. How sustainable-orientated service innovation strategies are contributing to the sustainable development goals. Technol. Forecast. Soc. Chang. 2021, 169, 120816. [Google Scholar] [CrossRef]
  3. Faivre, N.; Fritz, M.; Freitas, T.; De Boissezon, B.; Vandewoestijne, S. Nature-Based Solutions in the E.U.: Innovating with nature to address social, economic, and environmental challenges. Environ. Res. 2017, 159, 509–518. [Google Scholar] [CrossRef] [PubMed]
  4. Haines, A.; Ebi, K. The imperative for climate action is to protect health. N. Engl. J. Med. 2019, 380, 263–273. [Google Scholar] [CrossRef] [PubMed]
  5. Myers, S.S. Planetary health: Protecting human health on a rapidly changing planet. Lancet 2017, 390, 2860–2868. [Google Scholar] [CrossRef]
  6. Hale, T.; Angrist, N.; Goldszmidt, R.; Kira, B.; Petherick, A.; Phillips, T.; Tatlow, H. A global panel database of pandemic policies (Oxford COVID-19 Government Response Tracker). Nat. Hum. Behav. 2021, 5, 529–538. [Google Scholar] [CrossRef]
  7. Brooks, C.; Rew, A.G. Testing for a unit root in a process exhibiting a structural break in the presence of GARCH errors. Comput. Econ. 2002, 20, 157–176. [Google Scholar] [CrossRef]
  8. Chen, M.; Huang, Y.; Liu, Y. The Impact of COVID-19 on the Volatility of Biopharmaceutical Stock Prices: Evidence from the DCC-GARCH Model. Front. Pharmacol. 2021, 12, 632154. [Google Scholar]
  9. Sharma, R.; Mishra, S. Dynamic Conditional Correlation and Volatility Spillover between COVID-19 and Stock Market Volatility: Evidence from India. Int. J. Sci. Res. Comput. Sci. Eng. Inf. Technol. 2020, 6, 111–116. [Google Scholar]
  10. Wan, S.; Chen, C.; Wang, M.; Chen, W. Modeling the Impact of COVID-19 on Stock Market Volatility with GARCH and EGARCH Models. J. Risk Financ. Manag. 2020, 13, 120. [Google Scholar] [CrossRef]
  11. Khan, M.; Kayani, U.N.; Khan, M.; Mughal, K.S.; Haseeb, M. COVID-19 Pandemic & Financial Market Volatility; Evidence from GARCH Models. J. Risk Financ. Manag. 2023, 16, 50. [Google Scholar]
  12. Nguyen, T.N.; Phan TK, H.; Nguyen, T.L. Financial contagion during global financial crisis and COVID–19 pandemic: The evidence from DCC–GARCH model. Cogent Econ. Financ. 2022, 10, 2051824. [Google Scholar] [CrossRef]
  13. Gunay, S.; Can, G. The source of financial contagion and spillovers: An evaluation of the covid-19 pandemic and the global financial crisis. PLoS ONE 2022, 17, e0261835. [Google Scholar] [CrossRef]
  14. Ji, X.; Wang, S.; Xiao, H.; Bu, N.; Lin, X. Contagion Effect of Financial Markets in Crisis: An Analysis Based on the DCC–MGARCH Model. Mathematics 2022, 10, 1819. [Google Scholar] [CrossRef]
  15. Siddiqui, T.A.; Khan, M.F.; Naushad, M.; Syed, A.M. Cross-Market Correlations and Financial Contagion from Developed to Emerging Economies: A Case of COVID-19 Pandemic. Economies 2022, 10, 147. [Google Scholar] [CrossRef]
  16. Engle, R. Dynamic conditional correlation: A simple class of multivariate generalized autoregressive conditional heteroskedasticity models. J. Bus. Econ. Stat. 2002, 20, 339–350. [Google Scholar] [CrossRef]
  17. World Health Organization [WHO]. WHO-Convened Global Study of Origins of SARS-CoV-2: China Part. WHO. 2021. Available online: https://www.who.int/publications/i/item/who-convened-global-study-of-origins-of-sars-cov-2-china-part (accessed on 1 February 2022).
  18. Goodell, J.W. COVID-19 and finance: Agendas for future research. Financ. Res. Lett. 2020, 35, 101512. [Google Scholar] [CrossRef]
  19. Shaikh, I. Impact of COVID-19 pandemic disease outbreak on the global equity markets. Econ. Res. Ekon. Istraživanja 2021, 34, 2317–2336. [Google Scholar] [CrossRef]
  20. Baek, S.; Mohanty, S.K.; Glambosky, M. COVID-19 and stock market volatility: An industry level analysis. Financ. Res. Lett. 2020, 37, 101748. [Google Scholar] [CrossRef]
  21. Albulescu, C. Coronavirus and financial volatility: 40 days of fasting and fear. arXiv 2020, arXiv:2003.04005. [Google Scholar] [CrossRef] [Green Version]
  22. Heyden, K.J.; Heyden, T. Market reactions to the arrival and containment of COVID-19: An event study. Financ. Res. Lett. 2021, 38, 101745. [Google Scholar] [CrossRef] [PubMed]
  23. Albulescu, C.T. COVID-19 and the United States financial markets’ volatility. Financ. Res. Lett. 2021, 38, 101699. [Google Scholar] [CrossRef] [PubMed]
  24. Baig, A.S.; Butt, H.A.; Haroon, O.; Rizvi, S.A.R. Deaths, panic, lockdowns, and U.S. equity markets: The case of COVID-19 pandemic. Financ. Res. Lett. 2021, 38, 101701. [Google Scholar] [CrossRef] [PubMed]
  25. Zaremba, A.; Kizys, R.; Aharon, D.Y.; Demir, E. Infected markets: Novel coronavirus, government interventions, and stock return volatility around the globe. Financ. Res. Lett. 2020, 35, 101597. [Google Scholar] [CrossRef] [PubMed]
  26. David, S.A.; Inácio, C.M., Jr.; Machado, J.A.T. The recovery of global stock markets indices after impacts due to pandemics. Res. Int. Bus. Financ. 2021, 55, 101335. [Google Scholar] [CrossRef]
  27. Chaudhary, R.; Bakhshi, P.; Gupta, H. Volatility in international stock markets: An empirical study during COVID-19. J. Risk Financ. Manag. 2020, 13, 208. [Google Scholar] [CrossRef]
  28. Yousfi, M.; Zaied, Y.B.; Cheikh, N.B.; Lahouel, B.B.; Bouzgarrou, H. Effects of the COVID-19 pandemic on the U.S. stock market and uncertainty: A comparative assessment between the first and second waves. Technol. Forecast. Soc. Chang. 2021, 167, 120710. [Google Scholar] [CrossRef]
  29. Albuquerque, R.; Koskinen, Y.; Yang, S.; Zhang, C. Resiliency of environmental and social stocks: An analysis of the exogenous COVID-19 market crash. Rev. Corp. Financ. Stud. 2020, 9, 593–621. [Google Scholar] [CrossRef]
  30. Boyer, B.H.; Kumagai, T.; Yuan, K. How do crises spread? Evidence from accessible and inaccessible stock indices. J. Financ. 2006, 61, 957–1003. [Google Scholar] [CrossRef]
  31. Chiang, T.C.; Jeon, B.N.; Li, H. Dynamic correlation analysis of financial contagion: Evidence from Asian markets. J. Int. Money Financ. 2007, 26, 1206–1228. [Google Scholar] [CrossRef]
  32. Syllignakis, M.N.; Kouretas, G.P. Dynamic correlation analysis of financial contagion: Evidence from the Central and Eastern European markets. Int. Rev. Econ. Financ. 2011, 20, 717–732. [Google Scholar] [CrossRef]
  33. Davidescu, A.A.; Manta, E.M.; Hapau, R.G.; Gruiescu, M.; Vacaru, O.M. Exploring the Contagion Effect from Developed to Emerging C.E.E. Financial Markets. Mathematics 2023, 11, 666. [Google Scholar] [CrossRef]
  34. Akhtaruzzaman, M.; Boubaker, S.; Sensoy, A. Financial contagion during COVID-19 crisis. Financ. Res. Lett. 2021, 38, 101604. [Google Scholar] [CrossRef]
  35. Ji, Q.; Zhang, D.; Zhao, Y. Searching for safe-haven assets during the COVID-19 pandemic. Int. Rev. Financ. Anal. 2020, 71, 101526. [Google Scholar] [CrossRef]
  36. World Health Organization [WHO]. COVID-19 Vaccines. 2021. Available online: https://www.who.int/emergencies/diseases/novel-coronavirus-2019/covid-19-vaccines (accessed on 6 March 2023).
  37. Thakor, R.T.; Anaya, N.; Zhang, Y.; Vilanilam, C.; Siah, K.W.; Wong, C.H.; Lo, A.W. Just how good an investment is the biopharmaceutical sector? Nat. Biotechnol. 2017, 35, 1149–1157. [Google Scholar] [CrossRef]
  38. Chen, C.D.; Chen, C.C.; Tang, W.W.; Huang, B.Y. The positive and negative impacts of the SARS outbreak: A case of the Taiwan industries. J. Dev. Areas 2009, 43, 281–293. [Google Scholar] [CrossRef]
  39. Ichev, R.; Marinč, M. Stock prices and geographic proximity of information: Evidence from the Ebola outbreak. Int. Rev. Financ. Anal. 2018, 56, 153–166. [Google Scholar] [CrossRef]
  40. Al-Awadhi, A.M.; Alsaifi, K.; Al-Awadhi, A.; Alhammadi, S. Death and contagious infectious diseases: Impact of the COVID-19 virus on stock market returns. J. Behav. Exp. Financ. 2020, 27, 100326. [Google Scholar] [CrossRef]
  41. Corsetti, G.; Pericoli, M.; Sbracia, M. ‘Some contagion, some interdependence’: More pitfalls in tests of financial contagion. J. Int. Money Financ. 2005, 24, 1177–1199. [Google Scholar] [CrossRef]
  42. Lai, K.K.; Xing, H. Dynamic conditional correlation models for evaluating and forecasting Value-at-Risk. J. Forecast. 2008, 27, 305–325. [Google Scholar]
  43. Francq, C.; Zakoian, J.M. GARCH Models: Structure, Statistical Inference and Financial Applications; John Wiley & Sons: Hoboken, NJ, USA, 2010. [Google Scholar]
  44. Diebold, F.X.; Yilmaz, K. Better to give than to receive: Predictive directional measurement of volatility spillovers. Int. J. Forecast. 2012, 28, 57–66. [Google Scholar] [CrossRef] [Green Version]
  45. Piñeiro-Chousa, J.; López-Cabarcos, M.Á.; Quiñoá-Piñeiro, L.; Pérez-Pico, A.M. U.S. biopharmaceutical companies’ stock market reaction to the COVID-19 pandemic. Understanding the concept of the ‘paradoxical spiral’ from a sustainability perspective. Technol. Forecast. Soc. Chang. 2022, 175, 121365. [Google Scholar] [CrossRef] [PubMed]
  46. Ho, K.C.; Chen, C.; Yang, D.; Gao, Y. Medical reform, COVID-19 vaccine and stock returns: The case of Chinese listed pharmaceutical and healthcare companies. Appl. Econ. Lett. 2022, 1–8. [Google Scholar] [CrossRef]
  47. Baker, S.R.; Bloom, N.; Davis, S.J.; Kost, K.J.; Sammon, M.C.; Viratyosin, T. The unprecedented stock market impact of COVID-19 (No. w26945). Natl. Bur. Econ. Res. 2020. [Google Scholar] [CrossRef]
  48. Rogoff, K.S.; Reinhart, C. This Time Is Different; Princeton University Press: Princeton, NJ, USA, 2009; p. 208. [Google Scholar]
  49. Cutler, D.M.; Summers, L.H. The COVID-19 Pandemic and the $16 Trillion Virus. JAMA 2020, 324, 1495–1496. [Google Scholar] [CrossRef]
  50. Hale, T.; Webster, S.; Petherick, A.; Phillips, T.; Kira, B. Oxford COVID-19 Government Response Tracker; Blavatnik School of Government: Oxford, UK, 2020. [Google Scholar]
  51. McKibbin, W.J.; Fernando, R. The Economic Impact of COVID-19. Asian Econ. Pap. 2020, 19, 1–45. [Google Scholar]
Figure 1. Stock return series pre-COVID-19 and during COVID-19.
Mathematics 11 03116 g001aMathematics 11 03116 g001b
Figure 2. DCC-GARCH model estimates with NASDAQ.
Mathematics 11 03116 g002
Figure 3. DCC-GARCH model estimates with V.I.X.
Mathematics 11 03116 g003
Table 1. Descriptive statistics for the pre-COVID-19 period.
ObsMeanStd. Dev.Min.Max.SkewnessKurtosis
ABBV526−0.0151.85−10.1268.325−0.513.56
PFE5260.0091.23−5.5414.161−0.311.50
SNY5260.0271.28−6.1776.17502.84
BMY5260.0111.65−8.0697.178−0.504.04
NDQ5260.0381.28−7.2875.834−0.544.19
VIX5260.4618.95−22.86746.5471.404.02
ABBV: AbbVie returns; P.F.E.: Pfizer returns; SNY: Sanofi-Aventis returns; B.M.Y.: Bristol Myers Squibb returns; N.D.Q.: NASDAQ returns; V.I.X.: variation in V.I.X.—period range: 6 February 2018–10 March 2020.
Table 2. Descriptive statistics for the COVID-19 period.
ObsMeanStd. Dev.Min.Max.SkewnessKurtosis
ABBV5260.1461.60−8.1005.782−0.664.18
PFE5260.1221.99−9.71515.0310.577.54
SNY5260.0501.55−9.5518.683−0.356.18
BMY5260.0681.46−8.6794.892−0.504.19
NDQ5260.1211.75−12.1329.346−0.568.69
VIX5260.1968.96−23.37461.6451.999.24
ABBV: AbbVie returns; P.F.E.: Pfizer returns; SNY: Sanofi-Aventis returns; B.M.Y.: Bristol Myers Squibb returns; N.D.Q.: NASDAQ returns; V.I.X.: variation in V.I.X. Period range: 11 March 2020–8 April 2022.
Table 3. The empirical results of ARCH-LM test.
VariableChi-Sq.Prob.Conclusion
ABBV200.170.000Conditional heteroscedasticity was detected
PFE44.90.000Conditional heteroscedasticity was detected
BMY100.060.000Conditional heteroscedasticity was detected
SNY223.870.000Conditional heteroscedasticity was detected
NASDAQ466.170.000Conditional heteroscedasticity was detected
VIX14.370.056Conditional heteroscedasticity was detected
Table 4. The empirical results of variance ratio test.
VariableFp-ValueConclusion
ABBV0.9190.337The group variances are equal
PFE0.3590.000 ***The group variances are not equal
BMY0.8670.100 *The group variances are not equal
SNY0.5180.000 ***The group variances are not equal
NASDAQ0.3830.000 ***The group variances are not equal
VIX1.150.10 *The group variances are equal
ABBV: AbbVie returns; P.F.E.: Pfizer returns; SNY: Sanofi-Aventis returns; B.M.Y.: Bristol Myers Squibb returns; N.D.Q.: NASDAQ returns; V.I.X.: variation in V.I.X. ***, **, and * indicate the significance level at 1%, 5%, and 10%, respectively.
Table 5. Correlations in the pre-COVID-19 period.
ABBVPFESNYBMYNDQ
PFE0.4577 ***
SNY0.2449 ***0.4131 ***
BMY0.4180 ***0.4034 ***0.3127 ***
NDQ0.2077 ***0.125 **0.1831 ***0.1421 ***
VIX−0.1927 ***−0.1457 **−0.1832 ***−0.1314 **−0.8054 ***
ABBV: AbbVie returns; P.F.E.: Pfizer returns; SNY: Sanofi-Aventis returns; B.M.Y.: Bristol Myers Squibb returns; N.D.Q.: NASDAQ returns; V.I.X.: variation in V.I.X. ***, **, and * indicate the significance level at 1%, 5%, and 10%, respectively. N = 525. Period range: 6 February 2018–10 March 2020.
Table 6. Correlations in COVID-19 period.
ABBVPFESNYBMYNDQ
PFE0.3814 ***
SNY0.4537 ***0.3682 ***
BMY0.5535 ***0.4582 ***0.4989 ***
NDQ0.1991 **0.1428 *0.3413 ***0.2943 *
VIX−0.1824−0.0333−0.2034−0.2043−0.6806 ***
ABBV: AbbVie returns; P.F.E.: Pfizer returns; SNY: Sanofi-Aventis returns; B.M.Y.: Bristol Myers Squibb returns; N.D.Q.: NASDAQ returns; V.I.X.: variation in V.I.X. ***, **, and * indicate the significance level at 1%, 5%, and 10%, respectively. N = 525. Period range: 11 March 2020–8 April 2022.
Table 7. GARCH estimation results of the pre-COVID-19 period.
VariablesPFEABBVSNYBMY
Mean equation
NDQ−0.508889 *** (0.001)−0.867560 *** (0.000)0.900434 (0.969)0.286472 (0.623)
VIX0.478616 *** (0.002)0.912248 *** (0.000)−0.946093 (0.958)−0.339525 (0.556)
Cons0.063428 (0.210)−0.018592 (0.805)0.043838 (0.951)0.065490 (0.331)
Variance equation
ARCH0.274000 *** (0.008)0.109772 *** (0.008)0.062809 (0.953)0.112109 (0.117)
GARCH0.401499 ** (0.017)0.687397 *** (0.000)0.758429 (0.758)0.690571 *** (0.004)
Cons0.525725 ** (0.021)0.664713 (0.219)0.292078 (0.905)0.553076 (0.221)
Log likelihood−3199.831−3402.837−3812.941−4001.421
ABBV: AbbVie returns; P.F.E.: Pfizer returns; SNY: Sanofi-Aventis returns; B.M.Y.: Bristol Myers Squibb returns; N.D.Q.: NASDAQ returns; V.I.X.: variation in V.I.X.; ARCH: ARCH parameter; GARCH: GARCH parameter; Cons: constant. ***, **, and * indicate the significance level at 1%, 5%, and 10%, respectively. N = 525. Period range: 6 February 2018–10 March 2020.
Table 8. GARCH estimation results of COVID-19 period.
VariablesPFEABBVSNYBMY
Mean equation
NDQ0.028772 ** (0.042)0.086047 * (0.084)0.663199 ** (0.014)−0.789079 *** (0.000)
VIX−0.122574 *** (0.002)−0.167120 *** (0.004)−0.632366 ** (0.023)0.752947 *** (0.000)
Cons0.080188 (0.284)0.116328 ** (0.041)0.048130 (0.442)0.015724 (0.789)
Variance equation
ARCH0.116331 * (0.094)0.104036 *** (0.010)0.187057 * (0.098)0.193983 ** (0.030)
GARCH0.862238 *** (0.000)0.715255 *** (0.000)0.570756 ** (0.032)0.704331 *** (0.000)
Cons0.124692 * (0.096)0.309486 ** (0.036)0.441531 (0.176)0.211102 ** (0.021)
Log likelihood−3659.395−3508.136−3474.376−3479.747
ABBV: AbbVie returns; P.F.E.: Pfizer returns; SNY: Sanofi-Aventis returns; B.M.Y.: Bristol Myers Squibb returns; N.D.Q.: NASDAQ returns; V.I.X.: variation in V.I.X.; ARCH: ARCH parameter; GARCH: GARCH parameter; Cons: constant. ***, **, and * indicate the significance level at 1%, 5%, and 10%, respectively. N = 525. Period range: 11 March 2020–8 April 2022.
Table 9. GARCH estimation results of the pre-COVID-19 and COVID-19 periods using VIX index.
Pre-COVID-19 Period
VariablesPFEABBVSNYBMY
Mean equation
VIX−0.02634 * (0.064)0.10627 ** (0.041)−0.009662 * (0.074)−0.07538 *** (0.003)
Cons0.05723 (0.129)0.06958 (0.245)−0.017647 (0.693)0.01450 (0.789)
Variance equation
ARCH0.21660 *** (0.002)0.17566 *** (0.000)0.020890 * (0.093)0.21297 *** (0.000)
GARCH0.65373 *** (0.000)0.80602 *** (0.000)0.934983 *** (0.000)0.70639 *** (0.000)
Cons0.17282 *** (0.000)0.11513 ** (0.023)0.001589 (0.579)0.24310 *** (0.001)
AIC20.108
Bayes20.448
Shibata20.096
Hannan–Quinn20.241
COVID-19 period
VariablesPFEABBVSNYBMY
Mean equation
VIX−0.04619 * (0.088)−0.007466 * (0.058)−0.007978 ** (0.044)0.01221 * (0.071)
Cons0.06562 (0.252)0.097247 * (0.071)0.042130 (0.357)0.10797 ** (0.031)
Variance equation
ARCH0.13986 *** (0.000)0.125651 *** (0.000)0.171395 *** (0.000)0.18649 *** (0.000)
GARCH0.84147 *** (0.000)0.683916 *** (0.000)0.731286 *** (0.000)0.51831 *** (0.000)
Cons0.12445 *** (0.008)0.467369 *** (0.001)0.217272 *** (0.002)0.62730 *** (0.006)
AIC22.341
Bayes22.348
Shibata21.996
Hannan–Quinn22.441
***, **, and * indicate the significance level at 1%, 5%, and 10%, respectively.
Table 10. GARCH estimation results of the pre-COVID-19 and COVID-19 periods using NDQ index.
Pre-COVID-19 Period
VariablesPFEABBVSNYBMY
Mean equation
NDQ−0.618472 *** (0.000)0.183585 * (0.091)−0.523092 * (0.092)0.983515 *** (0.000)
Cons0.054749 (0.184)0.072782 (0.222)−0.010195 (0.830)0.011193 (0.474)
Variance equation
ARCH0.218808 ** (0.015)0.175059 ** (0.013)0.179780 *** (0.002)0.201315 ** (0.013)
GARCH0.656312 *** (0.000)0.805603 *** (0.000)0.766183 *** (0.000)0.724491 *** (0.000)
Cons0.169027 ** (0.050)0.117264 (0.140)0.001589 (0.579)0.225469 * (0.076)
AIC15.621
Bayes15.962
Shibata15.61
Hannan–Quinn15.754
COVID-19 period
VariablesPFEABBVSNYBMY
Mean equation
NDQ0.013923 *** (0.000)−0.960012 *** (0.000)−0.83317 *** (0.000)0.560708 (0.145)
Cons0.063889 (0.194)0.103076 * (0.052)0.043129 (0.345)0.108209 ** (0.037)
Variance equation
ARCH0.140458 ** (0.044)0.115052 *** (0.000)0.173346 ** (0.012)0.190921 ** (0.017)
GARCH0.841428 *** (0.000)0.703724 *** (0.000)0.731440 *** (0.000)0.504352 *** (0.007)
Cons0.124101 (0.127)0.440937 ** (0.023)0.214010 *** (0.002)0.647392 ** (0.023)
AIC17.158
Bayes17.421
Shibata17.152
Hannan–Quinn17.26
***, **, and * indicate the significance level at 1%, 5%, and 10%, respectively.
Table 11. Dynamic conditional correlation coefficient and contagion effect test.
DCCMeanVarianceWilcoxon
Pre-COVID-19 DCC PFIZER_NASDAQ0.4880.0041109 ***
COVID-19 DCC PFIZER_NASDAQ0.8760.001
Pre-COVID-19 DCC ABBVIE_NASDAQ0.1430.0042015 ***
COVID-19 DCC ABBVIE_NASDAQ0.4590.001
Pre-COVID-19 DCC SANOFI_NASDAQ0.1210.005775 ***
COVID-19 DCC SANOFI_NASDAQ0.6510.001
Pre-COVID-19 DCC BRYSTOL_NASDAQ0.2170.00540 ***
COVID-19 DCC BRYSTOL_NASDAQ0.5590.001
Pre-COVID-19 DCC PFIZER_VIX−0.1580.0021319 ***
COVID-19 DCC PFIZER_VIX0.4710.001
Pre-COVID-19 DCC ABBVIE_VIX−0.1940.0031356 ***
COVID-19 DCC ABBVIE_VIX0.1220.001
Pre-COVID-19 DCC SANOFI_VIX−0.1730.0011250 ***
COVID-19 DCC SANOFI_VIX0.1340.004
Pre-COVID-19 DCC BRYSTOL_VIX−0.1350.0021384 ***
COVID-19 DCC BRYSTOL_VIX0.140.002
Note: Pre-COVID-19 period is from 6 February 2018 to 10 March 2020. The COVID-19 period is from 11 March 2020 to 8 April 2022. The entire period is from 6 February 2018 to 8 April 2022. ***, **, and * indicate the significance level at 1%, 5%, and 10%, respectively.
Disclaimer/Publisher’s Note: The statements, opinions and data contained in all publications are solely those of the individual author(s) and contributor(s) and not of MDPI and/or the editor(s). MDPI and/or the editor(s) disclaim responsibility for any injury to people or property resulting from any ideas, methods, instructions or products referred to in the content.

